Article Text

Abstract
Background Fatty acid translocase CD36 (FAT/CD36) mediates uptake and intracellular transport of long-chain fatty acids in diverse cell types. While the pathogenic role of FAT/CD36 in hepatic steatosis in rodents is well-defined, little is known about its significance in human liver diseases.
Objective To examine the expression of FAT/CD36 and its cellular and subcellular distribution within the liver of patients with non-alcoholic fatty liver disease (NAFLD) and chronic hepatitis C virus (HCV) infection.
Patients 34 patients with non-alcoholic steatosis (NAS), 30 with non-alcoholic steatohepatitis (NASH), 66 with HCV genotype 1 (HCV G1) and 32 with non-diseased liver (NL).
Methods Real-time PCR and western blot analysis were used to assess hepatic FAT/CD36 expression. Computational image analysis of immunostained liver biopsy sections was performed to determine subcellular distribution and FAT/CD36 expression index.
Results Compared with NL, hepatic mRNA and protein levels of FAT/CD36 were significantly higher in patients with NAS (median fold increase 0.84 (range 0.15–1.61) and 0.66 (range 0.33–1.06), respectively); NASH (0.91 (0.22–1.81) and 0.81 (0.38–0.92), respectively); HCV G1 without steatosis (0.30 (0.17–1.59) and 0.33 (0.29–0.52), respectively); and HCV G1 with steatosis (0.85 (0.15–1.98) and 0.87 (0.52–1.26), respectively). In contrast to NL, FAT/CD36 was predominantly located at the plasma membrane of hepatocytes in patients with NAFLD and HCV G1 with steatosis. A significant correlation was observed between hepatic FAT/CD36 expression index and plasma insulin levels, insulin resistance (HOMA-IR) and histological grade of steatosis in patients with NASH (r=0.663, r=0.735 and r=0.711, respectively) and those with HCV G1 with steatosis (r=0.723, r=0.769 and r=0.648, respectively).
Conclusions Hepatic FAT/CD36 upregulation is significantly associated with insulin resistance, hyperinsulinaemia and increased steatosis in patients with NASH and HCV G1 with fatty liver. Translocation of this fatty acid transporter to the plasma membrane of hepatocytes may contribute to liver fat accumulation in patients with NAFLD and HCV.
- Fatty acids
- fatty acid transporters
- nonalcoholic fatty liver disease
- hepatitis C virus
- insulin
- fatty liver
- hepatitis C
- nonalcoholic steatohepatitis
Statistics from Altmetric.com
- Fatty acids
- fatty acid transporters
- nonalcoholic fatty liver disease
- hepatitis C virus
- insulin
- fatty liver
- hepatitis C
- nonalcoholic steatohepatitis
Significance of this study
What is already known about this subject?
Fatty acid translocase CD36 (FAT/CD36) is the best characterised free fatty acid transporter.
FAT/CD36 plays a key role in the hepatic steatosis set-up in rodents.
Little is known about the significance of FAT/CD36 in human liver diseases.
What are the new findings?
Hepatic FAT/CD36 expression is abnormally increased in non-alcoholic fatty liver disease (NAFLD).
In patients with chronic hepatitis C virus (HCV) infection, FAT/CD36 is largely overexpressed in those with steatosis.
FAT/CD36 is predominantly located at the plasma membrane of hepatocytes in patients with NAFLD and HCV with steatosis.
Hepatic FAT/CD36 upregulation is significantly associated with insulin resistance, hyperinsulinaemia and increased steatosis in patients with NAFLD and HCV with fatty liver.
How might it impact on clinical practice in the foreseeable future?
Modulating FAT/CD36 expression and/or translocation to the plasma membrane of hepatocytes could be useful for the prevention/treatment of liver fat accumulation and its deleterious consequences on the outcome of NAFLD and chronic HCV infection.
Introduction
Non-alcoholic fatty liver disease (NAFLD) and chronic hepatitis C virus (HCV) infection are the most prevalent causes of chronic liver disease in developed countries.1 2 NAFLD comprises a wide spectrum of histological findings ranging from simple steatosis to steatohepatitis with progressive fibrosis. Liver disease induced by persistent HCV infection encompasses conditions ranging from chronic hepatitis, with or without steatosis, to cirrhosis and hepatocellular carcinoma. Although diverse factors play a role in the pathogenesis of hepatic steatosis—exclusively metabolic in NAFLD3 and both metabolic and viral genotype-specific in HCV-infected patients4 5—the increased mobilisation and transport of free fatty acids (FFAs) flux from insulin-resistant adipose tissue to the liver should be the first essential step in the accumulation of fat as triglyceride (TG) in the hepatocytes.6 In this regard, it has been shown that circulating FFAs are the major source of hepatic lipids in patients with fatty liver,7 suggesting that the rate of influx of FFAs to the hepatocytes may have a relevant role in the process of fat deposition within the liver cells.
It is well known that FFAs are taken up into cells by passive diffusion and by protein-mediated mechanisms involving a number of fatty acid transporters, of which the fatty acid translocase CD36 (FAT/CD36) is the best characterised.8 First identified on platelets as an 88 kDa thrombospondin-1 and collagen receptor, FAT/CD36 is expressed in a wide variety of cells including macrophages, adipocytes, myocytes, enterocytes and hepatocytes, among others.9 It is now clear that FAT/CD36 plays an important role in facilitating uptake and intracellular trafficking of FFAs as well as esterification into TGs in heart and skeletal muscle cells,10 and this function is largely dependent on its translocation from intracellular depots to the plasma membrane.11 Insulin, muscular contraction and the forkhead transcription factor FoxO1 induce FAT/CD36 translocation and enhance FFA uptake,12–14 but the detailed signalling pathways regulating FAT/CD36 expression and function are still unclear.
Hepatic FAT/CD36 expression is normally weak, but its expression is enhanced in rodents with fatty liver.15 Moreover, we and others have demonstrated that FAT/CD36 mRNA levels increased concomitantly with hepatic TG content in different animal models of liver steatosis.16 17 Interestingly, experimental attenuation of steatosis in mice was accompanied by reduced hepatic FAT/CD36 mRNA levels,18 19 and further studies showed that FAT/CD36 is a common gene target of liver X receptor, pregnane X receptor and peroxisome proliferator-activated receptor-γ in promoting hepatic steatosis in a murine model,20 reinforcing the key role of this FFA transporter in the steatosis set-up in rodents.21
Notwithstanding this, little is known about the significance of FAT/CD36 in human liver diseases. To date, only two studies in morbidly obese patients with NAFLD have been reported. Greco et al showed that hepatic FAT/CD36 mRNA levels were positively related to liver fat content,22 and Bechmann et al found a significant correlation between hepatic FAT/CD36 mRNA and apoptosis in patients with non-alcoholic steatohepatitis.23 However, the expression level and distribution of this FFA transporter within the liver and its impact on NAFLD and chronic HCV infection are still unknown. We therefore aimed to quantify the expression of FAT/CD36 at the mRNA and protein levels, and to determine its cellular and subcellular distribution in the liver of patients with NAFLD (subdivided into simple steatosis (NAS) and definite steatohepatitis (NASH)) and those with HCV genotype 1 (HCV G1), with or without concomitant steatosis, in order to identify potential correlations between the hepatic expression level of FAT/CD36 and metabolic and histological features of steatosis associated with NAFLD and chronic HCV G1 infection.
Methods
Patients
This study comprised 130 non-diabetic patients with a clinical diagnosis of either NAFLD or chronic HCV infection who underwent a liver biopsy for diagnostic purposes. Inclusion criteria for patients with NAFLD were based on the absence of alcohol intake, the presence of biopsy-proven steatosis with or without necroinflammation and/or fibrosis, and a negative anti-HCV serum test. Patients with chronic HCV infection were included if they had serum anti-HCV and HCV RNA, persistently abnormal serum alanine aminotransferase (ALT) levels, liver histology findings compatible with chronic hepatitis and an alcohol consumption of <20 g/day. Since it is well known that HCV genotype 3 is directly steatogenic5 and in order to avoid bias depending on HCV genotype, all patients with HCV included in this study were infected by genotype 1. Patients with other potential causes of chronic liver disease or those receiving drug treatment for any chronic medical disorder were excluded.
We further studied 32 patients with asymptomatic cholelithiasis in whom a liver biopsy was taken during programmed laparoscopic cholecystectomy. All had histologically normal liver (NL), normal fasting glucose, cholesterol and TGs, normal serum aminotransferase levels and no evidence of viral infections (hepatitis B virus, HCV and HIV). In addition, none of these patients consumed >20 g alcohol per day or used potentially hepatotoxic drugs.
The study was performed in agreement with the Declaration of Helsinki and with local and national laws. The Human Ethics Committee of the respective hospitals approved the study procedures and written informed consent was obtained from all patients before inclusion in the study.
Clinical and laboratory assessment
After a 12 h overnight fast, clinical and anthropometric data as well as venous blood samples were obtained from each patient at the time of liver biopsy. Plasma insulin was determined by a chemiluminescent microparticle immunoassay (ARCHITECT insulin; Abbot Park, Illinois, USA). Insulin resistance was calculated by the homeostasis model assessment (HOMA-IR).24
Antibodies against HCV and HIV as well as hepatitis B surface antigen were tested by immunoenzymatic assays (Murex, Dartford, UK). HCV RNA levels were quantified by real-time PCR (COBAS AmpliPrep/COBAS TaqMan HCV test, Roche Diagnostics, Branchburg, New Jersey, USA). HCV genotyping was performed using a second-generation line probe hybridisation assay (HCV genotype 2.0 assay (LiPA), Roche Diagnostics).
Liver tissue studies
Histopathology assessment
Paraffin-embedded liver biopsy sections were evaluated by a single hepatopathologist (JV-C) blinded to the clinical data. Steatosis was assessed as outlined by Brunt et al,25 and the Kleiner histological scoring system26 was used to evaluate the degree of hepatocellular ballooning and lobular inflammation as well as the stage of fibrosis in NAFLD. These patients were classified into two groups: those with simple steatosis (NAS) and those with definite steatohepatitis (NASH). In the HCV group, the grade of necroinflammation and the stage of fibrosis were scored as proposed by Scheuer.27 Patients with HCV were categorised into two groups, depending on the presence of steatosis.
Quantitative real-time PCR
Total RNA was obtained from all liver biopsy samples using a Trizol reagent (Life Technologies, Carlsbad, California, USA). First-standard cDNA was synthesised using High-Capacity cDNA Archive Kit (Applied Biosystems, Weiterstadt, Germany) and amplified using multiplex real-time PCR reactions on a StepOne Plus (Applied Biosystems). TaqMan primers and probes were derived from commercially available TaqMan Gene Expression Assays (Applied Biosystems) as follows: FAT/CD36 (GenBank accession No. NM_001001547.2 and Hs01567186_m1) and 18S rRNA ( GenBank accession No. X03205.1 and 4319413E).
Relative changes in gene expression levels were determined using the 2-ΔΔCT method. The cycle number at which the transcripts were detectable (CT) was normalised to the cycle number of 18S rRNA detection, referred to as ΔCT. PCR efficiency was determined by TaqMan analysis on a standard curve for target and endogenous control amplifications which were highly similar (FAT/CD36 median efficiency, 103.8%; 18S rRNA median efficiency, 95.5%).
Western blot analysis
Protein extraction from all liver biopsy samples and western blotting were performed as described previously.28 Briefly, membranes were probed with a rabbit polyclonal antibody, raised against amino acids 1–300 of FAT/CD36 of human origin (sc-9154, Santa Cruz Biotechnology, Santa Cruz, California, USA), which yields a specific band of 88 kDa in human cell lysates.29 Bound primary antibody was detected with peroxidase-conjugated polyclonal goat anti-rabbit immunoglobulins (Dako, Glostrup, Denmark). Equal loading of the gels was demonstrated by probing the membranes with an anti-β-actin polyclonal antibody (Sigma-Aldrich, St Louis, Missouri, USA). Blots were developed using an enhanced chemiluminescence kit (GE Healthcare, Little Chalfont, UK) and the immunoblots were then quantified by densitometry and normalised against β-actin.
In order to check the specificity of the polyclonal antibody (sc-9154), immunoblot experiments were performed in cell lysates from human peripheral blood mononuclear cells (PBMCs), human umbilical vein endothelial cells (HUVECs), human melanoma cells (A357 cell line) and human hepatoblastoma cells (HepG2 cell line). Since it is well known that FAT/CD36 is expressed in human monocytes,30 we considered PBMC as our internal positive control. As expected, a specific 88 kDa band was detected in PBMC. In addition, a more intense 88 kDa band was observed in A357 cells, whereas a weaker 88 kDa band was evident in both HUVEC and HepG2 cells (see figure 1A in online supplement).
Immunohistochemistry
Immunostaining was performed on formalin-fixed paraffin-embedded liver biopsy sections from all patients of each group. Paraffin sections were cut at 4 μm thickness and placed onto positively charged capillary gap microscope slides. Deparaffinisation in xylene and hydration through graded alcohols was followed by heat-induced epitope retrieval. The slides were boiled in a microwave oven for 10 min in 10 mM buffer citrate, pH 6.0 (ChemMate Target Retrieval Solution, Dako) and then left in the buffer for 20 min at room temperature. Preparations were incubated overnight with the primary rabbit antibody sc-9154 (Santa Cruz Biotechnology) diluted to 1:250 at room temperature in humid chambers. As secondary antibody, a biotinylated goat anti-rabbit polyclonal was applied, followed by peroxidase-conjugated streptavidin (ChemMate detection kit, Dako). Finally, the slides were developed in DAB (ChemMate detection kit, Dako) and counterstained in haematoxylin. In parallel, liver tissue sections incubated with rabbit immunoglobulins (Dako) as primary antibody at a working dilution of 1:250 were considered as negative controls. In order to test the specificity and suitability of the primary antibody used for immunohistochemistry, we performed immunostaining experiments in which the primary antibody (sc-9154) was preincubated with the target protein (human FAT/CD36 recombinant protein, Novus Biologicals, Littleton, Colorado, USA) or control protein (human CD105 recombinant protein, Novus Biologicals) prior to incubation on liver tissue sections from patients with NASH. The preincubation took place overnight and the antibody:protein ratio was 1:5 (w/w), as previously validated.31
Computational image analysis
The area of liver tissue occupied by FAT/CD36-positive cells was measured using a high-resolution digital videocamera (Nikon DXM 1200, Tokyo, Japan) connected to a light microscope (Nikon Eclipse E400) equipped with a planApocromatic 20× objective (Nikon). All immunostained liver biopsy sections were first coded and then evaluated by an expert in liver immunohistochemistry (CG-M). Image analysis procedures were then performed with the analySIS software (Soft Imaging System Gmbh, Münster, Germany). Values were obtained in six different lobular areas where hepatocytes are the predominant cell type. The average value was considered as the FAT/CD36 expression index for each liver biopsy sample and expressed as the percentage of liver tissue area occupied by FAT/CD36-expressing cells.
Statistical analysis
Categorical variables are presented as frequency and percentage, continuous variables are shown as median and range. The baseline characteristics of the patients studied were compared using the Pearson χ2 test for categorical variables and the unpaired t test or Mann–Whitney U test for continuous variables. Data from qPCR, western blotting and immunohistochemical analysis are shown as median and range, and were compared using the Kruskal–Wallis ANOVA test. The Spearman test was used to evaluate correlations. All statistical analyses were performed using SPSS Version 15.0 software with two-sided tests; a p value of <0.05 was considered statistically significant.
Results
Patient characteristics
The characteristics of the patients with NAFLD and HCV G1 are shown in tables 1 and 2, respectively.
Demographic, metabolic, biochemical, viral and histological characteristics of patients with normal liver and those with non-alcoholic fatty liver disease
Demographic, metabolic, biochemical, viral and histological characteristics of patients with chronic hepatitis C virus infection
FAT/CD36 gene expression is abnormally increased in the liver of patients with NAFLD and HCV G1
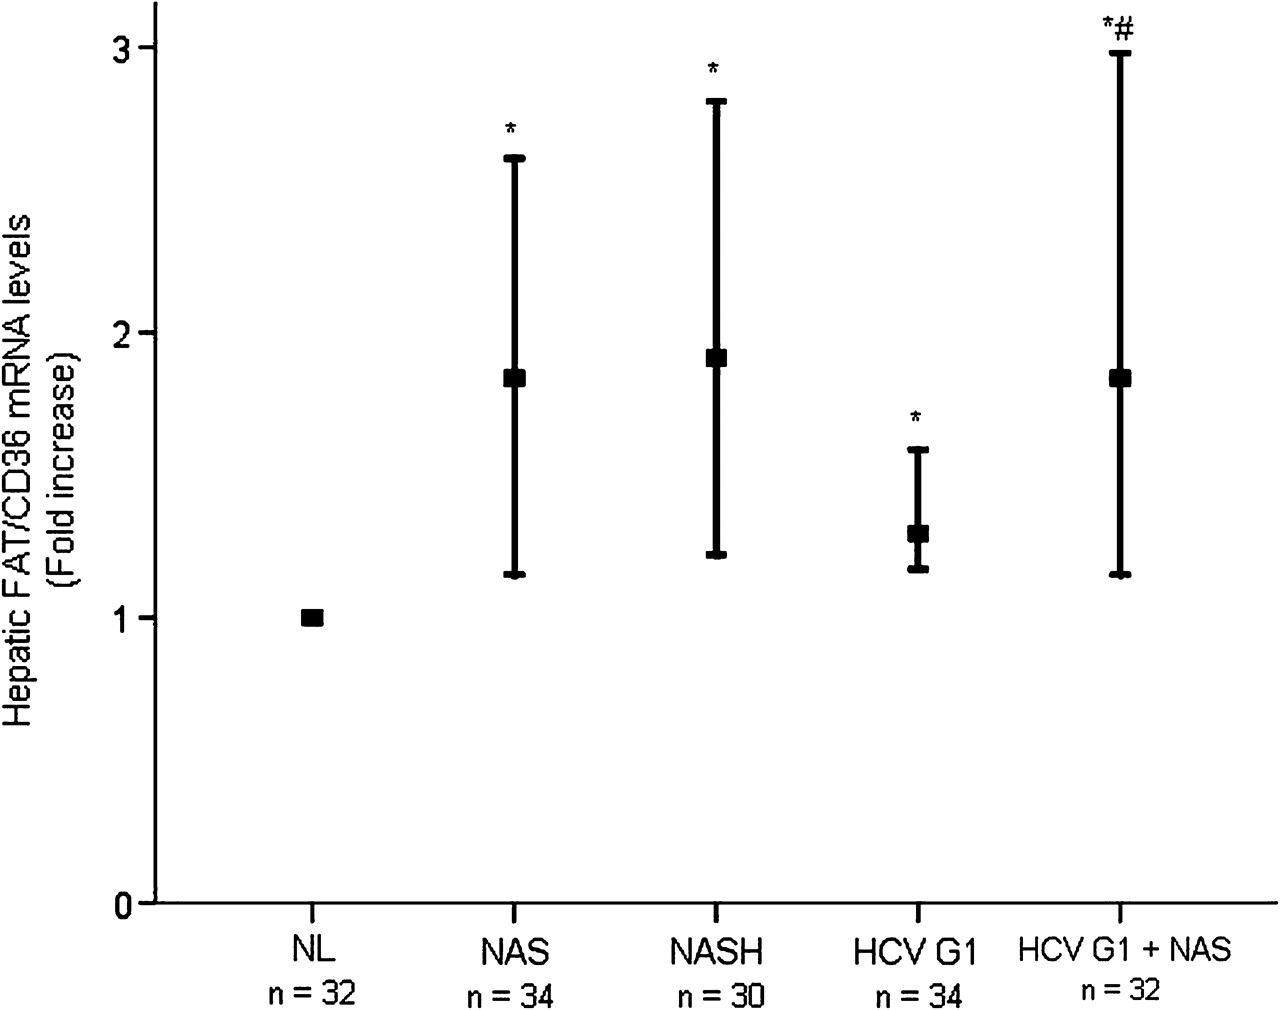
When compared with NL, considering FAT/CD36 mRNA expression levels in NL as 1.0, hepatic mRNA levels of FAT/CD36 were significantly higher in patients with NAS (median fold increase 0.84 (range 0.15–1.61), p<0.001) and NASH (median fold increase 0.91 (range 0.22–1.81), p<0.001) (figure 1). The expression of FAT/CD36 transcripts was also significantly increased in the liver of patients with HCV G1 without steatosis (median fold increase 0.30 (range 0.17–1.59), p<0.001) and in those with steatosis (median fold increase 0.85 (range 0.15–1.98), p<0.001). It was noteworthy that hepatic FAT/CD36 mRNA levels were similar in patients with NAS and those with NASH (p=0.355), but they were significantly higher in patients with HCV G1 with steatosis than in those without (p=0.004).

Hepatic FAT/CD36 mRNA levels are abnormally increased in patients with NAFLD and HCV G1. Thick horizontal bars crossing vertical ones show the median fold increase in hepatic mRNA levels in liver biopsies from distinct patient groups with respect to NL (normalised value, 1.0). Vertical bars represent the range of values. *p<0.001 vs NL; #p=0.004 vs HCV G1. FAT/CD36, fatty acid translocase CD36; HCV G1, hepatitis C virus genotype 1; HCV G1+NAS, hepatitis C virus genotype 1 with non-alcoholic steatosis; NAS, non-alcoholic steatosis; NASH, non-alcoholic steatohepatitis; NL, normal liver.
Hepatic content of FAT/CD36 protein is significantly higher in patients with NAFLD and HCV G1 than in normal liver
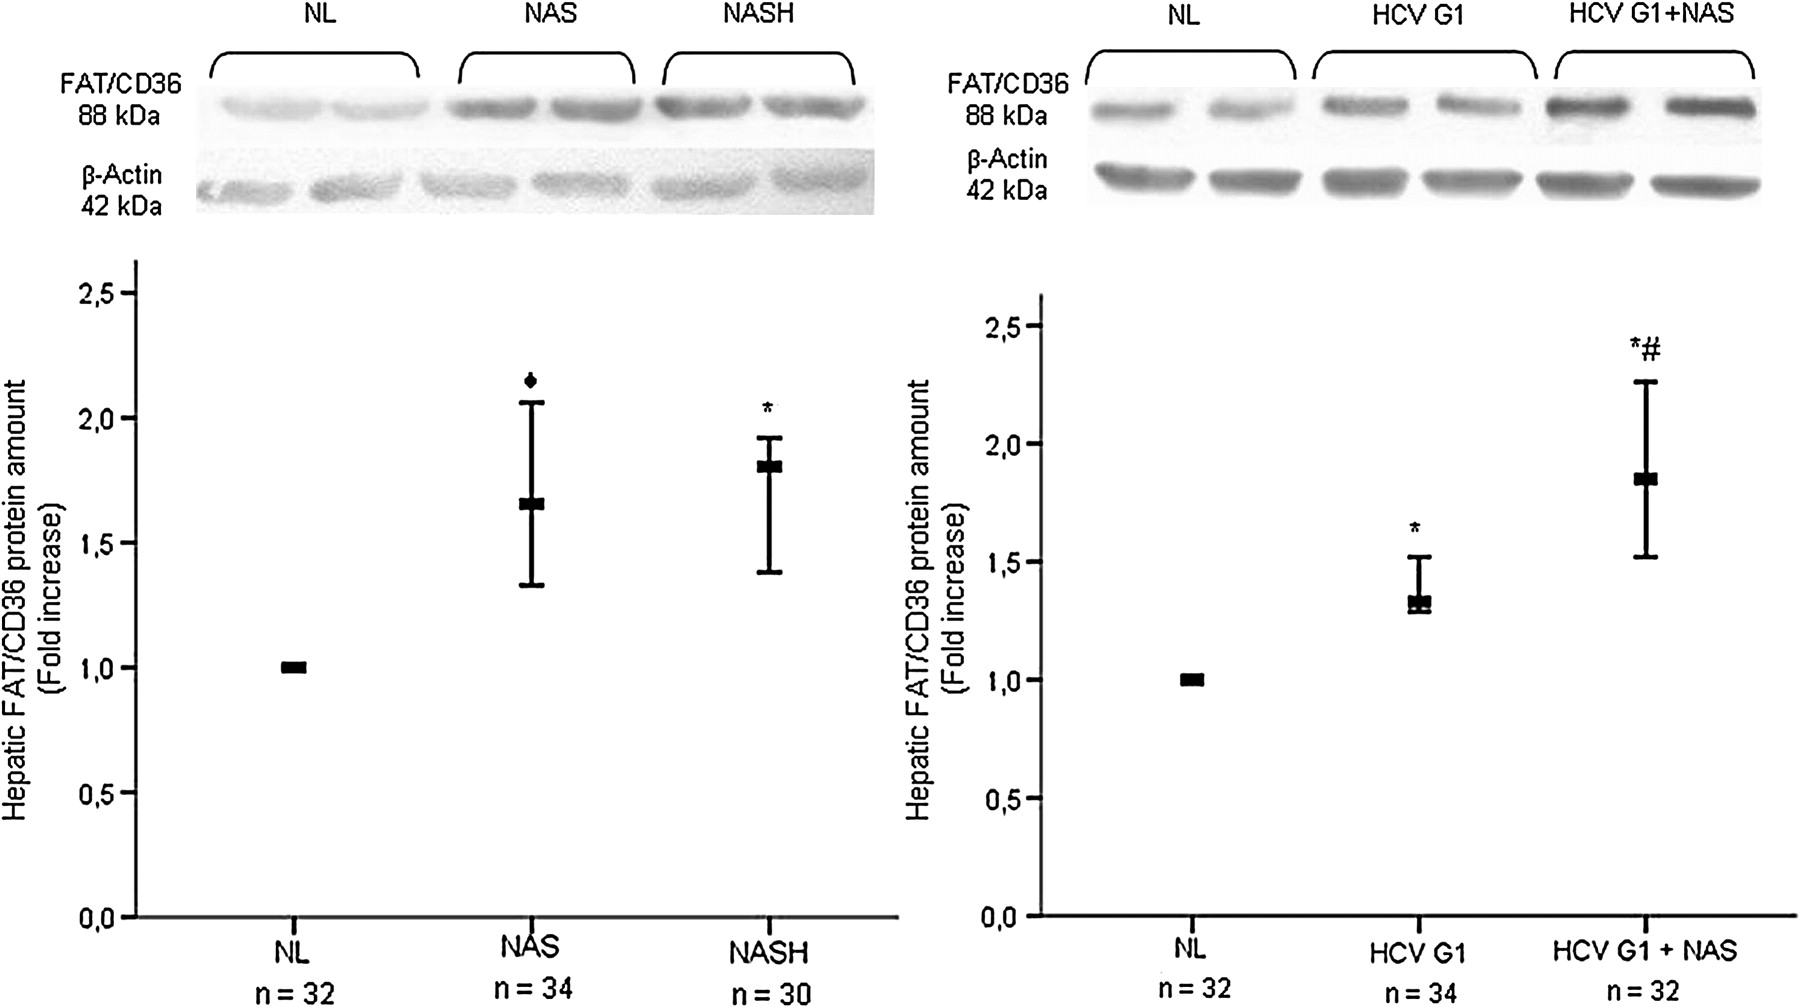
With respect to NL, considering FAT/CD36 protein amounts in NL as 1.0, a significant increase in the hepatic protein content of FAT/CD36 was found in patients with NAFLD with NAS (median fold increase 0.66 (range 0.33–1.06), p=0.001) and in patients with NASH (median fold increase 0.81 (range 0.38–0.92), p<0.001), as well as in patients HCV G1 without steatosis (median fold increase 0.33 (range 0.29–0.52), p<0.001) and those with steatosis (median fold increase 0.87 (range 0.52–1.26), p<0.001) (figure 2). Interestingly, no significant differences were found in the hepatic abundance of FAT/CD36 protein in patients with NAS and NASH (p=0.681), but it was significantly higher in patients with HCV G1 with steatosis than in those without (p=0.002).

An excess of FAT/CD36 protein is found in the liver of patients with NAFLD and HCV G1. Upper panels: representative western blotting showing the specific band of FAT/CD36 in each patient group. Lower panels: immunoblots were quantified by densitometry and normalised against β-actin as a control for protein loading. Thick horizontal bars crossing vertical ones show the median fold increase in the amount of hepatic protein in liver biopsies from distinct patient groups with respect to NL (normalised value, 1.0). Vertical bars represent the range of values. ◆p=0.001 vs NL; *p<0.001 vs NL; #p=0.002 vs HCV G1. FAT/CD36, fatty acid translocase CD36; HCV G1, hepatitis C virus genotype 1; HCV G1+NAS, hepatitis C virus genotype 1 with non-alcoholic steatosis; NAS, non-alcoholic steatosis; NASH, non-alcoholic steatohepatitis; NL, normal liver.
FAT/CD36 is predominantly expressed at the plasma membrane of hepatocytes in patients with NAFLD and in those with HCV G1 with steatosis
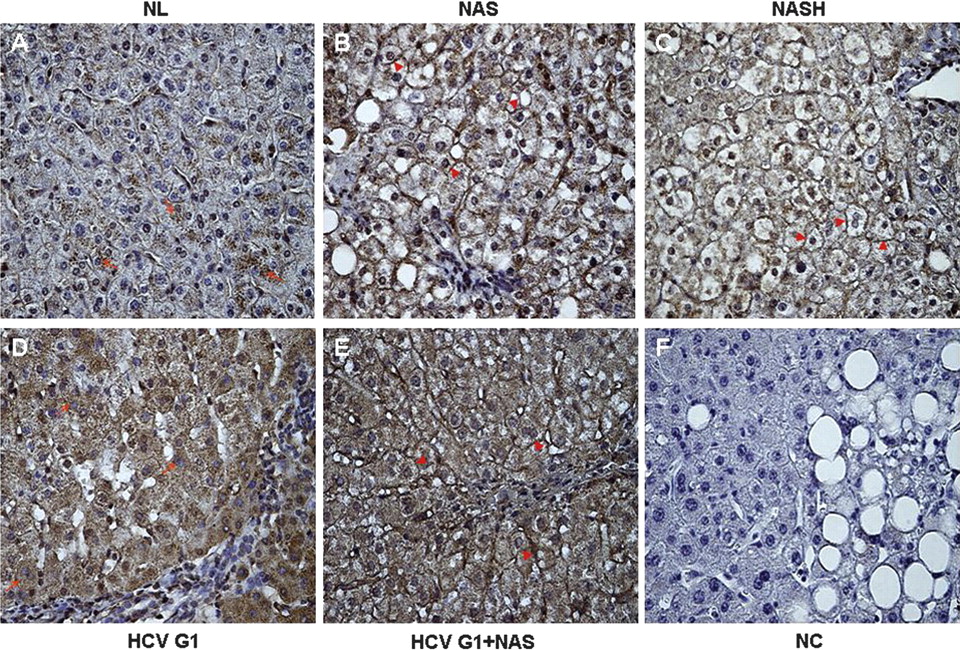
In liver biopsies from NL subjects, FAT/CD36 was weakly expressed in the cytoplasm of some scattered hepatocytes (figure 3A). However, in patients with NAS and NASH we observed that FAT/CD36 was predominantly expressed at the plasma membrane of numerous hepatocytes (figure 3B,C). On the other hand, in patients with HCV G1 without steatosis, FAT/CD36 expression was mainly observed in the cytoplasm of hepatocytes, which showed a diffuse cytoplasmic staining (figure 3D), whereas FAT/CD36 immunoreactivity was largely detected at the plasma membrane of hepatocytes in patients with HCV G1 with steatosis (figure 3E). Interestingly, in patients with NAFLD and in those with HCV G1 with steatosis, FAT/CD36 expression was similarly observed on the plasma membrane of both steatotic and non-steatotic hepatocytes. Negative controls showed that immunostaining was minimal or absent when liver biopsy sections were incubated with rabbit immunoglobulins (figure 3F). In addition, preincubation of the primary antibody with the control protein did not substantially change the immunostaining pattern shown in figure 3, whereas immunoreactivity was completely reduced when the primary antibody was preincubated with the target protein, supporting its specificity (see figure 1B in online supplement).

Altered subcellular distribution of FAT/CD36 in hepatocytes of patients with NAFLD and HCV G1. (A) In NL, FAT/CD36 is weakly expressed in the cytoplasm of some hepatocytes (red arrows). In contrast, FAT/CD36 staining is predominantly detected at the plasma membrane of numerous hepatocytes (red arrowheads) in (B) patients with NAS and (C) patients with NASH. In (D) patients with HCV G1 without steatosis, FAT/CD36 expression was mainly observed in the cytoplasm of hepatocytes (red arrows) whereas FAT/CD36 staining was largely detected at the plasma membrane of hepatocytes (red arrowheads) in (E) patients with HCV G1 with steatosis. Noteworthy, FAT/CD36 expression was similarly observed on the plasma membrane of both steatotic and non-steatotic hepatocytes. (F) Negative controls showed that immunostaining was minimal or absent when liver biopsy sections were incubated with rabbit immunoglobulins. This panel shows an example of NC in a liver biopsy with NAS. Original magnification for all microphotographs 400×. HCV G1, hepatitis C virus genotype 1; HCV G1+NAS, hepatitis C virus genotype 1 with non-alcoholic steatosis; NAS, non-alcoholic steatosis; NASH, non-alcoholic steatohepatitis; NC, negative control; NL, normal liver.
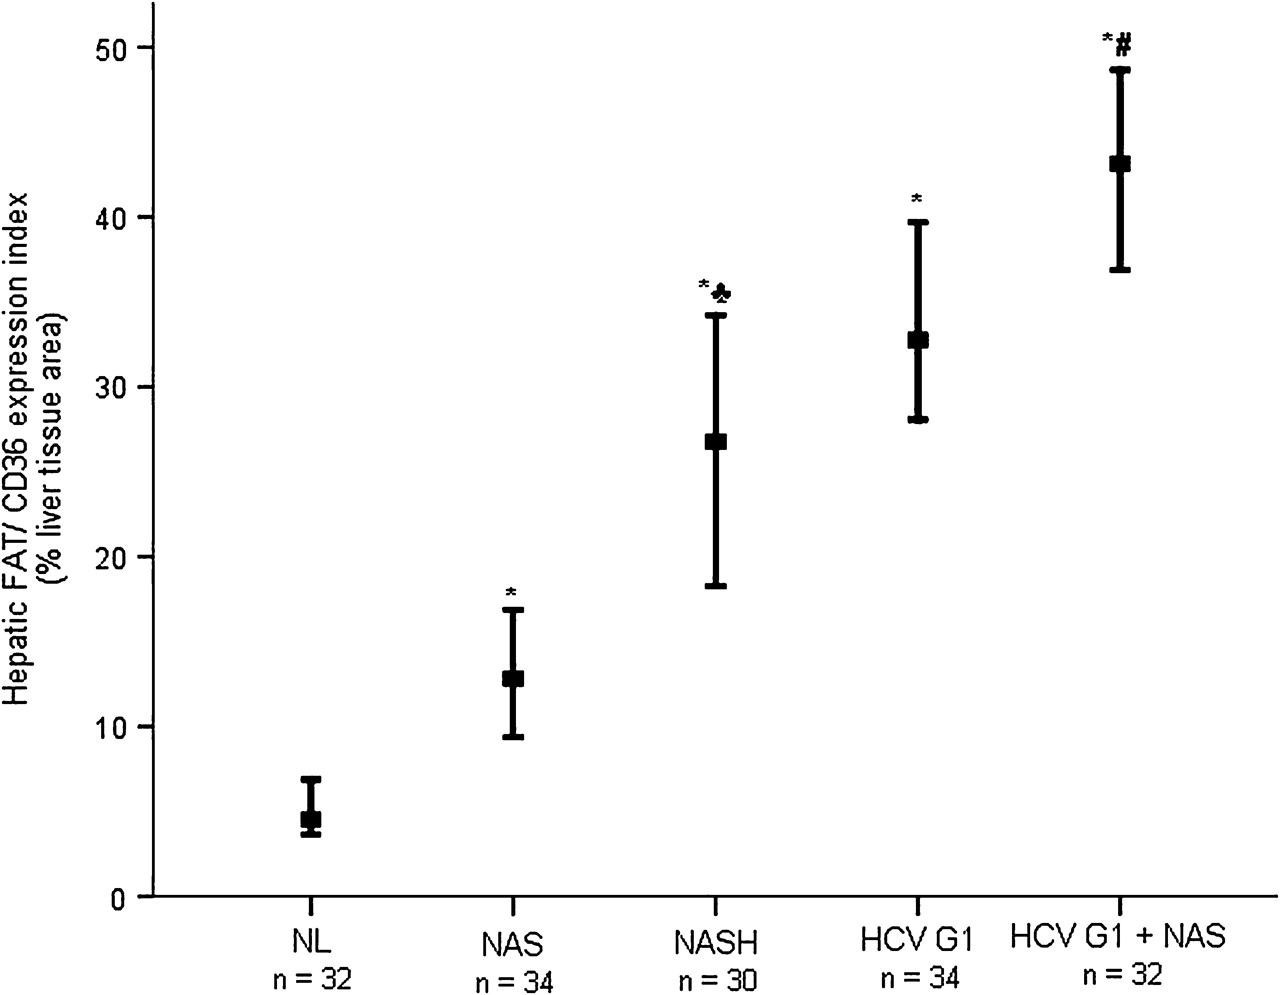
We then quantified the hepatic FAT/CD36 expression index by measuring the percentage of liver tissue area occupied by FAT/CD36-expressing cells, as previously described. As shown in figure 4, computer-assisted image analysis of immunostained liver biopsy sections showed that, in patients with NAFLD, the hepatic FAT/CD36 expression index was significantly higher in those with NASH (median 26.77% (range 18.26–34.23%)) and NAS (12.82% (9.36–16.89%)) than in patients with NL (4.54% (3.66–6.87%)) (both p<0.001). On the other hand, when compared with NL the hepatic FAT/CD36 expression index was also significantly increased in patients with HCV G1 without steatosis (32.76% (28.06–40.24%), p<0.001) and in patients with HCV G1 with steatosis (43.14% (36.89–48.66%), p<0.001). It was noteworthy that hepatic FAT/CD36 expression index was significantly higher in patients with NASH than in those with NAS (p<0.001), and in patients with HCV G1 with steatosis than in those without (p<0.001).

Increased hepatic FAT/CD36 expression index in patients with NAFLD and HCV G1. Values represent the percentage of liver tissue area (lobular) occupied by FAT/CD36-expressing cells. Thick horizontal bars crossing vertical ones show the median hepatic FAT/CD36 expression index in liver biopsies from distinct patient groups. Vertical bars represent the range of values. *p<0.001 vs NL; ♣p<0.001 vs NAS; #p<0.001 vs HCV G1. FAT/CD36, fatty acid translocase CD36; HCV G1, hepatitis C virus genotype 1; HCV G1+NAS, hepatitis C virus genotype 1 with non-alcoholic steatosis; NAS, non-alcoholic steatosis; NASH, non-alcoholic steatohepatitis; NL, normal liver.
Hepatic FAT/CD36 expression index correlates with metabolic parameters and the histological grade of steatosis in patients with NASH and HCV G1
Finally, we wanted to elucidate whether hepatic FAT/CD36 expression might be related to some metabolic disorders that are risk factors for the development of steatosis, such as obesity and insulin resistance. Thus, in patients with NASH we found a positive correlation between the hepatic FAT/CD36 expression index and plasma insulin levels (r=0.663, p<0.001), HOMA-IR score (r=0.735, p<0.001) and the histological grade of steatosis (r=0.711, p<0.001), whereas no correlation was found with body mass index (r=0.229, p=0.223, figure 5). Likewise, in patients with NAS, no correlation was found between hepatic FAT/CD36 expression index and body mass index (r=0.176, p=0.319) whereas a positive correlation was found with plasma insulin (r=0.732, p<0.001) and HOMA-IR score (r=0.775, p<0.001) (see figure 2 in online supplement). Since all patients with NAS had mild steatosis (grade 1), no correlation analysis with the histological grade of steatosis was possible. However, in order to understand further the relative impact of steatosis and insulin resistance on hepatic FAT/CD36 overexpression in this group of patients who had the same histological grade of steatosis, we compared the hepatic FAT/CD36 expression index in patients with NAS with insulin resistance (HOMA ≥2) and those without insulin resistance (HOMA-IR <2). The hepatic FAT/CD36 expression index was found to be significantly higher in patients with NAS with insulin resistance (n=9; median 16.31% (range 15.79–16.89%)) than in those without (n=25; 12.57% (9.36–16.44%), p<0.001) (see figure 3 in online supplement).

Positive correlation between hepatic FAT/CD36 expression index and plasma insulin levels, HOMA-IR score and the histological grade of steatosis in patients with NASH. Correlation analysis was carried out using the Spearman test comparing paired variables from each patient included in the NASH cohort (n=30). FAT/CD36, fatty acid translocase CD36; HOMA-IR, homeostatic model assessment-insulin resistance; NASH, non-alcoholic steatohepatitis.
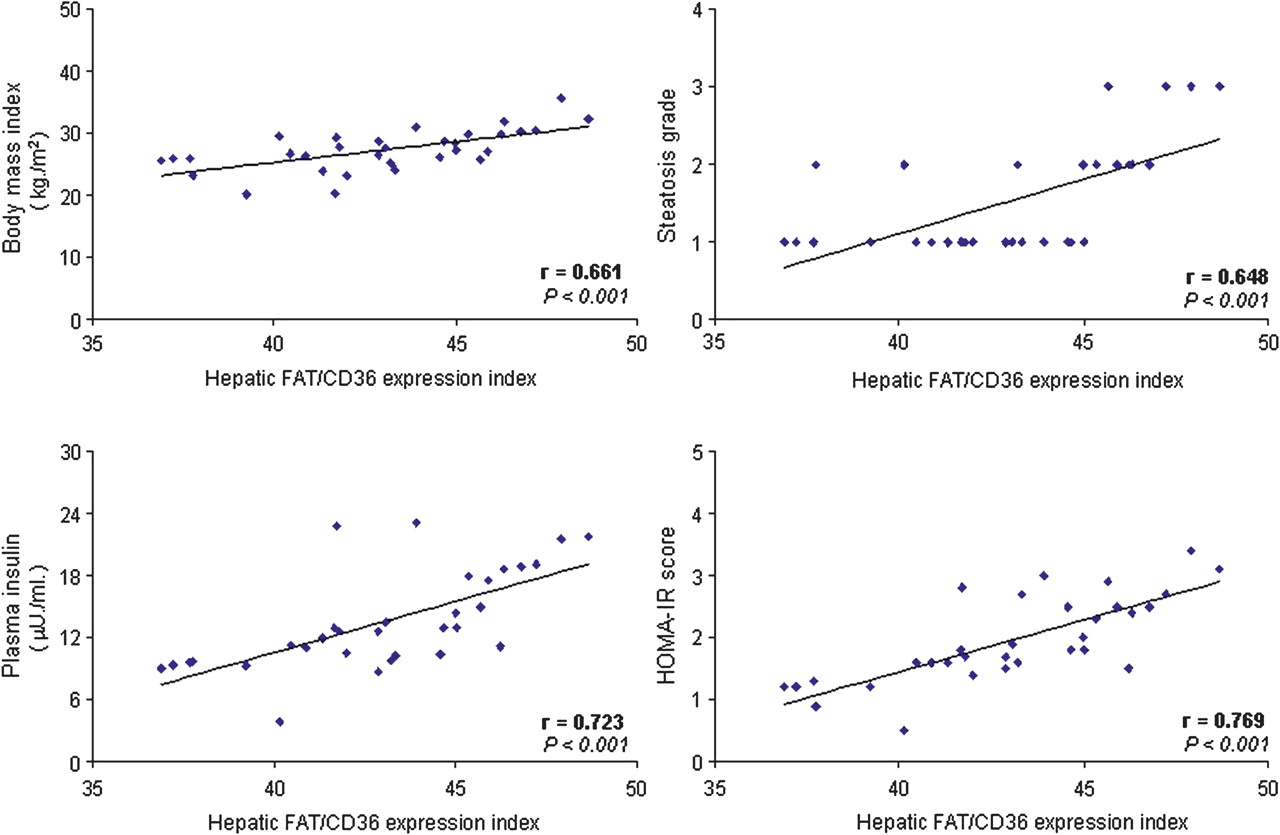
In patients with HCV G1 a positive correlation was found between hepatic FAT/CD36 expression index and body mass index, plasma insulin and HOMA-IR score in those with steatosis (r=0.661, p<0.001; r=0.723, p<0.001; and r=0.769, p<0.001, respectively; figure 6) and, to a lesser extent, in those without steatosis (r=0.342, p=0.048; r=0.446, p=0.008; and r=0.653, p<0.001, respectively) (see figure 4 in online supplement). In addition, in patients with HCV G1 with steatosis, the hepatic FAT/CD36 expression index correlated significantly with the histological grade of steatosis (r=0.648, p<0.001; figure 6).

Positive correlation between hepatic FAT/CD36 expression index and body mass index, plasma insulin levels, HOMA-IR score and the histological grade of steatosis in patients with HCV G1 with steatosis. Correlation analysis was carried out using the Spearman test comparing paired variables from each patient included in the HCV G1+NAS cohort (n=32). FAT/CD36, fatty acid translocase CD36; HCV G1+NAS, hepatitis C virus genotype 1 with non-alcoholic steatosis; HOMA-IR, homeostatic model assessment-insulin resistance.
Discussion
The present study not only demonstrates that hepatic mRNA and protein levels of FAT/CD36 are abnormally increased in patients with NAFLD and HCV G1, but it also provides evidence that this FFA translocase is predominantly expressed on the plasma membrane of hepatocytes in patients with NAFLD and HCV G1 with steatosis. In addition, we found a positive correlation between the hepatic FAT/CD36 expression index and plasma insulin levels, HOMA-IR score and the histological grade of steatosis in patients with NASH and those with HCV G1 with concomitant fatty liver.
We are not aware of any studies that have examined the hepatic expression profile of FAT/CD36 at the mRNA and protein levels in patients with NAFLD subdivided into those with NAS and those with NASH, or in patients with HCV G1 with and without steatosis. It is worth noting that Greco et al22 found in 10 obese patients with NAS (five with low liver fat and five with high liver fat) that hepatic FAT/CD36 mRNA levels were higher in the patients with a high liver fat content. Moreover, increased hepatic FAT/CD36 mRNA levels were also observed in patients with NASH.23 The interpretation of these findings is uncertain because there seems to be little relationship between FAT/CD36 mRNA and its protein product in animal models of fatty liver.32 33 Likewise, we have recently shown that FAT/CD36 mRNA levels increased in hepatocytes from obese Zucker rats in parallel with the histological severity of steatosis,16 whereas the total amount of FAT/CD36 protein remained unaltered in steatotic hepatocytes (Buqué et al, unpublished). However, in the present study we found that both mRNA and protein abundance of FAT/CD36 are abnormally increased in the liver of patients with NAFLD as well as in HCV G1 patients. The explanation for this apparent divergence with animal studies in the expression level of FAT/CD36 mRNA and protein is unclear but may involve differences observed in the regulation of expression and function of this FFA translocase and other lipid metabolism-related genes between rodent and human cells.34 35 In addition, HCV G1 itself might directly upregulate FAT/CD36 gene expression in liver cells, as occurs for a number of cellular genes,28 36 37 thus explaining the hepatic overexpression of this FFA transporter in patients with HCV G1, particularly those with steatosis.
Another novel finding of this work is the altered subcellular distribution of FAT/CD36 in NAFLD. In particular, in NAS and NASH this FFA transporter is predominantly located at the plasma membrane of hepatocytes whereas, in histologically normal liver, FAT/CD36 is weakly detected in the cytoplasm of hepatocytes. It is also interesting to note the different expression pattern of FAT/CD36 in the liver of patients with HCV G1 depending on the presence of steatosis. Specifically, while hepatic FAT/CD36 expression is mainly restricted to the cytoplasm of hepatocytes in patients with HCV G1 without steatosis, this FFA translocase is predominantly located at the hepatocellular plasma membrane in patients with HCV G1 with concomitant steatosis, suggesting that the location of FAT/CD36 protein at the plasma membrane of hepatocytes may be related to the development of steatosis, such as in NAFLD as in chronic HCV G1 infection. The subcellular distribution of FAT/CD36 is critical for the regulation of its functional activity as FFA transporter, facilitating the uptake and influx of FFAs to the cells, remaining functionally inactive at the intracellular storage pools and active when translocated to the plasma membrane.38 Insulin induces gene expression of FAT/CD3638 as well as its translocation to the plasma membrane in heart and muscle cells via a phosphatidylinositol-3-kinase-dependent mechanism.39 The significant correlation observed between hepatic FAT/CD36 expression index and circulating insulin levels in patients with NAFLD and those with HCV G1 with steatosis, in parallel with the predominant location of this FFA translocase at the plasma membrane of hepatocytes, suggests that insulin might also induce FAT/CD36 translocation to the plasma membrane in human hepatocytes. In vitro studies are needed to prove this hypothesis at the molecular level.
There are few and somewhat contradictory data on the role of FAT/CD36 in the pathogenesis of hepatic steatosis. Genetic FAT/CD36 deficiency in humans is associated with increased serum levels of TGs and HDL-cholesterol,40 41 but there are no data available on the hepatic lipid content in these subjects. However, Goudriaan et al found that FAT/CD36-deficient mice had a higher hepatic TG content than wild-type littermates.42 In contrast, a recent report from Zhou et al showed that FAT/CD36 null mice had lower basal hepatic TG levels than wild-type counterparts.20 They also showed that liver X receptor agonists, which induced liver-specific activation of FAT/CD36 and steatosis in wild-type mice, failed to accumulate TGs in the liver of FAT/CD36 null mice,20 indicating that liver-specific upregulation of FAT/CD36 is required for the onset of steatosis. In line with these results, we found a positive correlation between the hepatic FAT/CD36 expression index and the histological grade of steatosis in patients with NASH and those with HCV G1 with fatty liver, along with a predominant location of this FFA translocase at the hepatocellular plasma membrane in these patients, reinforcing the notion that increased expression and function of FAT/CD36 in hepatocytes could contribute to steatosis not only in rodents but also in humans. However, the mechanisms regulating FAT/CD36 expression and function as well as the molecular players involved in FAT/CD36 trafficking between intracellular organelles and the plasma membrane in human hepatocytes are still undefined, and should be elucidated in future experimental studies.
FAT/CD36 probably contributes to peripheral insulin resistance by increasing FFA uptake and esterification into TGs in muscle cells.9 39 The intracellular excess in TGs and other lipid intermediates, such as diacylglycerol and ceramides, interferes in the insulin signalling pathway by activating inhibitor isoforms of PKC and by inhibiting Akt activation, respectively.43 44 However, little is known of the role of FAT/CD36 in hepatic insulin resistance. In this regard, we have recently reported that the insulin signalling cascade, largely Akt and FoxO1 phosphorylation, is markedly impaired in the liver of patients with NASH and chronic HCV G1 infection.45 Taking these data into account, our present findings that patients with NAS with insulin resistance had a higher hepatic FAT/CD36 expression index than those without insulin resistance, as well as the significant correlation found between the hepatic FAT/CD36 expression index and the HOMA-IR score in patients with NASH and those with HCV G1, suggest that increased expression and function of FAT/CD36 in hepatocytes may contribute to hepatic insulin resistance in these chronic liver diseases. The results reported by Furuhashi et al are in line with this notion, as they found that genetic FAT/CD36 deficiency in humans does not impair insulin sensitivity.40
In conclusion, this study demonstrates that hepatic FAT/CD36 upregulation is significantly associated with insulin resistance, hyperinsulinaemia and increased steatosis in patients with NASH and those with HCV G1 with concomitant steatosis. Translocation of FAT/CD36 to the plasma membrane of hepatocytes is a common feature in NAFLD and chronic HCV G1 infection with fatty liver. Overall, these findings suggest that induction of expression and translocation of this FFA transporter in hepatocytes may play an important role in promoting liver fat accumulation in these patients. Unravelling the molecular mechanisms involved in the regulation of FAT/CD36 expression and translocation to the plasma membrane in human hepatocytes could be useful for identifying novel targets for the prevention/treatment of liver fat accumulation and its deleterious consequences on the outcome of NAFLD and chronic HCV G1 infection.
References
Supplementary materials
Footnotes
Funding This work was supported by grants to CG-M from Instituto de Salud Carlos III (PI06/0221 and PI10/00067), Fundación Eugenio Rodríguez Pascual, and Universidad Europea de Madrid, Spain; to JG-G and SS-C from Junta de Castilla y León (G/467B01/64000/3 and SAN673/LE06/08) and Ministerio de Educación y Ciencia (BFU2007-62977); and to PA and BO from Basque government (IT-336-10 and S-PE09UN28) and Ministerio de Educación y Ciencia (SAF2007-60211). MVG-M and TL-R were supported by CIBERehd contracts. CIBERehd is funded by the Instituto de Salud Carlos III, Spain.
Competing interests None.
Ethics approval This study was conducted with the approval of the ethics committee of University Hospital Santa Cristina, as commissioned by University Hospital La Princesa, Madrid, Spain.
Provenance and peer review Not commissioned; externally peer reviewed.