Spatiotemporal control of mitotic exit during anaphase by an aurora B-Cdk1 crosstalk
- Universidade do Porto, Portugal
- University of Massachusetts, United States
Abstract
According to the prevailing ‘clock’ model, chromosome decondensation and nuclear envelope reformation when cells exit mitosis are byproducts of Cdk1 inactivation at the metaphase-anaphase transition, controlled by the spindle assembly checkpoint. However, mitotic exit was recently shown to be a function of chromosome separation during anaphase, assisted by a midzone Aurora B phosphorylation gradient - the ‘ruler’ model. Here we found that Cdk1 remains active during anaphase due to ongoing APC/CCdc20- and APC/CCdh1-mediated degradation of B-type Cyclins in Drosophila and human cells. Failure to degrade B-type Cyclins during anaphase prevented mitotic exit in a Cdk1-dependent manner. Cyclin B1-Cdk1 localized at the spindle midzone in an Aurora B-dependent manner, with incompletely separated chromosomes showing the highest Cdk1 activity. Slowing down anaphase chromosome motion delayed Cyclin B1 degradation and mitotic exit in an Aurora B-dependent manner. Thus, a crosstalk between molecular ‘rulers’ and ‘clocks’ licenses mitotic exit only after proper chromosome separation.
https://doi.org/10.7554/eLife.47646.001Introduction
The decision to enter and exit mitosis is critical for genome stability and the control of tissue homeostasis, perturbation of which has been linked to cancer (Evan and Vousden, 2001; Hanahan and Weinberg, 2011). While the key universal principles that drive eukaryotic cells into mitosis are well established (Domingo-Sananes et al., 2011; Lindqvist et al., 2009; Rieder, 2011), the mechanistic framework that determines mitotic exit remains ill-defined. The prevailing ‘clock’ model conceives that mitotic exit results from APC/CCdc20-mediated Cyclin B1 degradation when cells enter anaphase, under control of the spindle assembly checkpoint (SAC) (Musacchio, 2015). This allows the dephosphorylation of Cdk1 substrates by PP1/PP2A phosphatases, setting the time for chromosome decondensation and nuclear envelope reformation (NER) (Wurzenberger and Gerlich, 2011), two hallmarks of mitotic exit. This model is supported by the observation that inhibition of PP1/PP2A or expression of non-degradable Cyclin B1 (and B3 in Drosophila) mutants arrested cells in anaphase (Afonso et al., 2014; Parry and O'Farrell, 2001; Schmitz et al., 2010; Sigrist et al., 1995; Vagnarelli et al., 2011; Wheatley et al., 1997; Wolf et al., 2006). However, because Cyclin B1 is normally degraded during metaphase (Clute and Pines, 1999; Huang and Raff, 1999), the data from non-degradable Cyclin B1 expression could be interpreted as a spurious gain of function due to the artificially high levels of Cyclin B1 that preserve Cdk1 activity during anaphase. Whether Cyclin B1-Cdk1 normally plays a role in the control of anaphase duration and mitotic exit remains unknown.
We have recently uncovered a spatial control mechanism that operates after SAC satisfaction to delay chromosome decondensation and normal NER in response to incompletely separated chromosomes during anaphase in Drosophila and human cells (Afonso et al., 2014). The central player in this mechanism is a constitutive midzone-based Aurora B phosphorylation gradient that was proposed to monitor the position of chromosomes along the spindle axis during anaphase (Afonso et al., 2014; Maiato et al., 2015). Thus, according to this model, mitotic exit in metazoans, as defined as the irreversible transition into G1 after chromosome decondensation and NER, cannot simply be explained by a ‘clock’ that starts ticking at the metaphase-anaphase transition, but must also respond to spatial cues as cells progress through anaphase. The main conceptual implication of this ‘ruler’ model is that mitotic exit is determined during anaphase, and not at the metaphase-anaphase transition under SAC control. In this case, a molecular ‘ruler’ that prevents precocious chromosome decondensation and NER would allow that all separated sister chromatids end up in two individualized daughter nuclei during a normal mitosis. Moreover, it provides an opportunity for the correction and reintegration of lagging chromosomes that may arise due to deficient interchromosomal compaction in anaphase (Fonseca et al., 2019) or erroneous kinetochore-microtubule attachments that are ‘invisible’ to the SAC (e.g. merotelic attachments) (Gregan et al., 2011). Interestingly, Aurora B association with the spindle midzone depends on the kinesin-6/Mklp2/Subito (Cesario et al., 2006; Gruneberg et al., 2004) and is negatively regulated by Cdk1 (Hümmer and Mayer, 2009). Thus, the establishment of a midzone-based Aurora B ‘ruler’ in anaphase is determined by the sudden drop of Cdk1 activity (the ‘clock’) at the metaphase-anaphase transition. In the present work, we investigate whether and how molecular ‘rulers’ also regulate the ‘clocks’ during anaphase to coordinate mitotic exit in space and time in metazoans.
Results
Cyclin B1 continues to be degraded during anaphase and its disappearance is a strong predictor of mitotic exit in metazoans
To investigate a possible role of Cdk1 during anaphase, we started by monitoring Cyclin B1-GFP by spinning-disc confocal microscopy in live Drosophila and human cells in culture. Mild induction of Cyclin B1-GFP expression in S2 cells reproduced the localization of endogenous Cyclin B1 in the cytoplasm, mitotic spindle, kinetochores and centrosomes (Bentley et al., 2007; Clute and Pines, 1999; Huang and Raff, 1999; Pines and Hunter, 1991), without altering normal anaphase duration or increasing chromosome missegregation (Figure 1a, Figure 1—figure supplement 1a,a’ and Figure 1—figure supplement 2a–c). In agreement with previous reports (Clute and Pines, 1999; Huang and Raff, 1999), cytoplasmic Cyclin B1-GFP levels decreased abruptly at the metaphase-anaphase transition (Figure 1a,c). However, in contrast to what has been observed in Drosophila embryos (Huang and Raff, 1999), the centrosomal pool of Cyclin B1 in S2 cells was the most resistant to degradation and persisted well after anaphase onset, becoming undetectable only ~1 min before DNA decondensation (Figure 1a,c, Figure 1—figure supplement 1a,a’ and Figure 1—figure supplement 2a,d,e and Video 1). Indeed, complete Cyclin B1 disappearance from centrosomes during anaphase strongly correlated with mitotic exit (Figure 1—figure supplement 2f).
Figure 1 with 3 supplements see all
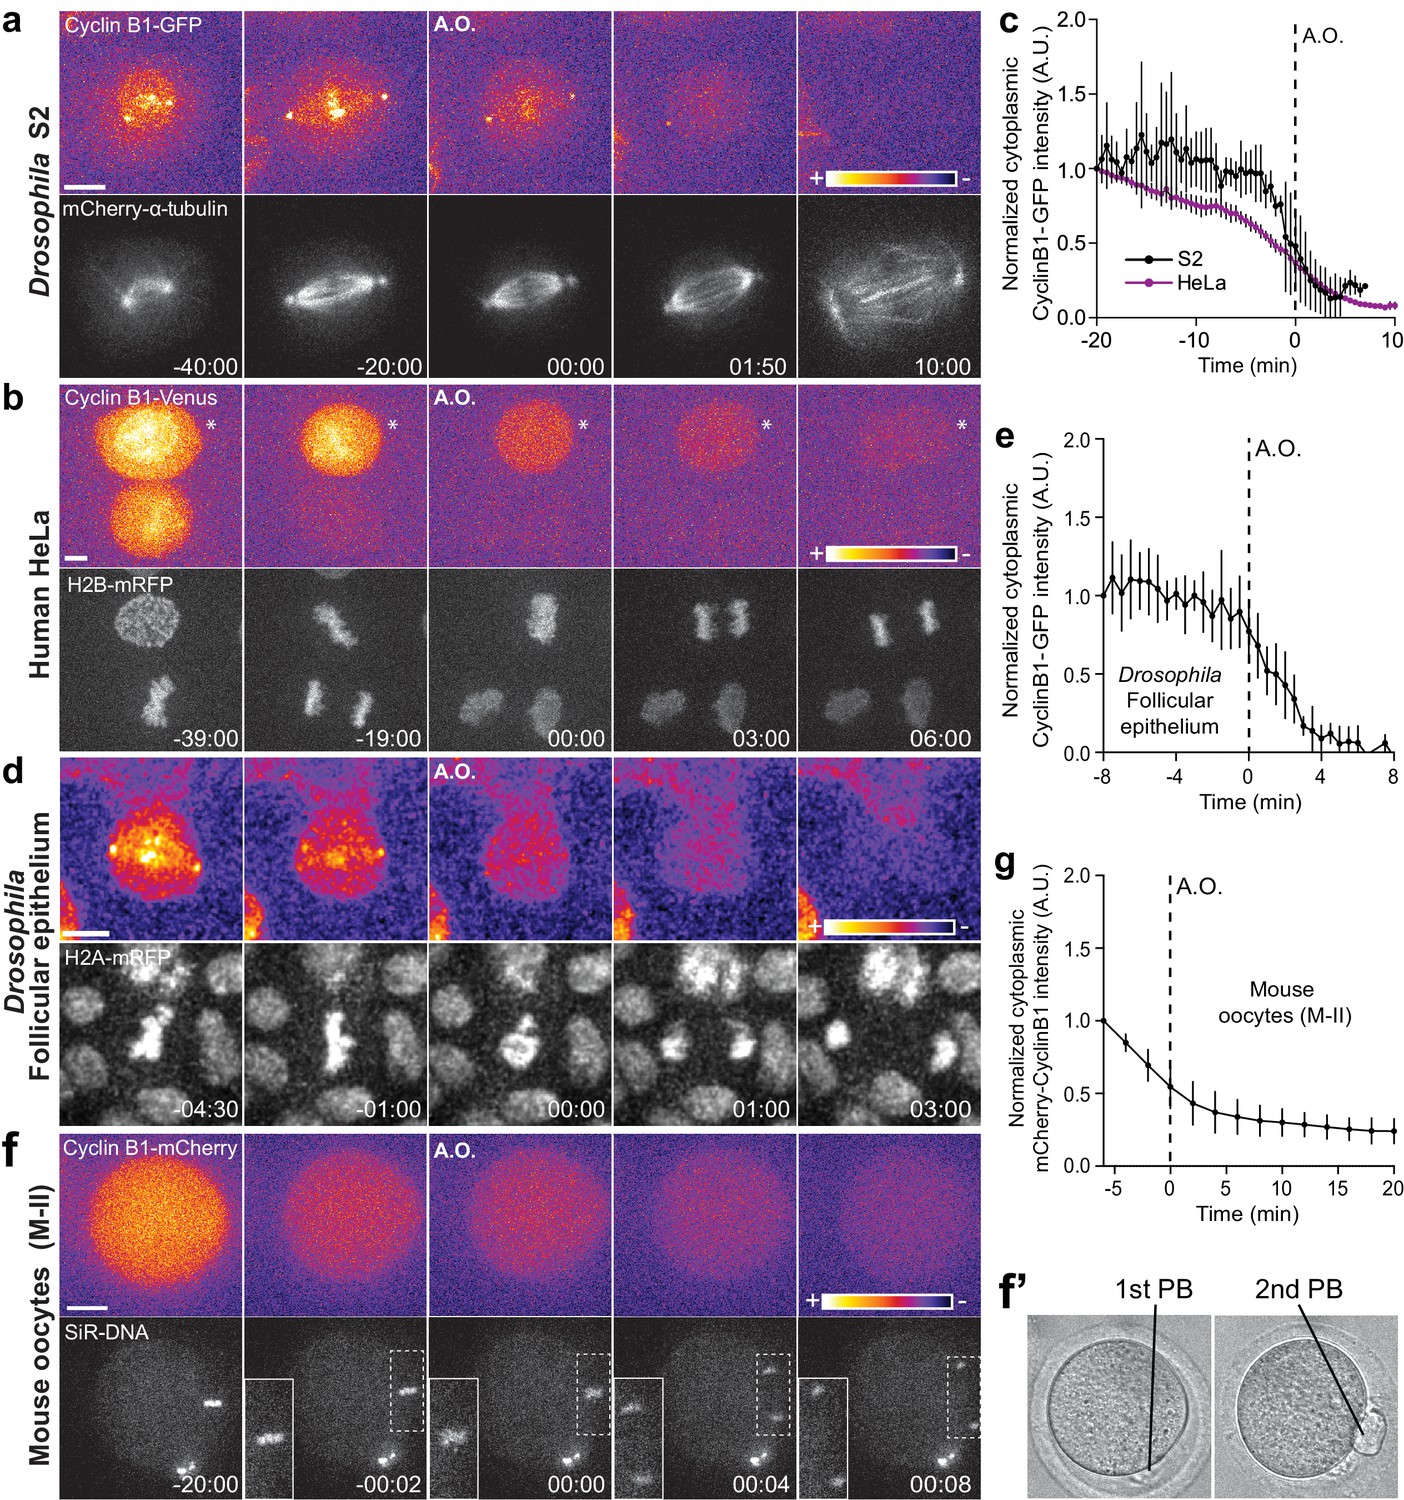
Cyclin B1 continues to be degraded during anaphase.
(a) Drosophila S2 cell from nuclear envelope breakdown to NER showing the different pools of Cyclin B1 in the mitotic apparatus. Scale bar is 5 μm. (b) Two neighbor HeLa cells (* indicates a cell that is slightly delayed relative to its neighbor; compare relative Cyclin B1 levels between neighbors as they exit mitosis) expressing exogenous H2B-mRFP and showing continuous degradation of endogenous Cyclin B1-Venus during anaphase. Scale bar is 5 μm. (c) Cyclin B1 degradation profile in Drosophila S2 cells (n = 4 cells) and in HeLa cells with endogenously tagged Cyclin B1-Venus (n = 3 cells). Fluorescence intensity values were normalized to 20 min before anaphase onset (A.O.). (d) Time-lapse images of dividing Drosophila follicle cells expressing endogenously tagged Cyclin B1-GFP and His2Av-mRFP. Scale bar is 5 μm. (e) Quantification of Cyclin B1-GFP fluorescence intensity in the cytoplasm (n = 8 cells, five ovaries). Fluorescence intensity values were normalized to 8 min before A.O. (f) Time-lapse images of a metaphase II oocyte expressing Cyclin B1-mCherry and stained with SiR-DNA undergoing anaphase II after parthenogenic activation. Inset is 1.5x magnification of separating chromosomes. (f’) Images of transmission light microscopy showing the same oocyte prior to and after imaging. Note the presence of the first and second polar bodies. Scale bar is 20 μm. (g) Quantification of Cyclin B1-mCherry fluorescence intensity in the cytoplasm (n = 20 oocytes, two independent experiments). Fluorescence intensity values were normalized to 6 min before anaphase onset. The LUT ‘fire’ is used to highlight Cyclin B1 localization in the different systems. Time in all panels is in min:sec.
Video 1
Exogenous expression of Cyclin B1-GFP in Drosophila S2 cells shows continuous degradation during anaphase.
Mitotic progression from nuclear envelope breakdown to nuclear envelope reformation in a Drosophila S2 cell expressing Cyclin B1-GFP (green) and mCherry-α-tubulin (magenta). Cyclin B1 becomes undetectable at the anaphase-telophase transition, just before mCherry-α-tubulin exclusion from the nucleus. Time is min:sec.
To extend the significance of these observations, we monitored endogenously tagged Cyclin B1-Venus levels in human HeLa and hTERT-RPE1 cells (Collin et al., 2013) throughout mitosis and found that it also continues to be degraded during anaphase (Figure 1b,c and Figure 1—figure supplement 3a,c and Videos 2 and 3). The physiological relevance of these findings was confirmed in primary adult Drosophila follicular epithelium cells (ex vivo) expressing endogenously tagged Cyclin B1-GFP (Figure 1d,e and Video 4), and after injection of Cyclin B1-mCherry mRNA in mouse oocytes undergoing meiosis II, when chromosomal division is similar to mitosis (Figure 1f,f’, g). Thus, Cyclin B1 continues to be degraded during anaphase in Drosophila, mouse and human cells, including primary tissues, and its disappearance is a strong predictor of mitotic exit.
Video 2
Endogenous Cyclin B1 is continuously degraded during anaphase in human HeLa cells.
Mitotic progression in two slightly asynchronous HeLa cells expressing endogenous Cyclin B1 tagged with Venus (green) and exogenous H2B-mRFP (magenta). Cyclin B1 becomes undetectable at the anaphase-telophase transition, just before DNA decondensation. Time is min:sec.
Video 3
Endogenous Cyclin B1 is continuously degraded during anaphase in human hTERT-RPE1 cells.
Mitotic progression of two slightly asynchronous hTERT-RPE1 cells expressing endogenous Cyclin B1 tagged with Venus (green) and SiR-DNA (magenta). Cyclin B1 becomes undetectable at the anaphase-telophase transition, just before DNA decondensation. Time is min:sec.
Video 4
Endogenous Cyclin B1 is continuously degraded during anaphase in the Drosophila adult follicular epithelium.
Mitotic progression of dividing follicle cells expressing endogenous Cyclin B1 tagged with GFP (green) and His2Av-mRFP (magenta). Note a pool of cytoplasmic Cyclin B1 that remains detectable until around 4 min after anaphase onset. Time is in min:sec.
Degradation of B-type Cyclins and Cdk1 inactivation during anaphase are rate limiting for mitotic exit
To investigate the functional relevance of an anaphase Cyclin B1 pool we acutely inhibited Cdk1 activity at anaphase onset with RO-3306 (Vassilev et al., 2006) and found that it accelerated NER in S2 cells (Figure 2a–d). In contrast, expression of non-degradable Cyclin B1 or Cyclin B3 prevented normal spindle elongation and induced an extensive delay in anaphase, in agreement with previous works (Afonso et al., 2014; Parry and O'Farrell, 2001; Potapova et al., 2006; Sigrist et al., 1995; Wolf et al., 2006). While this delay was dependent on Cdk1 activity (Figure 2—figure supplement 1a–e), expression of non-degradable B-type Cyclins does not reflect a physiological role for their degradation in mitotic exit. As so, we also investigated the effect of inhibiting proteasome-mediated degradation of wild-type B-type Cyclins, including endogenously tagged versions, by adding MG132 just before or at anaphase onset in Drosophila and human cells, respectively. Under these conditions, cells remained in an anaphase-like state for several hours with separated sister chromatids and detectable Cyclin B1, often reverting to a metaphase-like state (Figure 3a,d,e, Figure 4a,d,e, Figure 6a,b,f and Videos 5 and 6). This ‘mitotic reversal’ is reminiscent of the one observed in cells treated with MG132 in metaphase after addition and subsequent washout of a Cdk1 inhibitor (Potapova et al., 2006).
Figure 2 with 1 supplement see all
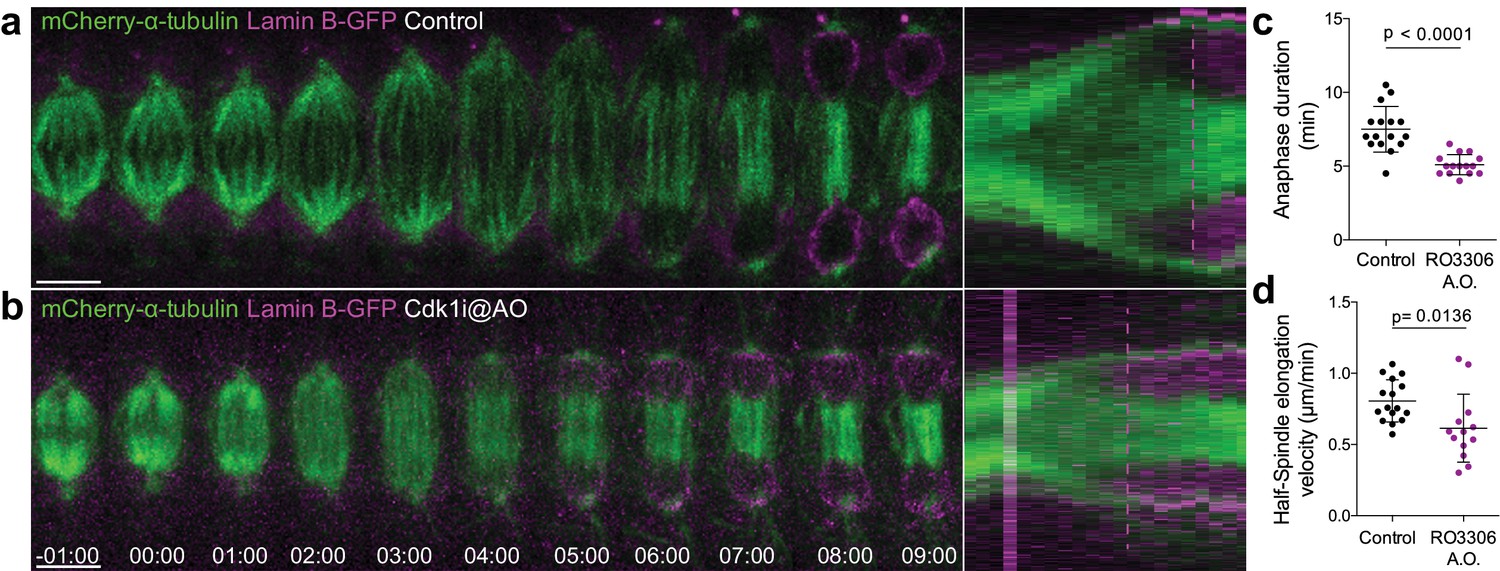
Cdk1 inhibition at anaphase onset accelerates NER.
(a) and (b) Control and Cdk1-inhibited Drosophila S2 cells at anaphase onset (A.O.) stably expressing Lamin B-GFP/mCherry-α-tubulin. Scale bars are 5 μm. Time is in min:sec. Panels on the right side show the corresponding collapsed kymographs. Dashed lines indicate the moment of NER. (c) and (d) Quantification of anaphase duration (control n=16 cells; Cdk1i n=15 cells) and half-spindle elongation velocity (control n=16 cells; Cdk1i, n=13 cells), respectively, in the conditions shown in (a) and (b). Statistical significance was tested with an unpaired t-test.
-
Figure 2—source data 1
Calculation of anaphase duration after Cdk1 inhibition at anaphase onset.
- https://doi.org/10.7554/eLife.47646.014
Figure 3
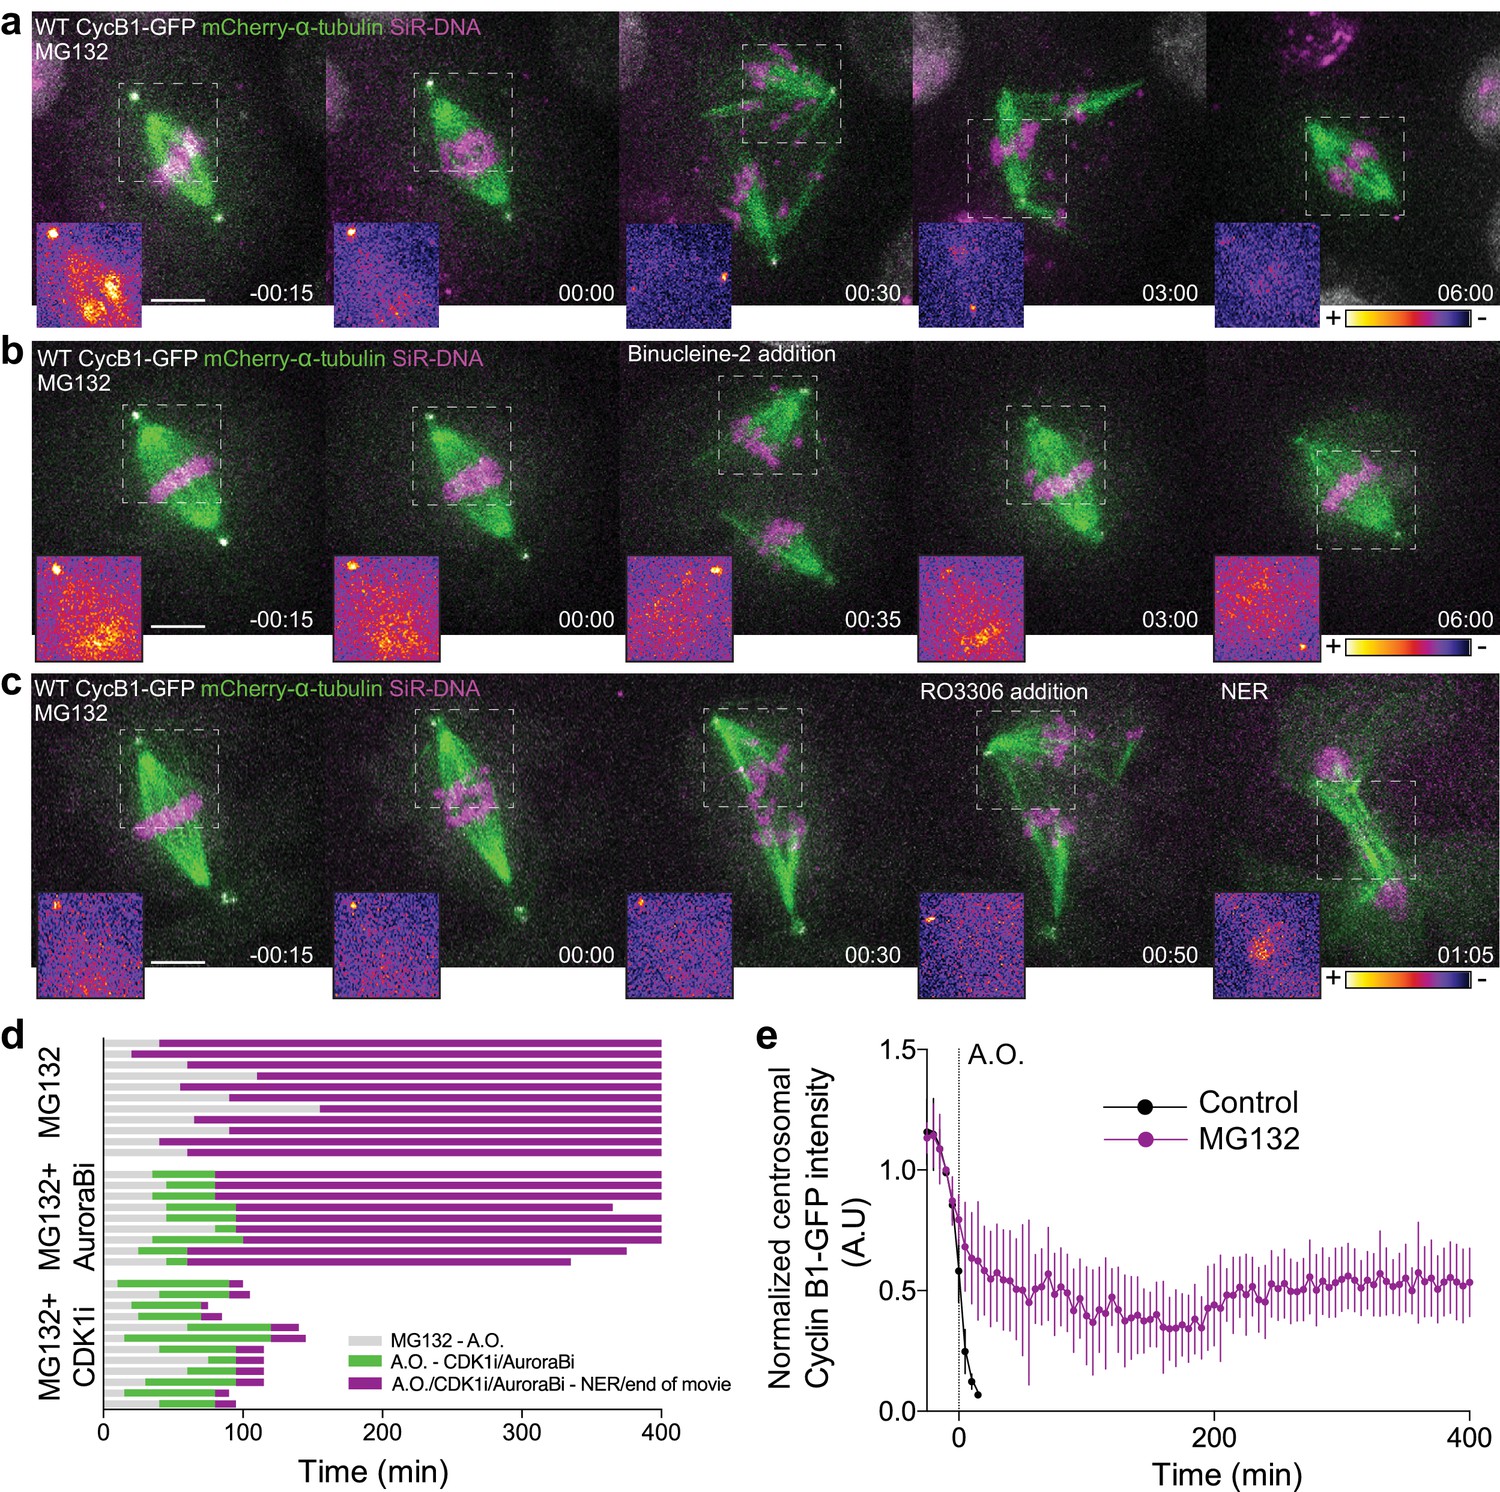
Cdk1 inactivation during anaphase licenses mitotic exit and requires proteasome-mediated proteolysis.
(a) Representative Drosophila S2 cell stably expressing Cyclin B1-GFP/mCherry-α-tubulin and stained with SiR-DNA to follow mitotic chromosomes, showing a strong anaphase arrest after treatment with MG132 (20 μM). Importantly, cells entered anaphase with Cyclin B1 levels compared to untreated control cells, despite the presence of MG132. (b) and (c) Drosophila S2 cells arrested in anaphase with MG132, and treated with Aurora B inhibitor (Binucleine-2) or Cdk1 inhibitor (RO3306), respectively, 30–60 min after the anaphase arrest. In (a), (b) and (c) a half-spindle region is highlighted with the LUT ‘fire’ to reveal Cyclin B1-GFP fluorescence during the anaphase arrest. Scale bars in all panels are 5 μm. Time in all panels is in h:min. (d) Timeline of the experiments shown in (a), (b) and (c) with quantification of total anaphase duration. A.O. = Anaphase onset. Gray color represents the time from MG132 addition to anaphase onset in cases where cells entered anaphase in the presence of MG132. Green color represents the time spent in anaphase until Aurora B or Cdk1 inhibition and purple color represents the time spent in anaphase in the presence of MG132 or MG312+Aurora B inhibition or MG132+Cdk1 inhibition. (e) Cyclin B1-GFP degradation profile in untreated (n = 12 cells) and MG132-treated cells arrested in anaphase (n = 6 cells). A.O. = Anaphase onset.
Figure 4

Proteasome inhibition at anaphase onset arrests human cells in anaphase in a Cdk1-dependent manner.
(a) Representative U2OS cell stably expressing H2B-GFP/mCherry-α-tubulin treated with MG132 at anaphase onset (time 00:00). The cell became arrested in anaphase, after full chromosome separation and formation of a spindle midzone. Typically, two new spindles assembled around individual chromatids that erratically attempted to establish new ‘metaphase’ plates. (b) and (c) Anaphase arrested U2OS cells obtained by the addition of MG132 were treated with the Aurora B inhibitor (ZM447439) or Cdk1 inhibitor (RO3306), respectively, 30–60 min after anaphase arrest. Time in all panels is in h:min. Scale bars are 5 μm. (d) Timeline of the experiments shown in (a), (b) and (c). A.O. = Anaphase onset. Gray color represents the time from MG132 addition to anaphase onset, green color represents the time spent in anaphase until Aurora B or Cdk1 inhibition and purple color represents the time spent in anaphase in the presence of MG132 or MG312+Aurora B inhibition or MG132+Cdk1 inhibition. (e) Quantification of total anaphase duration in MG132, MG132+Aurora B inhibition and MG132+Cdk1 inhibition in Drosophila S2 cells and human U2OS cells. Note that for MG132 and MG132+Aurora B inhibition anaphase duration corresponds to the total duration of the movie as most cells do not exit mitosis until the end of acquisition. Statistical significance was tested with a nonparametric Mann-Whitney test.
Video 5
Proteasome inhibition during anaphase in Drosophila cells.
Drosophila S2 cell stably expressing Cyclin B1-GFP/mCherry-α-tubulin (white/green) and treated with SiR-DNA (magenta) to label mitotic chromosomes. The cell becomes arrested in anaphase for several hours with detectable levels of Cyclin B1 at centrosomes. Time is h:min.
Video 6
Proteasome inhibition at anaphase onset arrests human cells in anaphase.
Human U2OS cell stably expressing H2B-GFP/mCherry-α-tubulin (magenta/green) treated with MG132 at anaphase onset. Proteasome inhibition induced a strong anaphase arrest for several hours. Time is h:min.
To evaluate the roles of Cdk1 and Aurora B in mitotic exit, we acutely inhibited either Cdk1 or Aurora B activity in MG132-treated anaphase-like cells. After Aurora B inhibition with Binucleine-2 (Smurnyy et al., 2010) or ZM447439 (Ditchfield et al., 2003) in Drosophila and human cells, respectively, they also remained in an anaphase-like state for several hours and often reverted into a metaphase-like state, but mitotic exit was resumed significantly earlier than MG132-treated controls (Figure 3b,d, Figure 4b,d,e and Videos 7 and 8). In contrast, Cdk1 inhibition immediately triggered chromosome decondensation and mitotic exit (Figure 3c,d, Figure 4c–e and Videos 9 and 10). Thus, Aurora B inhibition is clearly not sufficient to drive cells out of mitosis if Cyclin B1 degradation is prevented, whereas Cdk1 activity during anaphase is rate-limiting for mitotic exit in metazoans.
Video 7
Aurora B inhibition in anaphase-arrested Drosophila cells treated with MG132.
Representative Drosophila S2 cell stably expressing Cyclin B1-GFP/mCherry-α-tubulin (white/green) and treated with SiR-DNA (magenta) to label mitotic chromosomes. The Aurora B inhibitor was added 35 min after anaphase onset, however the cell remained arrested in anaphase for several hours. Time is h:min.
Video 8
Aurora B inhibition in anaphase-arrested human cells treated with MG132.
Human U2OS cell stably expressing H2B-GFP/mCherry-α-tubulin (magenta/green) treated with MG132 at anaphase onset. The Aurora B inhibitor was added 40 min after anaphase onset. Similarly to the results in Drosophila S2 cells, U2OS cells remained arrested in anaphase for several hours after Aurora B inhibition. Time is h:min.
Video 9
Cdk1 inhibition in anaphase-arrested Drosophila cells treated with MG132.
Representative Drosophila S2 cell stably expressing Cyclin B1-GFP/mCherry-α-tubulin (white/green) and treated with SiR-DNA (magenta) to label mitotic chromosomes. The Cdk1 inhibitor was added 50 min after anaphase onset, inducing an almost immediate mitotic exit. Time is h:min.
Video 10
Cdk1 inhibition in anaphase-arrested human cells treated with MG132.
Human U2OS cell stably expressing H2B-GFP/mCherry-α-tubulin (magenta/green) treated with MG132 at anaphase onset. The Cdk1 inhibitor was added 90 min after anaphase onset and induced immediate mitotic exit. Time is h:min.
Cyclin B1 degradation during anaphase is mediated by APC/CCdc20 and APC/CCdh1
APC/CCdc20 is thought to regulate the metaphase-anaphase transition by targeting Cyclin B1 for degradation through recognition of a D-box (Glotzer et al., 1991), under control of the SAC (Clute and Pines, 1999). This would then promote APC/C binding to Cdh1 (APC/CCdh1), which recognizes substrates with either a D- or a KEN-box (Lindon, 2008). However, recent Cryo-electron microscopy studies have established a paradigm of multivalent APC/C-substrate interaction involving two or more degrons, with Cdc20 and Cdh1 having almost identical KEN and D-box receptor sites (da Fonseca et al., 2011; Zhang et al., 2016). Sequence analysis of Drosophila Cyclin B1 revealed a KEN box at position 248, which we mutated to AAN (Figure 5a–d). When expressed in S2 cells the KEN-Cyclin B1-GFP mutant was more slowly degraded specifically during anaphase, delaying mitotic exit (Figure 5a,b,d,f,g). In agreement, APC/CCdh1 depletion in Drosophila and human cells was previously shown to cause an accumulation of Cyclin B1 (Ma et al., 2012; Meghini et al., 2016). To directly test whether APC/CCdh1 mediates Cyclin B1 degradation during anaphase we performed RNAi against the Drosophila Cdh1 orthologue Fizzy-related (Fzr). As in the case of the KEN-box mutant, Fzr RNAi significantly delayed Cyclin B1 degradation during anaphase, postponing mitotic exit (Figure 5e–j). Lastly, we combined our KEN-box mutant with acute APC/C inhibition at anaphase onset with the D-box competitor Apcin (Sackton et al., 2014) and found a synergistic effect (Figure 5—figure supplement 1a–d). This result suggests the presence of multiple recognition sites that mediate Cyclin B1 degradation through both APC/CCdc20 and APC/CCdh1 during anaphase.
Figure 5 with 1 supplement see all
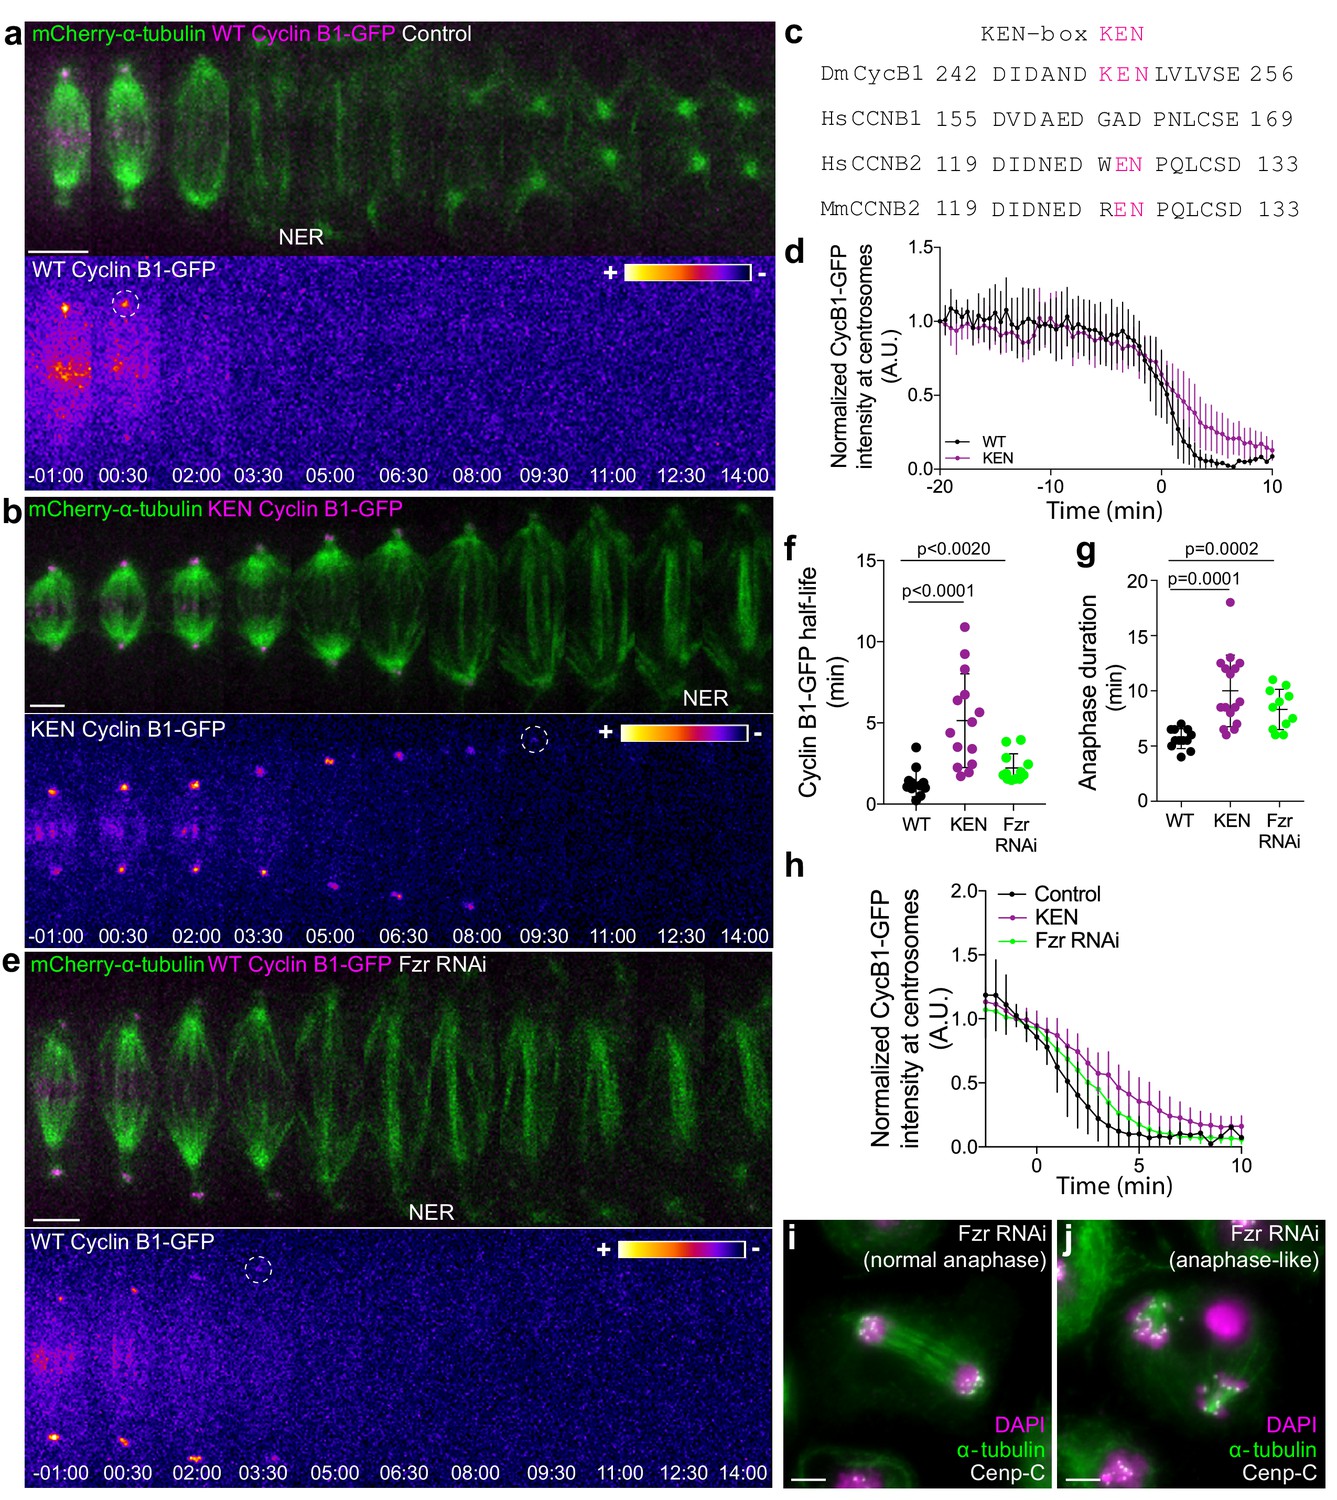
APC/CCdc20 and APC/CCdh1 are required for Cyclin B1 degradation during anaphase and timely mitotic exit.
(a) and (b) Drosophila S2 cells stably expressing WT Cyclin B1 or a KEN-box mutant version co-expressing mCherry-α-tubulin. (c) Sequence alignment showing the conservation of the Drosophila Cyclin B1 KEN-box with mammalian Cyclin B2, but not Cyclin B1. (d) Degradation profile of Cyclin B1-GFP quantified by measuring the GFP fluorescence intensity at centrosomes in control (n = 6 cells) and KEN-box mutant cells (n = 10 cells). Note that KEN-box Cyclin B1 degradation is only affected during anaphase. Anaphase onset = 0 min. (e) Drosophila S2 cell depleted of Fzr and expressing WT CyclinB1-GFP/mCherry-α-tubulin. Cyclin B1-GFP signal is highlighted with the LUT ‘fire’ and dashed white circles highlight the frame before Cyclin B1 signal disappearance from centrosomes. Scale bars are 5 μm. Time in all panels is in min:sec. (f) Quantification of Cyclin B1 half-life (0–4.5 min after anaphase onset) duration in control (n=11 cells), KEN-box mutant (n=12 cells) and Fzr-depleted cells (n=11 cells, pooled from 3 independent experiments) and (g) anaphase duration in control (n = 11 cells), KEN-box mutant (n = 16 cells) and Fzr-depleted cells (n = 12 cells, pooled from three independent experiments). Statistically significant differences for anaphase duration and CyclinB1 half-life were tested with an unpaired t-test and a nonparametric Mann-Whitney test, respectively. (h) Degradation profile of Cyclin B1-GFP quantified by measuring the GFP fluorescence intensity at centrosomes in control (n = 12 cells), KEN-box mutant cells (n = 14 cells) and Fzr-depleted cells (n = 12 cells). Anaphase onset = 0 min. (i) and (j) Images of anaphase Drosophila S2 cells after Fzr RNAi, fixed and co-stained with Cenp-C and α-tubulin. Note that amongst apparently normal anaphase cells (i), anaphase-like cells with clearly separated sister chromatids attached to two half-spindles could also be identified (j). Scale bars are 5 μm.
-
Figure 5—source data 1
Anaphase duration after KEN-box mutation or FZR RNAi.
- https://doi.org/10.7554/eLife.47646.026
Although human Cyclin B1 (but not human Cyclin B2) lacks a canonical KEN-box, its recognition by APC/CCdh1 might involve a D-box or other motifs, whose inactivation compromises Cyclin B1 degradation in anaphase (Clijsters et al., 2014; Lindon, 2008; Matsusaka et al., 2014). To investigate whether Cyclin B1 degradation during anaphase is mediated by the APC/C in human cells, we inhibited its activity specifically at anaphase onset with Apcin and/or pro-TAME, a more selective APC/CCdc20 inhibitor (Sackton et al., 2014; Zeng et al., 2010; Zhang et al., 2016) in hTERT-RPE1 cells expressing endogenously tagged Cyclin B1-Venus. Only the simultaneous addition of both drugs at anaphase onset blocked the continuous degradation of Cyclin B1 during anaphase and prevented mitotic exit for several hours, similar to proteasome inhibition (Figure 6a–f). Although relative inefficiency of these inhibitors cannot be ruled out, it is conceivable that additive interactions of Cdc20/Cdh1 and Cyclin B1 degrons are required for efficient Cyclin B1 ubiquitination and subsequent degradation by the proteasome. Taken together, these results suggest that Drosophila and human Cyclin B1 degradation during anaphase is mediated through the D-box and KEN-box (when present), and can be carried out either by APC/CCdc20 or APC/CCdh1.
Figure 6
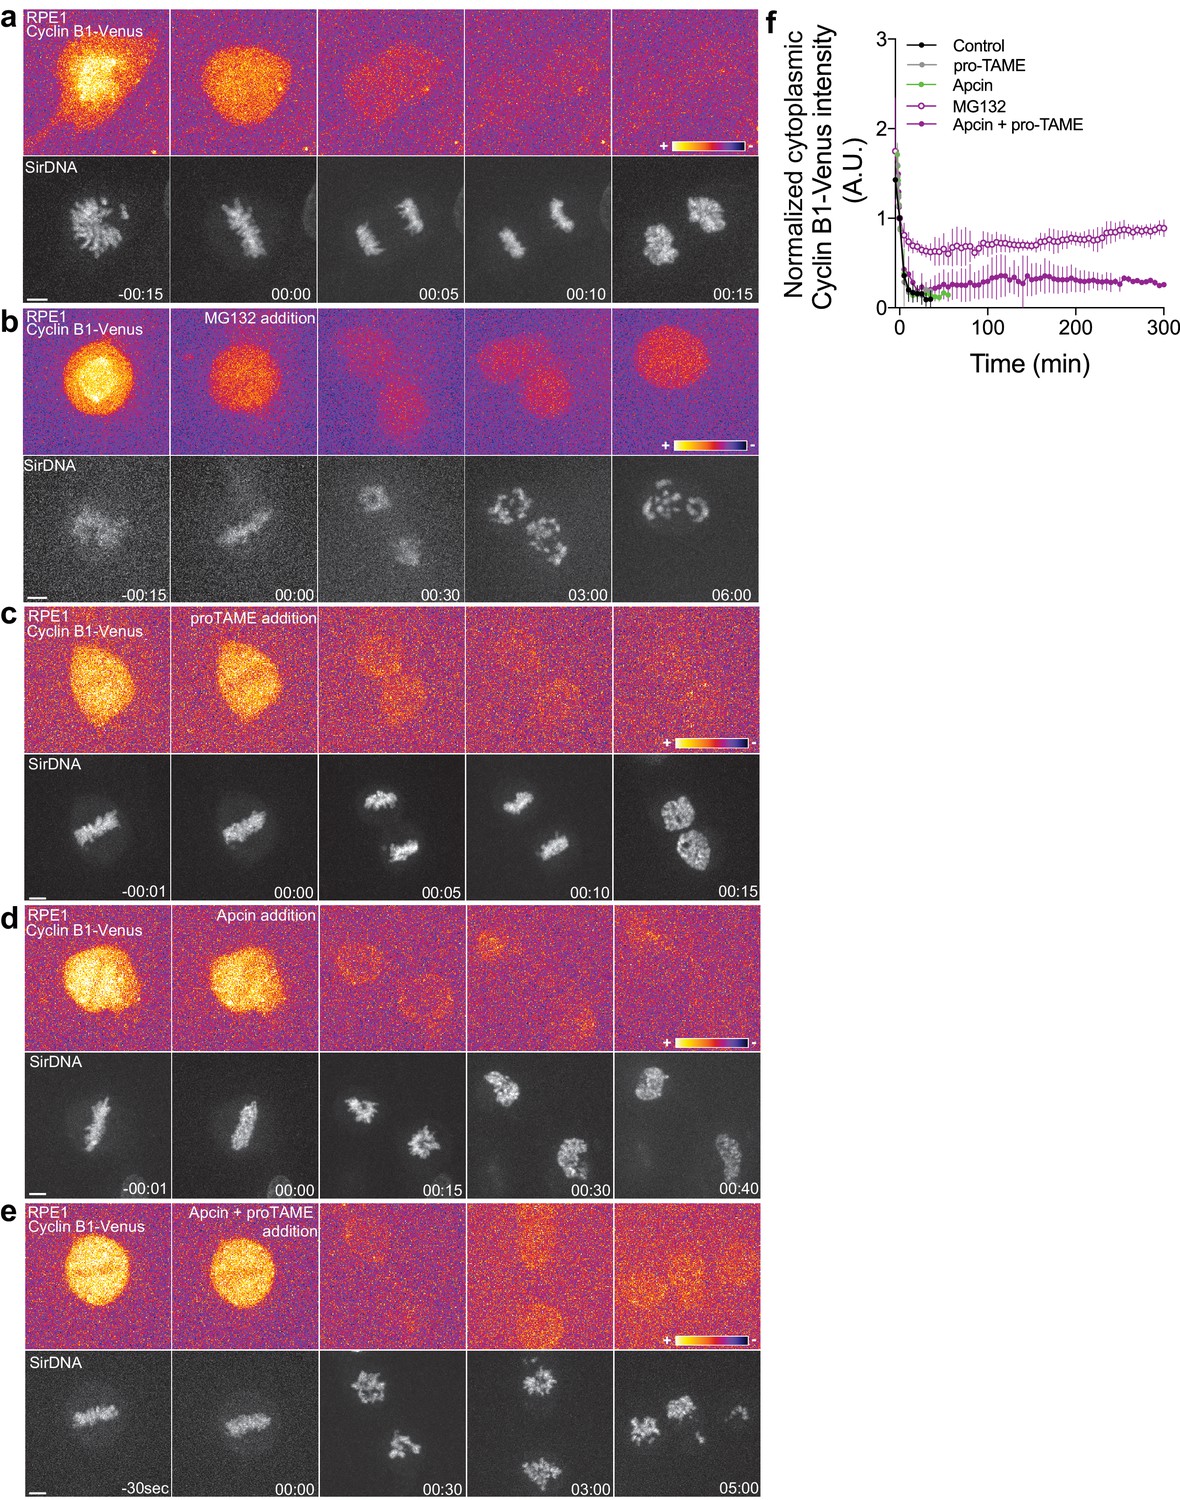
Proteasome and APC/C inhibition at anaphase onset induces an anaphase arrest in human hTERT-RPE1 cells.
(a) Control hTERT-RPE1 cell expressing endogenous Cyclin B1-Venus and co-stained with SiR-DNA to visualize mitotic chromosomes. (b) MG132 addition just before or at anaphase onset (time 00:00), caused an anaphase arrest with detectable Cyclin B1 levels and condensed chromosomes. The arrest was sustained up to 6 hr (time window of acquisition). (c) pro-TAME addition at anaphase onset (time 00:00) showed no visible effect during anaphase. (d) Apcin addition at anaphase onset (time 00:00) induced a slight delay in DNA decondensation. (e) APC/C inhibition with a cocktail of pro-TAME and Apcin at anaphase onset (time 00:00) caused a strong anaphase delay (during the time window of acquisition – 5 hr). Cyclin B1 localization is highlighted with LUT ‘fire’. Scale bars are 5 μm. Time is in h:min. (f) Quantification of Cyclin B1-Venus (normalized to anaphase onset) in control (n = 7 cells), MG132 (n = 4 cells), pro-TAME (n = 7 cells), Apcin (n = 6 cells) and pro-TAME+Apcin (n = 4 cells).
Drosophila Cyclin B1 localizes at the spindle midzone in an Aurora B-dependent manner
To investigate the precise localization of Cyclin B1 during anaphase we took advantage of the extremely flat morphology of Drosophila S2 cells growing on concanavalin-coated coverslips. This allowed us to detect a faint pool of Cyclin B1-GFP associated with the spindle midzone and midbody during a normal mitosis and cytokinesis, respectively (Figure 7a,a’, b), as reported previously in Drosophila germ cells (Mathieu et al., 2013). Detection of the midzone pool of endogenous or ectopically expressed Cyclin B1 was enhanced by abrupt Cdk1 inactivation during metaphase, causing cells to prematurely enter anaphase with high Cyclin B1 levels (Figure 7c,e; see also Figure 1—figure supplement 1b,b’). Under these conditions, Cyclin B1 co-localized with Aurora B at the spindle midzone (Figure 7—figure supplement 1a–c). This localization depended on Subito/kinesin-6-mediated midzone targeting and activity of Aurora B (Figure 7b,d,e), but was independent of Polo kinase activity (Figure 7g and Figure 7—figure supplement 2). While we were unable to localize endogenously tagged Cyclin B1-Venus at the spindle midzone in human anaphase cells due to the poor signal/noise at this stage, direct localization of human Cdk1-GFP in live human HeLa cells revealed a clear spindle localization at the metaphase-anaphase transition, with a subsequent enrichment in the central spindle region between separating sister chromosomes throughout anaphase, and midbody during cytokinesis (Figure 7—figure supplement 3a,b). In agreement, Cdk1 was recently found enriched on isolated midbodies from human cells (Capalbo et al., 2019). These results suggest that Cyclin B1-Cdk1 is spatially regulated by Aurora B activity at the spindle midzone, at least in Drosophila cells.
Figure 7 with 4 supplements see all
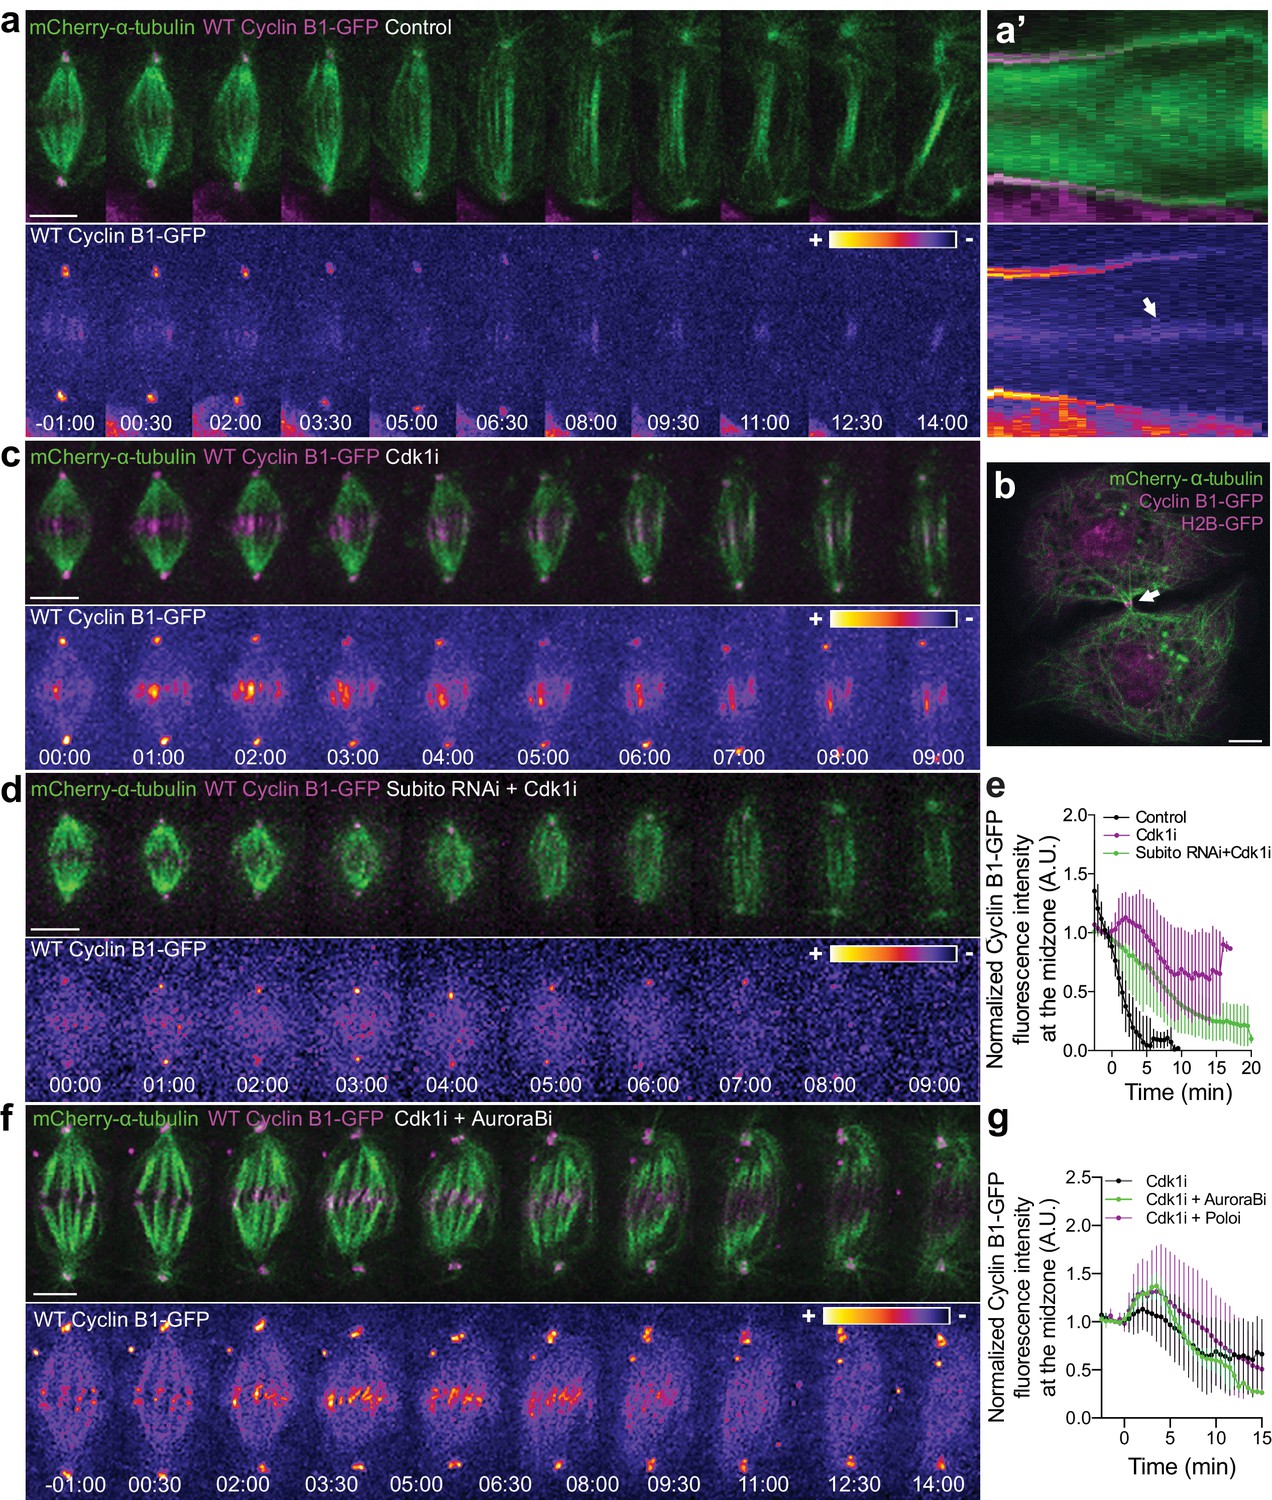
Cyclin B1 localization at the spindle midzone depends on Aurora B localization and activity during anaphase.
(a) Control Drosophila S2 cell stably expressing Cyclin B1-GFP/mCherry-α-tubulin showing a faint pool of Cyclin B1-GFP at the spindle midzone/midbody. (a’) Collapsed kymograph of the cell in a where Cyclin B1-GFP can be visualized at the spindle midzone/midbody. (b) Snapshot of a live Drosophila S2 cell expressing Cyclin B1-GFP/mCherry-α-tubulin where a midbody pool of Cyclin B1-GFP can be detected before completion of cytokinesis. (c) Drosophila S2 cell treated with Cdk1 inhibitor during metaphase. Cyclin B1 is not fully degraded and becomes visibly associated with midzone microtubules as cells are forced to exit mitosis. (d) Cdk1 inhibition at metaphase in a Drosophila S2 cell expressing Cyclin B1-GFP/mCherry-α-tubulin after Subito/Mklp2 depletion by RNAi. The Cyclin B1 midzone localization is no longer detectable. (e) Quantification of Cyclin B1-GFP fluorescence intensity measured at the spindle midzone (identified by the mCherry-α-tubulin signal) in untreated (n = 11 cells), Cdk1 inhibited cells (n = 10 cells) and Cdk1 inhibition after Subito/Mklp2 depletion (n = 12 cells, pooled from two independent experiments). (f) Drosophila S2 cells treated with Cdk1 inhibitor during metaphase and Aurora B inhibitor 4 min after Cdk1 inhibition. For all conditions, Cyclin B1-GFP signal is highlighted with the LUT ‘fire’. Scale bar is 5 μm. (g) Quantification of Cyclin B1-GFP fluorescence intensity measured at the spindle midzone in Cdk1 inhibited cells (n = 10 cells), Cdk1 + Aurora B inhibition (n = 11 cells) and Cdk1 + Polo inhibition (n = 10 cells).
Aurora B association with the spindle midzone controls mitotic exit by regulating Cdk1 activity during anaphase
We have previously found that Aurora B inhibition at anaphase onset abolished the cellular capacity to delay mitotic exit in response to incomplete chromosome separation during anaphase in both Drosophila and human cells (Afonso et al., 2014). Here we sought to investigate whether elevating Aurora B protein levels and presumably its activity impacts mitotic exit. For this purpose we overexpressed Aurora B in Drosophila S2 cells and found that this delayed its own transition to the spindle midzone and extended anaphase duration (Figure 7—figure supplement 4a,b,d,e). Moreover, we found that Aurora B association with the spindle midzone is a strong predictor of anaphase duration, with several cells overexpressing Aurora B extending anaphase for more than 15 min (Figure 7—figure supplement 4c,e,f). Interestingly, this anaphase delay depended on Cdk1 activity (Figure 7—figure supplement 4c), suggesting that Aurora B association with the spindle midzone is able to delay mitotic exit by regulating Cdk1 activity during anaphase. To test this, we monitored Cyclin B1-GFP/Venus degradation after Subito/Mklp2/kinesin-6 RNAi in Drosophila S2 and human hTERT-RPE1 cells. This caused a short, but significant delay in Cyclin B1-GFP/Venus degradation during anaphase, increasing Cyclin B1 half-life and often delaying mitotic exit (Figure 8a–e; see also Figure 1—figure supplement 3a–f). Overall, these data support a model in which the establishment of an anaphase Aurora B phosphorylation gradient concentrates Cyclin B1 and consequently Cdk1 activity at the spindle midzone.
Figure 8
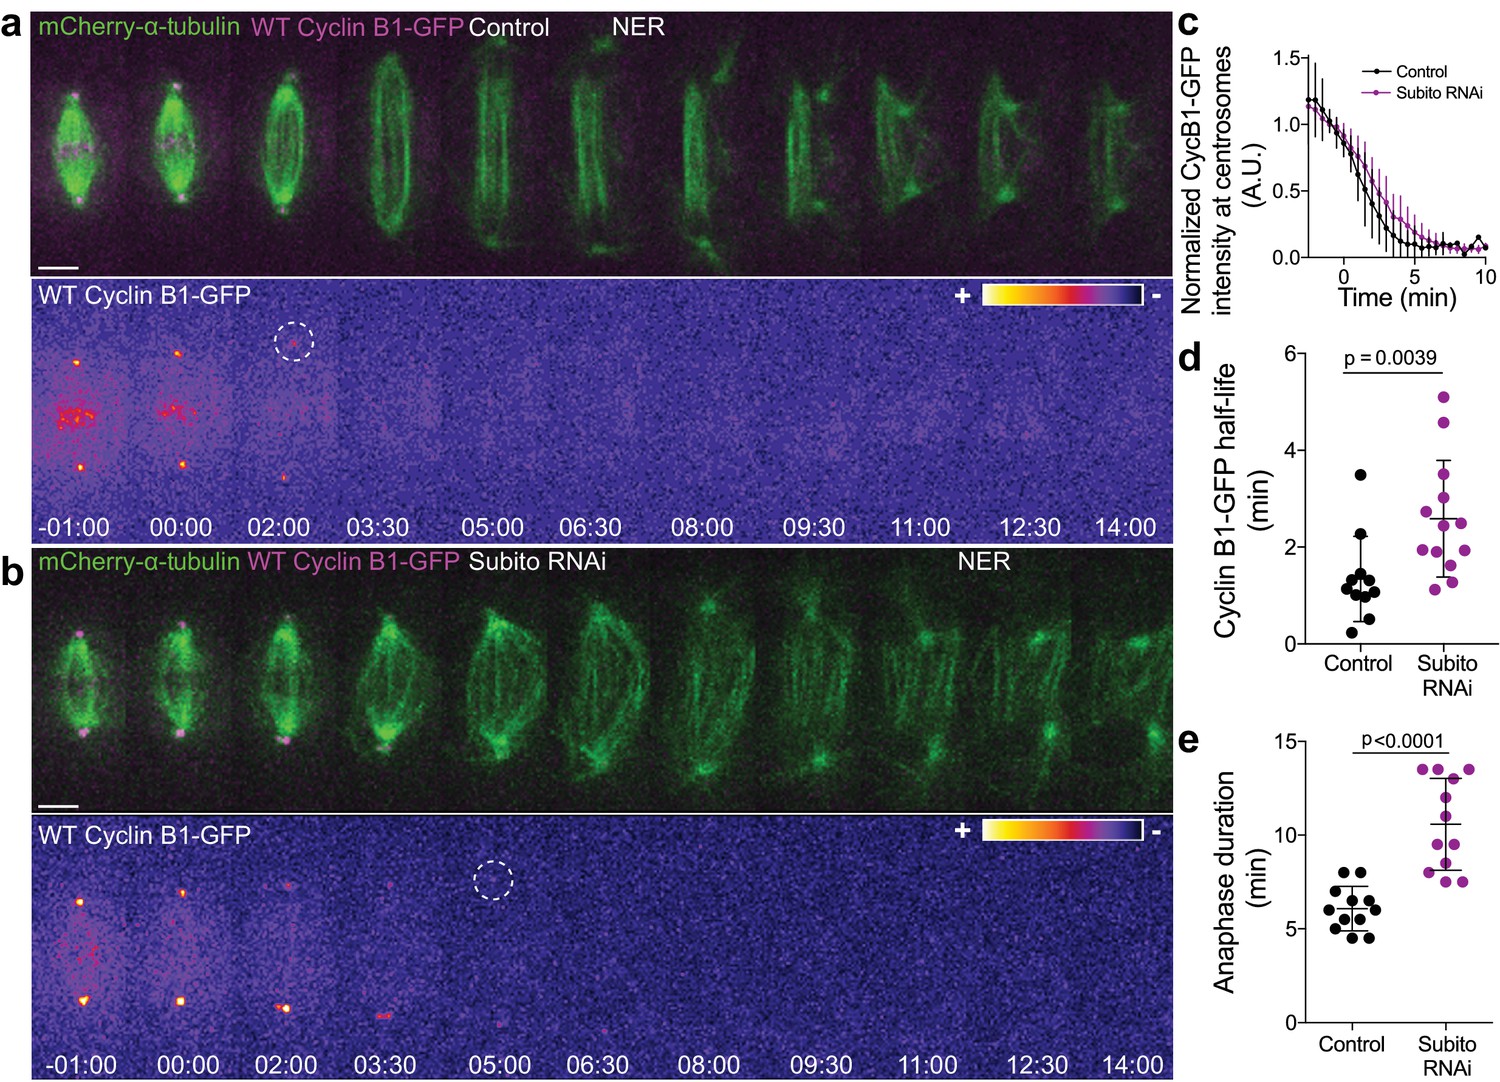
Preventing Aurora B localization at the spindle midzone delays Cyclin B1 degradation during anaphase.
(a) and (b) Control and Subito/Mklp2-depleted Drosophila S2 cells stably expressing Cyclin B1-GFP/mCherry-α-tubulin. Cyclin B1-GFP localization is highlighted with the LUT ‘fire’ and dashed white circles highlight the frame before Cyclin B1 signal disappearance from centrosomes. Scale bars are 5 μm. Time is in min:sec. (c) Degradation profile of Cyclin B1-GFP quantified by measuring fluorescence intensity at centrosomes in control (n = 11 cells) and Subito/Mklp2-depleted S2 cells (n = 13 cells, pooled from three independent experiments). (d) and (e) Calculated Cyclin B1-GFP half-life (0–4.5 min after anaphase onset) and quantified anaphase duration, respectively, in the same control and Subito/Mklp2-depleted S2 cells as in (c). Statistical significance was tested with a nonparametric Mann-Whitney test and an unpaired t-test for data in (d) and (e), respectively.
-
Figure 8—source data 1
Anaphase duration after Subito RNAi.
- https://doi.org/10.7554/eLife.47646.035
Incompletely separated chromosomes positioned near the spindle midzone show the highest Cdk1 activity during anaphase
To directly assess the spatiotemporal properties of Cdk1 activity throughout the cell cycle we next employed Fluorescence Lifetime Imaging Microscopy (FLIM) of an established Fluorescence Resonance Energy Transfer (FRET)-based biosensor for Cyclin B1-Cdk1 activity (Gavet and Pines, 2010) that was targeted to chromatin in Drosophila S2 cells by fusing it to the C-terminus of human histone H2B. The reporter was modified to make it amenable to FLIM by replacing the donor (mCerulean) with mTurquoise2, which exhibits a mono-exponential lifetime, and acceptor (YPet) with mVenus. The FRET pairs flank the auto-phosphorylation site of human Cyclin B1 and the Polo Box Domain (PBD) of Polo-like kinase one such that it undergoes a conformational change when it is phosphorylated by Cdk1 that yields increased FRET in mitosis and decreased FRET in interphase. Importantly, the biosensor was shown to be highly specific for Cyclin B1-Cdk1 and non-responsive to activities of the midzone-enriched kinases Aurora B and Plk1 (Gavet and Pines, 2010). A non-phosphorylatable chromatin-targeted control with alanine substitutions in the substrate sequence was used to confirm that measured changes in donor lifetime and FRET efficiency were due specifically to phosphorylation rather than non-specific changes in conformation between interphase and mitosis. There was not a statistically significant difference in any of the measured donor lifetime parameters (average lifetime, short lifetime, % short lifetime, % long lifetime) between the non-phosphorylatable control sensor in interphase and mitosis or between the non-phosphorylatable control sensor (interphase and mitosis) and the phosphorylatable sensor in interphase (Figure 9—source data 1). Importantly, there were statistically significant differences between the lifetime parameters of the chromatin-targeted phosphorylatable reporter in mitosis versus interphase, most notably the mean donor lifetime decreased from 3.43 ns + /- 0.12 ns (mean + /- S.D.) in interphase to 3.15 ns + /- 0.28 ns in mitosis (includes prophase, prometaphase, and metaphase cells) (Figure 9a, Figure 9—source data 1). The measured decrease in donor lifetime of the sensor on mitotic chromatin is indicative of increased FRET during mitosis. Accordingly, there was a statistically significant increase in the FRET efficiency (E) of the phosphorylatable sensor in mitosis (11.78% + /- 7.89%) relative to interphase (4.12% + /- 3.25%), which was statistically indistinguishable (p>0.05) from the non-phosphorylatable reporter in either interphase or mitosis (Figure 9a, Figure 9—source data 2). Thus, the chromatin bound reporter specifically reports on elevated Cyclin B1-Cdk1 activity in mitosis relative to interphase.
Figure 9
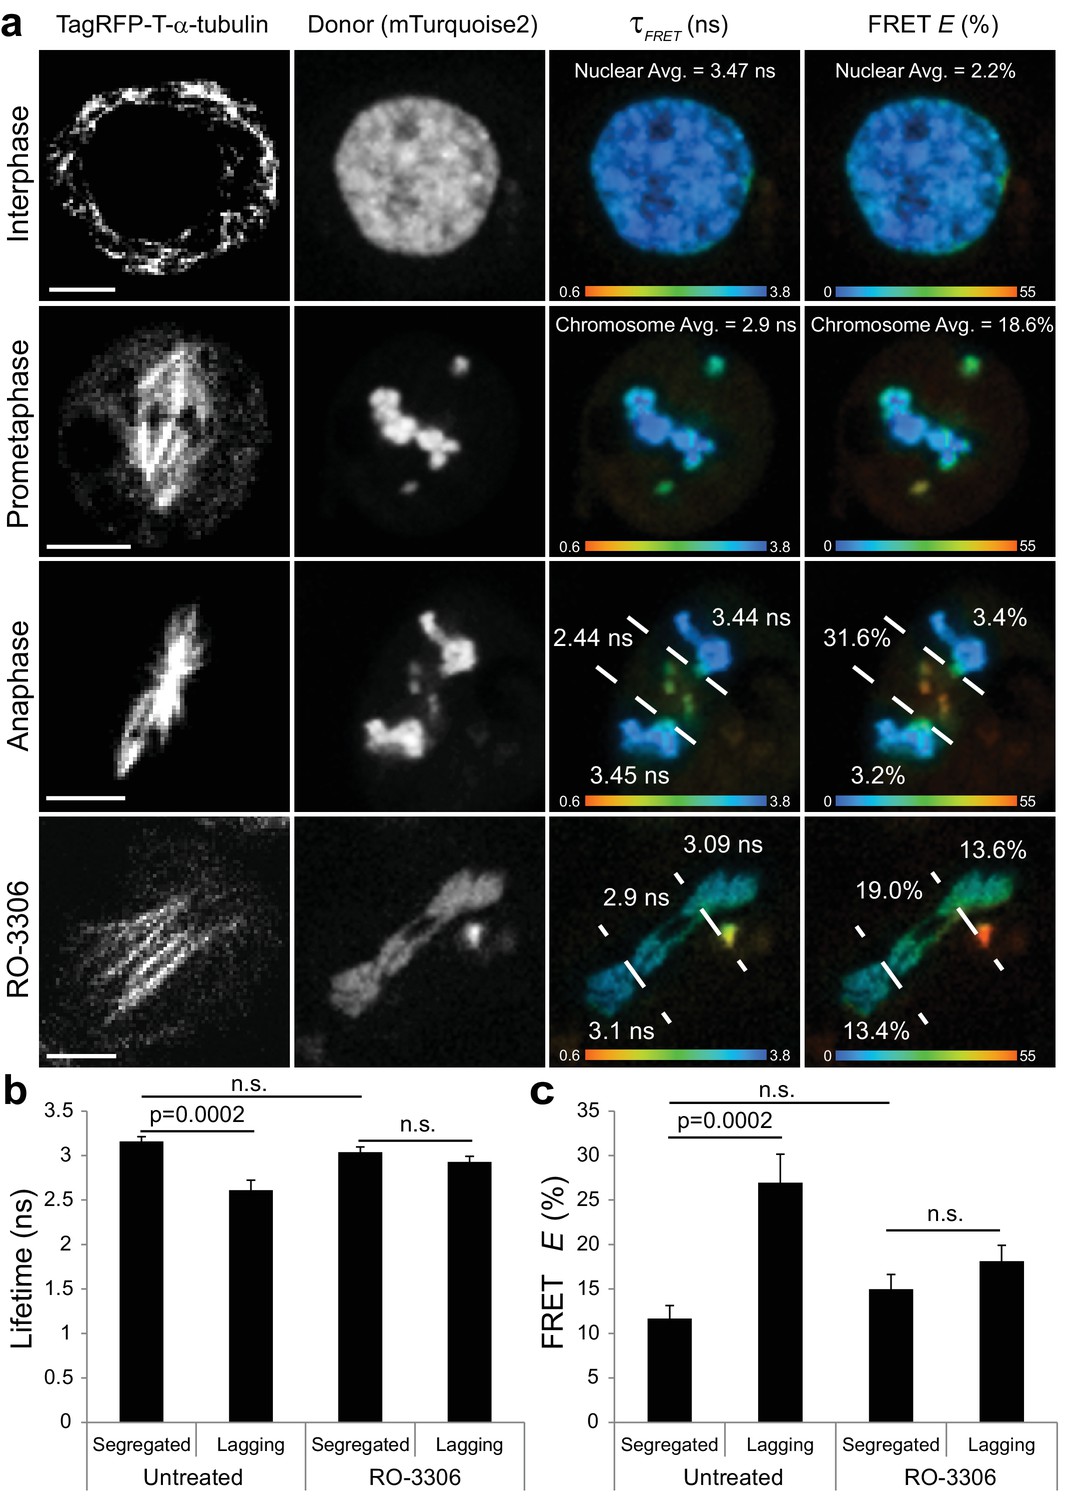
Visualization of a CyclinB1-Cdk1 activity gradient in the vicinity of the midzone during anaphase.
(a) The chromatin targeted reporter exhibits a longer lifetime and lower FRET efficiency in interphase versus prometaphase. The sensor on lagging chromosomes in the vicinity of the midzone MTs, demarcated by the dashed lines, exhibits higher FRET efficiency and shorter donor lifetime than the reporter on the segregated DNA. The activity gradient is no longer evident in the presence of 10 μM RO-3306. (b) Quantification of donor lifetimes for segregated versus lagging chromatin in untreated and RO-3306-treated cells (N = 14 cells for each condition). (c) Quantification of FRET efficiencies for segregated versus lagging chromatin in untreated and RO-3306-treated cells (N = 14 cells for each condition). Error bars are SEM. Scale bars are 5 μm. Color wedges indicate 0.6 ns (blue) – 3.8 ns (red) for donor lifetimes and 0% (blue) to 55% (red) for FRET E. Two-tailed P-values from a Student’s t-test are reported. n.s. is not significant (p>0.05).
-
Figure 9—source data 1
Mean lifetimes, percentage of fluorophores exhibiting short and long lifetimes, and the short lifetimes for the chromatin-targeted Cyclin B1-Cdk1 activity reporter.
Mitotic cells included prophase, prometaphase, and metaphase, but excluded anaphase and telophase/cytokinesis. * indicates p<0.05 relative to the control, non-phosphorylatable FRET reporter in interphase. # indicates p<0.05 relative to the phosphorylatable FRET reporter in interphase. Two-tailed P-values from a Student’s t-test are reported.
- https://doi.org/10.7554/eLife.47646.037
-
Figure 9—source data 2
Mean FRET efficiency statistics of chromatin-targeted Cyclin B1-Cdk1 FRET sensors.
Analysis of mitotic cells includes prophase, prometaphase, and metaphase, but excludes anaphase and telophase/cytokinesis. The active sensor reported increased FRET in mitosis relative to the non-phosphorylatable control in interphase (p<0.001). P-values calculated using the PlotsOfDifferences web app (Goedhart, 2019). N-values reported in the table apply to Figure 9—source data 1.
- https://doi.org/10.7554/eLife.47646.038
Next, we performed FLIM-FRET imaging of the phosphorylatable chromatin-associated reporter in S2 cells with spontaneous lagging chromosomes to measure the spatial properties of CyclinB1-Cdk1 activity during anaphase. Remarkably, there was a statistically significant reduction in the donor lifetime (2.61 ns + /- 0.43 ns) for the sensor on lagging chromosomes in the vicinity of the spindle midzone compared to the donor lifetime (3.16 ns + /- 0.20 ns) on the segregated chromosomes (Figure 9a,b). This corresponds to ~3 fold increase in the FRET E of the sensor on lagging chromosomes (27.0% + /- 12.0%) relative to the FRET E of the reporter on segregated DNA (11.7% + /- 5.5%) (Figure 9a,c). The FLIM-FRET data support the conclusion that there is a gradient of CyclinB1-Cdk1 activity in the vicinity of the midzone during anaphase that locally phosphorylates chromatin bound substrates on incompletely separated chromosomes. We argue that this activity gradient, which is reminiscent of a previously visualized midzone-based gradient of Aurora B kinase activity (Afonso et al., 2014; Fuller et al., 2008), specifically reports on midzone-proximal Cyclin B1-Cdk1 activity rather than that of other midzone-enriched kinases since the sensor is insensitive to inhibition of Aurora B or Plk1 activities (Gavet and Pines, 2010) and the activity gradient was no longer evident on lagging chromosomes/chromatin following addition of the Cdk1 inhibitor RO-3306 (Figure 9A–C).
Experimental reduction of anaphase chromosome motion delays Cyclin B1 degradation and mitotic exit in an Aurora B-dependent manner
Aurora B has been shown to mediate Cyclin B1 phosphorylation in Drosophila germline and human mitotic cells (Kettenbach et al., 2011; Mathieu et al., 2013). As so, we investigated whether Aurora B activity is required for Cyclin B1 degradation during anaphase and consequently mitotic exit in both Drosophila and human cells. First, we monitored Cyclin B1-GFP/Venus levels after acute inhibition of Aurora B activity at anaphase onset by treating S2 and hTERT-RPE1 cells with Binucleine-2 or ZM447439, respectively. We found that inhibition of Aurora B activity did not accelerate Cyclin B1 degradation during anaphase (Figure 10—figure supplement 1a,b). Likewise, acute PP1/PP2A phosphatase inhibition with okadaic acid at anaphase onset did not interfere with normal Cyclin B1 degradation during anaphase (Figure 10—figure supplement 1c). These results are consistent with our previous experiments, which showed that Aurora B inhibition at anaphase onset did not accelerate mitotic exit in both Drosophila and human cells (Afonso et al., 2014). In addition, these data indicate that PP1/PP2A phosphatase activity is not required to regulate Cyclin B1 degradation, namely its centrosomal-associated pool, during anaphase.
In light of the results obtained with our chromosome-targeted Cdk1 FRET sensor, we decided to investigate whether Cyclin B1 degradation during anaphase is a function of chromosome separation. To do so, we slowed down chromosome separation by allowing S2 cells to enter anaphase after a short exposure (less than 15 min) to 10 nM taxol or after depletion of the kinesin-13 KLP10A by RNAi (Afonso et al., 2014; Rogers et al., 2004). We found that, under both conditions, Cyclin B1-GFP degradation during anaphase was significantly delayed (Figure 10a–c,e–g), consistent with the previously reported delay in mitotic exit (Afonso et al., 2014). To test whether the observed delay in Cyclin B1 degradation during anaphase was dependent on Aurora B activity, we acutely inhibited Aurora B with Binucleine-2 specifically at anaphase onset in taxol-treated cells. We found that Aurora B inhibition fully restored normal Cyclin B1 degradation in cells with slower chromosome separation (Figure 10d,f,g). Importantly, the short exposure of cells to 10 nM taxol did not prevent normal Aurora B accumulation at the spindle midzone (Figure 10—figure supplement 2a–c). Overall, these data link chromosome separation to Aurora B-mediated control of Cyclin B1 degradation during anaphase that ultimately licenses mitotic exit.
Figure 10 with 2 supplements see all
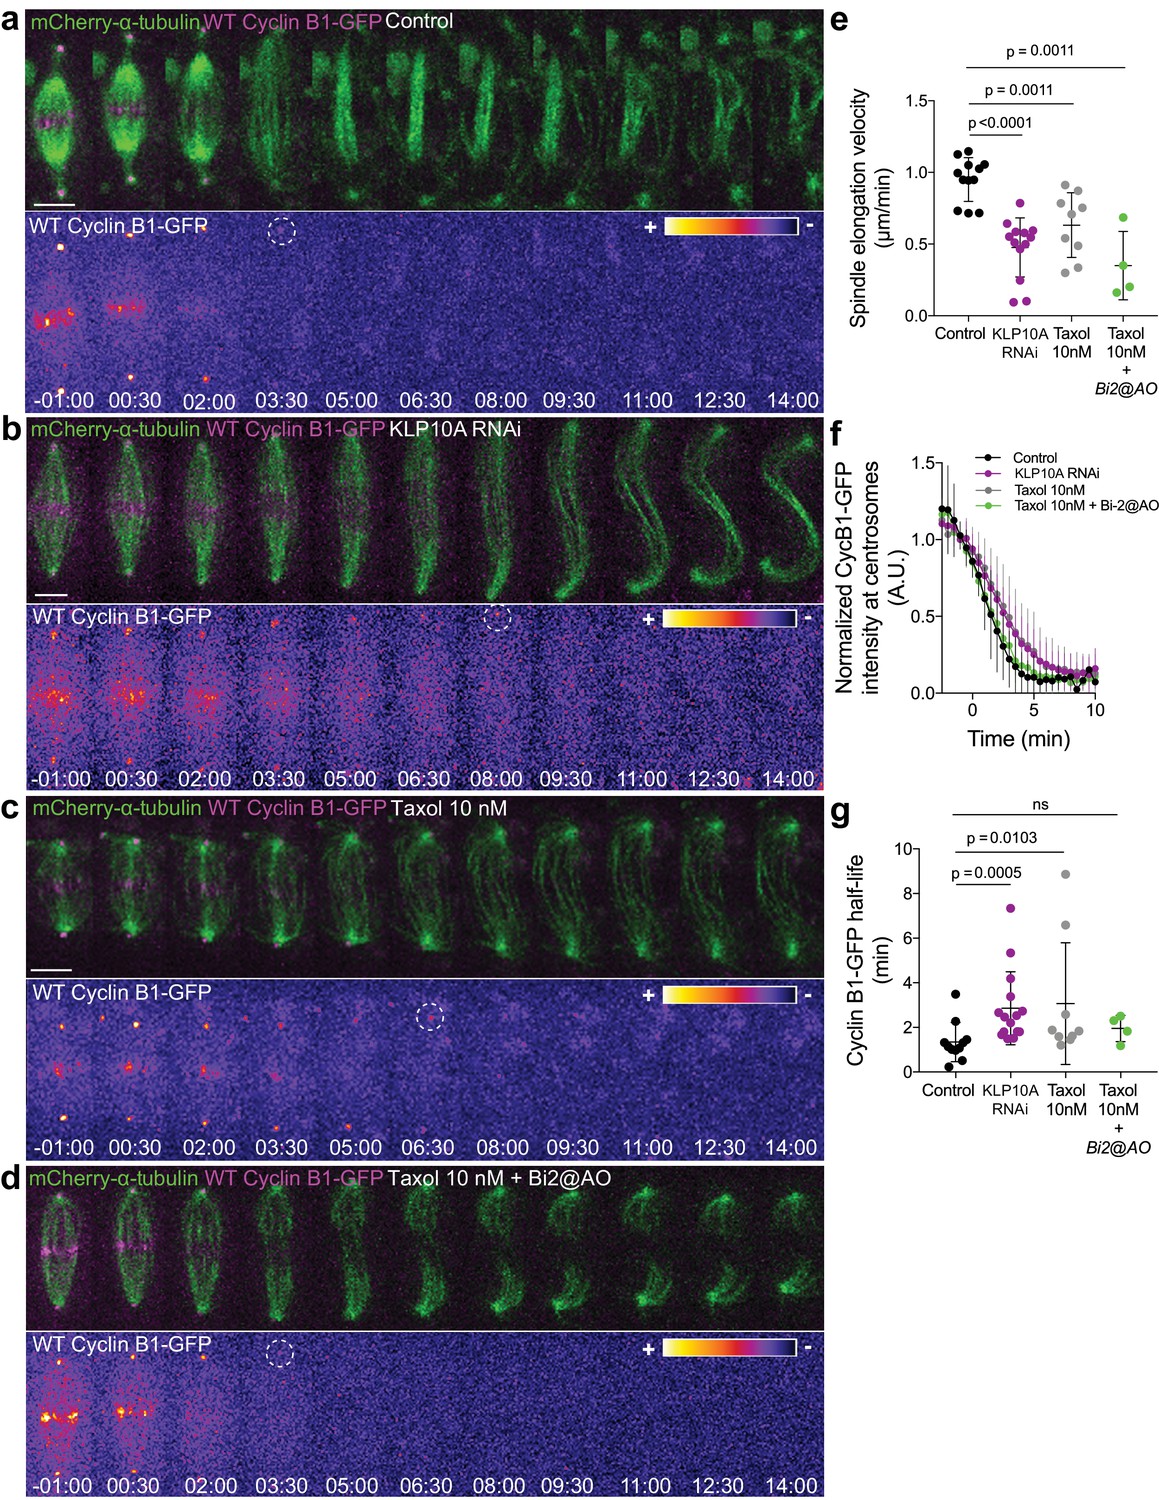
Cyclin B1 degradation during anaphase responds to slow chromosome separation in an Aurora B-dependent manner.
(a) Control S2 cell stably expressing Cyclin B1-GFP/mCherry-α-tubulin. (b) KLP10A depleted S2 cell stably expressing Cyclin B1-GFP/mCherry-α-tubulin. (c) and (d) Examples of S2 cells treated with 10 nM Taxol during metaphase, where Binucleine-2 was added at anaphase onset in the condition shown in (d). For all conditions Cyclin B1 localization is highlighted with LUT ‘fire’ and dashed white circles highlight the frame before Cyclin B1 signal disappearance. Scale bar is 5 μm. Time is in min:sec. (e) Half-spindle elongation velocity in control (n = 11 cells), KLP10A (n = 13 cells, pooled from three independent experiments), 10 nM Taxol (n = 9 cells) and 10 nM Taxol + Binucleine-2 addition at anaphase onset (n = 4 cells). Note the strong impairment of anaphase chromosome separation in all conditions. (f) and (g) Cyclin B1-GFP degradation profile and calculated Cyclin B1-GFP half-life in control (n=11 cells), KLP10A (n=15 cells, pooled from 3 independent experiments), 10 nM Taxol (n=9 cells) and 10 nM Taxol + Binucleine-2 addition at anaphase onset (n=4 cells).
-
Figure 10—source data 1
Cyclin B1-GFP half-life after attenuation of chromosome separation velocity.
- https://doi.org/10.7554/eLife.47646.043
Discussion
Taken together, our work reveals that degradation of B-type Cyclins specifically during anaphase is rate-limiting for mitotic exit among animals that diverged more than 900 million years ago. Most importantly, we show that Cdk1 activity during anaphase is a function of chromosome separation and is spatially regulated by Aurora B localization and activity at the spindle midzone. In concert with previous work (Afonso et al., 2014), our findings unveil an unexpected crosstalk between molecular ‘rulers’ (Aurora B) and ‘clocks’ (B-type Cyclins-Cdk1) that ensures that cells only exit mitosis after proper chromosome separation during anaphase, consistent with the previously proposed chromosome separation checkpoint hypothesis (Afonso et al., 2014; Maiato et al., 2015). An Aurora B-dependent spatial control mechanism regulating normal NER in human cells has been recently confirmed (Liu et al., 2018). However, nuclear envelope defects associated with incomplete chromosome separation during anaphase (namely, anaphase lagging chromosomes due to mitotic errors) were proposed as an inevitable pathological condition. The present work provides yet additional evidence for a molecular network operating during anaphase that promotes chromosome segregation fidelity by controlling mitotic exit in space and time (Figure 11). According to this model, APC/CCdc20 mediates the initial degradation of Cyclin B1 during metaphase under SAC control. The consequent decrease in Cdk1 activity as cells enter anaphase targets Aurora B to the spindle midzone (via Subito/Mklp2/kinesin-6); Aurora B at the spindle midzone (counteracted by PP1/PP2A phosphatases on chromatin [Vagnarelli et al., 2011]) establishes a phosphorylation gradient that locally delays APC/CCdc20- and APC/CCdh1-mediated degradation of residual Cyclin B1 (and possibly B3) at the spindle midzone, at least in Drosophila cells. Localization experiments in human cells suggest that Cdk1 itself might be enriched at the spindle midzone. Consequently, as chromosomes separate and move away from the spindle midzone, Cdk1 activity decreases, allowing the PP1/PP2A-mediated dephosphorylation of Cdk1 and Aurora B substrates (e.g. Lamin B and Condensin I) necessary for mitotic exit. This model is consistent with the recent demonstration that Cdk1 inactivation promotes the recruitment of PP1 phosphatase to chromosomes to locally oppose Aurora B phosphorylation (Qian et al., 2015) and recent findings in budding yeast demonstrating equivalent phosphorylation and dephosphorylation events during mitotic exit (Touati et al., 2018). It is also consistent with a premature Greatwall inactivation and PP2A:B55 reactivation that would be predicted after acute Cdk1 inactivation during anaphase (Cundell et al., 2013; Cundell et al., 2016). Most important, this model provides an explanation for the coordinated action of two unrelated protein kinases that likely regulate multiple substrates required for mitotic exit (Afonso et al., 2017; Kettenbach et al., 2011; Petrone et al., 2016).
Figure 11

A crosstalk between molecular ‘rulers’ (Aurora B) and ‘clocks’ (Cdk1) licenses mitotic exit only after proper chromosome separation.
APC/CCdc20 mediates the initial degradation of Cyclin B1 as chromosome align at the spindle equator and cells enter anaphase under SAC control. The consequent decrease in Cdk1 activity as cells enter anaphase targets Aurora B to the spindle midzone (via Subito/Mklp2/kinesin-6); Aurora B at the spindle midzone (counteracted by PP1/PP2A phosphatases on chromatin) establishes a phosphorylation gradient that locally delays APC/CCdc20- and APC/CCdh1-mediated degradation of residual Cyclin B1, and possibly Cdk1, at the spindle midzone. Consequently, as chromosomes separate and move away from the spindle midzone, Cdk1 activity decreases, allowing the PP1/PP2A-mediated dephosphorylation of Cdk1 and Aurora B substrates (e.g. Lamin B and Condensin I) necessary for mitotic exit.
Previous landmark work has carefully monitored the kinetics of Cyclin B1 degradation in living human HeLa and rat kangaroo Ptk1 cells during mitosis, and concluded that Cyclin B1 was degraded by the end of metaphase, becoming essentially undetectable as cells entered anaphase (Clute and Pines, 1999). However, we noticed that, consistent with our findings, a small pool of Cyclin B1 continued to be degraded during anaphase in Ptk1 cells (Clute and Pines, 1999). Subsequent work investigating cellular response to anti-mitotic drugs has also shown that human DLD-1 cells undergoing normal mitosis entered anaphase with as much as 32% of Cyclin B1 compared to metaphase levels (Gascoigne and Taylor, 2008), suggesting that human cells enter anaphase with significant Cdk1 activity. Indeed, quantitative analysis with a FRET biosensor in human HeLa cells also revealed residual Cdk1 activity during anaphase (Gavet and Pines, 2010). However, the significance of persistent Cdk1 activity for the control of anaphase duration and mitotic exit was not investigated in these original studies. Previous works also clearly demonstrated that forcing Cdk1 activity during anaphase through expression of non-degradable Cyclin B1 (and Cyclin B3 in Drosophila) prevents chromosome decondensation and NER (Parry and O'Farrell, 2001; Wheatley et al., 1997; Wolf et al., 2006). However, while these works suggested the existence of different Cyclin B1 thresholds that regulate distinct mitotic transitions, expression of non-degradable Cyclin B1 could be interpreted as an artificial gain of function that preserves Cdk1 activity during anaphase. For example, it was shown that expression of non-degradable Cyclin B1 during anaphase ‘reactivates’ the SAC, inhibiting APC/CCdc20 (Clijsters et al., 2014; Rattani et al., 2014; Vázquez-Novelle et al., 2014). Our work demonstrates in five different experimental systems, from flies to humans, including primary tissues, that Cdk1 activity persists during anaphase and is rate-limiting for the control of mitotic exit. Failure to degrade B-type Cyclins during anaphase blocked cells in an anaphase-like state with separated sister chromatids that remained condensed for several hours, whereas complete Cdk1 inactivation in anaphase triggered chromosome decondensation and NER. Importantly, if a positive feedback loop imposed by phosphatases was sufficient to drive mitotic exit simply by reverting the effect of Cdk1 phosphorylation prior to anaphase, cells would exit mitosis regardless of the remaining pool of B-type Cyclins that sustains Cdk1 activity during anaphase. The main conceptual implication of these findings is that, contrary to what was previously assumed, mitotic exit is determined during anaphase and not at the metaphase-anaphase transition under SAC control.
Our model also implies that persistent Cyclin B1-Cdk1 in anaphase is spatially regulated by a midzone Aurora B gradient. Indeed, we were able to identify a residual pool of Cyclin B1-Cdk1 enriched at the spindle midzone and midbody and showed that this localization was dependent on Aurora B activity and localization at the spindle midzone. Interestingly, human Cyclin B2 (which contains a recognizable KEN box), as well as Cdk1, were identified at the midbody and Cdk1 inactivation during late mitosis was required for the timely completion of cytokinesis in human cells (Capalbo et al., 2019; Mathieu et al., 2013). Thus, it is possible that in human cells, Cdk1 activity during anaphase is regulated not only by Cyclin B1, but also by Cyclin B2. Importantly, this model predicted the existence of a midzone-centered Cdk1 activity gradient during anaphase, which we confirmed experimentally by targeting a FRET reporter of Cdk1 activity to chromosomes.
Finally, our experiments indicate that Aurora B activity regulates Cyclin B1 homeostasis and consequently anaphase duration in the presence of incompletely separated chromosomes. One possibility is that direct Cyclin B1 phosphorylation by Aurora B (Kettenbach et al., 2011; Mathieu et al., 2013) spatially regulates Cyclin B1 degradation during anaphase, mediated by both APC/CCdc20 and APC/CCdh1. Another non-mutually exclusive possibility is that Aurora B indirectly controls Cyclin B1 during anaphase by regulating APC/CCdc20 and/or APC/CCdh1 activity, as recently shown for Cdk1 (Fujimitsu et al., 2016; Zhang et al., 2016). Future work will be necessary to test these hypotheses.
In conclusion, we uncovered an unexpected level of regulation at the end of mitosis in metazoans and reconciled what were thought to be antagonistic models of mitotic exit relying either on molecular ‘clocks’ or on ‘rulers’. These findings have profound implications to our fundamental understanding of how tissue homeostasis is regulated, perturbation of which is a hallmark of human cancers.
Materials and methods
Key resources table
| Reagent type (species) or resource | Designation | Source or reference | Identifiers | Additional information |
|---|---|---|---|---|
| Genetic reagent (Drosophila) | CycB1-GFP | Buszczak et al., 2007 | genotype: w; P{PTT-GC}ycBCC01846; P{His2Av-mRFP}/+ | |
| Biological sample (mice) | Oocytes from CD-1 mice | Charles River Laboratories | RRID:MGI:5652464 | |
| Cell line (Drosophila) | S2-U | Gohta Goshima | ||
| Cell line (Drosophila) | S2 H2B-GFP/mCherry-α-tubulin | Afonso et al., 2014 | ||
| Cell line (Drosophila) | S2 Lamin B-GFP/mCherry-α-tubulin | Afonso et al., 2014 | ||
| Cell line (Drosophila) | S2 KEN-Cyclin B1-GFP/mCherry-α-tubulin | This work | ||
| Cell line (Drosophila) | S2 GFP-Aurora B/WT-Cyclin B1-mCherry | This work | ||
| Cell line (Human) | HeLa Cyclin B1-venus | Jonathon Pines | ||
| Cell line (Human) | U2OS | Afonso et al., 2014 | ||
| Cell line (Human) | hTERT-RPE1 Cyclin B1-venus | Jonathon Pines | ||
| Plasmid for mRNA synthesis (mouse) | Cyclin B1-mCherry | Pasternak et al., 2016 | ||
| Transfected construct (Drosophila) | pMT-GFP-Aurora B | Afonso et al., 2014 | ||
| Transfected construct (Drosophila) | non-degradable Cyclin B1-GFP | Afonso et al., 2014 | ||
| Transfected construct (Drosophila) | WT Cyclin B1-GFP | Mathieu et al., 2013 | ||
| Transfected construct (Drosophila) | KEN Cyclin B1-GFP | This work | ||
| Antibody | rabbit polyclonal anti Drosophila Cyclin B1 | James Wakefield | 1:2500 | |
| Antibody | mouse monoclonal anti Human Aurora B | Aim1, BD Biosciences | RRID:AB_2227708 | 1:500 |
| Antibody | rabbit polyclonal anti Drosophila Cenp C | Claudio Sunkel | 1:10000 | |
| Antibody | mouse monoclonal anti-α-tubulin (B-512 clone) | Sigma | 1:2000 | |
| Antibody | Alexa-Fluor secondary antibodies | Thermo Fisher | 1:2000 | |
| Commercial assay or kit | site-directed mutagenesis kit | Agilent | ||
| Chemical compound, drug | RO3306 | Sigma | 10 μM | |
| Chemical compound, drug | Binucleine-2 | Sigma | 40 μM | |
| Chemical compound, drug | ZM447439 | Tocris Bioscience | 4–5 μM | |
| Chemical compound, drug | MG132 | Merck | 20 μM | |
| Chemical compound, drug | Apcin | Tocris Bioscience | 200 μM | |
| Chemical compound, drug | pro-TAME | Boston Biochem | 6.3 μM | |
| Chemical compound, drug | SiR-DNA | Spirochrome | 50 nM (Human cells) and 80 nM (Drosophila) | |
| Chemical compound, drug | Sir-TUB | Spirochrome | 20 nM | |
| Software, algorithm | Prism V8 | Graphpad | RRID:SCR_002798 | |
| Software, algorithm | Fiji | ImageJ/Fiji | RRID:SCR_002285 | |
| Software, algorithm | Matlab | The MathWorks | RRID:SCR_001622 |
Cell culture
Request a detailed protocolDrosophila S2 cells were cultured in Schneider medium supplemented with 10% FBS and grown at 25°C. For live imaging cells were plated 2–3 hr before imaging in MatTek dishes (MatTek Corporation) pre-coated with 0.25 mg/ml concanavalin A. Human U2OS and HeLa cells were cultured in DMEM supplemented with 10% FBS and grown in a 5% CO2 atmosphere at 37°C. hTERT-RPE1 cells were grown in DMEM/F12 medium supplemented with 10% FBS. For all human cell lines, culture medium was changed to L-15 supplemented with 10% FBS 4–5 hr before live imaging. All cell lines used were free from mycoplasma contaminations as inferred by routine tests in a certified laboratory.
Drug treatments
Request a detailed protocolFor acute inhibition of Cdk1 in S2 and U2OS cells the Cdk1 inhibitor RO3306 (Sigma) was added in metaphase or at anaphase onset, depending on the experimental set-up, at final concentration of 10 μM. Binucleine-2 (Sigma) was used to acutely inhibit Aurora B activity in Drosophila S2 cells at a final concentration of 40 μM in all experiments. BI2536 (Axon MedChem) was used in Drosophila cells at a final concentration of 100 nM. To reduce anaphase poleward chromosome segregation velocity, Drosophila S2 cells were incubated with 10 nM taxol (Sigma) prior to live imaging. For the live MG132 (Calbiochem) assay in Drosophila S2 cells, metaphase cells grown in the absence of the drug were selected in a multipoint set-up and MG132 was added after the first round of acquisition (5 min), at a final concentration of 20 μM. Cells that entered anaphase in a time window between 30 and 60 min after drug addition became arrested in anaphase, while the remaining cells became arrested in metaphase. MG132 addition at anaphase onset had no effect on the anaphase-telophase transition, likely due to a slower uptake of the drug in S2 cells. For the MG132 assay in U2OS and hTERT-RPE1 cells, MG132 was added 1–2 min before or at anaphase onset also at a final concentration of 20 μM. Drug addition 1–2 min after anaphase onset in U2OS or hTERT-RPE1 cells had no effect on anaphase duration. APC/C inhibition at anaphase onset on hTERT-RPE1 cells was achieved with a combination of both pro-TAME (Boston Biochem) and Apcin (Tocris Bioscience) used at final concentrations of 6.3 μM and 200 μM, respectively, as previously reported (Sackton et al., 2014). Similarly to MG132 treatment, APC/C inhibition 1–2 min after anaphase onset, or individual treatment with each drug showed a mild or no effect. APC/C inhibition in Drosophila cells was achieved by addition of Apcin at anaphase onset at a final concentration of 200 μM. ZM447439 (Tocris Bioscience) was used at 4 μM to inhibit Aurora B in U2OS cells and 5 μM for Aurora B inhibition at anaphase onset on hTERT-RPE1 cells. SiR-DNA (Spirochrome) was used at a final concentration of 80 nM in Drosophila S2 cells and 50 nM in hTERT-RPE1 cells and incubated 30–60 min prior to imaging. SiR-Tubulin (Spirochrome) was used at a final concentration of 20 nM and incubated 30–60 min prior to imaging.
Immunofluorescence microscopy
Request a detailed protocolDrosophila S2 cells were grown in coverslips previously pre-coated with 0.25 mg/ml concanavalin A. hTERT-RPE1 control and Mklp2-depleted cells were plated on glass coverslips. Cells were fixed with 4% PFA for 10 min, permeabilized with 0.3% Triton diluted in PBS for 10 min and washed 3 × 5 min with PBS-Tween. Primary antibodies used were mouse anti-α-tubulin (1:2000; B-512 clone, Sigma); rabbit anti-Cyclin B1 (gift from James Wakefield, University of Exeter); mouse anti-Aurora B (1:500, Aim1, BD Biosciences) and rabbit anti-Cenp C (gift from Claudio Sunkel, i3S, University of Porto, Portugal). Corresponding Alexa-Fluor secondary antibodies were used at 1:2000. Fixed images from Figure 1—figure supplement 1 were obtained on an inverted Zeiss 780 confocal microscope with a 63x oil immersion objective. Fixed images from Figure 1—figure supplement 3e and f were obtained on an AxioImager Z1 with a 63x, plan oil differential interference contrast objective lens, 1.4 NA (from Carl Zeiss), equipped with a charge-coupled device (CCD) camera (ORCA-R2; Hamamatsu Photonics). Forced mitotic exit was achieved by a 10 min incubation with 10 μM RO3306 before fixation.
Constructs
Request a detailed protocolThe pMT-GFP-Aurora B and the non-degradable Cyclin B1-GFP were described previously (Afonso et al., 2014). The non-degradable Cyclin B3 construct was a gift from Christian F. Lehner (University of Zurich, Switzerland). The KEN-box mutant was generated in the pMT-Cyclin B1-GFP plasmid using a site-directed mutagenesis kit (Agilent), following the manufacturer's instructions. The following primers were used for mutagenesis: Fw: 5’-ggacattgatgccaatgacgcggcgaacctggtactggtctcc-3’ and Rv 5’- ggagaccagtaccaggttcgccgcgtcattggcatcaatgtcc-3’. To make the chromatin targeted FLIM-FRET sensor, DNA encoding the polo box domain (PBD) of polo like kinase 1 (Plk1), a 15 amino acid linker domain, and 16 amino acid recognition sequence containing the CyclinB1-Cdk1 auto-phosphorylation sites from human CyclinB1 was amplified by PCR from a previously generated CyclinB1-Cdk1 FRET sensor (Gavet and Pines, 2010), Addgene plasmid #2327) with a 5’ SpeI site and 3’ NotI site. The resulting PCR product was inserted by Gibson cloning between mTurquoise2 (FRET donor) and mVenus (FRET acceptor) in a pMT/V5 His-B vector backbone (Invitrogen) containing the CENP-C promotor inserted between the first XbaI site and the KpnI site and the human histone H2B gene inserted at the KpnI site downstream of the CENP-C promoter. The mTurquoise2 gene was positioned after the human histone H2B gene between KpnI and SpeI, while the mVenus gene with a stop codon was inserted between the NotI and SacII sites. To generate the non-phosphorylatable chromatin-targeted FRET sensor, the same construct was generated but using Addgene plasmid #2328 (Gavet and Pines, 2010) in which the codons for the phospho-serine residues were replaced with codons for alanines. The resulting constructs are well-suited for FLIM analysis due to the fact that mTurquoise2 exhibits a mono-exponential decay in its lifetime.
Cell lines, transfections, and RNAi
Request a detailed protocolThe H2B-GFP/mCherry-α-tubulin and Lamin B-GFP/mCherry-α-tubulin stable cell lines have been previously described (Afonso et al., 2014). The WT-Cyclin B1-GFP/mCherry-α-tubulin, KEN-Cyclin B1-GFP/mCherry-α-tubulin and GFP-Aurora B/WT-Cyclin B1-mCherry stable cell lines were established using Effectene (Qiagen) according to the manufacturer's instructions. For visualization of WT-Cyclin B1-GFP, WT-Cyclin B1–mCherry and GFP-Aurora B signals 250 μM of CuSO4 was added to the medium overnight (8–12 hr) to induce expression from a metallothionein promoter. With this copper concentration, we obtained a mild expression of the constructs without any detectable impact on mitotic progression. Aurora B overexpression was achieved by adding 1 mM of CuSO4 instead of 250 μM for the same incubation period. The chromatin-targeted CyclinB1-Cdk1 FRET reporter was co-transfected with TagRFP-T-α-tubulin and selected with Blasticidin and then Hygromycin (Life Technologies). Some FLIM data were acquired from transiently transfected cells prior to selection and from stable cell lines that had been incubated overnight with 500 μM CuSO4, which still induced moderate expression even with the CENP-C promoter in place. The HeLa and hTERT-RPE1 Cyclin B1-Venus cell lines (Collin et al., 2013) were a kind gift from Jonathon Pines (Institute of Cancer Research, UK). The H2B-mRFP expression construct for human cells was obtained from Addgene (#26001), transfected to 293 T cells to produce viruses and infect HeLa Cyclin B1-Venus expressing cells to generate a stable cell line. The human Cdk1-GFP construct was obtained from Origene (#RG200495) and transiently transfected into HeLa cells using Lipofectamin 2000 (Invitrogen) following the manufacturer's instructions. The H2B-GFP/mCherry-α-tubulin U2OS cell line, the KLP10A and the Subito/Mklp2 RNAi in Drosophila S2 cells were previously described (Afonso et al., 2014). Fzr RNAi in Drosophila S2 cells was achieved after two rounds of RNAi treatment for a total of 7 days. The following primers were used for dsRNA synthesis: 5’-taatacgactcactatagggcaccggataatcaatacttggc-3’ and 5’-taatacgactcactatagggattcagaacggacttgttctcc-3’. Mklp2 depletion in hTERT-RPE1 cells was achieved 72 hr after transfection of siRNA oligonucleotides using Lipofectamine RNAiMAX (Invitrogen) following the manufacturer's instructions. The oligonucleotide sequence used was: 5’- AACGAACUGCUUUAUGACCUA-3’.
Time-lapse microscopy
Request a detailed protocolLive imaging data in Figure 2 and Figure 2—figure supplement 1 were obtained from a spinning disc confocal system (Andor Technology, South Windsor, CT) equipped with an electron multiplying CCD iXonEM+ camera and a Yokogawa CSU-22 U (Yokogawa Electric, Tokyo) unit based on an Olympus IX81 inverted microscope (Melville, NY). Two laser lines (488 and 561 nm) were used for near simultaneous excitation of GFP and mCherry/mRFP and the system was driven by Andor IQ software. Time-lapse image stacks of 0.8 μm steps were collected every 30 s, with a Plan- APO 100x/1.4 NA oil objective, with the exception of the experiments in Figure 2—figure supplement 1 where image stacks were obtained every 60 s. Live imaging data in all other figures, except the FLIM experiments, were acquired in a temperature-controlled Nikon TE2000 or a Ti microscope, both equipped with a Yokogawa CSU-X1 spinning-disc head, imaged on an Andor iXon+ DU-897E EM-CCD. Excitation comprises three lasers (488 nm, 561 nm and 647 nm) that were shuttered by an acousto-optic tunable filter (TE2000) or electronically (Ti). Sample position was controlled via a SCAN-IM Marzhauser stage and a Physik Instrumente 541.ZSL piezo (TE2000) or via a Prior Scientific ProScan stage (Ti). Imaging of Drosophila S2 cells was performed with a 100x Plan-Apo DIC CFI Nikon objective in all experiments. Imaging of human cells and the Drosophila follicular epithelium was done with an oil-immersion 60 × 1.4 NA Plan-Apo DIC CFI (Nikon, VC series). Imaging of the mouse oocytes was performed either with a 60 × 1.27 NA CFI Plan-Apo IR water-immersion objective (Nikon) or a 40 × 1.30 NA Plan-Fluor oil-immersion objective (Nikon). Images were acquired with a 1 µm z-stack and 30 s time-lapse interval for all live imaging experiments in Drosophila S2 cells, Drosophila follicular epithelium and human cells. Mouse oocytes were acquired with a 4 µm z-stack and a 2 min time interval. Data from Figures 3 and 6 were obtained with a 5 min time interval and data from Figure 4 were obtained with a 1 min time interval. A temperature-controlled chamber was set up to 25°C for Drosophila live imaging or to 37°C for live imaging of human cells and mouse oocytes.
Live-cell FLIM-FRET
Request a detailed protocolCells were imaged on a Nikon TiE A1R Spectral Detector Confocal with time-correlated FLIM at the UMass Amherst Institute for Applied Life Science Light Microscopy Facility using the 1.45 NA 100x oil immersion objective lens (Nikon). Time-correlated single photon counting (TCSPC) was conducted using two HPM-100–40 detectors (Becker and Hickl) and a 50 mHz pulsed 445 nm laser (BDL-445-SMN). Cells were identified by eye under wide-field fluorescence on the RFP channel. To collect FLIM data, the 445 nm pulsed diode laser (Becker and Hickl) was set to 50% laser power, and 40–50 million photons were detected per scan. NIS-Elements (Nikon) was used to control the microscope hardware, SPCM64 (Becker and Hickl) was used for FLIM acquisition, and SPCImage (Becker and Hickl) was used for FLIM analysis.
FLIM analysis
Request a detailed protocolFLIM analysis was conducted in SPCImage software to determine values for the fluorescence lifetime (), the short lifetime, % short lifetime, % long lifetime, and FRET efficiency (E). FRET efficiency can be calculated using the equation:
Where is the lifetime of the donor under non FRET conditions, which was measured to be 3573.2 picoseconds in Drosophila S2 cells expressing mTurquoise2 in the absence of any acceptor under the same conditions used in the experiments. This value was fixed for the long lifetime when conducting 2-exponential fits in SPCImage to yield - the lifetime of the donor under possible FRET conditions. Fitting the data with a 2-exponential decay also provides values for the short lifetime, % short lifetime (indicative of the % of sensor engaged in FRET), and % long lifetime (indicative of the % of sensor not engage in FRET). Decay matrices were generated to display color images of either fluorescence lifetimes or FRET efficiencies. For quantifying lagging and segregated chromatin, the donor lifetime and FRET efficiencies were quantified by drawing an ROI around chromatin in the vicinity of the midzone for lagging chromatin and compared to the average of the lifetime and FRET efficiencies of the two masses of segregated chromosomes. To assess the contribution of Cdk1, cells were imaged between 5-40 min following the addition of 10 μM RO-3306 (Santa Cruz Biotechnology).
Drosophila strains and egg chamber preparation
Request a detailed protocolFlies homozygous for the eGFP protein trap insertion into CycB1 loci (CC01846 [Buszczak et al., 2007]) and expressing His2Av-mRFP (genotype: w; P{PTT-GC}CycBCC01846; P{His2Av-mRFP}/+) were generated to image Cyclin B1 expression at endogenous levels while monitoring mitotic progression. Drosophila egg chambers were dissected and mounted in the gas-permeable oil 10S VOLTALEF (VWR chemicals) for live imaging.
In vitro culture and micro-injection of mouse oocytes
Request a detailed protocolAll mice were maintained in a specific pathogen-free environment according to the Portuguese animal welfare authority (Direcção Geral de Alimentação e Veterinária) regulations and the guidelines of the Instituto de Investigação e Inovação em Saúde animal facility. Oocytes were isolated from ovaries of 7–10 week old CD-1 mice, cultured in M2 medium under mineral oil and matured to metaphase II in vitro for 16 hr at 37°C. Oocytes were then microinjected with mRNA encoding Cyclin B1-mCherry (Pasternak et al., 2016) using an electric-assisted microinjection system (FitzHarris et al., 2018). A function generator (GW Instek AFG-2005) was used to produce electrical current instead of an intracellular electrometer. Oocytes were then transferred to M2 medium supplemented with SiR-DNA (500 nM, Spirochrome) and allowed to express the mRNA for 4–6 hr. Oocytes were then induced parthenogenically by rinsing into calcium-free M2 medium with 10 mM strontium chloride, and imaged. mRNA in vitro transcription pGEMHE-CyclinB1-mCherry (Pasternak et al., 2016) was a kind gift from Melina Schuh (Max-Planck Institute for Biophysical Chemistry). The plasmid was linearised, and capped mRNA was synthesized using the T7 ARCA mRNA kit (New England Biolabs) according to the user’s manual and resuspended in water. The final concentration of mRNA in the injection needle was 400 ng/µl.
Definition of mitotic exit
Request a detailed protocolMitotic exit was defined either by the moment of NER or chromosome decondensation. When a nuclear envelope marker was present (ex: Lamin B in Figure 2) mitotic exit was defined as the first frame of appearance of Lamin B in the nascent nucleus. In experiments where cells expressed mCherry-α-tubulin, NER was determined based on the first frame where soluble mCherry-α-tubulin was excluded from the main nucleus. In those cases where mCherry-α-tubulin was not present, SiR-DNA was used instead and visual inspection of DNA decondensation was used to define mitotic exit.
Quantification of Cyclin B1 decay during anaphase
Request a detailed protocolImage processing and quantification was performed using Fiji. Data from Drosophila S2 in Figures 3e and 5d and h, 8 c, 10 f and Figure 1—figure supplement 2d, Cyclin B1 were measured with a constant circular ROI around the centrosomes. This resulted in more robust measurements, which were less prone to fluorescence fluctuations in the cytoplasm. This was essential to detect differences in the Cyclin B1 decay in the different conditions tested. Exceptionally, and to compare Cyclin B1 levels in Drosophila and human cells, in Figure 1c total Cyclin B1-GFP fluorescence intensity was measured using an ROI defined by the limits of the cell. Cyclin B1 levels from Figure 7e,g and Figure 7—figure supplement 1 were measured with a constant rectangular ROI defined by the size of the metaphase plate before cells entered anaphase. This size and position was maintained to measure the intensity of Cyclin B1 that localized at the spindle midzone in control cells and after Cdk1 addition. Note that with the same ROI in Figure 7—figure supplement 1c both Cyclin B1 and Aurora B intensities were measured. Data from human cells from Figures 1c and 6f and Figure 1—figure supplement 3, total Cyclin B1 were measured with an ROI defined by the limits of the cell. In both cases, the ROI was used to manually track the centrosome/midzone/cell over time. Images were maximum intensity projected and background was measured for all time points with the same ROI used for Cyclin B1 measurements in a region outside the cell. The background levels were subtracted from the absolute intensity values. In the Drosophila follicular epithelium Cyclin B1 levels were measured in sum-intensity Z projections, using a circular ROI that was manually tracked in an homogeneous cytoplasmic region (free of accumulated Cyclin B1 at microtubules or centrosomes) of dividing cells. Background was measured with the equivalent ROI in G1 phase cells (identified by undetectable Cyclin B1-GFP expression) within the same egg chamber, and subtracted to dividing cells to establish the baseline background value. In mouse oocytes, Cyclin B1 was measured using a ROI placed manually into the center of the oocyte, background levels were measured in a ROI outside the cell and used for subtraction from the mean cytoplasmic intensity. Images were sum-intensity Z projected.
Calculation of Cyclin B1 half-life
Request a detailed protocolThe half-life of Cyclin B1-GFP or Cyclin B1-Venus was calculated based on the formula
where t is the time interval, n(0) is the background subtracted Cyclin B1-GFP fluorescent intensity at anaphase onset and n(t) is the background subtracted Cyclin B1-GFP fluorescent intensity at time 4.5 min or 6.5 min after anaphase onset, as indicated in the figure legends.
Statistical analysis
Request a detailed protocolNormality of the samples was determined with a D’Agostino and Pearson test. Statistical analysis for two-sample comparison, with normal or non-normal distribution, was performed with a t-test or Mann-Whitney test, respectively. P value was considered extremely significant if p<0.0001 or p<0.001, respectively, very significant if 0.001 < P < 0.01 and significant if 0.01 < P < 0.05. In all plots error bars represent standard deviation, unless indicated otherwise. All statistical analysis was performed with GraphPad Prism V8 (GraphPad Software, Inc), except the calculation of P-values in the FLIM experiments, which used the PlotsOfDifferences web app (Goedhart, 2019).
Sample size and replicates
Request a detailed protocolThe sample size was not statistically determined. Whenever possible a minimum of n = 10 was analyzed, however, in cases where the data obtained were highly consistent an n < 10 was considered. For RNAi-mediated depletion experiments at least two independent RNAi experiments were prepared and imaged. Statistical differences between independent RNAi experiments were analyzed, and whenever sample size was not large enough cells from independent experiments were pulled all together and statistical analysis was performed on the entire population. For drug addition experiments each cell was considered an independent experiment and a minimum of 4 or more cells were imaged for each condition.
Code availability
Request a detailed protocolMatlab based custom routines were used for the generation of kymographs. The Source Code File is provided as supplementary information.
Data availability
Request a detailed protocolAll data generated or analyzed during this study are included in this published article (and its supplementary information files).
Data availability
All data generated or analysed during this study are included in the manuscript and supporting files.
References
-
Late mitotic functions of Aurora kinasesChromosoma 126:93–103.https://doi.org/10.1007/s00412-016-0594-5
-
Distinct sequence elements of cyclin B1 promote localization to chromatin, centrosomes, and kinetochores during mitosisMolecular Biology of the Cell 18:4847–4858.https://doi.org/10.1091/mbc.e06-06-0539
-
Kinesin 6 family member subito participates in mitotic spindle assembly and interacts with mitotic regulatorsJournal of Cell Science 119:4770–4780.https://doi.org/10.1242/jcs.03235
-
Temporal and spatial control of cyclin B1 destruction in metaphaseNature Cell Biology 1:82–87.https://doi.org/10.1038/10049
-
The spindle assembly checkpoint works like a rheostat rather than a toggle switchNature Cell Biology 15:1378–1385.https://doi.org/10.1038/ncb2855
-
A PP2A-B55 recognition signal controls substrate dephosphorylation kinetics during mitotic exitThe Journal of Cell Biology 214:539–554.https://doi.org/10.1083/jcb.201606033
-
Aurora B couples chromosome alignment with anaphase by targeting BubR1, Mad2, and Cenp-E to kinetochoresThe Journal of Cell Biology 161:267–280.https://doi.org/10.1083/jcb.200208091
-
Switches and latches: a biochemical tug-of-war between the kinases and phosphatases that control mitosisPhilosophical Transactions of the Royal Society B: Biological Sciences 366:3584–3594.https://doi.org/10.1098/rstb.2011.0087
-
Mitotic chromosome alignment ensures mitotic fidelity by promoting interchromosomal compaction during anaphaseThe Journal of Cell Biology 218:1148–1163.https://doi.org/10.1083/jcb.201807228
-
Progressive activation of CyclinB1-Cdk1 coordinates entry to mitosisDevelopmental Cell 18:533–543.https://doi.org/10.1016/j.devcel.2010.02.013
-
Merotelic kinetochore attachment: causes and effectsTrends in Cell Biology 21:374–381.https://doi.org/10.1016/j.tcb.2011.01.003
-
Relocation of aurora B from centromeres to the central spindle at the metaphase to anaphase transition requires MKlp2The Journal of Cell Biology 166:167–172.https://doi.org/10.1083/jcb.200403084
-
Control of mitotic exit and cytokinesis by the APC/CBiochemical Society Transactions 36:405–410.https://doi.org/10.1042/BST0360405
-
The decision to enter mitosis: feedback and redundancy in the mitotic entry networkThe Journal of Cell Biology 185:193–202.https://doi.org/10.1083/jcb.200812045
-
A chromosome separation checkpoint: a midzone aurora B gradient mediates a chromosome separation checkpoint that regulates the anaphase-telophase transitionBioEssays : News and Reviews in Molecular, Cellular and Developmental Biology 37:.https://doi.org/10.1002/bies.201400140
-
The molecular biology of spindle assembly checkpoint signaling dynamicsCurrent Biology 25:R1002–R1018.https://doi.org/10.1016/j.cub.2015.08.051
-
Identification of candidate Cyclin-dependent kinase 1 (Cdk1) Substrates in mitosis by quantitative phosphoproteomicsMolecular & Cellular Proteomics 15:2448–2461.https://doi.org/10.1074/mcp.M116.059394
-
CDK1 inactivation regulates anaphase spindle dynamics and cytokinesis in vivoThe Journal of Cell Biology 138:385–393.https://doi.org/10.1083/jcb.138.2.385
-
Phosphatases: providing safe passage through mitotic exitNature Reviews Molecular Cell Biology 12:469–482.https://doi.org/10.1038/nrm3149
Article and author information
Author details
Funding
European Research Council (681443)
- Helder Maiato
Fundação Luso-Americana para o Desenvolvimento (FLAD LifeScience2020)
- Helder Maiato
H2020 Marie Skłodowska-Curie Actions (746515)
- Liam Cheeseman
Fundação para a Ciência e a Tecnologia (PTDC/BEX-BCM/0432/2014)
- Eurico Morais-de-Sa
The funders had no role in study design, data collection and interpretation, or the decision to submit the work for publication.
Acknowledgements
We thank Eric Griffis, Jean-René Huynh, Claudio Sunkel, Jonathon Pines, Melina Schuh and Christian Lehner for the kind gift of reagents, and Marco Gonzalez-Gaitán for supporting OA during the final stages of this work. LPC is the recipient of a Marie Skłodowska-Curie Action fellowship (grant agreement 746515). EMS holds an FCT Investigator position and his work is supported by Fundação para a Ciência e a Tecnologia (PTDC/BEX-BCM/0432/2014). This work was supported by R01GM107026 grant to TJM and a Commonwealth Honors College grant to CMC Confocal and FLIM microscopy data collection was performed in the Light Microscopy Facility and Nikon Center of Excellence at the Institute for Applied Life Sciences, University of Massachusetts Amherst with support from the Massachusetts Life Science Center. Work in the HM lab is supported by the European Research Council (ERC) under the European Union’s Horizon 2020 research and innovation programme (grant agreement No 681443) and FLAD Life Science 2020.
Ethics
Animal experimentation: All mice were maintained in a specific pathogen-free environment according to the Portuguese animal welfare authority regulations (Direcção Geral de Alimentação e Veterinária; reference# 0421/000/000/2016) and the guidelines of the Instituto de Investigação e Inovação em Saúde animal facility.
Version history
- Received: April 11, 2019
- Accepted: August 10, 2019
- Accepted Manuscript published: August 19, 2019 (version 1)
- Version of Record published: August 22, 2019 (version 2)
Copyright
© 2019, Afonso et al.
This article is distributed under the terms of the Creative Commons Attribution License, which permits unrestricted use and redistribution provided that the original author and source are credited.
Metrics
-
- 4,995
- views
-
- 657
- downloads
-
- 33
- citations
Views, downloads and citations are aggregated across all versions of this paper published by eLife.
Download links
A two-part list of links to download the article, or parts of the article, in various formats.
Downloads (link to download the article as PDF)
Open citations (links to open the citations from this article in various online reference manager services)
Cite this article (links to download the citations from this article in formats compatible with various reference manager tools)
Spatiotemporal control of mitotic exit during anaphase by an aurora B-Cdk1 crosstalk
eLife 8:e47646.
https://doi.org/10.7554/eLife.47646
Further reading
-
- Cell Biology
- Chromosomes and Gene Expression
Heat stress is a major threat to global crop production, and understanding its impact on plant fertility is crucial for developing climate-resilient crops. Despite the known negative effects of heat stress on plant reproduction, the underlying molecular mechanisms remain poorly understood. Here, we investigated the impact of elevated temperature on centromere structure and chromosome segregation during meiosis in Arabidopsis thaliana. Consistent with previous studies, heat stress leads to a decline in fertility and micronuclei formation in pollen mother cells. Our results reveal that elevated temperature causes a decrease in the amount of centromeric histone and the kinetochore protein BMF1 at meiotic centromeres with increasing temperature. Furthermore, we show that heat stress increases the duration of meiotic divisions and prolongs the activity of the spindle assembly checkpoint during meiosis I, indicating an impaired efficiency of the kinetochore attachments to spindle microtubules. Our analysis of mutants with reduced levels of centromeric histone suggests that weakened centromeres sensitize plants to elevated temperature, resulting in meiotic defects and reduced fertility even at moderate temperatures. These results indicate that the structure and functionality of meiotic centromeres in Arabidopsis are highly sensitive to heat stress, and suggest that centromeres and kinetochores may represent a critical bottleneck in plant adaptation to increasing temperatures.
-
- Cell Biology
High-altitude polycythemia (HAPC) affects individuals living at high altitudes, characterized by increased red blood cells (RBCs) production in response to hypoxic conditions. The exact mechanisms behind HAPC are not fully understood. We utilized a mouse model exposed to hypobaric hypoxia (HH), replicating the environmental conditions experienced at 6000 m above sea level, coupled with in vitro analysis of primary splenic macrophages under 1% O2 to investigate these mechanisms. Our findings indicate that HH significantly boosts erythropoiesis, leading to erythrocytosis and splenic changes, including initial contraction to splenomegaly over 14 days. A notable decrease in red pulp macrophages (RPMs) in the spleen, essential for RBCs processing, was observed, correlating with increased iron release and signs of ferroptosis. Prolonged exposure to hypoxia further exacerbated these effects, mirrored in human peripheral blood mononuclear cells. Single-cell sequencing showed a marked reduction in macrophage populations, affecting the spleen’s ability to clear RBCs and contributing to splenomegaly. Our findings suggest splenic ferroptosis contributes to decreased RPMs, affecting erythrophagocytosis and potentially fostering continuous RBCs production in HAPC. These insights could guide the development of targeted therapies for HAPC, emphasizing the importance of splenic macrophages in disease pathology.


