The synaptic ribbon is critical for sound encoding at high rates and with temporal precision
- University Medical Center Göttingen, Germany
- University of Göttingen, Germany
- Max Planck Institute for Biophysical Chemistry, Germany
- Max Planck Institute for Experimental Medicine, Germany
- Biomedical Sciences Institutes, Singapore
- Georg-August-University Göttingen, Germany
- University of the Saarland, Germany
- Max Planck Institute for Dynamics and Self-Organization, Germany
Abstract
We studied the role of the synaptic ribbon for sound encoding at the synapses between inner hair cells (IHCs) and spiral ganglion neurons (SGNs) in mice lacking RIBEYE (RBEKO/KO). Electron and immunofluorescence microscopy revealed a lack of synaptic ribbons and an assembly of several small active zones (AZs) at each synaptic contact. Spontaneous and sound-evoked firing rates of SGNs and their compound action potential were reduced, indicating impaired transmission at ribbonless IHC-SGN synapses. The temporal precision of sound encoding was impaired and the recovery of SGN-firing from adaptation indicated slowed synaptic vesicle (SV) replenishment. Activation of Ca2+-channels was shifted to more depolarized potentials and exocytosis was reduced for weak depolarizations. Presynaptic Ca2+-signals showed a broader spread, compatible with the altered Ca2+-channel clustering observed by super-resolution immunofluorescence microscopy. We postulate that RIBEYE disruption is partially compensated by multi-AZ organization. The remaining synaptic deficit indicates ribbon function in SV-replenishment and Ca2+-channel regulation.
https://doi.org/10.7554/eLife.29275.001eLife digest
Our sense of hearing relies on our ears quickly and tirelessly processing information in a precise manner. Sounds cause vibrations in a part of the inner ear called the cochlea. Inside the cochlea, the vibrations move hair-like structures on sensory cells that translate these movements into electrical signals. These hair cells are connected to specialized nerve cells that relay the signals to the brain, which then interprets them as sounds.
Hair cells communicate with the specialized nerve cells via connections known as chemical synapses. This means that the electrical signals in the hair cell activate channel proteins that allow calcium ions to flow in. This in turn triggers membrane-bound packages called vesicles inside the hair cell to fuse with its surface membrane and release their contents to the outside. The contents, namely chemicals called neurotransmitters, then travels across the space between the cells, relaying the signal to the nerve cell.
The junctions between the hair cells and the nerve cells are more specifically known as ribbon synapses. This is because they have a ribbon-like structure that appears to tether a halo of vesicles close to the active zone where neurotransmitters are released. However, the exact role of this synaptic ribbon has remained mysterious despite decades of study.
The ribbon is mainly composed of a protein called Ribeye, and now Jean, Lopez de la Morena, Michanski, Jaime Tobón et al. show that mutant mice that lack this protein do not have any ribbons at their “ribbon synapses”. Hair cells without synaptic ribbons are less able to timely and reliably send signals to the nerve cells, most likely because they cannot replenish the vesicles at the synapse quickly enough. Further analysis showed that the synaptic ribbon also helps to regulate the calcium channels at the synapse, which is important for linking the electrical signals in the hair cell to the release of the neurotransmitters.
Jean et al. also saw that hair cells without ribbons reorganize their synapses to form multiple active zones that could transfer neurotransmitter to the nerve cells. This could partially compensate for the loss of the ribbons, meaning the impact of their loss may have been underestimated. Future studies could explore this by eliminating the Ribeye protein only after the ribbon synapses are fully formed.
These findings may help scientists to better understand deafness and other hearing disorders in humans. They will also be of interest to neuroscientists who research synapses, hearing and other sensory processes.
https://doi.org/10.7554/eLife.29275.002Introduction
Encoding and processing of sensory information in the ear and the eye rely on ribbon synapses. Described in the 1960s as an electron dense structure tethering a halo of vesicles (Sjostrand, 1958; Smith and Sjostrand, 1961), the function of the synaptic ribbon has remained enigmatic despite decades of work (recent reviews in Lagnado and Schmitz, 2015; Moser and Vogl, 2016; Safieddine et al., 2012; Wichmann and Moser, 2015). Approaches to ribbon function included studies that employed natural variation of ribbon size or abundance during diurnal cycle or hibernation (Hull et al., 2006; Mehta et al., 2013), photoablation (Mehta et al., 2013; Snellman et al., 2011) and genetic manipulation (Dick et al., 2003; Frank et al., 2010; Jing et al., 2013; Khimich et al., 2005; Lv et al., 2016; Maxeiner et al., 2016; Sheets et al., 2011; Van Epps et al., 2004). Mutations initially focused on the presynaptic scaffold protein bassoon that is required for ribbon anchorage to the AZ (Dick et al., 2003; Khimich et al., 2005) via interaction with RIBEYE (tom Dieck et al., 2005). However, bassoon also exerts direct effects on AZ function (Davydova et al., 2014; Hallermann et al., 2010; Mendoza Schulz et al., 2014) and, hence, distinguishing direct effects of bassoon deletion and those caused by ribbon loss remained challenging (Jing et al., 2013).
RIBEYE-disruption turned out to be difficult: it is transcribed from the same gene as CtBP2, an essential transcription factor, disruption of which causes embryonic lethality (Hildebrand and Soriano, 2002). Complete abolition of RIBEYE was hard to achieve in zebrafish (Lv et al., 2016; Van Epps et al., 2004) given their duplicated genome. In fact, despite targeting both ribeye genes, RIBEYE immunofluorescence remained present in the retina and hair cells displayed ‘ghost ribbons’: structures recognized by a synaptic vesicle-halo but lacking electron density (Lv et al., 2016). Complete disruption of RIBEYE expression and lack of retinal ribbons were recently reported in a mouse knock-out of the RIBEYE-specific exon (Maxeiner et al., 2016). This study proved that RIBEYE is required for ribbon formation in the mammalian retina and the observed ribbon loss grossly impaired glutamate release from bipolar cell terminals. The key conclusion was that ribbons help to couple voltage-gated Ca2+-channels to vesicular release sites to enable tight, so-called Ca2+-nanodomain control of exocytosis (Maxeiner et al., 2016), that was previously reported for ribbon synapses of ear and eye (Bartoletti et al., 2011; Brandt et al., 2005; Graydon et al., 2011; Jarsky et al., 2010; Johnson et al., 2017; Pangršič et al., 2015; Wong et al., 2014). By employing the most specific, yet chronic, manipulation of the ribbon, this functional study on ribbonless retinal rod bipolar cells also confirmed that RIBEYE/the ribbon promotes a large complement of vesicular release sites. However, the electrophysiology was performed on rod bipolar cells while the molecular anatomy (immunofluorescence) focused on rod photoreceptors. Since the structure and function of ribbons formed at these two different cell types are distinct, a simple structure-function model was not easy to derive from this study. Moreover, the consequences of ribbon loss remained to be investigated at the systems level. Here, we studied the effects of RIBEYE-disruption on synaptic sound encoding in the cochlea. Combining assessments of the molecular anatomy from electron and fluorescence microscopy with cell and systems physiology, we revealed a role for the synaptic ribbon in organizing the topography of the IHC AZ, in Ca2+-channel regulation and in vesicle replenishment. In summary, we demonstrate that the synaptic ribbon is important for sound encoding at high rates and with temporal precision at IHC synapses.
Results
Genetic disruption of RIBEYE transforms ribbon-type AZs of IHC synapses into synaptic contacts with multiple small ribbonless AZs
We first employed immunohistochemistry to study IHCs of 3-week-old RIBEYE knock-out mice (RBEKO/KO), in which the unique A-domain exon of RIBEYE was deleted by Cre-mediated excision (described in Maxeiner et al., 2016). Next to the A-domain, RIBEYE contains a B-domain that is largely identical to the transcription factor CtBP2, which is spared by the genetic manipulation and used as a target in immunohistochemistry of ribbons and nuclei (Figure 1A,B; Khimich et al., 2005). Synaptic ribbons of IHC afferent synapses were identified as presynaptic RIBEYE/CtBP2-immunofluorescent spots in wild-type (Figure 1B, RBEWT/WT) and heterozygous (Figure 1—figure supplement 1, RBEWT/KO) mice. Their number per IHC did not change in the heterozygous condition (15.5 ± 0.7, S.D. = 1.58; n = 50 cells, N = 4 for RBEWT/KO vs. 15.7 ± 1.1, S.D. = 2.19; n = 39 cells, N = 3 for RBEWT/WT at P21), while their intensity was significantly reduced (in arbitrary units: 3.4 ± 0.7, S.D. = 1.78; n = 600 spots for 40 cells, N = 3 in RBEWT/KO vs. 5.1 ± 1.1, S.D. = 2.23; n = 411 spots for 29 IHCs, N = 3 in RBEWT/WT; p<0.0001, Mann-Whitney-Wilcoxon test; Figure 1—figure supplement 1A,B). RBEKO/KO IHCs lacked synaptic RIBEYE/CtBP2 immunofluorescence spots (Figure 1B), while immunolabeling of nuclear CtBP2 remained present, corroborating previous findings in the retina (Maxeiner et al., 2016). The number of afferent synapses per IHC was determined by the count of postsynaptic densities (PSDs) identified as PSD-95 immunofluorescent spots (Figure 1C,D,E) and was unchanged when RIBEYE was removed (13.7 ± 0.8, S.D. = 2.04; n = 56 cells, N = 4 in RBEKO/KO vs. 12.9 ± 0.6, S.D. = 2.13; n = 55 cells, N = 5 in RBEWT/WT). Bassoon (Figure 1C) and RIM2 (Figure 1D), both presynaptic scaffold proteins (Khimich et al., 2005;Jung et al., 2015a), remained present at the ribbonless afferent synapses of RBEKO/KO IHCs (marked by PSD-95). The scaffold protein piccolino, the short isoform of piccolo (Regus-Leidig et al., 2013) that is present in cochlear and retinal ribbons (Khimich et al., 2005; tom Dieck et al., 2005; Regus-Leidig et al., 2013), was absent from afferent synapses of RBEKO/KO IHCs. However, piccolo immunofluorescence was present in the vicinity of afferent synapses likely marking the long form piccolo at the efferent presynaptic AZs (Figure 1E, see schematic in Figure 1A). The PSD areas were calculated by fitting a 2-dimensional Gaussian function to each PSD-95 immunofluorescent spot, revealing a significant increase in the RBEKO/KO condition (2.82 ± 0.09 µm², S.D. = 1.25; n = 178 spots, N = 3 vs. 1.74 ± 0.05 µm², S.D. = 0.58; n = 163 spots, N = 3 in RBEWT/WT IHCs; p<0.0001, Mann-Whitney-Wilcoxon; Figure 1F).
Figure 1 with 1 supplement see all
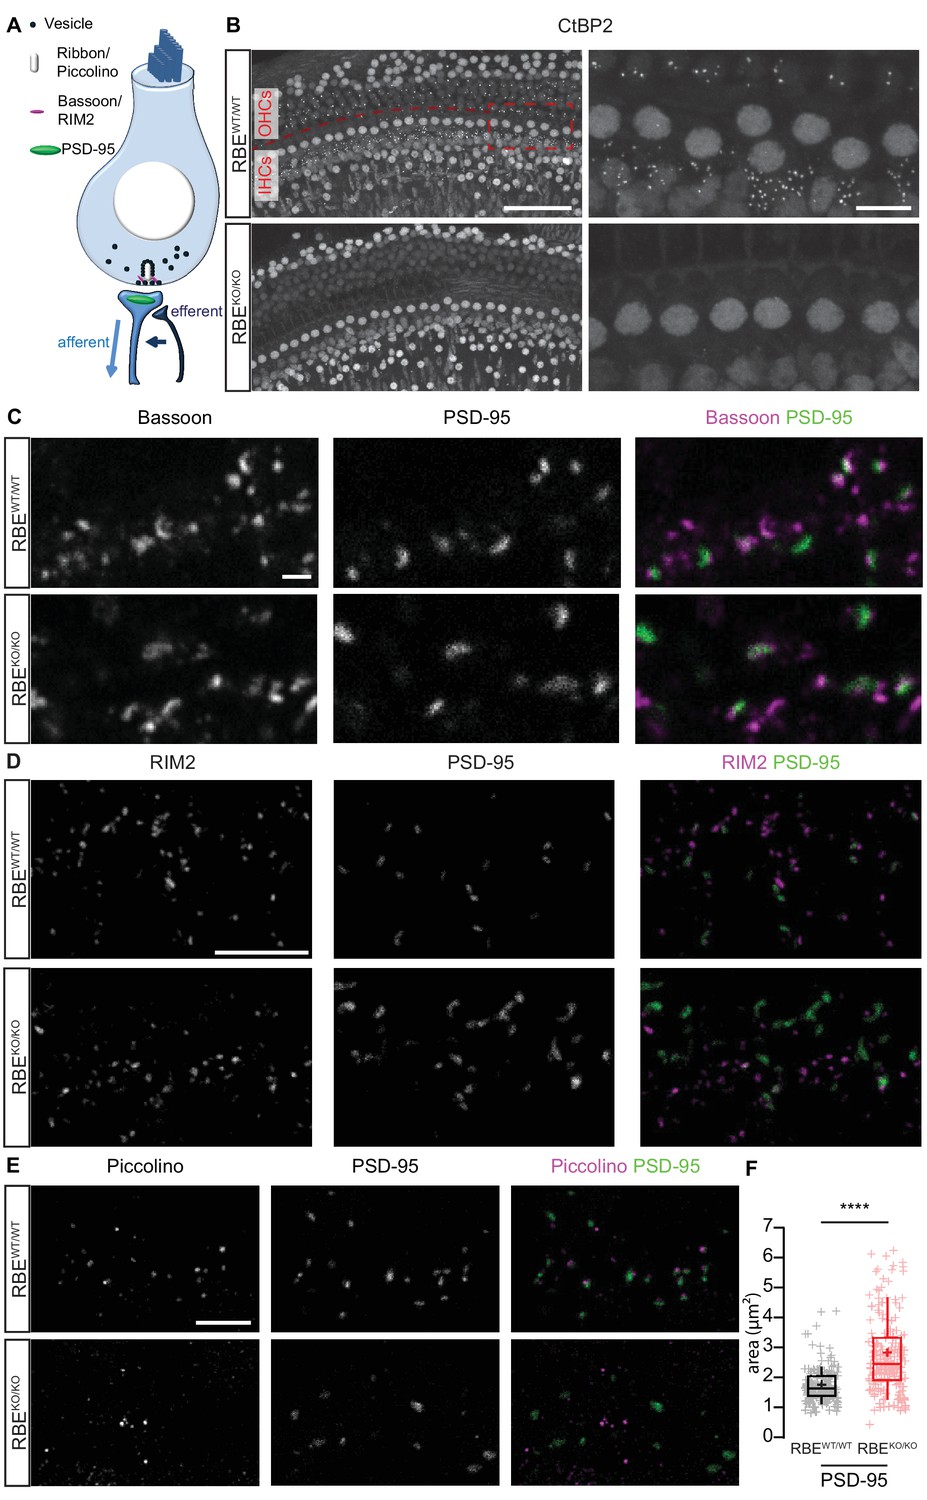
Loss of synaptic ribbons and piccolino from the AZs of RIBEYE-deficient IHCs.
(A) Simplified schematic representation of an IHC with the afferent and efferent connectivities. (B) Maximal projection of confocal sections from organs of Corti immunolabeled for CtBP2 and RIBEYE, present in the nuclei and the ribbons, respectively. The RBEWT/WT staining (top row) shows small puncta in the outer hair cell (OHC) and IHC rows representing the synaptic ribbons, which are completely absent in the RBEKO/KO hair cells (bottom row). Scale bar = 50 µm. Zoom into the IHC row (right column), emphasizes the complete disappearance of CtBP2-labeling at the basolateral part of RBEKO/KO IHCs. Scale bar = 10 µm. (C) Maximal projection of confocal sections from organs of Corti co-labeled for the presynaptic marker and anchor of the ribbon, bassoon (left column), and the postsynaptic marker, PSD-95 (middle column), in RBEWT/WT and RBEKO/KO IHCs. The merged picture (right column) shows the juxtaposition of bassoon (magenta) with PSD-95 (green), indicating its presence both at RBEWT/WT and ribbonless RBEKO/KO IHC synapses. Scale bar = 1 µm. (D) Maximal projection of confocal sections from organs of Corti co-labeled for the presynaptic marker RIM2 (left column) and the postsynaptic marker PSD-95 (middle column). The merged picture (right column) shows the co-localization of RIM2 (magenta) with PSD-95 (green) meaning its presence at the ribbonless IHC pre-synapses (scale bar = 5 µm). (E) Maximal projection of confocal sections from organs of Corti co-labeled for piccolino, a specific short splice variant of piccolo found at ribbons of RBEWT/WT IHC synapses (left column), co-labeled with PSD-95 (middle column). The merged pictures (right column) show PSD-95 (green) immunofluorescence lacking juxtaposed piccolino signal (magenta) in RBEKO/KO (bottom row), indicating absence of piccolino from afferent synapses of mutant IHCs. The punctate labeling for piccolo, away from PSD-95, most likely represents labeling of piccolo at conventional efferent synapses (schematically shown in Figure 1A). Scale bar = 5 µm. (F) Quantification of the area of PSD-95 immunofluorescent spots. The PSD-95 spots are siginificantly bigger in the RBEKO/KO IHCs (p<0.0001, Mann-Whitney-Wilcoxon test, n = 178 spots, N = 3 for RBEKO/KO and n = 163 spots, N = 3 for RBEWT/WT). Box plots show 10, 25, 50, 75 and 90th percentiles with individual data points overlaid; means are shown as crosses.
In order to study the effects of RIBEYE deletion on the ultrastructure of afferent IHC synapses, we performed transmission electron microscopy on random sections and electron tomography. Random ultrathin (70–75 nm) sections prepared from P21 mice (two animals per genotype) after aldehyde fixation and conventional embedding procedures showed that IHCs from RBEKO/KO mice completely lack synaptic ribbons, while RBEWT/WT and heterozygous RBEWT/KO typically display one ribbon per AZ (Figure 2A–C). Interestingly, ribbons of RBEWT/KO IHCs were smaller in height, width and area compared to RBEWT/WT IHC synaptic ribbons (Figure 2—figure supplement 1A–C; ribbon height: 118.32 ± 3.17 nm, S.D. = 31.84 nm; n = 101 ribbons, N = 2 for RBEWT/KO vs. 197.09 ± 4.36 nm, S.D. = 44.93 nm; n = 106 ribbons, N = 2 for RBEWT/WT; ribbon width: 119.80 ± 6.23 nm, S.D. = 62.27 nm for RBEWT/KO vs. 168.34 ± 6.83 nm, S.D. = 70.27 nm for RBEWT/WT; ribbon area: 11.5e3 ± 6.2e2 nm2, S.D. = 6.3e3 nm² for RBEWT/KO vs. 25.4e3 ±1.1e2 nm2, S.D. = 1.1e3 nm² for RBEWT/WT; p<0.0001, Mann-Whitney-Wilcoxon test for all) agreeing with the significantly reduced ribbon immunofluorescence intensity in the RBEWT/KO condition (see above and Figure 1—figure supplement 1A–B).
Figure 2 with 1 supplement see all
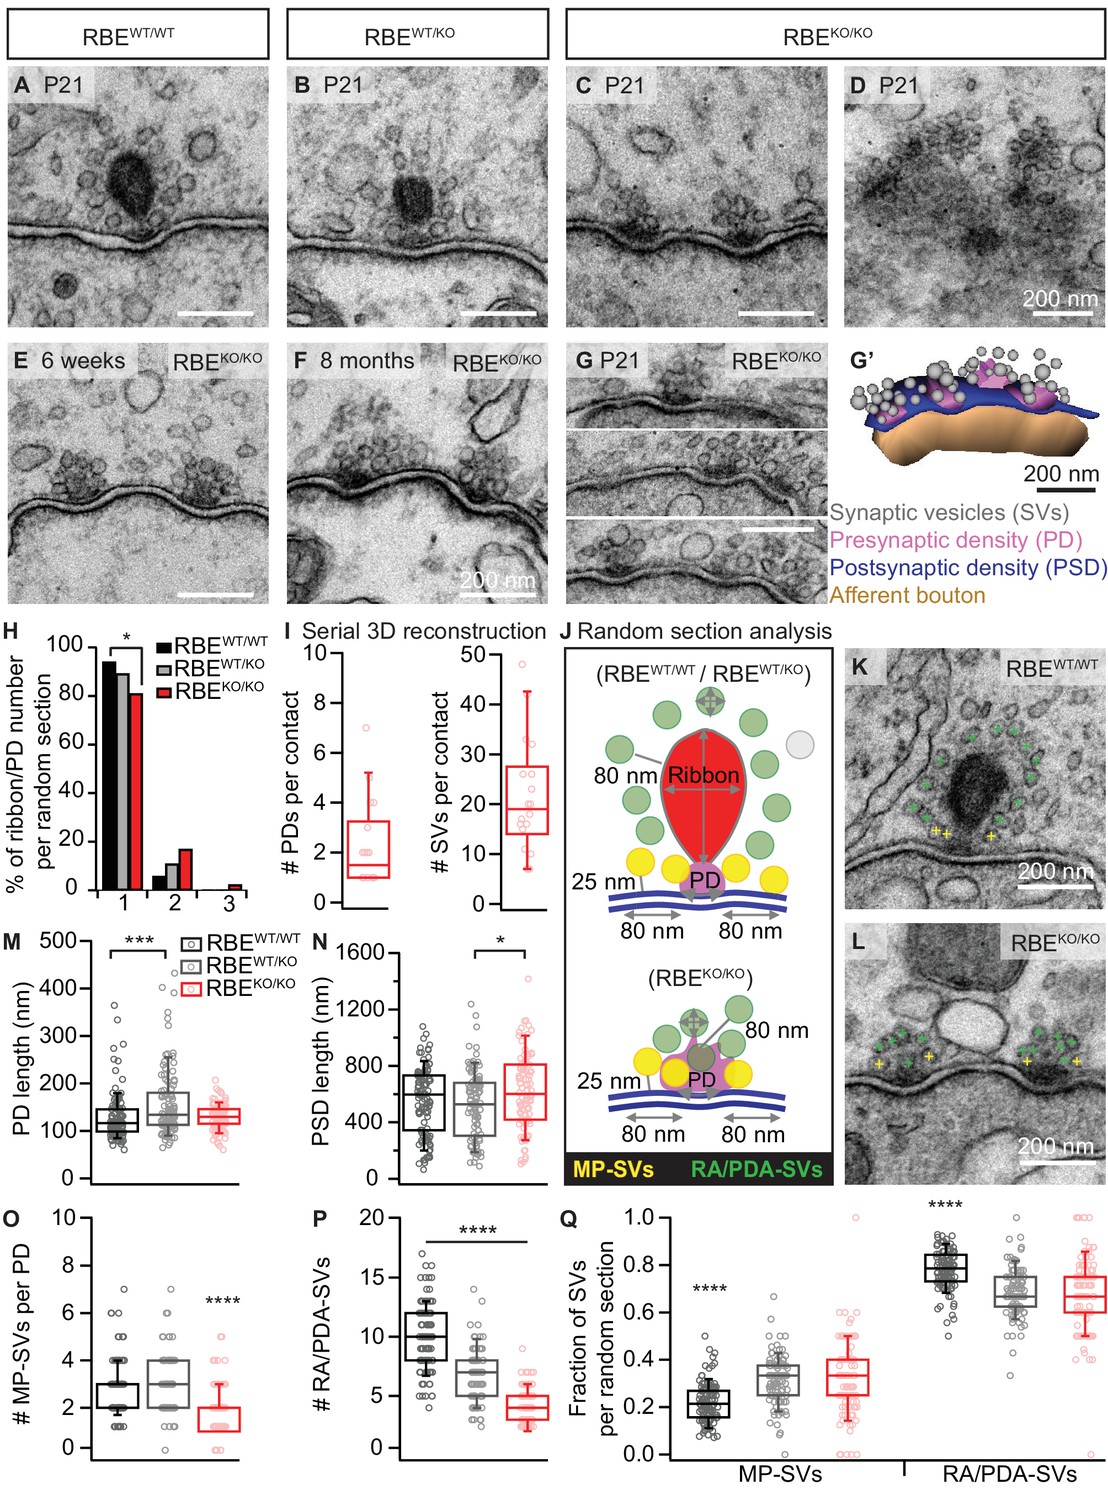
RIBEYE disruption transforms IHC synapses into contacts with multiple small ribbonless AZs.
(A–C) Representative electron micrographs of IHC afferent synapses from P21 RBEWT/WT, RBEWT/KO and RBEKO/KO mice. Ribbonless RBEKO/KO synapses display one or more presynaptic densities (PD) clustering SVs. Scale bars = 200 nm. (D) RBEKO/KO IHC AZ cut tangentially, revealing multiple PDs (here six) per AZ. (E, F) Representative electron micrographs of RBEKO/KO IHC synapses from mice at 6 weeks (E) and 8 months (F) of age: the presence of at least 2 AZs per contact in mature IHCs argues against a developmental delay. (G) Consecutive serial sections of a typical RBEKO/KO P21 IHC synapse showing multiple AZs. Scale bar = 200 nm. (G’) Corresponding serial 3D reconstruction of the synapse in (G) showing four PDs (magenta) surrounded by a total of 48 SVs (gray). Scale bar = 200 nm. (H) Quantification of the number of ribbon/PD per random section. AZs with a single PD are less frequently observed in RBEKO/KO IHCs (n = 108 AZs, N = 2 for RBEKO/KO and n = 106 AZs, N = 2 for RBEWT/WT; p<0.05, NPMC test). (I) Number of PDs and SVs per AZ in P21 RBE KO/KO mice in serial 3D reconstructions of RBEKO/KO afferent synapses. Box plots show 10, 25, 50, 75 and 90th percentiles with individual data points overlaid, as for (M, N, O, P & Q). (J) Schematic drawing illustrating the quantitative analysis of random sections. SV diameter: average of vertical and horizontal measurements from outer rim to outer rim. The ribbon height, width and area were measured as indicated by the gray lines. The length of the PD was determined along the AZ. For ribbon-occupied AZs: Membrane-proximal (MP) SVs (yellow) were counted in a distance of ≤25 nm from the AZ membrane (blue) and ≤80 nm from the PD. Ribbon-associated (RA) SVs were found in the first layer around the ribbon (red) with a maximum distance of 80 nm to the ribbon, quantified as indicated by the gray lines. For ribbonless AZs: Instead of RA-SVs we defined PD-associated SVs (PDA-SVs: all SV at PD with a maximum distance of 80 nm to the PD not matching the MP-SV criteria, defined as above). (K, L) Electron micrographs illustrating the quantification of the MP-SVs (yellow crosses) and the RA/PDA-SVs (green crosses). (M–Q) Quantification of random IHC synapse (P21) sections revealed no significant differences between RBE KO/KO and RBEWT/WT for the PD and PSD length (PD length: n = 108 PDs, N = 2 for RBE KO/KO and n = 108 PDs, N = 2 for RBEWT/WT; p=0.92, NPMC test and PSD length: n = 98 PSDs, N = 2 for RBE KO/KO and n = 113 PSDs, N = 2 for RBEWT/WT; p=0.11, Tukey’s test). However, in the RBEWT/KO IHCs, the PDs were bigger than in the WT IHCs (n = 101 PDs, N = 2; p=0.0004, NPMC test), and the PSDs were smaller than in the knock-out IHCs (n = 100 PSDs, N = 2 for RBEWT/KO; p=0.01, Tukey’s test). MP-SVs (n = 108 AZs, N = 2 for RBEKO/KO, n = 106 AZs, N = 2 for RBEWT/WT; p<0.0001, NPMC test) and RA/PDA-SVs (n = 108 AZs, N = 2 for RBEKO/KO, n = 106 AZs, N = 2 for RBEWT/WT; p<0.0001, Tukey’s test) per AZ, as well as the fraction of RA/PDA-SVs in RBEKO/KO, were significantly reduced (n = 108 AZs, N = 2 for RBEKO/KO, n = 106 AZs, N = 2 for RBEWT/WT; p<0.0001, NPMC test).
Random sections of synaptic contacts of RBEKO/KO mice (Figure 2C) often showed more than one presynaptic density (PD), each associated with a cluster of synaptic vesicles (henceforth considered individual AZs). The multiple AZs typically faced one continuous PSD, which is different from the synapses of immature IHC synapses that show multiple appositions of pre- and postsynaptic densities (Sendin et al., 2007; Wong et al., 2014). Moreover, we found more than one PD per synaptic contact in IHCs of older RBEKO/KO mice (Figure 2E,F; 6 weeks and 8 months, respectively), arguing against a delayed synaptic maturation to be the cause of the phenotype. Sections from tangential cuts of the synapse (Figure 2D), reconstructions from serial ultrathin sections (Figure 2G,G’) and quantifications of random sections (Figure 2H) corroborated the notion of multiple small ribbonless AZs at the synaptic contacts of RBEKO/KO IHCs. Analysis based on serial 3D reconstructions of synaptic contacts of RBEKO/KO IHCs from P21 animals showed on average 1.92 ± 0.34 PDs (S.D. = 1.16; n = 17 serial 3D reconstructions, N = 2) and 20.58 ± 2.98 total SVs per contact, S.D. = 10.34 (Figure 2I). The lateral extent of the individual PDs, determined in random sections, was comparable between RBEKO/KO and RBEWT/WT synapses (129.89 ± 2.53 nm, S.D. = 26.26 nm; n = 108 PDs, N = 2 for RBEKO/KO vs. 129.35 ± 4.89 nm, S.D. = 50.86 nm; n = 108 PDs, N = 2 for RBEWT/WT; p=0.92, NPMC test), while that of RBEWT/KO was enlarged (Figure 2M; 157.64 ± 7.19 nm, S.D. = 72.24 nm; n = 101 PDs, N = 2; p=0.0004 for comparison to RBEWT/WT, NPMC test). PSDs tended to be increased in length at RBEKO/KO synapses compared to RBEWT/WT PSDs and were significantly larger than RBEWT/KO PSDs (Figure 2N; 623.77 ± 26.70 nm, S.D. = 264.33 nm; n = 98 PSDs, N = 2 for RBEKO/KO vs. 555.91 ± 22.24 nm, S.D. = 236.42 nm; n = 113 PSDs, N = 2 for RBEWT/WT vs. 521.34 ± 24.20 nm, S.D. = 242.03 nm; n = 100 PSDs, N = 2 for RBEWT/KO; p=0.01 for RBEKO/KO vs. RBEWT/KO, Tukey’s test), which is consistent with the greater area of PSD-95 immunofluorescent spots in the knock-out condition (Figure 1E).
In the following, we characterized the populations of presynaptic SVs in random sections of vertically-cut IHC synapses. We counted membrane-proximal SVs (MP-SVs, ≤25 nm distance between SV membrane and plasma membrane, laterally within 80 nm of the PD, yellow in Figure 2J–L) as well as ribbon-associated SVs (RA-SVs, first layer of SVs around the ribbon within 80 nm, green in Figure 2J,K) or ‘PD-associated’ SVs (PDA-SVs, ribbonless AZs: SVs within 80 nm distance of the PD and not falling into the MP-SV pool (see above), green in Figure 2J,L). We found both MP-SVs (Figure 2O; 1.92 ± 0.09, S.D. = 0.93; n = 108 AZs, N = 2 for RBEKO/KO vs. 2.99 ± 0.12, S.D. = 1.18; n = 101 AZs, N = 2 for RBEWT/KO vs. 2.77 ± 0.12, S.D. = 1.18; n = 106 AZs, N = 2 for RBEWT/WT; p<0.0001 for RBEKO/KO vs. RBEWT/WT, NPMC test) and PDA-SVs (Figure 2P; 4.12 ± 0.15, S.D. = 1.50; n = 108 AZs, N = 2 for RBEKO/KO vs. 10.09 ± 0.27, S.D. = 2.75; n = 106 AZs, N = 2 for RBEWT/WT; p<0.0001, Tukey’s test) of the individual ribbonless IHC AZs of RBEKO/KO mice to be significantly fewer than the corresponding number of MP-SVs and RA-SVs counted at RBEWT/WT AZs. The fraction of PDA-SVs relative to the total number of SVs at RBEKO/KO AZs was less than that of RA-SVs at RBEWT/WT AZs (Figure 2Q; 0.67 ± 0.02, S.D. = 0.16; n = 108 AZs, N = 2 for RBEKO/KO vs. 0.78 ± 0.01, S.D. = 0.08; n = 106 AZs, N = 2 for RBEWT/WT; p<0.0001, NPMC test). Consequently, we observed an increase in the fraction of MP-SVs at RBEKO/KO AZs (Figure 2Q; 0.33 ± 0.02, S.D. = 0.16; n = 108 AZs, N = 2 for RBEKO/KO vs. 0.22 ± 0.01, S.D. = 0.08; n = 106 AZs, N = 2 for RBEWT/WT; p<0.0001, NPMC test). In line with the decreased ribbon size of RBEWT/KO AZs, we found a reduced number of RA-SVs, indicating a hypomorphic phenotype upon the loss of one allele of the RIBEYE gene. The SV diameter was unchanged for all three genotypes when jointly considering SVs of all categories in random sections (Figure 2—figure supplement 1D; 39.59 ± 0.21 nm, S.D. = 5.37 nm; n = 108 AZs, N = 2 for RBEKO/KO vs. 40.53 ± 0.14 nm, S.D. = 4.44 nm; n = 101 AZs, N = 2 for RBEWT/KO vs. 41.80 ± 0.13 nm, S.D. = 4.79 nm; n = 106 AZs, N = 2 for RBEWT/WT; p=0.30, NPMC test). However, we found a subtle but significant SV-diameter reduction in RBEKO/KO and RBEWT/KO for MP-SVs (Figure 2—figure supplement 1E; 39.29 ± 0.34 nm, S.D. = 4.82 nm; n = 108 AZs, N = 2 for RBEKO/KO vs. 41.79 ± 0.26 nm, S.D. = 4.53 nm; n = 106 AZs, N = 2 for RBEWT/WT; p<0.0001, NPMC test and 40.29 ± 0.25 nm, S.D. = 4.40 nm; n = 101 AZs, N = 2 for RBEWT/KO vs. RBEKO/KO; p=0.03, NPMC test) and for RA-/PDA-SVs (Figure 2—figure supplement 1F; 39.72 ± 0.27 nm, S.D. = 5.61 nm; n = 108 AZs, N = 2 for RBEKO/KO vs. 41.81 ± 0.15 nm, S.D. = 4.86 nm; n = 106 AZs, N = 2 for RBEWT/WT; p<0.0001, NPMC test and RBEKO/KO vs. 40.63 ± 0.17 nm, S.D. = 4.45 nm; n = 101 AZs, N = 2 for RBEWT/KO; p=0.003, NPMC test and RBEWT/KO vs. RBEWT/WT; p=0.02, NPMC test).
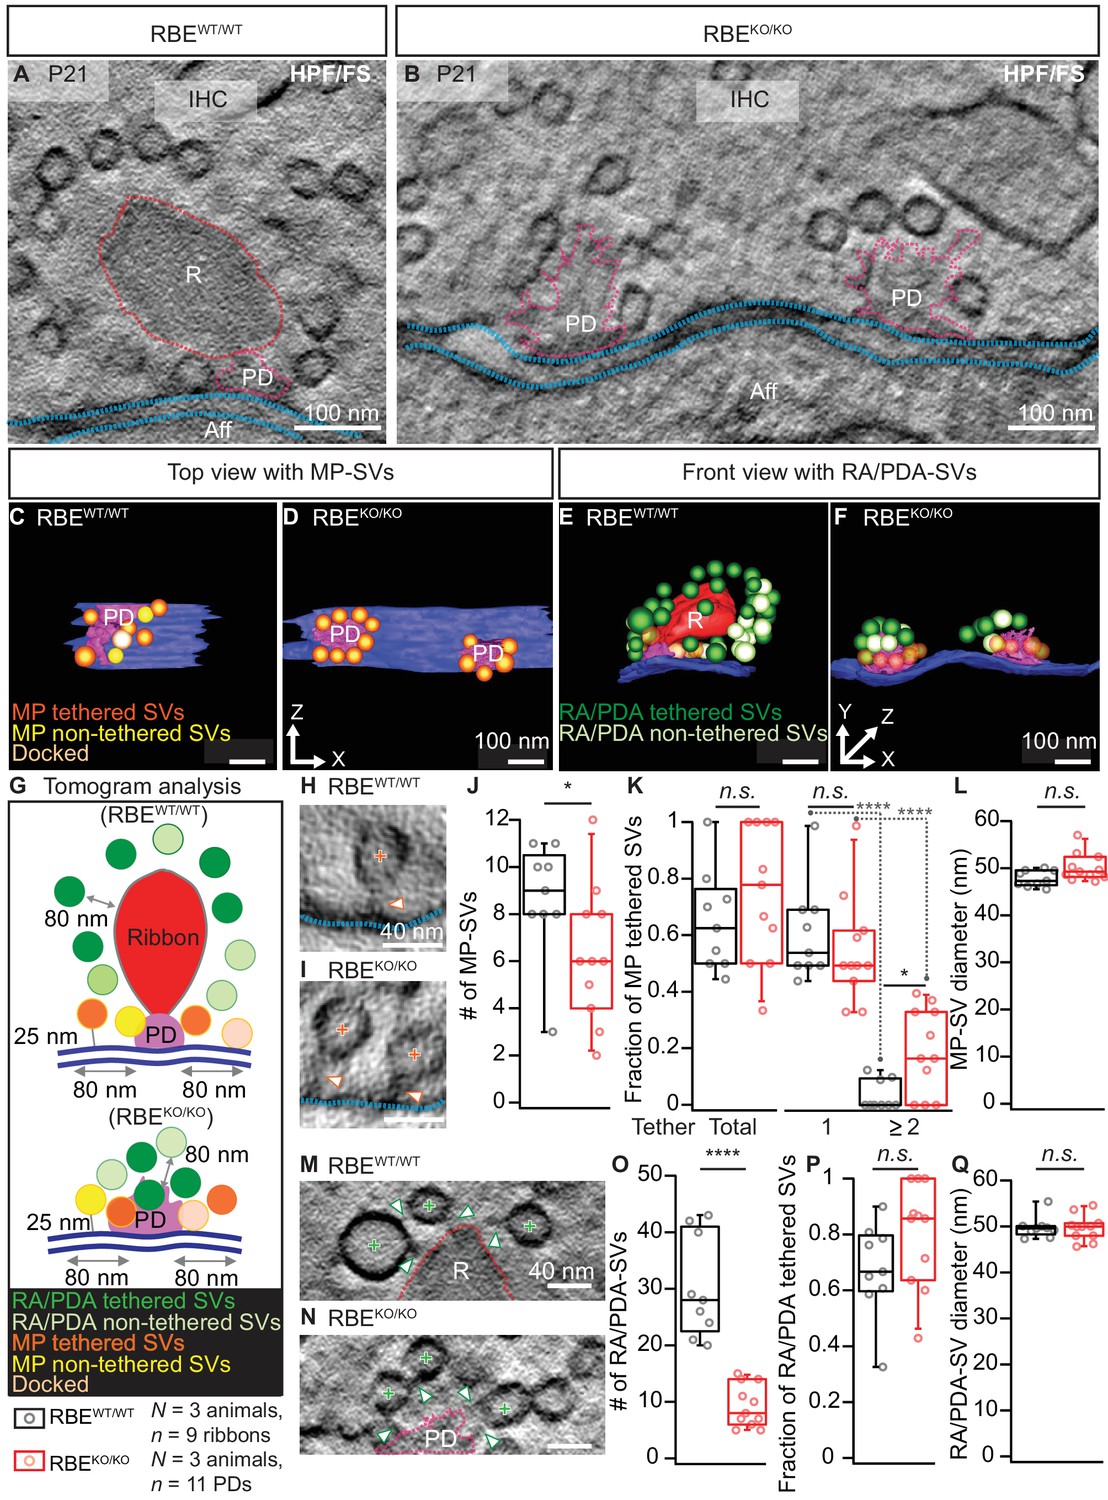
Next, to capture the synapses in a near-to-native state and to evaluate vesicle tethering, we performed electron tomography on 250 nm thick sections that were prepared with high-pressure freezing and freeze-substitution (HPF/FS) of organs of Corti from P21 mice (Figure 3). Tomography confirmed the absence of synaptic ribbons and the presence of multiple AZs per contact, each with a clear PD (Figure 3B,D,F). However, we note that the 250 nm thick sections did typically not fully cover the synaptic contact, which leads to an underestimation for the total number of SVs particularly for the spatially extended RBEKO/KO synapses. The PDs appeared roundish in the RBEKO/KO with MP-SVs closely arranged around the PD as found at the more elongated RBEWT/WT AZs (Figure 3C,D). For the tomograms, we followed the definition of MP-SV pool according to the 2D-random sections (Figure 2), but in addition we measured the MP-SVs also in a maximum distance of 50 nm from the AZ membrane and ≤100 nm from the PD (Figure 3—figure supplement 1 and supplementary file 1). This was motivated by the presence of long tethers connecting SV and AZ membrane and was previously introduced (Jung et al., 2015a). Further, we distinguished between tethered and non-tethered SVs (Figure 3G, Figure 3—figure supplement 1A). There, we focused our analysis on tethers to the ribbon/PD, plasma membrane and those interconnecting two adjacent SVs (Figure 3H,I,M,N). We found a significant reduction in the number of MP-SVs per AZ in RBEKO/KO IHCs (Figure 3J; RBEKO/KO = 6.30 ± 0.86, S.D. = 2.87 MP-SVs; n = 11 AZs, N = 3 vs. RBEWT/WT = 8.70 ± 0.82, S.D. = 2.45 MP-SVs; n = 9 AZs, N = 3; p=0.04, Mann-Whitney-Wilcoxon test; significant also by the second analysis method: Figure 3—figure supplement 1B, supplementary file 1), while the fraction of tethered MP-SVs (No. of tethered MP-SVs/No. of all MP-SVs) was not significantly altered (Figure 3K; RBEKO/KO = 0.75 ± 0.07, S.D. = 0.24; n = 11 AZs, N = 3 vs. RBEWT/WT = 0.65 ± 0.06, S.D. = 0.18; n = 9 AZs, N = 3; p=0.30, t-test; Figure 3—figure supplement 1C, supplementary file 1). The majority of the MP-SVs were tethered via a single tether in both RBEWT/WT and RBEKO/KO IHCs. The fraction of MP-SVs with multiple (≥2) tethers was significantly larger in RBEKO/KO IHCs (Figure 3K; single-tethered MP-SVs: RBEKO/KO = 0.55 ± 0.06, S.D. = 0.19; n = 11 AZs, N = 3 vs. RBEWT/WT = 0.61 ± 0.06, S.D. = 0.17; n = 9 AZs, N = 3; p=0.81; multiple-tethered MP-SVs: RBEKO/KO = 0.20 ± 0.05, S.D. = 0.15; n = 11 AZs, N = 3 vs. RBEWT/WT = 0.04 ± 0.02, S.D. = 0.05; n = 9 AZs, N = 3; p=0.01, Tukey’s test; Figure 3—figure supplement 1C, supplementary file 1). Further, and in line with analysis of random sections, the number of PDA-SVs per RBEKO/KO AZ was smaller than that of RA-SVs at RBEWT/WT AZs (Figure 3O; RBEKO/KO: 9.30 ± 1.13, S.D. = 3.74 PDA-SVs; n = 11 AZs, N = 3 vs. RBEWT/WT: 30.33 ± 3.00, S.D. = 9.01 RA-SVs; n = 9 AZs, N = 3; p<0.0001, Mann-Whitney-Wilcoxon test; Figure 3—figure supplement 1, supplementary file 1). However, the fraction of PDA-SVs tethered to the PD was not different from that of RA-SVs tethered to the ribbon (Figure 3P; RBEKO/KO: 0.80 ± 0.06, S.D. = 0.19 tethered PDA-SV fraction; n = 11 AZs, N = 3 vs. RBEWT/WT: 0.70 ± 0.06, S.D. = 0.17 tethered RA-SV fraction; n = 9 AZs, N = 3; p=0.12, t-test; Figure 3—figure supplement 1F, supplementary file 1).
Figure 3 with 1 supplement see all
Electron tomography analysis of synaptic ultrastructure obtained after HPF/FS.
(A, B) Exemplary virtual electron tomographic sections of P21 RBEWT/WT (A) and RBEKO/KO (B) highlight the ribbon R in red, the presynaptic density (PD) in magenta and the AZ membrane with blue dotted lines. No synaptic ribbons, but two PDs were observed in RBEKO/KO (B). Scale bars = 100 nm. (C–F) 3D rendered models of RBEWT/WT (C, E) and RBEKO/KO (D, F) IHC synapses. (C, D) The top view depicts the MP-SV pool with tethered (orange), non-tethered (yellow) and docked (light orange) SVs. For clarity ribbons, RA/PDA-SVs are removed. Scale bars = 100 nm. (E,F) The front view shows the RA/PDA-SV pool from RBEWT/WT (E) and RBEKO/KO (F) IHCs. Tethered (dark green) and non-tethered (light green) RA/PDA-SVs. For the ease of visualization, the MP-SV pool is transparent here and other synaptic structures such as ribbon (red), PD (magenta) and AZ membrane (blue) are indicated. Scale bars = 100 nm. (G) Illustrations show the tomogram analysis parameters comparable to 2D-random section analysis (Figure 2), in addition to that the vesicle pools are subdivided into tethered, non-tethered and docked SVs. (H, I, M, N) Representative tomogram virtual sections of membrane-tethered MP-SVs (H, I; orange cross), ribbon/PD tethered SVs and ribbon/PD proximal interconnecting SVs (M, N; green cross) in RBEWT/WT (H, M) and in RBEKO/KO (I, N). Tethers are marked with a white arrowhead and other synaptic entities are color-coded similar to (A, B). Scale bars = 40 nm. (J–L) Quantification for the MP-SV pool is depicted; n = 9 ribbons, N = 3 animals for RBEWT/WT and n = 11 PDs, N = 3 animals for RBEKO/KO. Fewer MP-SV were observed in RBEKO/KO (J; p=0.04, Mann-Whitney-Wilcoxon test). The fraction of tethered MP-SVs was unaltered in RBEKO/KO (K; p=0.30, t-test). Most of the SVs were tethered by a single tether in both RBEKO/KO and RBEWT/WT. Significantly more SVs with multiple-tethers were observed in RBEKO/KO (K; single tethered MP-SVs, multiple-tethered MP-SVs: n.s.: p>0.05,*: p=0.01, ****: p<0.0001, Tukey’s test). MP-SV diameter was unaltered in RBEKO/KO (L; p=0.06, Mann-Whitney-Wilcoxon test). (O–Q) Quantification for the RA/PDA-SVs, sample size is same as for the MP-SV analysis. Significantly fewer PDA-SVs were observed in RBEKO/KO (O; RBEKO/KO: p<0.0001, Mann-Whitney-Wilcoxon test). The fraction of PDA tethered SVs in RBEKO/KO was comparable to RA tethered SVs in RBEWT/WT (P; p=0.12, t-test). SV diameters were unaltered in the RA/PDA vesicle pool (Q; p=0.06, Mann-Whitney-Wilcoxon test). Box plots show 10, 25, 50, 75 and 90th percentiles with individual data points overlaid. See Figure 3—figure supplement 1 and supplementary file 1 for modified tomogram analysis according to Jung et al., 2015a.
Finally, tomography indicated unchanged SV diameters at RBEKO/KO AZs (Figure 3L,Q; MP-SV diameter: 50.17 ± 0.90 nm, S.D. = 2.95 nm; n = 11 PDs, N = 3 for RBEKO/KO vs. 47.81 ± 0.60 nm, S.D. = 1.70; n = 9 ribbons, N = 3 for RBEWT/WT; p=0.06, Mann-Whitney-Wilcoxon test, Figure 3—figure supplement 1D, supplementary file 1; RA/RA-SV diameter: 49.71 ± 0.83 nm, S.D. = 2.75; n = 11 PDs, N = 3 for RBEKO/KO vs. 49.80 ± 0.78 nm, S.D. = 2.35; n = 9 ribbons, N = 3 for RBEWT/WT; p=0.71, Mann-Whitney-Wilcoxon test; Figure 3—figure supplement 1G, supplementary file 1). We presume that differences in the comparison of RBEKO/KO and RBEWT/WT between the random section and electron tomography analysis primarily reflects the larger number of AZ analyzed by the former approach.
We then used confocal and stimulated emission depletion (STED) super-resolution immunofluorescence microscopy in order to study the abundance and spatial organization of presynaptic CaV1.3 Ca2+-channels (Neef et al., 2018), which contribute more than 90% of the voltage-gated Ca2+-influx into IHCs (Platzer et al., 2000; Brandt et al., 2003; Dou et al., 2004). Organs of Corti from 3-week-old RBEKO/KO and RBEWT/WT mice were processed in parallel for immunohistochemistry and imaging. CaV1.3 Ca2+-channels remained clustered at RBEKO/KO AZs and were identified as CaV1.3 labeling juxtaposed to PSD-95 immunofluorescent spots (Figure 4A). In order to analyze the spatial organization of synaptic Ca2+-channels, we performed 3-color, 2D-STED immunofluorescence imaging for CaV1.3, bassoon (as a PD-marker), and PSD-95. While more than 80% of the RBEWT/WT synapses showed the typical stripe-like co-alignment of CaV1.3 and bassoon immunofluorescence (Neef et al., 2018), imaging of RBEKO/KO synapses indicated a high prevalence (over 70%) of smaller, rounder and often several Ca2+-channel clusters and PDs per synaptic contact (Figure 4B,C). We then quantified stripe-like clusters by measuring their long and short axis using 2D Gaussian fits and found no differences between RBEKO/KO and RBEWT/WT AZs (Figure 4D). Finally, we quantified the number of CaV1.3-immunofluorescent structures per contact (as indicated by PSD-95 immunofluorescence). While more than 80% of RBEWT/WT synapses displayed a single cluster, over 60% of the RBEKO/KO synapses contained two or more Ca2+-channel clusters (Figure 4E). Hence, the average number of CaV1.3-immunofluorescent structures was significantly higher at RBEKO/KO synapses compared to RBEWT/WT (2.06 ± 0.09, S.D. = 1.16; n = 178 spots, N = 3 vs. 1.16 ± 0.03, S.D. = 0.38; n = 183 spots, N = 2; p<0.0001, Mann-Whitney-Wilcoxon test) and we likely underestimated this difference due to the low resolution of 2D-STED in the z-axis. In summary, our results indicate that RIBEYE-disruption transforms the single ribbon-type AZ into a complex presynaptic organization with multiple conventional-like AZs facing the postsynaptic bouton.
Figure 4
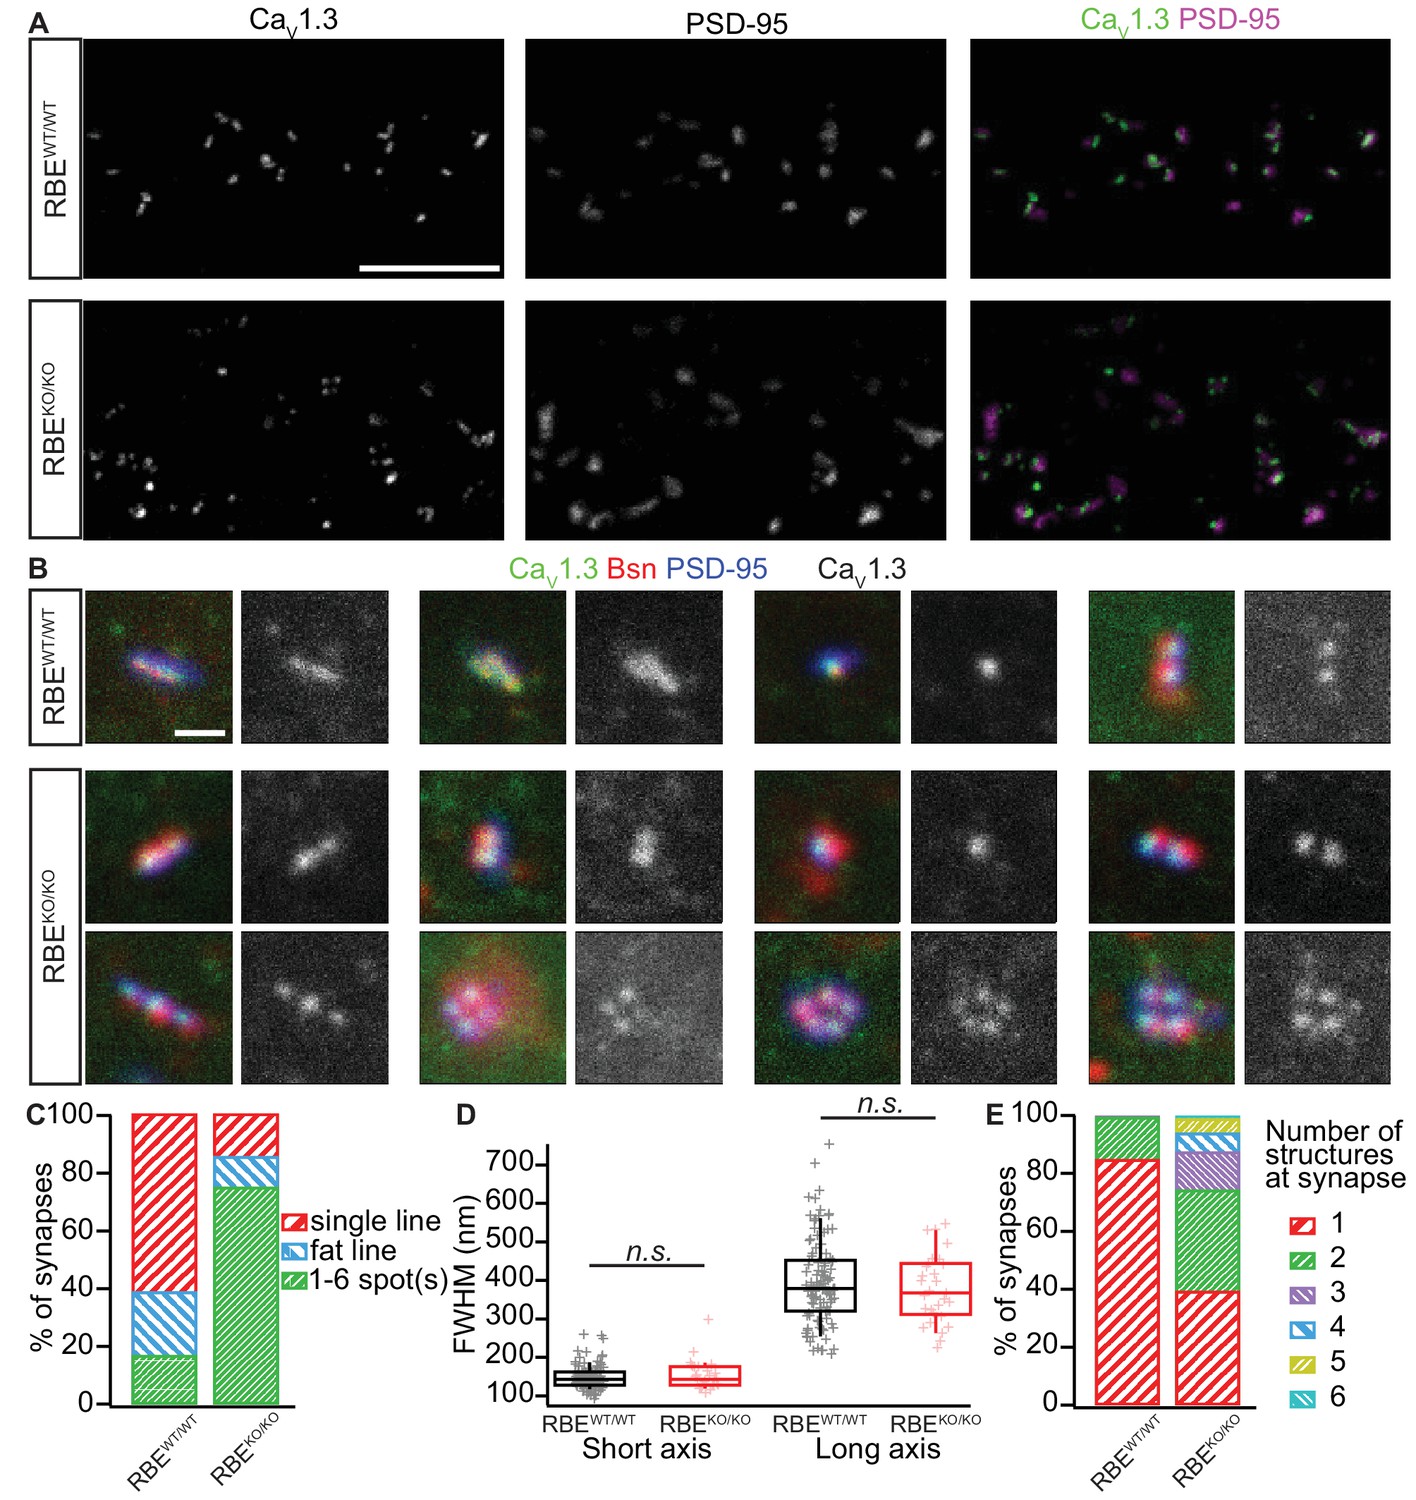
Analyzing AZ Ca2+-channel clusters using confocal and STED immunofluorescence microscopy.
(A) Maximal projections of confocal sections from organs of Corti immunolabeled for CaV1.3 Ca2+-channels (left column) and PSD-95 (middle column). The merged pictures (right column) show their juxtaposition in both conditions. While we mostly found one linear/spot-like Ca2+-channel cluster per PSD in RBEWT/WT IHCs (top row), we often observed several spots per PSD in RBEKO/KO IHCs (bottom row). Scale bar = 5 µm. (B) Triple co-labeling of CaV1.3 (green), bassoon (red), and PSD-95 (blue) at several IHC AZs from RBEWT/WT and RBEKO/KO mice, imaged in 2D-STED (CaV1.3 and PSD-95) and confocal mode (bassoon), showing that CaV1.3 Ca2+-channels cluster at AZs in IHCs of both genotypes. CaV1.3 immunofluorescence is displayed in gray next to the merged image for better visualization. Scale bar = 500 nm. (C) 178 RBEWT/WT and 183 RBEKO/KO synapses were categorized according to the pattern of CaV1.3 immunofluorescence found by assigning them to a group of either line-shaped clusters, fat line-shaped clusters or one/multiple spots. A markedly higher fraction of synapses was found to display a spot-like CaV1.3-signal in RBEKO/KO than in RBEWT/WT IHCs. (D) Fitting of a 2D-Gaussian function to the immunofluorescence data of the line-shaped CaV1.3 clusters showed no difference in terms of size between RBEWT/WT and RBEKO/KO clusters, as estimated by the full width at half maximum of the Gaussian’s short and long axis. Box plots show 10, 25, 50, 75 and 90th percentiles with individual data points overlaid. (E) Quantification of the number of fluorescent structures (lines or spots) labeled by the anti-CaV1.3 antibody at RBEWT/WT and RBEKO/KO synapses showed a significantly increased number in the knockout (p<0.0001, Mann-Whitney-Wilcoxon test).
Altered operating range of presynaptic Ca2+-influx at ribbonless IHC synapses
Next, we combined whole-cell patch-clamp with confocal Ca2+-imaging of IHCs to study Ca2+-influx at the whole IHC and single synapse levels using 5 mM [Ca2+]e to augment the signal to noise. Using step-depolarizations in conditions that isolated the Ca2+-current (see Materials and methods), we probed the amplitude and voltage-dependence of IHC Ca2+-influx (Figure 5A). The amplitude of Ca2+-influx (Figure 5Ai; for Ca2+-current density, see Figure 5Aii) was unaltered in RBEKO/KO IHCs (-151 ± 12.9 pA, S.D. = 59 pA; n = 21 IHCs, N = 8 in RBEKO/KO vs. -161 ± 15.4 pA, S.D. = 71 pA; n = 21 IHCs, N = 9 in RBEWT/WT; p=0.62, t-test), in agreement with findings in retinal bipolar neurons (Maxeiner et al., 2016) but in contrast to our previous findings in ribbon-deficient IHCs of bassoon mutant mice (Khimich et al., 2005; Frank et al., 2010; Jing et al., 2013). Kinetics of Ca2+-channel activation were unchanged (Figure 5B), whereas inactivation kinetics were slightly faster in the RBEKO/KO IHCs (smaller residual Ca2+-current at 200 ms of depolarization (normalized to the peak current): 0.82 ± 0.007, S.D. = 0.02; n = 10 IHCs, N = 5 for RBEKO/KO vs. 0.85 ± 0.01, S.D. = 0.04; n = 11 IHCs, N = 7, in the RBEWT/WT condition; p=0.017, Mann-Whitney-Wilcoxon test; Figure 5D). When analyzing the voltage-dependence of Ca2+-channel activation (Figure 5C), we found a small (2 mV) but significant depolarizing shift of the potential of half-maximal Ca2+-channel activation, Vh (Figure 5Ci, −22.96 ± 0.43 mV, S.D. = 2.39 mV; n = 21 IHCs, N = 8 in RBEKO/KO vs. −25.04 ± 0.65 mV, S.D. = 2.98 mV; n = 21 IHCs, N = 9 in RBEWT/WT; p=0.017, t-test). When analyzed in a smaller data set recorded in 2 mM [Ca2+]e the depolarized Vh-shift did not reach statistical significance (data not shown). The average voltage-sensitivity of activation (slope factor k) was not altered (5 mM [Ca2+]e: p=0.67, t-test, Figure 5Cii). Together, this suggests a RIBEYE/ribbons-mediated regulation of IHC Ca2+-channels affecting their voltage-range of operation as well as their inactivation kinetics.
Figure 5
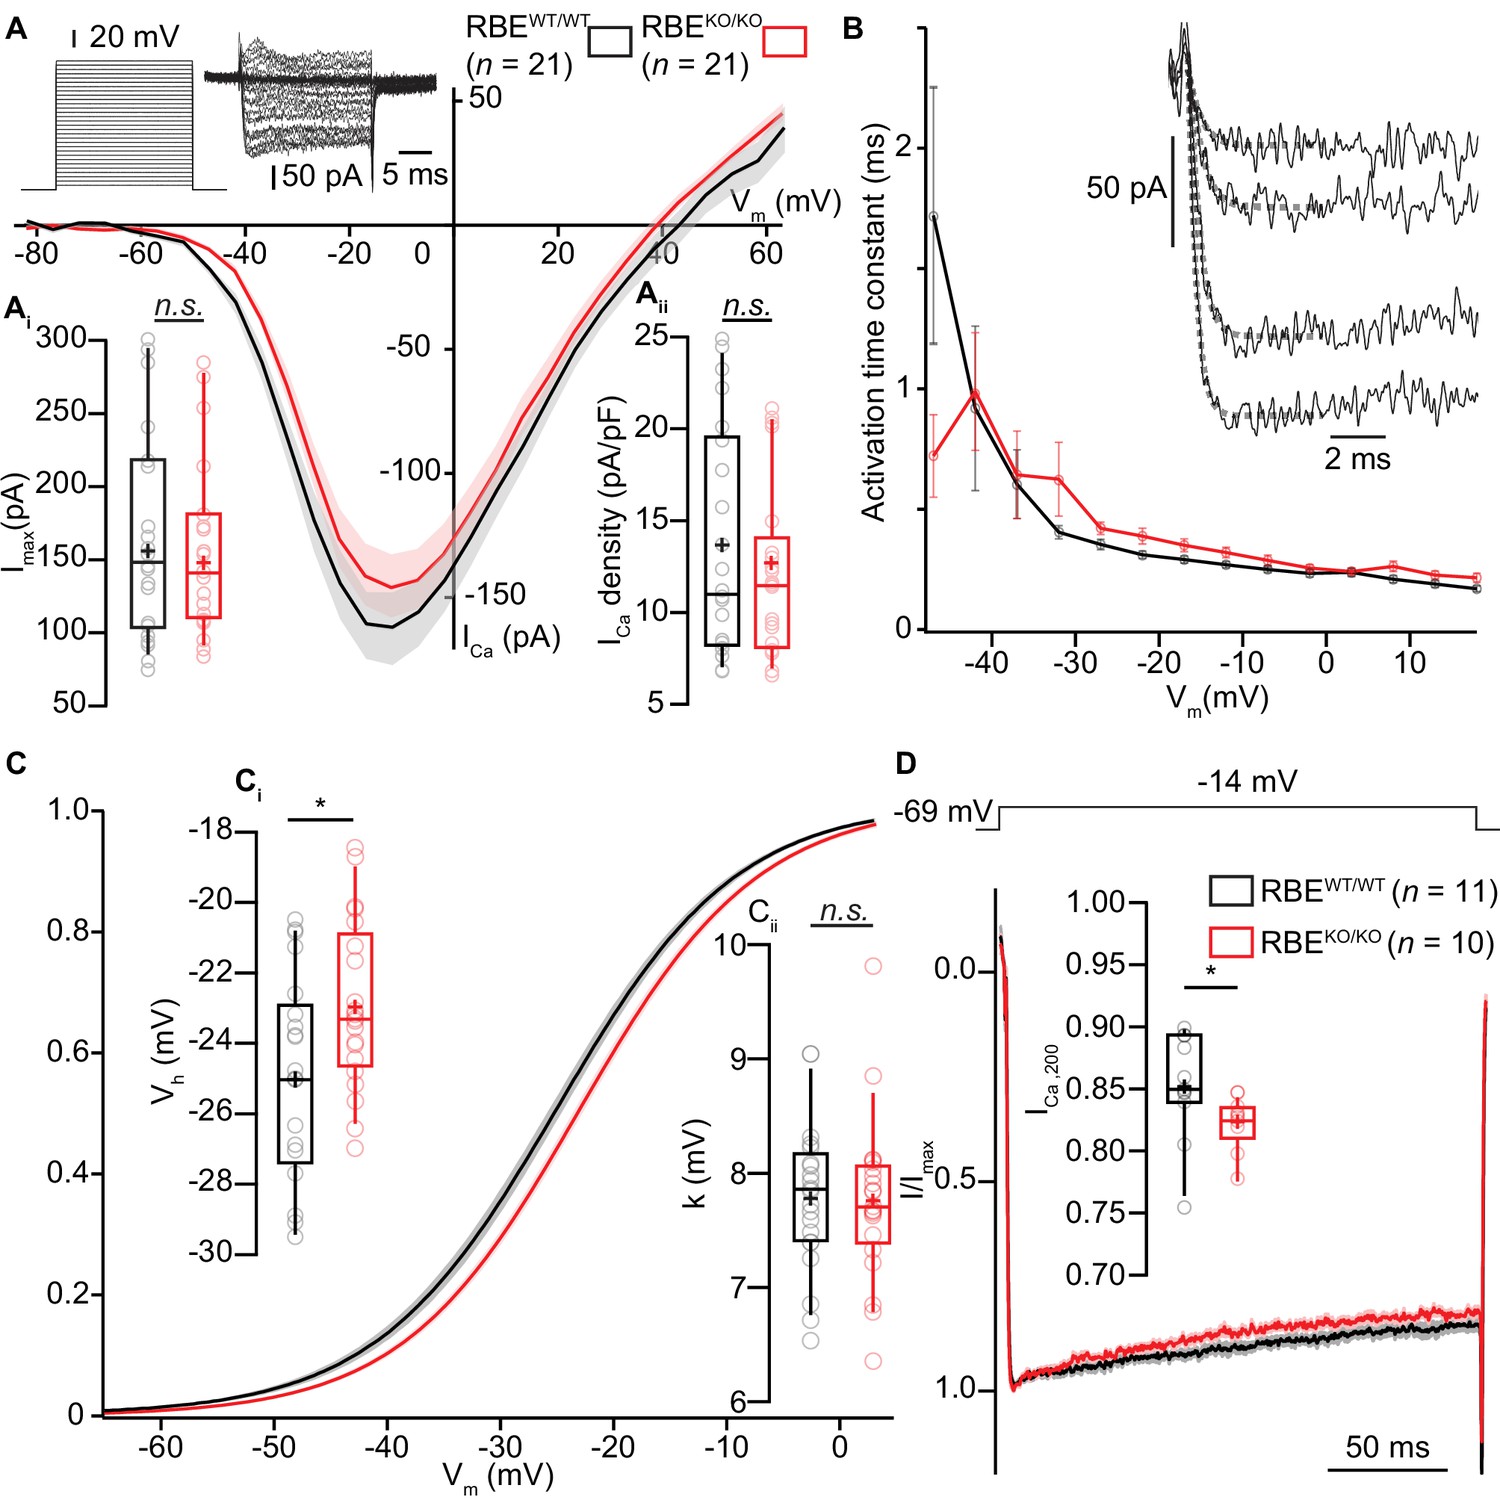
IHC Ca2+-influx shows normal amplitude but a mild depolarized shift in voltage-dependence.
(A) IV-relationship of the whole-cell Ca2+-current in RBEWT/WT (black, n = 21 cells, N = 8) and RBEKO/KO (red, n = 21 cells, N = 8) IHCs show comparable (sign-inverted) current amplitudes (Ai, p=0.62, t-test) and density (Aii, p=0.37, t-test.). Mean (line) ± S.E.M. (shaded areas) are displayed as for (C, D). The protocol, consisting of 20 ms steps of 5 mV from −82 to +63 mV, as well as exemplary resulting currents, aredisplayed in the left. Box plots show 10, 25, 50, 75 and 90th percentiles with individual data points overlaid, means are shown as crosses, as for (C, D). (B) Activation time constants (mean ± S.E.M.) of Ca2+-currents at different potentials were obtained by fitting a power exponential equation to the first 5 ms of the current traces, revealing no differences between conditions. (C) Fractional activation of the whole-cell Ca2+-current derived from the IV-relationships (A) was fitted to a Boltzmann function. (Ci) Box plots of the voltage for half-maximal activation Vh and Vh-estimates of individual IHCs show a depolarized shift of the fractional activation of the Cav1.3 Ca2+-channels in the RBEKO/KO IHCs (p=0.029, t-test). (Cii) Box plots of the voltage-sensitivity or slope factor k and k-estimates of individual IHCs illustrate comparable voltage sensitivity between both conditions (p=0.67, t-test). (D) Average peak-normalized Ca2+-currents resulting from 200 ms depolarizations to −14 mV. We observe an enhanced inactivation in ribbonless IHCs, quantified as a reduced residual Ca2+-current (inset). (n = 10 cells, N = 5 for RBEKO/KO and n = 11 cells, N = 7 in the RBEWT/WT; p=0.017, Mann-Whitney-Wilcoxon test).
We then used the low-affinity Ca2+-indicator dye Fluo-4FF (800 µM) to study Ca2+-influx at individual IHC AZs (Frank et al., 2009) using a spinning-disk confocal microscope that allows rapid registering and recording of the majority of the IHC synapses (Figure 6A, Ohn et al., 2016). We chose conditions in which the Ca2+-indicator fluorescence approximates synaptic Ca2+-influx (Frank et al., 2009; Ohn et al., 2016) and henceforth refer to synaptic Ca2+-influx when describing observations based on hotspots of Ca2+-indicator fluorescence at the basolateral IHC membrane. Prior to analysis of synaptic Ca2+-influx, we imaged fluorescently-conjugated CtBP2-binding peptide (Zenisek et al., 2004), which bound to the ribbon-occupied AZs in RBEWT/WT IHCs while it only caused nuclear and diffuse cytosolic fluorescence in the ribbonless RBEKO/KO IHCs (Figure 6B). We then employed ramp-depolarizations to assess amplitude and voltage-dependence of Ca2+-influx at the synapses located in the subnuclear, basal part of the IHCs (Figure 6A). We found comparable maximal amplitudes of the baseline-normalized fluorescence change (ΔF/F0, 0.88 ± 0.08, S.D. = 0.66; n = 61 AZs in 15 IHCs, N = 7 for RBEKO/KO vs. 0.85 ± 0.08, S.D. = 0.68; n = 78 AZs in 15 IHCs, N = 8 for RBEWT/WT; p=0.20, Mann-Whitney-Wilcoxon test; Figure 6C). This is compatible with an unaltered number of synaptic Ca2+-channels at AZs of RBEKO/KO IHCs and consistent with our observations of normal whole-cell Ca2+-current amplitudes. As previously reported (Frank et al., 2009; Ohn et al., 2016), there was a substantial variation of the maximal ΔF/F0 among the AZs, which was also comparable between AZs of both genotypes (c.v. = 0.75 for RBEKO/KO vs. c.v. = 0.80 for RBEWT/WT).
Figure 6 with 1 supplement see all

Synaptic Ca2+-influx shows normal amplitude but shifted voltage-dependence and broader spread.
(A, B) IHCs were patch-clamped at the modiolar basolateral face, loaded with TAMRA-CtBP2-binding peptide and the low affinity Ca2+-indicator Fluo-4FF, and scanned in the red channel after loading for 4 min to image TAMRA-labeled ribbons, nuclei, and cytosol. 3D projection of TAMRA fluorescence shows the absence of ribbons in RBEKO/KO IHCs (B: 3D projection and red channel). Voltage-ramps from −87 to +63 mV during 150 ms (A: left top) were used to trigger synaptic hotspots of Fluo-4FF fluorescence (A: left middle, 10 AZs in one exemplary RBEWT/WT IHC, B: green channel, marked by arrowheads; ΔF: average of the nine brightest pixels (red square)) and IHC Ca2+-influx (A, left bottom). Ca2+-imaging proceeded from the IHC bottom to the most apical ribbon in RBEWT/WT, and from IHC bottom to +12 µm (typically reaching the bottom of nucleus) in RBEKO/KO. Scale bar = 5 µm. (C) FV-relationship (ΔF/F0 vs. depolarization level in ramp, protocol as in A): approximating the voltage-dependence of synaptic Ca2+-influx.Mean (line) ± S.E.M. (shaded areas) are displayed as for (D). (Ci) ΔFmax/F0 was calculated by averaging 5 values at the FV-peak (between the dotted lines) and was comparable between RBEWT/WT (n = 78 AZs for 15 cells, N = 8) and RBEKO/KO IHCs (n = 61 AZs for 15 cells, N = 7) (p=0.20, Mann-Whitney-Wilcoxon test). Box plots show 10, 25, 50, 75 and 90th percentiles with individual data points overlaid, means are shown as crosses, as for (D, F). (D) Fractional activation curves derived from fits to the FV-relationships (C) were fitted to a Boltzmann function. Mean (line) ± S.E.M. (shaded areas) are displayed. (Di) The voltage for half-maximal activation Vh was significantly different between RBEWT/WT (n = 68 AZs for 15 IHCs, N = 8) and RBEKO/KO (n = 55 AZs for 15 IHCs, N = 7) AZs (p=0.0029, t-test), while the voltage-sensitivity or slope factor k (Dii) not (p=0.42, t-test). (E) Exemplary ΔF pictures of Fluo-4FF hotspots at RBEWT/WT (left) and RBE KO/KO (right) synapses fitted and overlaid by 2D-Gaussian functions to estimate spatial extent as full width at half maximum (FWHM) for the short axis (S.A.) and the long axis (L.A.). Scale bar = 1 µm. (F) Ribbonless synapses of RBEKO/KO IHCs showed a greater spatial spread of the Fluo-4FF fluorescence change. FWHM calculated from the Gaussian fitting to the Fluo-4FF fluorescence hotspot was larger for both axes in RBEKO/KO (n = 61 AZs for 15 IHCs, N = 8) compared to RBEWT/WT (n = 74 AZs for 15 IHCs, N = 7) (L.A.: p=0.00016; S.A.: p=0.0029, t-test).
Next, we analyzed the voltage-dependence of activation for the synaptic Ca2+-influx as previously described (Ohn et al., 2016). Analysis of fractional activation revealed a depolarized shift in Vh by on average 5 mV in RBEKO/KO IHCs (−22.76 ± 1.25 mV, S.D. = 9.26 mV; n = 55 AZs in 15 IHCs, N = 7 for RBEKO/KO vs. −27.37 ± 0.90 mV, S.D. = 7.48 mV; n = 68 AZs in 15 IHCs, N = 8 for RBE WT/WT; p=0.0029, t-test; Figure 6D,Di), while the slope factor of voltage-dependent activation was unaltered (p=0.42, t-test, Figure 6Dii). Such a shift in the operating range of synaptic Ca2+-influx is expected to alter spontaneous and sound-evoked transmitter release (see below and Ohn et al., 2016). Finally, we studied the spatial extent of the synaptic Ca2+-signals and estimated Full Width Half Maximum (FWHM) by fitting 2D Gaussian functions to the hotspots of Ca2+-indicator fluorescence and found a greater spread of Ca2+-signals at RBEKO/KO AZs (Figure 6E,F; long axis (L.A.) = 1317 ± 49 nm, S.D. = 384 nm, short axis (S.A.) = 906 ± 36 nm, S.D. = 284 nm; n = 61 AZs in 15 IHCs, N = 7 vs. L.A. = 1083 ± 33 nm, S.D. = 283 nm; (p=0.00016, t-test), S.A. = 793 ± 27 nm, S.D. = 233 nm, (p=0.0029, t-test); n = 74 AZs in 15 IHCs, N = 8 for RBEWT/WT). This larger spread of the presynaptic Ca2+-signals is in agreement with the presence of several CaV1.3-immunofluorescent clusters at RBEKO/KO synapses. In order to exclude lower IHC Ca2+-buffering to contribute to the observed larger spread of presynaptic Ca2+-signals, we performed semi-quantitative immunofluorescence analysis for the three major cytosolic Ca2+-buffers, the EF-hand Ca2+-binding proteins parvalbumin-α, calretinin and calbindin-28k (Pangršič et al., 2015). We did not find any significant differences in their immunofluorescence intensity between IHCs of both genotypes (in arbitrary units, parvalbumin intensity: 2.24 ± 0.15, S.D. = 1.04 for RBEKO/KO vs. 1.88 ± 0.15, S.D = 1.01 for RBEWT/WT, p=0.08; calbindin intensity: 0.82 ± 0.06, S.D. = 0.43 for RBEKO/KO vs.0.95 ± 0.07, S.D. = 0.49 for RBEWT/WT, p=0.23; calretinin intensity: 0.91 ± 0.04, S.D. = 0.26 for RBEKO/KO vs. 0.82 ± 0.04, S.D. = 0.28 for RBEWT/WT, p=0.09; n = 49 cells and N = 4 for both conditions, Mann-Whitney-Wilcoxon test for all; Figure 6—figure supplement 1).
IHC exocytosis is normal for strong depolarizations but mildly reduced for weak ones
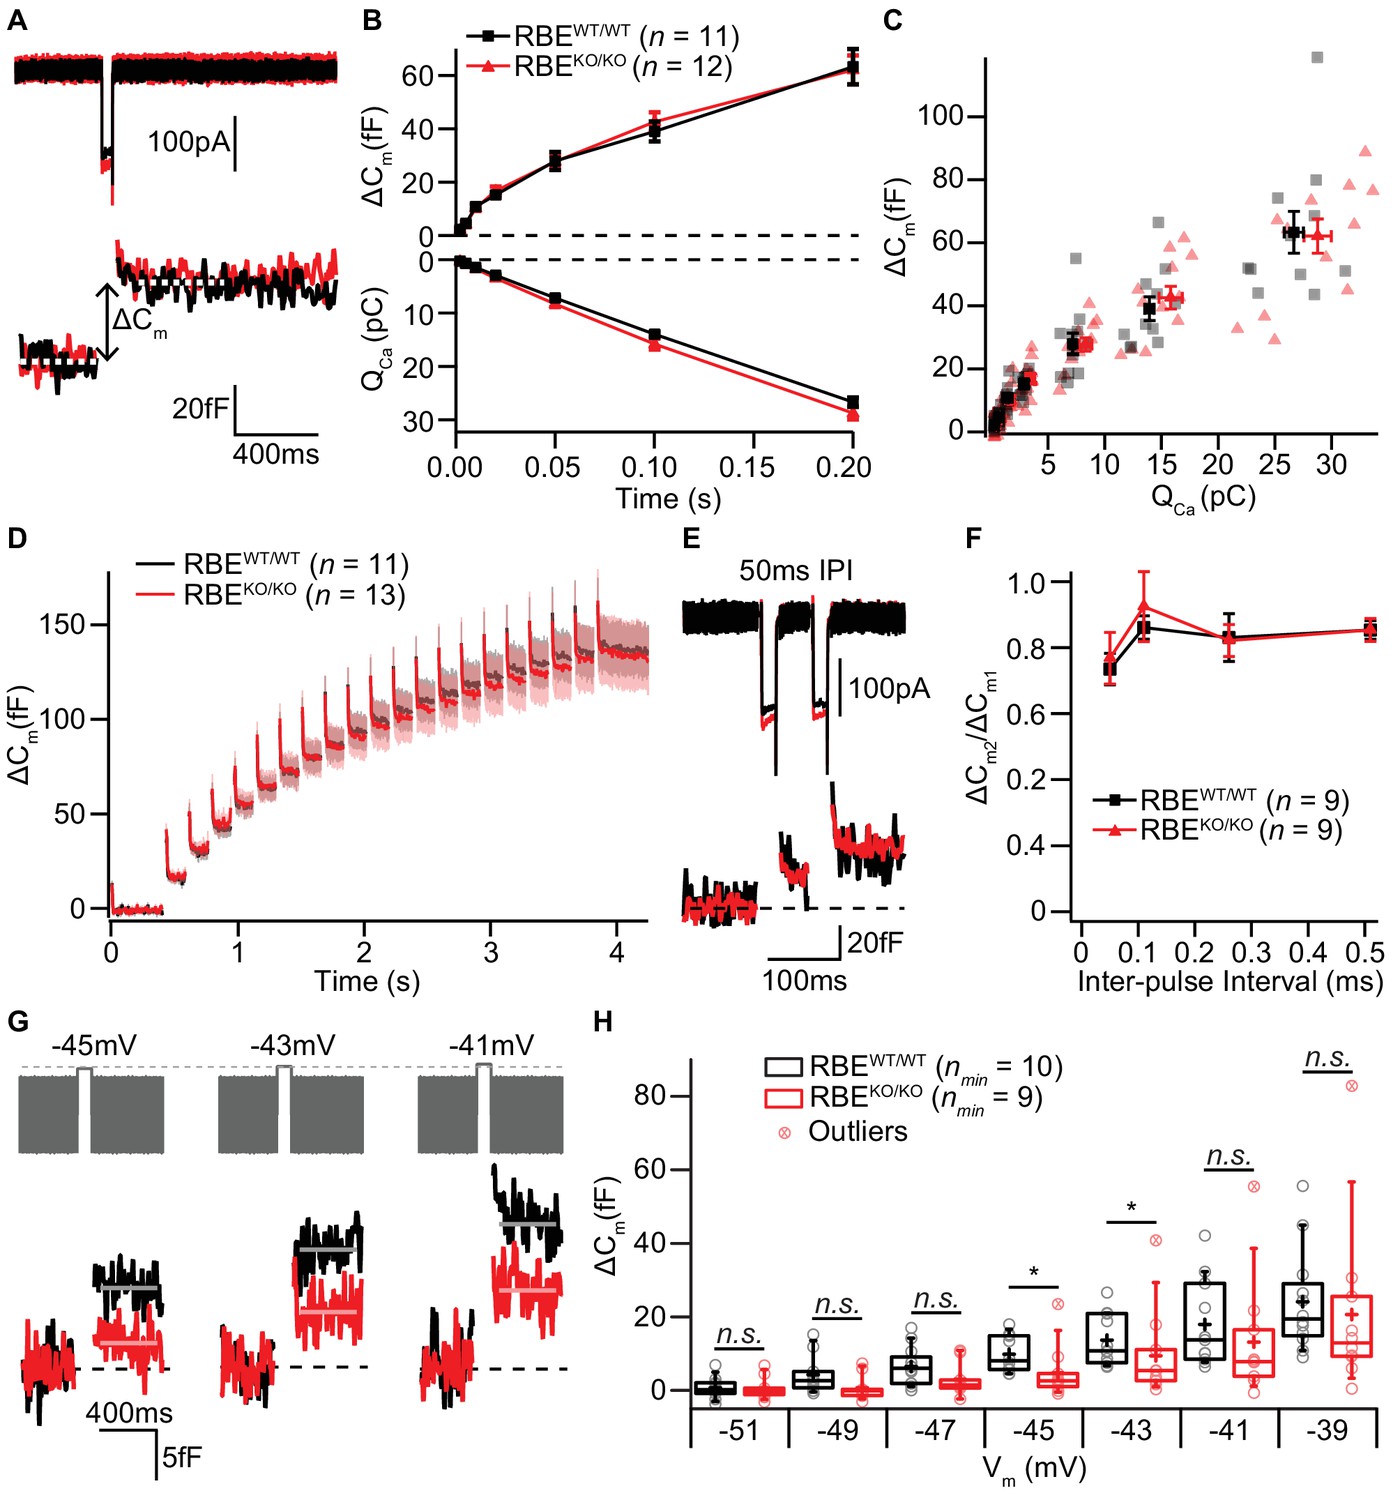
The ribbon has been proposed to play a crucial role in the exocytosis of SVs at the IHC AZ (Khimich et al., 2005). Therefore, we monitored stimulated exocytosis of SVs with perforated-patch whole-cell recordings of exocytic membrane capacitance changes (ΔCm). Using IHCs from 2/3-week-old RBEWT/WT and RBEKO/KO mice, we found that ΔCm in response to step-depolarizations to the potential that elicits maximal Ca2+-influx (−14 mV) were not different between IHCs with or without ribbons. Both, fast exocytosis elicited by depolarizations of up to 20 ms, attributed to the fusion of the readily releasable pool of SVs (RRP, Moser and Beutner, 2000), and longer stimuli, thought to reflect sustained exocytosis, ongoing SV replenishment and fusion, were unaltered in RBEKO/KO IHCs (Figure 7A,B,C). On average, ΔCm induced by 20 ms long maximal Ca2+-influx was 16.70 ± 1.67 fF (S.D. = 5.80 fF; n = 12 cells, N = 7) for RBEKO/KO compared to 15.22 ± 0.98 fF (S.D. = 3.26 fF; n = 11 cells, N = 8) for RBEWT/WT. Exocytic ΔCm elicited by 200 ms long maximal Ca2+-influx (same IHCs as for 20 ms), on average, amounted to 62.09 ± 5.40 fF (S.D. = 18.70 fF) for RBEKO/KO versus 63.28 ± 6.64 fF (S.D. = 22.04 fF) for RBEWT/WT.
Figure 7
IHC exocytosis is normal for strong depolarizations but mildly reduced for weak ones.
(A) Representative Ca2+-currents (top) and corresponding low passed-filtered membrane capacitance (ΔCm) traces recorded from RBEWT/WT and RBEKO/KO IHCs upon 50 ms depolarizations from −69 to −14 mV. (B) Cumulative exocytosis (exocytic ΔCm, top) and corresponding Ca2+-charge (QCa, bottom) of RBEWT/WT (n = 11 cells, N = 8) and RBEKO/KO (n = 12 cells, N = 7) IHCs as a function of stimulus duration (2 to 200 ms to −14 mV) were unaltered in RBEKO/KO IHCs. Data is presented as mean ± S.E.M as for (F). (C) Relating ΔCm to the corresponding QCa indicated comparable Ca2+ efficiency of exocytosis between RBEWT/WT and RBEKO/KO IHCs. Mean ± S.E.M. for each pulse duration is presented in black and red; individual IHCs data points are overlaid. (D) Mean ΔCm traces (shaded areas: S.E.M.) in response to trains of 20 ms depolarizations from −87 to −17 mV (20 stimuli separated by 160 ms) of RBEWT/WT (n = 11 cells, N = 5) and RBEKO/KO (n = 13 cells, N = 8) IHCs show comparable exocytic ΔCm. (E) Representative low pass-filtered ΔCm traces in response to a pair of 20 ms pulses to −17 mV, separated by a 50 ms of inter-pulse interval (IPI). (F) Ratios of exocytosis (ΔCm2/ ΔCm1) to a pair of 20 ms pulses with varying inter-pulse intervals (50, 110, 260 and 510 ms) reveal a comparable recovery from RRP depletion between RBEWT/WT (n = 9 cells, N = 6) and RBEKO/KO IHCs (n = 9 cells, N = 6). (G) Representative low pass-filtered ΔCm traces in response to 100 ms step-depolarizations to −45, –43 and −41 mV. (H) Box plot and single values of ΔCm elicited by 100 ms step-depolarizations of RBEWT/WT (nmin = 10 cells, N = 8) and RBEKO/KO (nmin = 9 cells, N = 9) IHCs to different potentials. Exocytic ΔCm of RBEKO/KO IHCs was reduced for mild depolarizations (−45, –43 and −41 mV; p=0.0115, p=0.0295 and p=0.1321, respectively; p=0.0017, p=0.0042 and p=0.0489, without definitive outliers; Mann-Whitney-Wilcoxon test), but comparable to RBEWT/WT IHCs at stronger depolarizations (−39 mV; p=0.2030, Mann-Whitney-Wilcoxon test). Box plots show 10, 25, 50, 75 and 90th percentiles with the individual data points overlaid.
Moreover, trains of 20 step-depolarizations to −17 mV of 20 ms pulse duration did not reveal impaired exocytosis in RBEKO/KO IHCs, even when the inter-stimulus interval time was as short as 160 ms (Figure 7D; n = 11 cells, N = 5 for RBEWT/WT and n = 13 cells, N = 8 for RBEKO/KO). We further explored RRP recovery from partial depletion using a paired-pulse protocol (two strong 20 ms depolarizations to −14 mV separated by 50, 110, 260 and 510 ms inter-pulse intervals; Figure 7E,F). RRP recovery, estimated as the ΔCm ratio of the second and the first pulse, was not altered in RBEKO/KO IHCs at least when probing RRP exocytosis with maximal Ca2+-influx from a hyperpolarized resting potential (Figure 7F). These data are in strong contrast to our previous findings in IHCs of bassoon mutant mice, which we had equivalently analyzed. There, the loss of synaptic ribbons, combined with a loss of functional bassoon resulted in profound deficits in exocytosis (Khimich et al., 2005; Frank et al., 2010; Jing et al., 2013).
Given the finding of a small depolarized shift in the operating range of Ca2+-channels in RBEKO/KO IHCs (Figure 6D), we also probed the voltage-dependence of ΔCm elicited by 100 ms step-depolarizations (Figure 7G,H). In agreement with the results obtained at maximal Ca2+-influx, we did not find significant differences in ΔCm for stronger depolarizations (e.g. pulses to −39 mV elicited an average ΔCm of 20.67 ± 7.46 fF, S.D. = 23.58 fF, nmin = 10 IHCs, N = 9 for RBEKO/KO vs. 24.12 ± 4.04 fF, S.D. = 13.98 fF, nmin = 10 IHCs, N = 9 for RBEWT/WT; p=0.20; Mann-Whitney-Wilcoxon test). However, for weaker depolarizations in the range of physiological receptor potentials (Russell and Sellick, 1983), we observed a subtle but significant reduction in exocytosis for RBEKO/KO IHCs (Figure 7H, p=0.0115, p=0.0295 and p=0.1321 for −45, –43 and −41 mV; without definitive outliers as determined by Graphpad Prism: p=0.0017, p=0.0042 and p=0.0489, respectively; Mann-Whitney-Wilcoxon test for all). For instance, depolarization to −45 mV elicited a ΔCm of 4.79 ± 2.26 fF for RBEKO/KO (S.D. = 7.14 fF; nmin = 10 cells, N = 9) compared to 9.85 ± 1.60 fF for RBEWT/WT (S.D. = 5.05 fF; nmin = 10 cells, N = 8). The Ca2+-current integral (Ca2+-charge, QCa), as well, tended to be reduced for RBEKO/KO IHC at these mild depolarizations, which, however, did not reach statistical significance (e.g. QCa for −45 mV: 3.90 ± 0.49 pC, S.D. = 1.54 pC for RBEKO/KO vs. 5.15 ± 0.54 pC, S.D. = 1.72 pC for RBEWT/WT; p=0.1053; t-test). In summary, we found exocytosis to be unaltered for strong depolarizations but mildly decreased for more physiological stimuli in RBEKO/KO IHCs, which is in line with the findings of the companion paper by Becker et al..
Lack of synaptic ribbons impairs synchronous activation of the auditory pathway
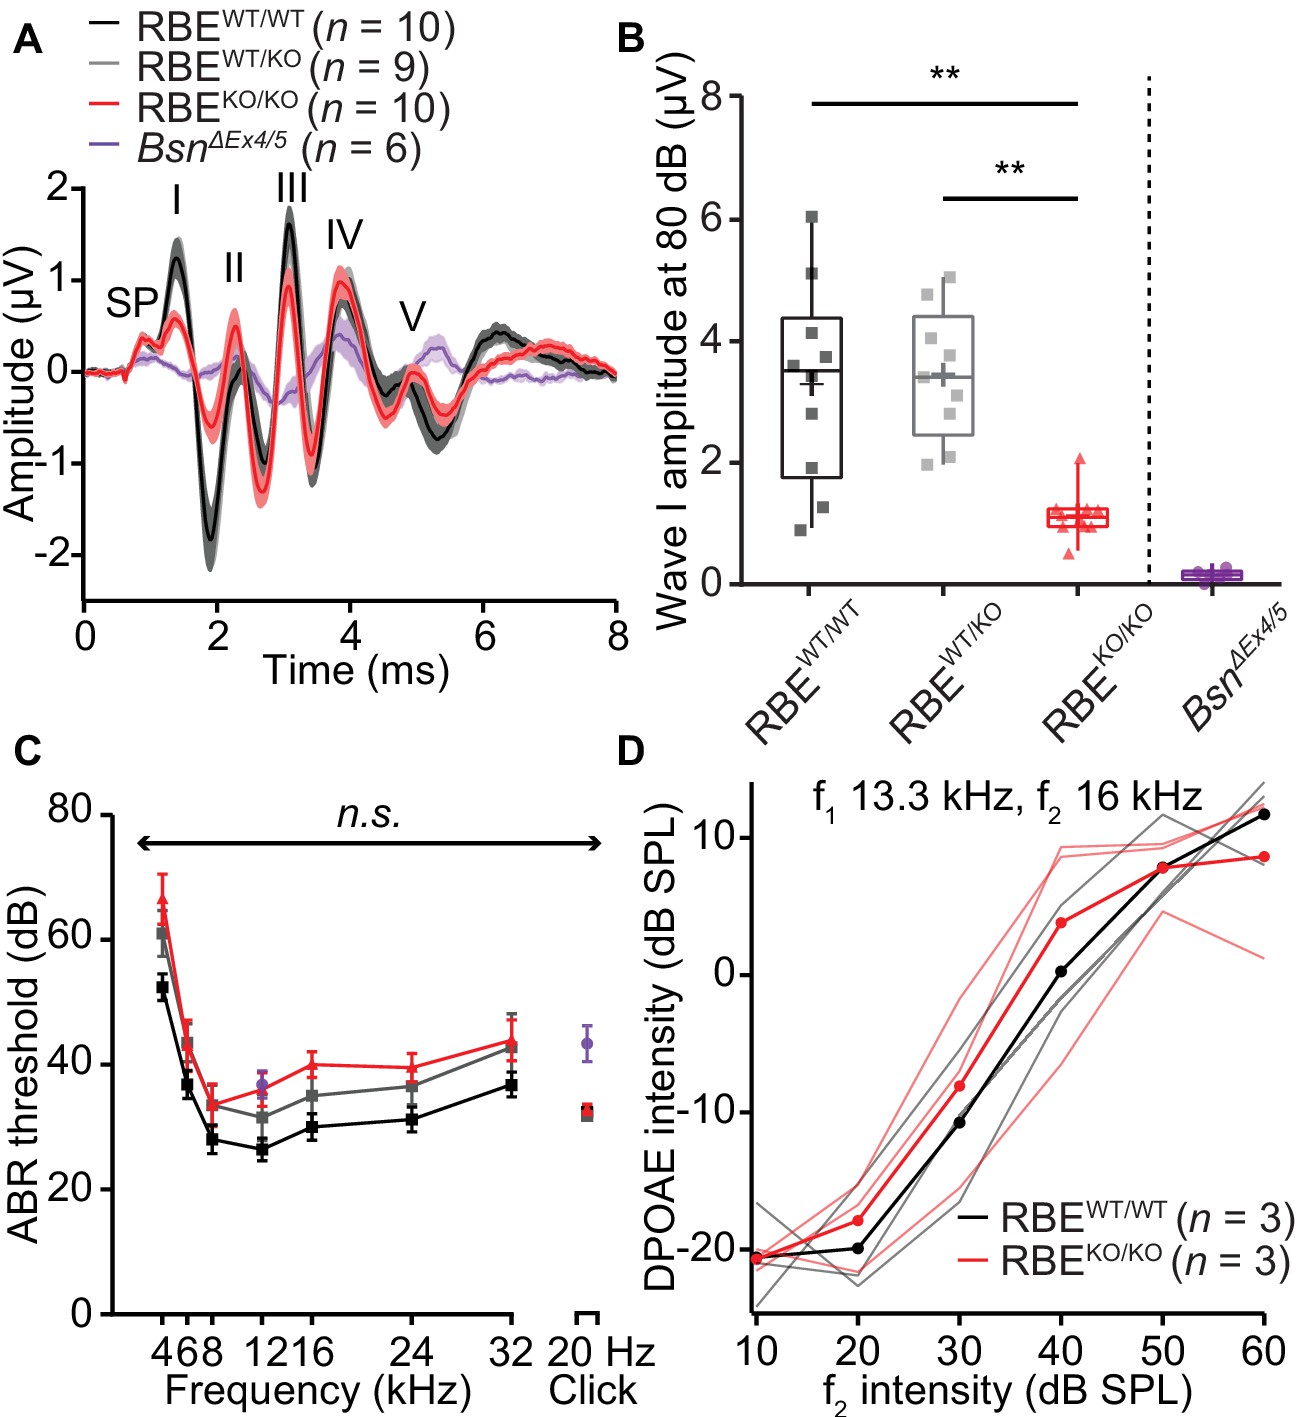
Next, we studied sound encoding in RBEKO/KO mice in vivo. First, we recorded auditory brainstem responses (ABR) and found a significant reduction in the amplitude of wave I that reflects the SGN compound action potential (1.14 ± 0.13 µV, S.D. = 0.38 µV, N = 10 for RBEKO/KO vs. 3.30 ± 0.51 µV, S.D. = 1.54 µV, N = 10 for RBEWT/WT, p=0.0007, NPMC test). This indicates less synchronous SGN activation in the absence of synaptic ribbons (Figure 8A,B). The subsequent ABR waves (Figure 8—figure supplement 1) were normal in amplitude (waves II, IV and V, while wave III was reduced) indicating a degree of central auditory compensation for the sound encoding deficit, for example via coincidence detection of converging SGN input in the cochlear nucleus (Joris et al., 1994; Strenzke et al., 2009). We found a non-significant trend of ABR threshold to be increased across all frequencies in RBEKO/KO mice (approximately 10 dB across all frequencies, Figure 8C; refer to the companion paper Becker et al. showing significantly increased ABR-thresholds based on a larger sample, N = 28 RBEKO/KO mice vs. 22 RBEWT/WT mice). Cochlear amplification, probed by recordings of distortion product otoacoustic emissions (DPOAE, Figure 8D), was intact in RBEKO/KO mice. Additionally, RBEWT/KO mice showed no significant changes in ABR wave I amplitudes and ABR thresholds (Figure 8), suggesting that the subtle morphological differences observed for afferent synapses of RBEWT/KO IHCs by electron and confocal-immunofluorescence microscopy did not turn into a deficit of sound coding measurable by ABR recordings. The wave I amplitude reduction and ABR threshold elevation were much less pronounced than in bassoon mutant mice (Khimich et al., 2005; Buran et al., 2010; Jing et al., 2013).
Figure 8 with 1 supplement see all
Auditory brainstem responses indicate impaired synchronous SGN activation in RBEKO/KO mice.
(A) Average ABR waveforms in response to 80 dB clicks (n = N = 10 for RBEKO/KO and RBEWT/WT, N = 9 for RBEWT/KO at 6 weeks of age) showed a reduced amplitude of ABR wave I in RBEKO/KO mice indicating an impairment of SGN activation, which is quantified in (B). This decrease was not as pronounced as in SGNs lacking bassoon (BsnΔEx4/5, data from Jing et al., 2013). The central ABR waves were better preserved, except for wave III. SP: summating potential (hair cell receptor potential), roman numerals (I–V): ABR waves generated along the early auditory pathway. Mean (lines) ± S.E.M. (shaded areas) are displayed. (B) ABR wave I was significantly reduced in RBEKO/KO mice as compared to RBEWT/WT and RBEWT/KO (p=0.0051 and p=0.0017, respectively, NPMC test). No statistical significance was observed between responses recorded in RBEWT/WT and RBEWT/KO mice (p>0.9999, NPMC test). Data from BsnΔEx4/5 are shown for comparison. Box plots show 10, 25, 50, 75 and 90th percentiles with the individual data points overlaid, means are shown as crosses. (C) ABR thresholds were comparable in RBEWT/WT, RBEWT/KO and RBEKO/KO for tone burst-driven (n.s., Tukey’s test) and click-driven ABRs (n.s., NPMC test). Previously published data for BsnΔEx4/5 showed elevated thresholds as a response to short stimuli (click 20 Hz) but a similar threshold level at 12 kHz. (D) DPOAE amplitude in response to pairs of simultaneous sine waves (f1 and f2, frequencies indicated on panel) at increasing stimulus intensity (f1 intensity 10 dB above f2 in all cases). Mean (thick lines) and data from individual mice (n = N = 3 in RBEWT/WT and RBEKO/KO) are displayed.
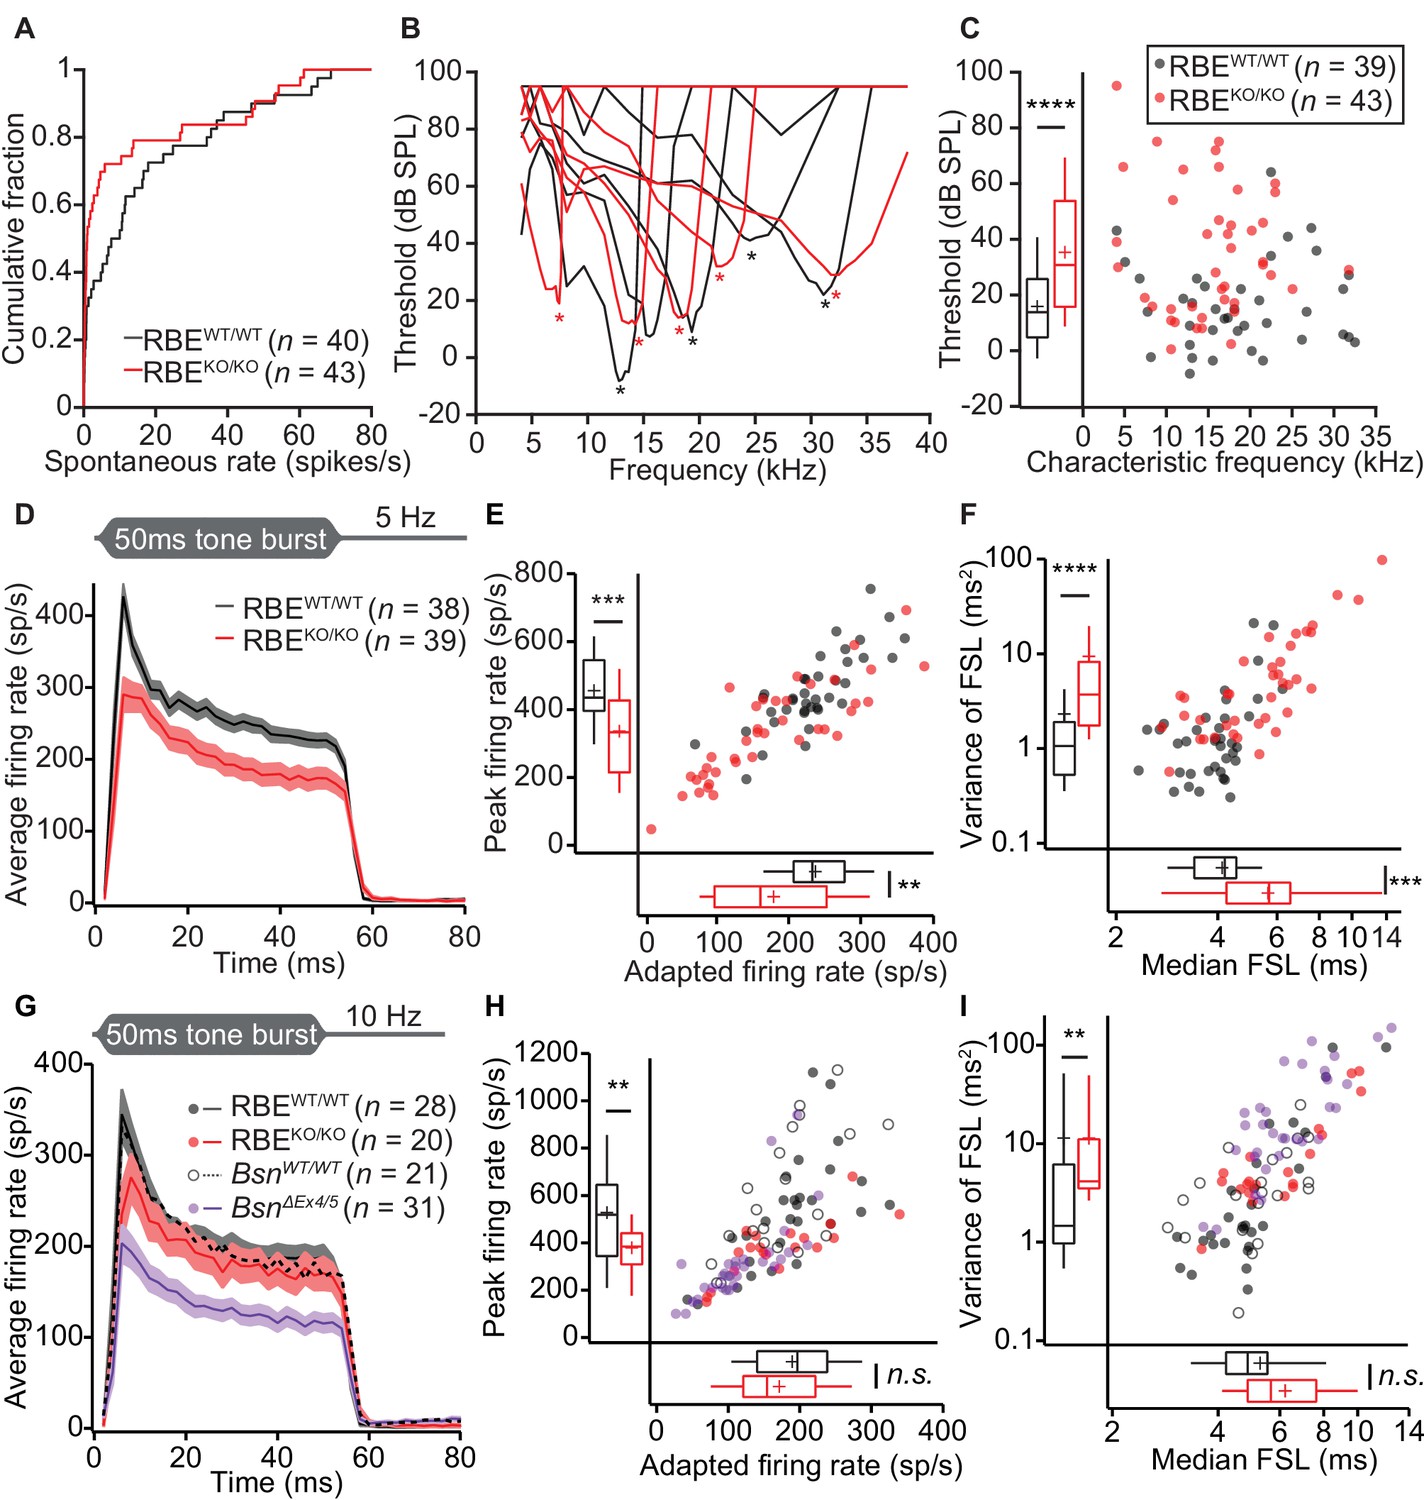
We then turned to in vivo extracellular recordings from single auditory neurons by targeting glass microelectrodes to where the auditory nerve enters the anteroventral cochlear nucleus (AVCN) in the brainstem (Taberner and Liberman, 2005; Jing et al., 2013). ‘Putative’ SGNs (hereafter dubbed SGN for simplicity) were identified based on the depth of electrode position and their firing response to pure-tone stimulation (primary-like peristimulus time histogram and latency, Figure 9) and analyzed in separation from ‘putative’ cochlear nucleus neurons (Figure 10). Since all firing of the individual SGN is thought to be driven by transmitter release from a single IHC AZ (Heil et al., 2007; Liberman, 1978; Robertson and Paki, 2002), these recordings provide insight into single AZ function. We first assessed the spontaneous firing activity and found an increased abundance of SGNs with low spontaneous firing rates in RBEKO/KO mice (72% with rates < 10 Hz, n = 43 SGNs, N = 9 vs. 50% in RBEWT/WT, n = 40 SGNs, N = 8; p=0.0267, Kolmogorov-Smirnov test; Figure 9A). Frequency tuning was intact in RBEKO/KO SGNs (Figure 9B): the sharpness of tuning expressed by the Q10dB (width of tuning curve 10 dB above threshold at the characteristic frequency (Cf) normalized by Cf) was comparable (mean: 9.28 ± 1.01, S.D. = 6.32 and median: 7.41 for RBEKO/KO SGNs, n = 39 SGNs, N = 9 vs. mean: 12.50 ± 1.98, S.D. = 11.91 and median: 8.36 for RBEWT/WT SGNs, n = 36 SGNs, N = 9; p=0.28, Mann-Whitney-Wilcoxon test). However, the sound threshold at Cf was significantly elevated by almost 20 dB in RBEKO/KO mice (35.60 ± 3.45 dB SPL, S.D. = 22.66 dB SPL for RBEKO/KO SGNs, n = 43 SGNs, N = 9 vs. 16.05 ± 2.47 dB SPL, S.D. = 15.42 dB SPL for RBEWT/WT SGNs, n = 39 SGNs, N = 9, p<0.0001, Mann-Whitney-Wilcoxon test; Figure 9C). Given the normal frequency tuning and DPOAE, this threshold increase seems unlikely to result from a putative functional cochlear deficit upstream of the IHCs.
Figure 9
Impaired spontaneous and sound-evoked firing in putative SGNs of RBEKO/KO mice.
(A) Cumulative distribution functions of spontaneous firing rates of putative SGNs showed a higher fraction of low spontaneous rate SGNs in RBEKO/KO mice (n = 43 SGNs) than in RBEWT/WT mice (n = 40 SGNs, N = 8) (p=0.027, Kolmogorov-Smirnov test). (B) Representative frequency tuning curves of RBEKO/KO and RBEWT/WT SGNs showed comparable sharpness of tuning between SGNs of both genotypes. * point to the characteristic frequency (Cf) for which an increase in SGN firing requires the least sound pressure level. (C) Thresholds at Cf of RBEKO/KO SGNs (n = 43 SGNs, N = 9) were higher than those in RBEWT/WT mice (n = 39 SGNs, N = 9) (p<0.0001, Mann-Whitney-Wilcoxon test). Box plots show 10, 25, 50, 75 and 90th percentiles, means are shown as crosses, as for (E), (F), (H) and (I). (D) Average PSTH (bin width = 2 ms) of RBEKO/KO (n = 39 SGNs, N = 8) and RBEWT/WT SGNs (n = 38 SGNs, N = 9) recorded in response to 50 ms tone bursts at Cf 30 dB above threshold at a stimulus rate of 5 Hz. The time course of adaptation of RBEKO/KO SGNs (calculated by fitting a single exponential function to the individual histograms) was significantly longer (p=0.033, Mann-Whitney-Wilcoxon test). Mean (line) ± S.E.M. (shaded areas) are displayed as for (G). (E) Scatterplot of peak firing rate (bin with highest rate at sound onset) and adapted firing rate (averaged 35–45 ms from response onset) revealed lower firing rates in RBEKO/KO (n = 39 SGNs) as compared to RBEWT/WT (n = 38 SGNs, N = 9) mice (data from (D), peak rate: p=0.0001, adapted rate: p=0.0023, Mann-Whitney-Wilcoxon test). (F) Increased latency (data from (D), p=0.0002) and variance of latency (p<0.0001, Mann-Whitney-Wilcoxon test) of the first spike after sound onset in RBEKO/KO SGNs indicated lower temporal precision of sound onset coding. (G) Average PSTH (bin width = 2 ms) of RBEKO/KO (n = 20 SGNs, N = 6) and RBEWT/WT SGNs (n = 28 SGNs, N = 8) were recorded in response to 50 ms tone bursts at Cf 30 dB above threshold at a stimulus rate of 10 Hz and showed a similar adapted response in RBEKO/KO as compared to lower stimulation rates (Figures 9,11) but still a lower onset response than in RBEWT/WT SGNs. Responses in BsnΔEx4/5 mutants (shown for comparison, re-plotted from Jing et al., 2013) were considerably lower. (H) Scatterplot of peak firing rate (bin with highest rate at sound onset) and adapted firing rate (averaged 35–45 ms from response onset) show decreased onset firing rates in RBEKO/KO as compared to RBEWT/WT mice (data from (G), p=0.0093, Mann-Whitney-Wilcoxon test). The adapted response was comparable in both cases (p=0.3584, t-test). Data points from BsnΔEx4/5 mutants (re-plotted from Jing et al., 2013) and WT littermates are shown for comparison, also in (I). (I) Increased variance of first spike latency after sound onset in RBEKO/KO SGNs (p=0.0089, Mann-Whitney-Wilcoxon test) and comparable latencies were observed at this stimulation frequency (data from (G), p=0.0761, Mann-Whitney-Wilcoxon test).
Figure 10

Responses to pure tones in cochlear nucleus cells showed that the mutant phenotype is partially compensated in higher stations of the auditory pathway.
(A) Quantification of peak and adapted responses to 50 ms tone burst stimulation, 30 dB above threshold at Cf in SGNs displaying a chopper discharge pattern (periodically alternating phases of high firing rates with low firing rates, typical of multipolar cells in the posterior ventral cochlear nucleus), showed that the differences in rate faded away opposite to those shown at the level of the auditory nerve. Peak rates were still significantly lower in RBEKO/KO (n = 29 SGNs, N = 9) as compared to RBEWT/WT (n = 16 SGNs, N = 9) mice (p=0.0303, Mann-Whitney-Wilcoxon test), while the adapted rate showed a non-significant trend towards reduction in RBEKO/KO (p=0.0538, t-test). Box plots show 10, 25, 50, 75 and 90th percentiles and means are shown as crosses, as for (B). (B) Same recordings paradigm as (A) performed in a fiber with bushy cell discharge pattern (similar to the one found in SGNs, typical also in this type of cochlear nucleus neurons) showed comparable responses in both peak (p=0.2601, Mann-Whitney-Wilcoxon test) and adapted rate (p=0.0510, Mann-Whitney-Wilcoxon test) in RBEKO/KO (n = 19 SGNs, N = 7) and RBEWT/WT (n = 28 SGNs, N = 10).
Next, we studied the firing response of SGNs to 50 ms tone bursts (at Cf and 30 dB above sound threshold, 200 ms inter-stimulus interval), which is governed by the presynaptic glutamate release and postsynaptic spike generation. The peak firing rate at sound onset is thought to reflect the initial rate of release from the SV-occupied release sites of the RRP (‘standing RRP’, [Oesch and Diamond, 2011; Pangršič et al., 2012]). Refractoriness and the decline of release rate due to partial depletion of the standing RRP likely dominate the subsequent spike rate adaptation. Finally, the adapted firing rate reports SV replenishment and subsequent fusion (reviewed in Pangršič et al., 2012; Rutherford and Moser, 2016). We observed reduced spike rates of SGNs from RBEKO/KO mice (Figure 9D,E) both at sound onset (p=0.0001, n = 39 SGNs, N = 8 in RBEKO/KO and n = 38 SGNs, N = 9 in RBEWT/WT, t-test) and after short-term adaptation (p=0.0023, Mann-Whitney-Wilcoxon test). Both, peak and adapted rates were similarly affected by the RIBEYE-disruption, indicated by the scatter plot of peak vs. adapted rates (Figure 9E). A significant peak rate reduction was also observed at higher stimulation frequencies (10 Hz, Figure 9G–H). The spike rates were better preserved in RBEKO/KO SGNs than in SGNs of bassoon mutant mice (BsnΔex4/5 data of Jing et al. (2013), purple data in Figure 9G–I). We approximated adaptation within the 50 ms response by single-exponential fitting since double exponential fitting did not regularly report two temporally discernible components in RBEKO/KO SGNs. The mean apparent adaptation time constant reported by single-exponential fitting were significantly slowed in RBEKO/KO SGNs (9.83 ± 0.50 ms, S.D. = 2.85 ms, median: 10.46 ms, n = 32 SGNs, N = 8) as compared to RBEWT/WT SGNs (8.71 ± 0.50 ms, S.D. = 3.05 ms, median: 8.73 ms, n = 37 SGNs, N = 9, p=0.033, Mann-Whitney-Wilcoxon test). The results of double-exponential fitting of RBEWT/WT and RBEKO/KO SGNs support the slowed adaptation kinetics and are presented in Table 1. As expected for the reduced peak firing rate, we found prolonged first spike latency which also showed greater temporal jitter (Figure 9F). The reduced peak firing rate together with increased first spike latency jitter likely explain the reduction in ABR wave I amplitude. The firing of putative AVCN neurons was better preserved: putative bushy cells showed normal sound driven rates and chopper cells only a mild reduction in peak rate (Figure 10).
Table 1
Average double-exponential fitting results to peristimulus time histograms obtained by 50 ms tone bursts 30 dB above threshold at Cf (200 ms inter-stimulus interval).
https://doi.org/10.7554/eLife.29275.018| Fast time constant | Slow time constant | Amplitude fast component | Amplitude slow component | R | |
|---|---|---|---|---|---|
| RBEWT/WT | 6.31 ± 0.77 | 95.63 ± 24.21 | 484.61 ± 104.76 | 58.42 ± 12.90 | 0.93 ± 0.00 |
| RBEKO/KO | 18.79 ± 6.91 | 101.66 ± 27.77 | 310.56 ± 73.60 | 64.92 ± 107.49 | 0.91 ± 0.01 |
| p-value | 0.0045 | 0.3580 | 0.0519 | 0.5475 | 0.2041 |
Next, we explored the encoding of sound intensity by estimating the mean firing rate during 50 ms tone bursts at different sound pressure levels. These ‘rate-level functions’ (Figure 11A) indicated that the spike rate increase with the sound pressure level (p=0.068, n = 24 SGNs, N = 8 in RBEKO/KO and n = 19 SGNs, N = 7 in RBEWT/WT, Mann-Whitney-Wilcoxon test, Figure 11—figure supplement 1A) and the dynamic range of sound coding (sound pressure level for which the spike rate changes from 10–90%, Figure 11—figure supplement 1B, p=0.3044, t-test) were not significantly altered. We then used transposed tones (Cf at 500 Hz modulation frequency) in order to probe for the temporal fidelity and reliability of firing in RBEKO/KO SGNs in the steady state (Figure 11D). These experiments corroborated the reduced maximal firing rate of RBEKO/KO SGNs (n = 22 SGNs, N = 7 in RBEKO/KO and n = 15 SGNs, N = 6 in RBEWT/WT, p<0.0001, t-test) and indicated that the temporal precision of sound coding is impaired also in the steady state (reduced Synchronization Index: p=0.0043, t-test).
Figure 11 with 1 supplement see all
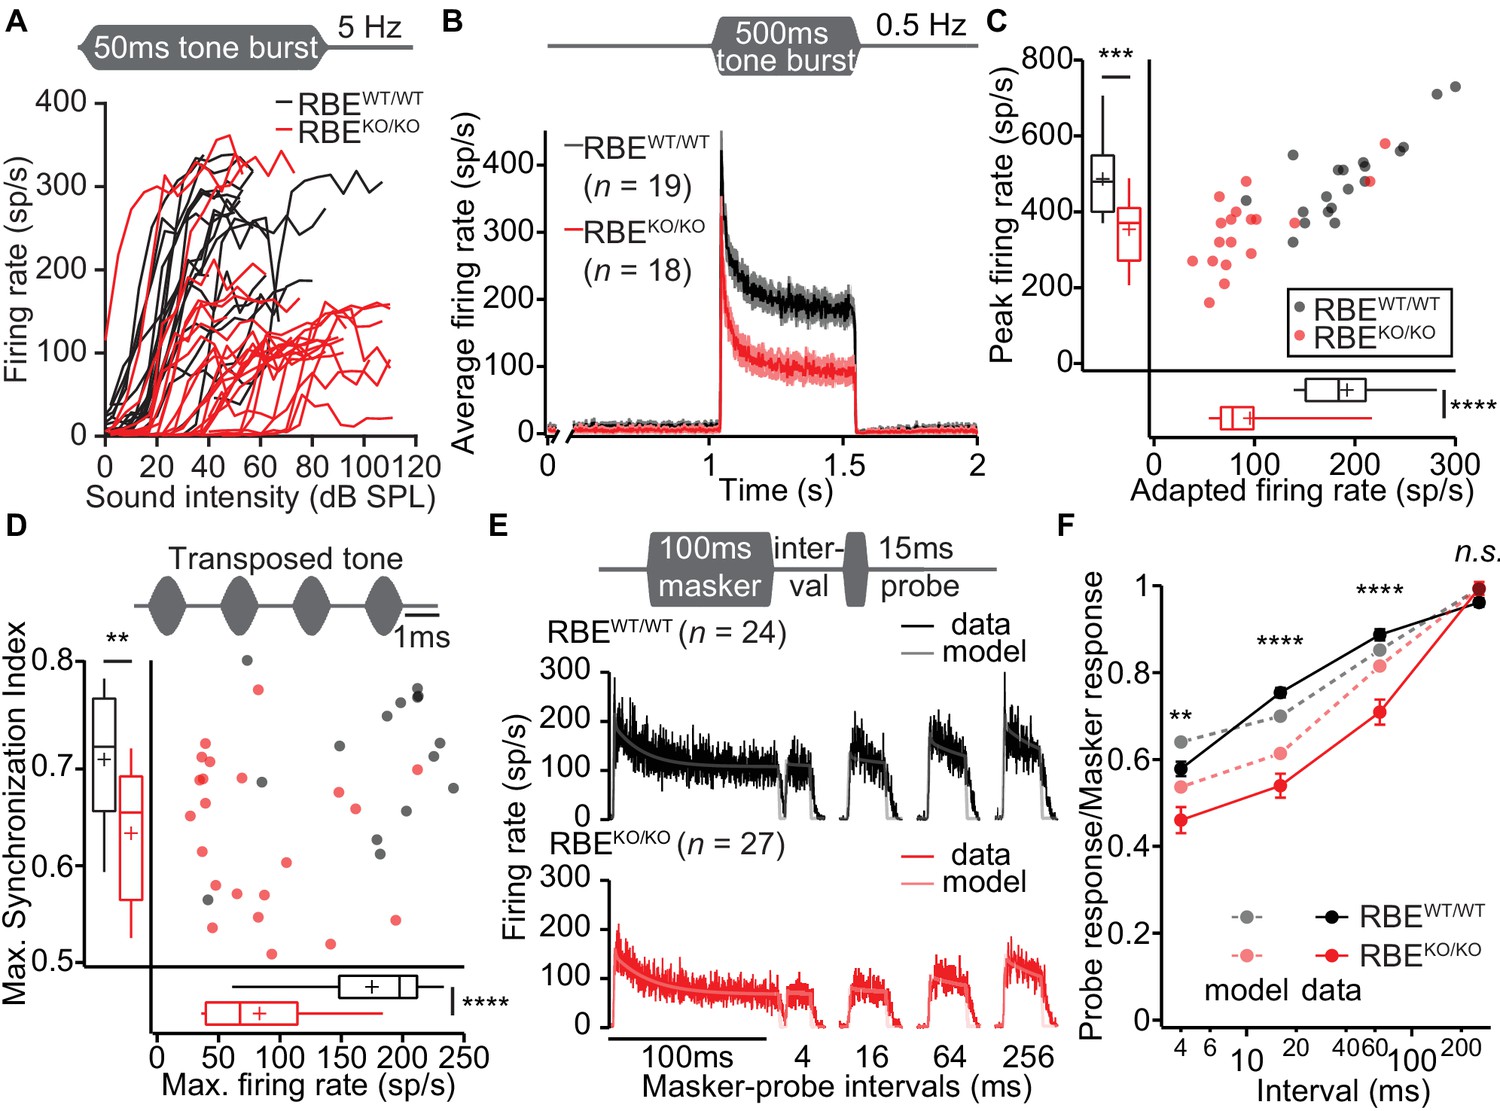
Lack of ribbons impairs vesicle replenishment in RBEKO/KO mice.
(A) Intensity coding was largely preserved for suprathreshold sound stimulation: rate-level functions (average increase in spike rate with stimulus intensity) of SGNs in response to 50 ms tone bursts at Cf at 5 Hz corroborated the notion of increased sound threshold but were otherwise comparable in RBEKO/KO (n = 24 SGNs, N = 8) and RBEWT/WT (n = 19 SGNs, N = 7) mice, for quantification see Figure 11—figure supplement 1C. (B) Average PSTH recorded in response to 50 × 500 ms tone bursts at Cf and 30 dB above threshold at a stimulus rate of 0.5 Hz (bin width = 2 ms): the onset response to this stimulus was preserved better in RBEKO/KO SGNs (n = 18 SGNs, N = 7) as compared to higher stimulation rates (Figure 9), but it was still lower than in RBEWT/WT SGNs (n = 19 SGNs, N = 7), as well as the adapted firing rate. Mean (line) ± S.E.M. (shaded areas) are displayed. (C) Scatterplot of peak (highest 2 ms bin) and adapted (averaged 405–415 ms from response onset) firing rates: significantly reduced peak (p=0.0005, t-test) and adapted (p<0.0001, Mann-Whitney-Wilcoxon test) rates in RBEKO/KO SGNs. Box plots show 10, 25, 50, 75 and 90th percentiles and means are shown as crosses, as for (D). (D) Temporal precision and reliability of sound coding is impaired in RBEKO/KO SGNs. Synchronization of firing to stimulus and firing rates (reflecting spike probability) were reduced when probed with amplitude-modulated (transposed) tones (continuous stimulation with a carrier frequency at Cf and at a modulation frequency of 500 Hz) (p=0.0043, t-test, for synchronization index, and p<0.0001, t-test, for firing rate, when comparing RBEKO/KO (n = 22 SGNs, N = 7) and RBEWT/WT (n = 15 SGNs, N = 6) SGNs). (E) Forward masking experiments were used to study presynaptic SV dynamics: a stimulus complex consisting of a 100 ms masker stimulus, a silent interval of 4/16/64/256 ms and a 15 ms probe (both at the characteristic frequency, 30 dB above threshold) was presented at 2 Hz. The averaged data after alignment of RBEWT/WT (n = 24 SGNs, N = 7, black) and RBEKO/KO (n = 27 SGNs, N = 8, red) SGNs responses are displayed as described in Materials and methods. On top of the data we present a fit of a biophysical model (light gray and pink lines) to the data used to study the SV dynamics at the AZ. The refilling and fusion rate constant during spontaneous and stimulated conditions as well as the number of occupied release sites are provided in Table 2. (F) Recovery of onset response showed as ratio of probe and masker response (number of spikes during first 10 ms, mean ± S.E.M), and prediction (dashed lines) derived from the model fit shown in (E). Recovery was slower in RBEKO/KO SGNs (n = 27 SGNs, N = 8) as compared to RBEWT/WT (n = 24 SGNs, N = 7) with significant differences in the ratio after 4 ms (p=0.0019, t-test), 16 ms (p<0.0001, Mann-Whitney-Wilcoxon test), and 64 ms masker-probe intervals (p<0.0001, Mann-Whitney-Wilcoxon test), but not after 256 ms (p=0.0835, t-test).
In order to further scrutinize the potential role of the synaptic ribbon in vesicle replenishment, we studied the response to prolonged tone-stimulation (Figure 11B, 500 ms at Cf and 30 dB above threshold, 2 s inter-stimulus interval). The peak rate was better preserved in RBEKO/KO SGNs than seen with shorter inter-stimulus interval (e.g. 200 ms, Figure 9C), likely reflecting more complete SV-replenishment (i.e. larger standing RRP) owing to the longer recovery interval (2 s vs. 200 ms). However, the adapted spike rate of RBEKO/KO SGNs was even more reduced than found with 50 ms tone bursts (to about half of that for RBEWT/WT SGNs, Figure 11B,C) highlighting the impaired SV replenishment during prolonged stimulation. Finally, we evaluated presynaptic vesicle pool dynamics by recording and modeling responses to forward masking protocols (Harris and Dallos, 1979), that are thought to reflect depletion and recovery of the RRP (Figure 11E,F; Figure 11—figure supplement 1C). We approximated the recovery from forward masking by single exponential fitting (Figure 11—figure supplement 1C) to provide an estimate of the kinetics of vesicle pool replenishment. The time constant of recovery was prolonged in RBEKO/KO SGNs (90.80 ± 8.66 ms, S.D. = 45.00 ms, n = 27 SGNs, N = 8 vs. 33.53 ± 5.74 ms, S.D. = 28.11 ms, in RBEWT/WT SGNs, n = 24 SGNs, N = 7, p<0.0001, Mann-Whitney-Wilcoxon test) indicating slowed RRP replenishment in the absence of the ribbon. We noted that SGNs showed considerably lower spontaneous and evoked rates during the forward masking paradigm compared to other stimulus protocols (compare Figure 11B E), likely due to enhanced RRP depletion with the more extended stimulation in this protocol.
Amplitude and waveform of the forward masking responses were consistent with a two-fold reduction of the number of contributing vesicular release sites of the RRP (N’slot: contributing release sites during forward masking, Nslot: the contributing release sites for the same AZs during tone bursts at 5 Hz stimulation). The ratio Nslots/N’slots was estimated to be 2.2 for RBEKO/KO and 2.3 for RBEWT/WT from the drop in spontaneous and evoked SGN spiking rates. We used a previously developed biophysical model of RRP dynamics and spike generation (Frank et al., 2010; Jung et al., 2015b) to extract information on fusion and replenishment rate constants as well as the Nslot by fitting the responses to tone bursts, that is PSTHs with 100, 200 and 2000 ms inter-stimulus interval, and also the forward masking spiking data across all recovery intervals (Figure 11E). Importantly, only the first 50 ms of the 500 ms stimulus response during the PSTH 2000 were included in the fit; any later adaptation processes were disregarded, as they were not accounted by the model’s equations.
The results of model fitting suggested that during the forward masking only about half of all release sites (Nslots) were engaged in the response (N’slots). Throughout, RBEKO/KO SGNs showed a lower fusion rate than the RBEWT/WT SGNs, reflecting the reduced onset response in RBEKO/KO SGNs. When more recovery time was allowed, that is in the 0.5 Hz tone burst and the forward masking, where recovery times from around 250 to 500 ms occured between the probe and subsequent masker, the onset response improved in RBEKO/KO. Consequently, the estimated fusion rate almost reached the level of RBEWT/WT in the forward masking fits. With the scaling factors of approximately 2, the estimates for the number of release sites were consistent between tone bursts and forward masking data, and in both cases only slightly smaller for the RBEKO/KO (Table 2). Taken together the fits from forward masking and tone bursts suggest that the total number of release sites (RRP) was only slightly reduced at ribbonless synapses of RBEKO/KO IHCs. However, a strong firing response at sound onset, that is release of a large standing RRP, required longer recovery indicating more efficient SV replenishment in the presence of ribbons, which is reflected in the larger refilling rate constants estimated by the model of RBEWT/WT synapses.
Table 2
Parameters for the biophysical model capturing the release dynamics during forward-masking and repetitive tone burst experiments
https://doi.org/10.7554/eLife.29275.021| Forward masking | All tone bursts – global fit | |||
|---|---|---|---|---|
| RBEWT/WT | RBEKO/KO | RBEWT/WT | RBEKO/KO | |
| Nslots | 8 | 6.5 | 15.6 | 13.7 |
| krefill, stim | 29.5 | 18.2 | 18.4 | 19.9 |
| krefill, spont | 13.3 | 7.1 | 5.59 | 2.71 |
| kfusion, stim | 32.2 | 31 | 82.5 | 45.1 |
| kfusion, spont | 0.6 | 0.9 | 0.63 | 0.54 |
Discussion
The role of the synaptic ribbon has remained a topic of intense research. Here, we studied the structure and function of IHC afferent synapses with SGNs in mice lacking RIBEYE, the core component of the synaptic ribbon. Morphologically, synapses of RBEKO/KO IHCs did not simply lack ribbons but instead appeared transformed to contacts where release from multiple AZ feeds into one postsynaptic bouton. Synaptic transmission was impaired at the ribbonless IHC synapses of RBEKO/KO mice. Spontaneous SGN firing was reduced, sound-evoked firing had higher sound thresholds, lower peak and adapted rates, recovered more slowly from adaptation and had a greater temporal jitter. Modelling of synaptic sound encoding corroborated the notion of reduced rates of SV fusion and replenishment at the ribbonless synapses of RBEKO/KO mice. Analysis of IHC function revealed a small depolarized shift in the operating range of the synaptic CaV1.3 Ca2+-channels, which likely contributes to the reduced spontaneous and evoked firing rates and to the elevated sound thresholds of RBEKO/KO SGNs. ΔCm recordings revealed a mild reduction of exocytosis but only for weaker depolarizations, which we primarily attribute to the depolarized shift of Ca2+-channel activation. In summary, our data support a role of the ribbon in vesicle replenishment and Ca2+-channel regulation at the AZs as required for synchronous activation of SGNs in normal hearing. However, our analysis of RBEKO/KO mice likely underestimated the role of the ribbon due to substantial compensation that is best illustrated by the striking transformation of AZ morphology and the mild ex vivo phenotype of IHC Ca2+-influx and exocytosis.
RIBEYE deletion transforms IHC synapses to ‘conventional-like’ presynaptic ultrastructure, where multiple ribbonless AZs collectively maintain large complements of Ca2+-channels and SVs
Our work confirms the central role of RIBEYE for forming synaptic ribbons (Schmitz et al., 2000; Magupalli et al., 2008; Maxeiner et al., 2016). We did not observe structures reminiscent of ‘ghost ribbons’ reported for ribeye mutants in zebrafish neuromast hair cells (Lv et al., 2016) in IHCs of RBEKO/KO mice. These ghost ribbons were characterized as a halo of synaptic vesicles around a non-electron-dense area that resembled in size, though smaller, and shape to a synaptic ribbon. In zebrafish, two gene copies of ribeye (ribeye a and b) exist, making it harder to achieve a complete knock-out (Lv et al., 2016; Van Epps et al., 2004). In keeping with this notion, Lv et al. found residual immunofluorescence of ribeye a in the double mutants. Hence, we speculate that residual RIBEYE, possibly together with other scaffold proteins such as piccolo, might have formed the observed electron-translucent SV-framed structures (Lv et al., 2016). In contrast, immunofluorescence, as well as electron microscopy, revealed the complete absence of RIBEYE and ribbons in IHCs of RBEKO/KO mice in our work and the companion study (Becker et al.), which is in agreement with findings in the RBEKO/KO mouse retina (Maxeiner et al., 2016).
IHC synapses normally employ a single ribbon-type AZ. But in the absence of RIBEYE, there were typically two or more ribbonless AZs, akin to multiple conventional AZs (Figure 2). These ribbonless ‘conventional’ AZs at RBEKO/KO IHC synapses consist mostly of roundish PDs, each with a cluster of SVs, of which approximately one third were directly adjacent to the plasma membrane (membrane-proximal: MP-SVs). Using electron tomography we found that about two-thirds of the MP-SVs were tethered to the AZ membrane, which was comparable to RBEWT/WT AZs (Figure 3). We speculate that SVs associated with the PD, but not facing the membrane (PDA-SVs), serve to replenish the release sites once tethered MP-SVs fused, and that the ribbonless PD more likely acts in long-range SV tethering to the AZ in analogy to what is considered for conventional AZs (Cole et al., 2016; Fernández-Busnadiego et al., 2013; Siksou et al., 2007). We assume that absence of RIBEYE does not alter SV size since electron tomography, which provides the most reliable estimation of SV size, did not reveal differences in SV diameter between RBEKO/KO and RBEWT/WT AZs, at least when considering all SVs. The RBEKO/KO PDs, like in RBEWT/WT, contained bassoon, CaV1.3, and RIM2, but lacked piccolino which is likely part of the ribbon in RBEWT/WT (Figure 1) (Dick et al., 2001; Khimich et al., 2005; Limbach et al., 2011; Regus-Leidig et al., 2013).
To some extent, the multi-AZ morphology is reminiscent of IHC synapses prior to synaptic maturation (Huang et al., 2012; Sendin et al., 2007; Sobkowicz et al., 1982; Wong et al., 2014). While we cannot rule out some sort of developmental delay of RIBEYE-deficient IHCs, we suspect that the morphological transformation into a multi-AZ morphology reflects a compensatory effort. Reasons for our interpretation include (i) the same morphological phenotype of RBEKO/KO IHCs at 8 months of age (Figure 2), (ii) the finding of highly regular PDs at RBEKO/KO IHCs synapses, which differs from less well-defined PDs at immature AZs (Wong et al., 2014), (iii) the typical continuous and large PSD of RBEKO/KO IHCs synapses (Figure 2, see also the accompanying paper by Becker et al.) as a characteristic of a mature synapse, rather than the several smaller PSD patches at developing IHC synapses (Wong et al., 2014), and (iv) the synaptically confined CaV1.3 Ca2+-channel clusters, normal amplitude of IHC ICa and mature amplitude of synaptic Ca2+-signals, rather than massive extrasynaptic CaV1.3 abundance and larger whole-cell ICa but smaller synaptic Ca2+-signals in immature IHCs (Wong et al., 2014; Zampini et al., 2010). The multi-AZ morphology of the RBEKO/KO IHC synapses was also corroborated by high- and super-resolution microscopy of bassoon and CaV1.3 immunofluorescence (Figure 4). The organization in several smaller Ca2+-channel clusters likely explains the broader spread of the presynaptic Ca2+-signal at RBEKO/KO synapses (Figure 6). In contrast to bassoon mutant mice (Frank et al., 2010; Jing et al., 2013), the number of synaptic Ca2+-channels was not reduced in RBEKO/KO mice as shown by normal amplitudes of whole-cell ICa and synaptic Ca2+-signals. Therefore, the loss of synaptic Ca2+-channels from the bassoon-deficient ribbonless IHC synapses, indicates a role of bassoon in promoting Ca2+-channel tethering at the AZ likely via interaction with RIM-binding protein (Davydova et al., 2014), which was previously shown to interact with CaV1.3 Ca2+-channels (Hibino et al., 2002) and is required for establishing a normal Ca2+-channel complement of the IHC AZ (Krinner et al., 2017).
Interestingly, we observed changes in Ca2+-channel function in RBEKO/KO IHCs: the voltage-dependence of Ca2+-channel activation was slightly, but significantly, shifted to more depolarized potentials both at the levels of whole-cell Ca2+-current (Vh +2 mV) and synaptic Ca2+-influx at individual synapses (Vh +5 mV) (at 5 mM [Ca2+]e, Figure 5 and 6). Similar as in this study, an enhanced inactivation (Figure 5) of ICa was also found in bassoon-deficient IHCs, while their Vh was actually mildly shifted in the opposite direction (−3 mV for imaging of synaptic Ca2+) and unaltered at the level of the whole-cell lCa (Frank et al., 2010). One potential reason for why the depolarized Vh-shift of the synaptic Ca2+-influx was greater than that of the whole-cell Ca2+-influx is the contribution of extrasynaptic Ca2+-channels to the whole-cell Ca2+-influx. They are thought to contribute approximately 30% of the Ca2+-influx (Brandt et al., 2005) and are not regulated by RIBEYE/ribbon. In order to test whether the depolarized Vh-shift of synaptic Ca2+ translates into changes in transmitter release, we recorded exocytic ΔCm for different depolarization potentials. A small, but significant reduction of exocytosis for weak depolarizations in RBEKO/KO IHCs (Figure 7, seen also in the accompanying paper by Becker et al.) suggests that the Vh shift is relevant for hair cell transmission (see also below). How enhanced ICa inactivation might affect sound encoding is addressed by work on Ca2+-binding proteins (CaBPs) that are thought to antagonize calmodulin’s role in mediating ICa inactivation (Lee et al., 1999; Peterson et al., 1999). Among the several CaBPs expressed in IHCs (Cui et al., 2007; Picher et al., 2017; Schrauwen et al., 2012; Yang et al., 2006), CaBP2 is defective in human genetic hearing loss DFNB93 (Picher et al., 2017; Schrauwen et al., 2012) and required for hearing likely via inhibition of IHC ICa inactivation (Picher et al., 2017). However, deletion of CaBP4 in mice caused only a very mild increase of ICa inactivation similar to the one found here and did not alter auditory brainstem responses (Cui et al., 2007). Future studies need to address how RIBEYE/ribbons mechanistically regulate the function and spatial organization of Ca2+-channels.
What can the RIBEYE knock-out tell us about the function of the ribbon in sensory coding?
Over some decades, research on retinal photoreceptors and bipolar cells, on hair cells of the inner ear and the lateral lines, on electroreceptors as well as pineal cells, has aimed to elucidate the function(s) of the synaptic ribbon. Current hypotheses state that the ribbon functions in (i) replenishing release sites ([Bunt, 1971; Frank et al., 2010; von Gersdorff et al., 1996; Lenzi et al., 2002; Maxeiner et al., 2016; Snellman et al., 2011; Vaithianathan and Matthews, 2014] for a deviating view see {Jackman et al., 2009]), potentially by facilitated diffusion of SVs on the ribbon surface towards the site of consumption (Graydon et al., 2014) and SV priming (Grabner and Zenisek, 2013; Snellman et al., 2011), (ii) establishing a large complement of vesicular release sites and Ca2+-channels at the active zone (Frank et al., 2010; Khimich et al., 2005), which remained hard to disentangle from potential function of bassoon (Frank et al., 2010; Jing et al., 2013), (iii) ensuring close spatial coupling of Ca2+-channels and vesicular release sites (Maxeiner et al., 2016) or enhancing presynaptic Ca2+-signals by limiting diffusional Ca2+-spread (Graydon et al., 2011), (iv) contributing to multivesicular release (Graydon et al., 2011; Jing et al., 2013; Mehta et al., 2013), and (v) contributing to SV reformation from endocytosed membranes (Jung et al., 2015b; Khimich et al., 2005; Schwarz et al., 2011). Clearly, SV-replenishment was impaired at the ribbon-less IHC synapses of RBEKO/KO mice. This is shown by slowed recovery from forward-masking and the use-dependent reduction of peak and adapted firing rates, which we further scrutinized by modeling. Therefore, our study supports a role of the ribbon in vesicle replenishment, which is also found in the accompanying paper by Becker et al.. Why RRP-recovery was not significantly altered when probed with pairs 20 ms long maximal Ca2+-influx by membrane capacitance measurements in IHCs (Figure 7) will need to be addressed in future studies, ideally using paired pre-and postsynaptic recordings of synaptic transmission with depolarizations of varying strength.
Each of the ribbon-manipulations employed to analyze its role has strengths, but also weaknesses, such as changes in other AZ proteins and long-term compensatory processes (e.g. bassoon deletion), complex manipulations (e.g. diurnal changes or hibernation: [Hull et al., 2006; Mehta et al., 2013; Spiwoks-Becker et al., 2004]) and photoablation (Mehta et al., 2013; Snellman et al., 2011). Genetic RIBEYE manipulations (Lv et al., 2016; Maxeiner et al., 2016; Sheets et al., 2011; Van Epps et al., 2004) have the greatest molecular specificity, but in some cases, were incomplete, and to some extent masked by compensation. In fact, our study of IHCs, unlike the situation for bipolar cell retinal ribbons (Maxeiner et al., 2016), suggests that some features of the IHC ribbon-type AZ can be very well replaced by a ribbonless multi-AZ morphology: the synaptic complement of Ca2+-channels and SVs, as well as exocytic ΔCm elicited by strong depolarizations, were similar. Therefore, we likely underestimated the role of the ribbon in sound encoding in our present study.
For sound encoding at the afferent synapses between IHCs and SGNs, we observed some commonalities and differences with the bassoon mutants and RBEKO/KO mice, whereby the stronger phenotype of bassoon mutants suggests additive effects of bassoon and ribbon loss. Recordings from single SGNs indicate reduced peak and adapted release rates at the IHC synapses of ribbonless synapses, as well as impaired temporal precision of coding. High temporal precision is a hallmark of synaptic sound encoding (e.g. (Köppl, 1997). Reduced release rates or smaller EPSC sizes would increase the temporal jitter (Buran et al., 2010; Li et al., 2014; Rutherford et al., 2012; Wittig and Parsons, 2008). Reduced spike rates and increased jitter of release likely explain the reduced ABR wave I amplitude in both mutants. A striking difference from bassoon mutants, however, is that sound encoding in RBEKO/KO mice was impaired substantially, despite unaltered exocytic ΔCm upon strong stimulation. We propose two mechanisms with likely additive effects to explain this surprising finding: i) the small depolarized shift of synaptic Ca2+-channels might contribute the lower spontaneous and evoked firing rates as well as higher sound thresholds of SGNs and ii) the reduced SV-replenishment might not suffice to balance the rate of consumption leading to a smaller standing RRP in vivo, while the arrest of exocytosis in the voltage-clamped IHCs for tens of seconds likely enables complete filling of the release sites (max. standing RRP). The changes in Ca2+-channel gating observed in IHCs of RBEKO/KO mice were unexpected, as so far, a direct or indirect interaction of RIBEYE and Ca2+-channels have not been described. Clearly, future studies, including studies on the potential regulation of CaV1.3 Ca2+-channels by RIBEYE and piccolino in heterologous expression systems, paired pre- and postsynaptic recordings, as well as further computational modeling, are required.
Materials and methods
Key resources table
| Reagent type (species) or resource | Designation | Source or reference | Identifiers | Additional information |
|---|---|---|---|---|
| Strain, strain background (Mus musculus) | Constitutive RIBEYE knockout, C57BL/6 background | PMID: 26929012 | ||
| Antibody | CtBP2 (mouse monoclonal) | BD Biosciences | 612044 | 1:200 |
| Antibody | PSD-95 (mouse monoclonal) | Sigma Aldrich | P246-100ul | 1:200 |
| Antibody | Bassoon SAP7f407 (mouse monoclonal) | Abcam | ab82958 | 1:200 |
| Antibody | Bassoon (guinea pig polyclonal) | Synaptic Systems | 141 004 | 1:500 |
| Antibody | RIM2 (rabbit polyclonal) | Synaptic Systems | 140 103 | 1:100 |
| Antibody | Cav1.3 (rabbit polyclonal) | Alomone Labs | ACC 005 | 1:75 or 1:100 |
| Antibody | Piccolino (rabbit polyclonal) | Regus-Leidig et al. (2013) | 1:500 | |
| Antibody | Parvalbumin α (guinea pig polyclonal) | Synaptic Systems | 195 004 | 1:1000 |
| Antibody | Calbindin 28 k (mouse monoclonal) | Swant | 07(F) | 1:500 |
| Antibody | Calretinin (rabbit polyclonal) | Swant | 1893–0114 | 1:1000 |
| Antibody | Alexa Fluor 488 conjugated anti-rabbit (goat polyclonal) | Invitrogen | A11008 | 1:200 |
| Antibody | Alexa Fluor 488 conjugated anti-guinea-pig (goat polyclonal) | Invitrogen | A11004 | 1:200 |
| Antibody | Alexa Fluor 568 conjugated anti-mouse (goat polyclonal) | Invitrogen | A11073 | 1:200 |
| Antibody | Alexa Fluor 647 conjugated anti-rabbit (donkey polyclonal) | Invitrogen | A31573 | 1:200 |
| Antibody | STAR580 conjugated anti-mouse (goat polyclonal) | Abberior | 2-0002-005-1 | 1:200 |
| Antibody | STAR580 conjugated anti-rabbit (goat polyclonal) | Abberior | 2-0012-005-8 | 1:200 |
| Antibody | STAR635p conjugated anti-mouse (goat polyclonal) | Abberior | 2-0002-007-5 | 1:200 |
| Antibody | STAR635p conjugated anti-rabbit (goat polyclonal) | Abberior | 2-0012-007-2 | 1:200 |
| Software, algorithm | Patchmaster or Pulse | http://www.heka.com/products/products_main.html#soft_pm | RRID:SCR_000034 | |
| Software, algorithm | IGOR Pro | http://www.wavemetrics.com/products/igorpro/igorpro.htm | RRID:SCR_000325 | |
| Software, algorithm | Patchers Power Tools | http://www3.mpibpc.mpg.de/groups/neher/index.php?page=software | RRID:SCR_001950 | |
| Software, algorithm | MATLAB | http://www.mathworks.com/products/matlab/ | RRID:SCR_001622 | |
| Software, algorithm | Gatan Microscopy Suite | http://www.gatan.com/products/tem-analysis/gatan-microscopy-suite-software | RRID:SCR_014492 | DigitalMicrograph scripting |
| Software, algorithm | Reconstruct | PMID: 15817063 | ||
| Software, algorithm | Serial-EM | PMID: 16182563 | ||
| Software, algorithm | 3dmod | PMID: 8742726 | ||
| Software, algorithm | IMOD | http://bio3d.colorado.edu/imod | RRID:SCR_003297 | |
| Software, algorithm | Genetic fit algorithm | Sanchez del Rio and Pareschi, 2001 | doi: 10.1117/12.411624 | |
| Software, algorithm | Fiji | http://fiji.sc | RRID:SCR_002285 | |
| Software, algorithm | ImageJ | https://imagej.nih.gov/ij/ | RRID:SCR_003070 | |
| Software, algorithm | Imaris | http://www.bitplane.com/imaris/imaris | RRID:SCR_007370 | |
| Software, algorithm | Excel | microsoft.com/mac/excel | ||
| Software, algorithm | Origin | http://www.originlab.com/index.aspx?go=PRODUCTS/Origin | RRID:SCR_014212 | |
| Software, algorithm | GraphPad Prism | https://www.graphpad.com/scientific-software/prism/ | RRID:SCR_015807 | |
| Software, algorithm | Java Statistical Classes library | Bertie, 2002 |
Animals
Constitutive RIBEYE knockout mice (RBEKO/KO derived from Ctbp2tm1.2Sud by Cre-recombination) were generated by Maxeiner and colleagues (Maxeiner et al., 2016) and were back-crossed to C57BL/6 for five generations (corresponding to a C57BL/6 background contribution of >95%). All experiments complied with national animal care guidelines and were approved by the University of Göttingen Board for Animal Welfare and the Animal Welfare Office of the State of Lower Saxony (permit number: 14–1391). The colony was maintained by mating heterozygous mice. Whenever possible, experiments were performed in parallel on mutant mice and their wildtype littermates. However, the experimental schedule did not always permit this and we occasionally used individual mice from the same colony but without littermate controls. Moreover, for some experiments giving rise to Figure 6—figure supplement 1 and Figure 7E,F,G,H we also used C57Bl/6 wild-type mice and combined their results with those of wildtype littermate controls.
Patch-clamp and confocal Ca2+-imaging
Request a detailed protocolThe apical 2/3 turns of organs of Corti from P14 to P28 aged mice were freshly dissected in HEPES Hank's solution containing (in mM): 5.36 KCl, 141.7 NaCl, 10 HEPES, 0.5 MgSO4-7H2O, 1 MgCl2-6H2O, 5.6 D-glucose, and 3.4 L-glutamine (pH 7.2, ~300 mOsm). The basolateral membranes of the IHCs were exposed by carefully removing the surrounding cells with a suction pipette. All experiments were conducted at room temperature (20–25°C).
Perforated-patch-clamp recordings were performed as described previously (Moser and Beutner, 2000). The pipette solution contained (in mM): 130 Cs-gluconate, 10 tetraethylammonium (TEA)-Cl, 10 4-AP, 10 HEPES, 1 MgCl2, as well as 300 μg/ml amphotericin B (pH 7.2, ~280 mOsm). The extracellular solution contained the following (in mM): 112 NaCl, 35 TEA-Cl, 2.8 KCl, 1 MgCl2, 1 CsCl, 10 HEPES, 2 CaCl2, and 11.1 D-glucose (pH 7.2, ~305 mOsm). External solution change was done by bath exchange through a perfusion system.
For live-imaging, the patch pipette solution contained (in mM): 111 Cs-glutamate, 1 MgCl2, 1 CaCl2, 10 EGTA, 13 TEA-Cl, 20 HEPES, 4 Mg-ATP, 0.3 Na-GTP and 1 L-Glutathione (pH 7.3, ~290 mOsm). To visualize the Ca2+-hotspots and the ribbons, the Ca2+-indicator Fluo-4FF penta-K+ salt (0.8 mM, Life Technologies, Germany) and the TAMRA-conjugated CtBP2/RIBEYE-binding dimer peptide (10 µM, Biosynthan, Germany) were added to the intracellular solution. The extracellular solution contained the following (in mM): 2.8 KCl, 102 NaCl, 10 HEPES, 1 CsCl2, 1 MgCl2, 5 CaCl2, 35 TEA-Cl, and 11.1 D-Glucose (pH 7.2, ~300 mOsm).
EPC-10 amplifiers controlled by Patchmaster or Pulse software (HEKA Elektronik, Germany) were used for the measurements. IHCs were held at −87 mV or −69 mV. All voltages were corrected for liquid junction potential offline (17 mV or 14 mV, depending on intra- and extracellular solutions used) and voltage-drops across the series resistance (Rs). Currents were leak corrected using a p/10 protocol in exocytosis experiments. Recordings were discarded when the leak current exceeded −55 pA, Rs exceeded 30 MΩ (for perforated-patch) or 15 MΩ within 4 min after break-in (for ruptured-patch), or Ca2+-current rundown exceeded 25%. All passive electrical properties of the patch-clamp recording experiments are detailed in Supplementary file 2.
Exocytosis was studied by measuring the membrane capacitance increments (ΔCm) using the Lindau-Neher technique (Lindau and Neher, 1988). Cells were stimulated by step depolarizations of different durations to −17 or −14 mV, or by 100 ms pulses to voltages ranging from −53 to −37 mV. A resting interval of 10–100 s between the stimuli was used. Each protocol was applied two to three times and only IHCs with reproducible exocytosis during the rounds were included. For display, traces were subjected to 1, 5 or 10 pass Binomial Smoothing using Igor Pro. Current-voltage relationships (‘IVs’) displayed in Figure 5A (ruptured-patch, 3-week-old mice) were obtained by applying 20 ms depolarizing step pulses of increasing voltage from −82 to 63 mV in 5 mV steps.
Ca2+-imaging was performed with a spinning disk confocal scanner (CSU22, Yokogawa, Germany) mounted on an upright microscope (Axio Examiner, Zeiss, Germany) with 63x, 1.0 NA objective (W Plan-Apochromat, Zeiss). Images were acquired by a scientific CMOS camera (Neo, Andor, Germany). Ca2+-indicator F4FF and TAMRA-conjugated peptide were excited by diode-pumped solid-state lasers with 491 nm and 561 nm wavelength, respectively (Cobolt AB). The spinning disk was set to 2000 rpm to synchronize with the 10 ms acquisition time of the camera.
Using a piezo positioner for the objective (Piezosystem, Germany), a scan of the entire cell was performed 4 min after breaking into the cell, taking sections each 0.5 µm at an exposure time of 0.5 s in the red (TAMRA-peptide) channel from the bottom to the top of the cell. In order to study the voltage-dependence of Ca2+-indicator fluorescence increments at the synapses, the confocal scans were acquired every 0.5 µm from the bottom to the top ribbon in the RBEWT/WT mice. For the RBEKO/KO mice, the scanning was done from the bottom of the cell to +12 µm, which on average corresponds to the bottom of the nucleus. Ca2+-currents were evoked by applying a voltage ramp stimulus from −87 to +63 mV during 150 ms (1 mV/ms) in each focal plane. Simultaneously, fluorescence measurements were made in the green channel (Fluo-4FF) with a frame rate of 100 Hz. In order to overcome the limitations of the frame rate and increase the voltage resolution of the fluorescent signal acquired, the voltage ramp protocol was applied twice, once shifted by 5 ms such that for any given frame during the second ramp the voltage was shifted by 5 mV compared to the first stimulus. Alternating planes were acquired to avoid photobleaching encountered with the consecutive plane acquisition.
Immunohistochemistry, confocal and high resolution STED imaging
Request a detailed protocolApical turns of organs of Corti from 3-week-old mice were prepared for ‘whole-mount imaging’ as described in (Ohn et al., 2016). In brief, the samples were fixed either in formaldehyde (4%, 10 min on ice), or methanol (20 min at −20°C). Afterwards, the following primary antibodies were used: mouse anti-CtBP2 (1:200, BD Biosciences, Germany 612044), mouse anti-PSD-95 (1:200, Sigma Aldrich, Germany P246-100ul), mouse anti-bassoon SAP7f407 (1:200, Abcam, Germany, ab82958), guinea pig anti-bassoon (1:500, Synaptic Systems, Germany, 141 004), rabbit anti-RIM2 (1:100, Synaptic Systems 140 103), rabbit anti-Cav1.3 (1:75 or 1:100, Alomone Labs, Germany, ACC 005), rabbit anti-piccolino (1:500, kind gift of JH Brandstätter; see Regus-Leidig et al., 2013), guinea pig anti-parvalbumin α (1:1000, Synaptic Systems, 195 004), mouse anti-calbindin 28 k (1:500, Swant, Germany, 07(F)), and rabbit anti-calretinin (1:1000, Swant 1893–0114). Secondary antibodies used were Alexa Fluor 488 conjugated anti-rabbit, Alexa Fluor 488 conjugated anti-guinea-pig, Alexa Fluor 568 conjugated anti-mouse, and Alexa Fluor 647 conjugated anti-rabbit (1:200, Invitrogen, Germany, A11008, A11004, A11073, and A31573 respectively). For high resolution STED microscopy, STAR580 and STAR635p conjugated anti-rabbit and anti-mouse (1:200, Abberior, Germany, 2-0002-005-1, 2-0012-005-8, 2-0002-007-5, and 2-0012-007-2) have been used as secondary antibodies. Images were acquired using either a Leica SP5 with a 1.4 NA 63x oil immersion objective or an Abberior Instruments Expert Line STED microscope, with excitation lasers at 488, 561, and 633 nm and STED lasers at 595 nm, 1 W, and 775 nm, 1.2 W, using a 1.4 NA 100x oil immersion objective, either in confocal or in 2D-STED mode. Images were adjusted for brightness and contrast using ImageJ.
Systems physiology: Auditory Brainstem Responses (ABR), Distortion Product Otoacoustic Emissions (DPOAE) and extracellular recordings from SGNs
Request a detailed protocolABR, DPOAE and extracellular recordings from single SGNs were performed essentially as described before (Jing et al., 2013; Strenzke et al., 2016). ABR and DPOAE recordings were performed on 6-week-old mice. For extracellular recordings from individual SGNs, 6 to 10 week-old mice were anesthetized by i.p. injection of urethane (1.32 mg/kg), xylazine (5 mg/kg) and buprenorphine (0.1 mg/kg), a tracheostomy was performed and the mice were then placed in a stereotactic system. After partial removal of the occipital bone and cerebellum to expose the anteroventral cochlear nucleus (AVCN), a glass microelectrode was advanced through the posterior AVCN portion to reach the auditory nerve. Acoustic stimulation was provided by an open field Avisoft ScanSpeak Ultrasonic Speaker (Avisoft Bioacoustics, Germany), and ‘putative’ SGNs (auditory nerve fibers formed by the central SGN axons) were identified and distinguished from cochlear nucleus neurons based on their stereotactic position (>1.1 mm from the surface of the cochlear nucleus), spontaneous and noise-burst induced firing, peristimulus time histogram (PSTH), regularity of firing, and first spike latency. Recordings were performed using TDT system III hardware and an ELC-03XS amplifier (NPI Electronics, Germany), offline analysis using waveform-based spike detection using custom-written MATLAB software (Source code 1).
Transmission electron microscopy
Conventional embedding
Request a detailed protocolConventional embedding of organs of Corti was essentially performed as described previously (Wong et al., 2014). In brief, here P21, 6 weeks and 8 months old mice were used. The apical turn of organs of Corti were dissected in phosphate-buffer saline (PBS) and fixed for 1 hr on ice with 4% paraformaldehyde and 0.5% glutaraldehyde in PBS (pH 7.4). After an additional fixation overnight on ice with 2% glutaraldehyde in 0.1 M sodium cacodylate buffer (pH 7.2), samples were washed in 0.1 M sodium cacodylate buffer and placed in 1% osmium tetroxide (v/v in 0.1 M sodium cacodylate buffer) on ice for 1 hr. Next, samples were washed twice in 0.1 M sodium cacodylate buffer (10 min each, on ice) and further in distilled water and subsequently en bloc stained with 1% uranyl acetate (v/v in distilled water) for 1 hr on ice. Uranyl acetate treated samples were briefly washed three times in distilled water, dehydrated using a series of increasing ethanol concentration and finally embedded in epoxy resin (Agar 100 kit, Plano, Germany) and polymerized for 48 hr at 70°C. An Ultracut E microtome (Leica Microsystems, Germany) equipped with a 35° diamond knife (Diatome, Switzerland) was used to obtain ultrathin sections (70–75 nm) of the specimen. Sections were transferred to 1% formvar-coated (w/v in water-free chloroform) copper slot grids (ATHENE copper slot grids, 3.05 mm Ø, 1 mm x 2 mm; Plano, Germany) and subsequently stained with uranyl acetate replacement solution (UAR-EMS) (Science Services, Germany) and Reynold’s lead citrate. The specimens were investigated at 80 kV with a JEM1011 transmission electron microscope (JEOL, Germany) and micrographs acquired at 10,000-x magnification using a Gatan Orius 1200A camera (Gatan, Germany, using the Digital Micrograph software package). Serial 3D reconstructions of ultrathin sections were generated with the program Reconstruct (Fiala, 2005).
High-pressure freezing/freeze-substitution (HPF/FS) and electron tomography
Request a detailed protocolHigh-pressure freezing, freeze-substitution followed by electron tomography were essentially performed as described previously (Vogl et al., 2015; Jung et al., 2015a). After freeze-substitution and embedding in epoxy resin (Agar 100 kit, Plano, Germany), 250 nm semithin sections for electron tomography were obtained on an Ultracut E ultramicrotome (Leica Microsystems, Germany) with a 35° diamond knife (Diatome, Switzerland). Sections were placed on 1% formvar-coated (w/v in water-free chloroform) copper 100 mesh grids (ATHENE, Plano, Germany, 3.05 mm Ø) and post-stained with UAR-EMS (Science Services, Germany) and Reynold’s lead citrate.
For electron tomography, 10 nm gold particles (British Bio Cell/Plano, Germany) were applied to both sides of the stained grids. Single tilt series at 12,000-x magnification, mainly from −60 to +60° (if only fewer angles were possible, the tomograms were only accepted for quantification if the quality was sufficient) were acquired with an 1° increment at a JEM2100 (JEOL, Germany)) transmission electron microscope at 200 kV using the Serial-EM software (Mastronarde, 2005). The tomograms were generated using the IMOD package etomo and models were generated using 3dmod (Kremer et al., 1996).
Data analysis
Request a detailed protocolLive-imaging and IHC-patch-clamp data were analyzed using custom programs in Igor Pro 6.3 (Wavemetrics, Portland, OR, USA; Source Code 2). For analysis of IV-curves, the evoked Ca2+-current was averaged from 5 to 10 ms after the start of the depolarization. The total Ca2+-charge was estimated by taking the integral of the leak-subtracted current during the depolarization step. For most protocols, ΔCm was estimated as the difference between the mean of Cm 400 ms after and before the depolarization (the initial 60 ms after the end of depolarization were skipped). For paired pulse experiments, the calculation of the mean of Cm before and after the depolarization was limited to the time remaining in the inter pulse interval after skipping (the initial 30 ms after the end of depolarization were skipped).
ΔF images were generated by subtracting the fluorescence intensity inside the cell at the resting state (F0, an average of 10 frames) from the one at the depolarized state (an average of 6 frames during voltage ramp protocol). ΔF was calculated as the average of a 3 × 3 pixel square placed in the region showing the greatest intensity increase within the fluorescence hotspot. Maximal ΔF (ΔFmax) was the average of 5 ΔF values obtained between −17 and +8 mV during the voltage ramp (around the peak Ca2+-influx). Only AZs presenting a ΔFmax greater than the mean of the fluorescence intensity plus two standard deviations at rest were considered for further analysis. For analysis of the voltage dependence of synaptic Ca2+-signals, raw traces were fitted to the following
(1)
where is the fluorescence-voltage-relationship ΔF/ΔV obtained by linear fitting to the FV-curve in the range of 3 to 23 mV, the reversal potential of 65.6 mV, and the command voltage, in order to obtain , the voltage of half-maximal activation, and , the slope factor. The spatial extent of the synaptic Ca2+-signals was estimated by fitting of a 2D Gaussian function to the fluorescent hotspot using a genetic fit algorithm (Sanchez del Rio and Pareschi, 2001) to obtain the full width at half maximum in the long and short axis. For each spot, the calculations were made at those confocal sections where the intensity of the spot was strongest.
Activation time constants of Ca2+-currents at differing potentials were obtained by fitting to the first 5 ms of the current traces the following equation:
(2)
Confocal and STED immunofluorescence images were analyzed and z-projected with Fiji software and further analyzed using Igor Pro. For synapse counting, co-localized pre- and postsynaptic immunofluorescent spots were counted manually. The spatial extent of the line-shaped Ca2+-channel clusters was estimated by fitting a 2D Gaussian function to the individual clusters in 2D STED images to obtain the full width at half maximum in the long and short axis. The areas of the PSD were calculated by the following formula: area = π x (Long Axis/2) (Short Axis/2). The semi-quantitative immunofluorescence analysis of the proteinaceous Ca2+-buffers was performed by calculating the mean immunofluorescence intensity of a volume (40 (X) x 40 (Y) x 4 (Z) voxels or 2.8 × 2.8 × 2 µm) below the nucleus and above the synapses. This and the count and intensity of the CtBP2 immunofluorescent spots have been analyzed in Imaris 7.6.5 with custom Matlab routines (Source Code 4).
For extracellular SGN recordings, PSTHs were calculated as average firing rates across 200 presentations of 50 ms or 500 ms tone bursts presented at 0.1 s/0.2 s or 2 s intervals, resp. (PSTH at 10/5 Hz and 0.5 Hz) at Cf, 30 dB above the threshold and binned at a width of 2 ms. Peak rate was determined as the largest bin of the PSTH in a time window 3–11 ms after stimulus onset. Adapted rate was averaged in a window spanning 35–45 ms or 405–415 ms after stimulus onset (for PSTH at 5 Hz and 0.5 Hz, respectively). Rate level functions were acquired using 50 ms tone bursts presented at Cf and at 5 Hz. 25 repetitions for each stimulus intensity (5 dB steps) were recorded. Maximal steepness was calculated as the maximal increase in spike rate between two consecutive 5 dB increment steps. Dynamic range was calculated by using sigmoidal fits in the rate level functions as described in and measuring the range of sound pressure between 10% and 90% of maximal firing rate. For amplitude modulation analysis, synchronization index was calculated as described by (Goldberg and Brown, 1969). Synchronization index estimation was only considered valid when at least 15 spikes occurred in a 3 s time window and the Rayleigh statistic was below 13.8.
For analysis of forward masking experiments, spike counts in a 10 ms interval starting from responses of both masker and probe onset were determined and presented as the ratio of probe and masker responses for at least 25 repetitions for every masker-probe interval from each unit. Exponential fitting to the plots of each individual SGN approximated the recovery kinetics.
Quantitative analysis of electron microscopy data was performed with ImageJ for conventional embedded samples and with IMOD for HPF/FS tomograms. According to the presence of ribbon-occupied and ribbonless synapses, we considered the following analysis criteria:
For ribbon-occupied synapses, membrane-proximal synaptic vesicles (MP-SVs, within a distance of ≤25 nm from the AZ membrane and ≤80 nm from the presynaptic density) and ribbon-associated synaptic vesicles (RA-SVs, first layer around the ribbon with a maximum distance of 80 nm from the vesicle membrane to the ribbon) were counted (Figure 2J, random sections analysis according to Strenzke et al., 2016 and Figure 3G for tomograms according to 2D-random section analysis criteria). The tomogram analysis parameters were further modified, as used in Jung et al., 2015a. Here, the MP-SVs were defined as vesicles with ≤50 nm from the AZ membrane and with the shortest distance from the vesicle membrane to the presynaptic density of ≤100 nm, excluding RA-SVs (Figure 3—figure supplement 1A). For random sections, SV diameters were calculated by the averaged measurements of the horizontal and vertical axis. The ribbon size was measured in height and width, taking the longest axis of the ribbon excluding the PD, and the edges of the synaptic ribbon were traced manually using ImageJ. The length of the PD was measured along the AZ membrane (Figure 2J).
For ribbonless synapses, a presynaptic density-associated synaptic vesicle (PDA-SVs) pool was defined considering all clustered vesicles ≤80 nm around the PD that did not fulfill the criteria of a MP-SV (see above, also Figure 2J for random sections). The MP-SV pool, as well as the SV diameter and PD length, were analyzed as for the ribbon-occupied synapses. For tomograms, the PDA-SV pool was defined as the SVs in the first layer ≤ 80 nm to the PD, excluding the MP-SVs. The MP-SV pool criteria are the same as described in the previous paragraph (Figure 3G, according to 2D-random section and Figure 3—figure supplement 1A, according to Jung et al., 2015a). For tomograms, the according pools were further distinguished into tethered and non-tethered vesicles (Figure 3G and Figure 3—figure supplement 1A). All vesicles were annotated using a spherical ‘scattered object’ at its maximum projection in the tomogram, encompassing the outer leaflet of the vesicles. The vesicle radii were determined automatically (Helmprobst et al., 2015) with the program ‘imodinfo option -p’ of the IMOD software package (Kremer et al., 1996).
Release site model of RRP release and replenishment
Request a detailed protocolThe coding of sound onset differs among the various SGNs in time due to different durations of the traveling wave, synaptic delays and conduction times. To obtain an average PSTH for modeling that is not smeared out due to such differences between units, the individual PSTHs were aligned beforehand by shifting their timing relative to each other. Onset detection was based on a change in spike statistics. For spontaneous activity, the 99.5 percentile of spike counts was determined. Next, the time at which response rises to twice this percentile was found. This is certainly a point within the sound response. Finally going back from this point, a drop back baseline activity, that is below the percentile was detected and used as onset time. Aligned PSTH from all units were averaged. This averaged PSTH from the forward masking data were fit with a model waveform using a genetic fit algorithm implemented in IGOR Pro (Wavemetrics, Lake Oswego, OR, USA). The purpose of the model is to give insight into the dynamics of SV cycling at the average IHC AZ. More specifically, the notion of Ca2+-nanodomain-like control of RRP exocytosis (Brandt et al., 2005; Graydon et al., 2011; Pangršič et al., 2015; Wong et al., 2014), as well as the limited MP-SVs at the AZ (see Figures 2 and 3) motivates the notion of a limited, quasi-fixed number of available vesicular release sites or slots, Nslot,(Frank et al., 2010; Wong et al., 2014) that constitute the RRP. Each of these sites can be either empty or occupied by a release ready SV (whereby all filled slots constitute the ‘standing’ RRP) and at each time point, a release ready SV will fuse with a certain probability described by the fusion rate constant kfus. Its value depends on the sound pressure level in a relation we assume to be linear within the dynamic range of the synapse/fiber. While the sound pressure level rises from silence to saturation kfus increases from kfus, spont to kfus,stim. The refilling of empty sites is described by a refill rate constant krefill, which also depends on the sound intensity (krefill, spont to krefill,stim).
The state of the release site was described by:
(3)
Although this equation is formulated for SV fusion rates, a scaling factor f can be used to account for the fraction of fusion events that cannot successfully trigger an action potential (AP) despite sufficient neural excitability for example because of the too small size of the elicited excitatory post synaptic current. This factor effectively operates as if the number of release sites was scaled down. The scaled equation then gives a rate R of potentially supra-threshold EPSCs as the product of the number of occupied release sites, the fusion rate constant and the scaling factor f:
(4)
The stationary solutions of Equation 3 together with Equation 4 determine steady state occupancy and steady state event rates:
(5)
(6)
In this equation, ‘condition’ is either silence or saturating sound pressure level.
In order to connect the postsynaptic event rate of potentially supra-threshold EPSCs to the actual AP rate, refractoriness is considered as a combination of an absolute refractory period tabs, during which the probability of an EPSC to trigger an AP is zero, with a relative refractory period during which this trigger probability returns to one with an exponential time course characterized by τrel (Berry and Meister, 1998). This description of refractoriness can be applied to the ‘driving’ EPSC rate R by means of a delayed differential equation. The equation is motivated by the concept of three possible states of the SGN: ‘absolute refractory’, ‘relative refractory’ or ‘available’ (fully excitable). At any point, the probability that the SGN turns from ‘available’ to ‘refractory’ is proportional to the rate R(t). The return back to ‘available’ happens ‘delayed’ by tabs and with a probability that is proportional to 1/τrel.
(7)
Together with Equation 6 the stationary solution of this description of refractoriness connects the observable steady state rates during silence and stimulation to the rate constants krefill und kfusion:
(8)
To go beyond the description of steady state event rates and to use the model for a parameterized description of the actual time course of experimentally observed PSTHs acquired during forward masking (Figure 11E), it is necessary to define the relation between the applied stimulus and the fusion and refill rate constants. For the experimental data presented here, the stimulus level was increased from silence to 30 dB above fiber threshold within a 4 ms ramp having a quarter of a sin² shape. It was assumed that kfusion and krefill follow the stimulus increase simultaneously. The ordinary differential and delayed differential equations above were combined into a fit function. PSTHs (one masker followed by one probe) were averaged per genotype for each masker probe interval (4, 16, 64 and 256 ms) and were fitted in parallel with one parameter set. During experiments, trials were acquired in immediate succession without gaps. Therefore, the model implements cyclic boundary conditions for the occupancy of the slots. This model only captures the short term processes, assuming that a set of experiments, for example forward masking trials quickly lead to a steady state. Slow adapting processes were not explicitly modeled. The observed drop of the apparent number of available slots in the forward masking experiments was described here as a change in the number of slots from Nslots to a reduced capacity N’slots and for a given spiral ganglion neuron that was tested with tone bursts and forward masking, the ratio Nslots/N’slots could be estimated from the change in rates (see Results).
Statistical analysis
Request a detailed protocolThe data were analyzed using Matlab (Mathworks), Excel, Igor Pro 6 (Wavemetrics), Origin 9.0 (Microcal Software), and GraphPad Prism (GraphPad Software). Averages were expressed as mean ± standard error of the mean (S.E.M.). For every dataset, the standard deviation (S.D.), number of replicates (n) and animals (N) were indicated. For Figure 7, nmin corresponds to the minimum number of cells included in the analysis of each depolarization potential given that the number of cells for each potential differs. In order to compare two samples, data sets were tested for normal distribution (Jarque-Bera test, D’Agostino and Pearson omnibus normality test or the Shapiro-Wilk test) and equality of variances (F-test), followed by two-tailed unpaired Student’s t-test, or, when data were not normally distributed and/or variance was unequal between samples, the unpaired two-tailed Mann-Whitney-Wilcoxon test was used. Cumulative distributions in Figure 9A were statistically compared using the Kolmogorov-Smirnov test. The ROUT method (Q = 0.1%) from GraphPad Prism was used to identify definitive outliers for Figure 7H.
For multiple comparisons, statistical significance was calculated by using one-way ANOVA test (two-way ANOVA in the case of ABR thresholds) followed by Tukey’s test for normally distributed data or Kruskal-Wallis (K-W) test followed by non-parametric multiple comparisons test (NPMC) for non-normally distributed data.
For SV diameter quantifications in random sections, a custom-written routine using Java Statistical Classes library (JSC) (Bertie, 2002) was utilized for statistical analysis (Source code 5). Due to the tied ranks of SV diameter measurements obtained for random sections, their S.E.M. was used as a tolerance value for the usage of Kruskal-Wallis test as suggested by Bertie et al. in JSC library (Bertie, 2002), where two values were treated as equal if their difference was ≤ S.E.M.. The non-significant difference between samples is reported as n.s., significant differences are reported as *p<0.05, **p<0.01, ***p<0.001, ****p<0.0001.
References
-
Java applications for teaching statisticsMSOR Connections 2:78–81.https://doi.org/10.11120/msor.2002.02030078
-
Few CaV1.3 channels regulate the exocytosis of a synaptic vesicle at the hair cell ribbon synapseJournal of Neuroscience 25:11577–11585.https://doi.org/10.1523/JNEUROSCI.3411-05.2005
-
CaV1.3 channels are essential for development and presynaptic activity of cochlear inner hair cellsJournal of Neuroscience 23:10832–10840.
-
Onset coding is degraded in auditory nerve fibers from mutant mice lacking synaptic ribbonsJournal of Neuroscience 30:7587–7597.https://doi.org/10.1523/JNEUROSCI.0389-10.2010
-
Ca2+-binding proteins tune Ca2+-feedback to Cav1.3 channels in mouse auditory hair cellsThe Journal of physiology 585:791–803.https://doi.org/10.1113/jphysiol.2007.142307
-
Localization of the presynaptic cytomatrix protein piccolo at ribbon and conventional synapses in the rat retina: comparison with BassoonJournal of Comparative Neurology 439:224–234.https://doi.org/10.1002/cne.1344
-
Null mutation of alpha1D Ca2+ channel gene results in deafness but no vestibular defect in miceJournal of the Association for Research in Otolaryngology : JARO 5:215–226.https://doi.org/10.1007/s10162-003-4020-3
-
Cryo-electron tomography reveals a critical role of RIM1α in synaptic vesicle tetheringThe Journal of Cell Biology 201:725–740.https://doi.org/10.1083/jcb.201206063
-
Reconstruct: a free editor for serial section microscopyJournal of Microscopy 218:52–61.https://doi.org/10.1111/j.1365-2818.2005.01466.x
-
Passive diffusion as a mechanism underlying ribbon synapse vesicle release and resupplyJournal of Neuroscience 34:8948–8962.https://doi.org/10.1523/JNEUROSCI.1022-14.2014
-
Forward masking of auditory nerve fiber responsesJournal of Neurophysiology 42:1083–1107.https://doi.org/10.1152/jn.1979.42.4.1083
-
Presynaptic architecture of the larval zebrafish neuromuscular junctionJournal of Comparative Neurology 523:1984–1997.https://doi.org/10.1002/cne.23775
-
Overlapping and unique roles for C-terminal binding protein 1 (CtBP1) and CtBP2 during mouse developmentMolecular and Cellular Biology 22:5296–5307.https://doi.org/10.1128/MCB.22.15.5296-5307.2002
-
Diurnal changes in exocytosis and the number of synaptic ribbons at active zones of an ON-type bipolar cell terminalJournal of Neurophysiology 96:2025–2033.https://doi.org/10.1152/jn.00364.2006
-
Role of the synaptic ribbon in transmitting the cone light responseNature Neuroscience 12:303–310.https://doi.org/10.1038/nn.2267
-
Nanodomain control of exocytosis is responsible for the signaling capability of a retinal ribbon synapseJournal of Neuroscience 30:11885–11895.https://doi.org/10.1523/JNEUROSCI.1415-10.2010
-
Computer visualization of three-dimensional image data using IMODJournal of Structural Biology 116:71–76.https://doi.org/10.1006/jsbi.1996.0013
-
Phase locking to high frequencies in the auditory nerve and cochlear nucleus magnocellularis of the barn owl, Tyto albaJournal of Neuroscience 17:3312.
-
Ribbon synapses and visual processing in the retinaAnnual Review of Vision Science 1:235–262.https://doi.org/10.1146/annurev-vision-082114-035709
-
Auditory-nerve response from cats raised in a low-noise chamberThe Journal of the Acoustical Society of America 63:442–455.https://doi.org/10.1121/1.381736
-
Patch-clamp techniques for time-resolved capacitance measurements in single cellsPflugers Archiv European Journal of Physiology 411:137–146.https://doi.org/10.1007/BF00582306
-
Automated electron microscope tomography using robust prediction of specimen movementsJournal of Structural Biology 152:36–51.https://doi.org/10.1016/j.jsb.2005.07.007
-
Ribbon synapses compute temporal contrast and encode luminance in retinal rod bipolar cellsNature Neuroscience 14:1555–1561.https://doi.org/10.1038/nn.2945
-
Otoferlin: a multi-C2 domain protein essential for hearingTrends in Neurosciences 35:671–680.https://doi.org/10.1016/j.tins.2012.08.002
-
Role of L-type Ca2+ channels in transmitter release from mammalian inner hair cells. II. Single-neuron activityJournal of Neurophysiology 87:2734–2740.https://doi.org/10.1152/jn.2002.87.6.2734
-
Spike encoding of neurotransmitter release timing by spiral ganglion neurons of the cochleaJournal of Neuroscience 32:4773–4789.https://doi.org/10.1523/JNEUROSCI.4511-11.2012
-
BookThe Ribbon Synapse Between Type I Spiral Ganglion Neurons and Inner Hair CellsIn: Dabdoub A, Fritzsch B, Popper A. N, Fay R. R, editors. The Primary Auditory Neurons of the Mammalian Cochlea. New York: Springer. pp. 117–156.https://doi.org/10.1007/978-1-4939-3031-9_5
-
The auditory hair cell ribbon synapse: from assembly to functionAnnual Review of Neuroscience 35:509–528.https://doi.org/10.1146/annurev-neuro-061010-113705
-
ConferenceGlobal optimization and reflectivity data fitting for x-ray multilayer mirrors by means of genetic algorithmsAdvances in X-Ray Optics. pp. 88–96.https://doi.org/10.1117/12.411624
-
A mutation in CABP2, expressed in cochlear hair cells, causes autosomal-recessive hearing impairmentThe American Journal of Human Genetics 91:636–645.https://doi.org/10.1016/j.ajhg.2012.08.018
-
The synaptic ribbon is a site of phosphatidic acid generation in ribbon synapsesJournal of Neuroscience 31:15996–16011.https://doi.org/10.1523/JNEUROSCI.2965-11.2011
-
Maturation of ribbon synapses in hair cells is driven by thyroid hormoneJournal of Neuroscience 27:3163–3173.https://doi.org/10.1523/JNEUROSCI.3974-06.2007
-
Three-dimensional architecture of presynaptic terminal cytomatrixJournal of Neuroscience 27:6868–6877.https://doi.org/10.1523/JNEUROSCI.1773-07.2007
-
Ultrastructure of retinal rod synapses of the guinea pig eye as revealed by three-dimensional reconstructions from serial sectionsJournal of Ultrastructure Research 2:122–170.https://doi.org/10.1016/S0022-5320(58)90050-9
-
Structure of the nerve endings on the external hair cells of the guinea pig cochlea as studied by serial sectionsJournal of Ultrastructure Research 5:523–556.https://doi.org/10.1016/S0022-5320(61)80025-7
-
Acute destruction of the synaptic ribbon reveals a role for the ribbon in vesicle primingNature Neuroscience 14:1135–1141.https://doi.org/10.1038/nn.2870
-
Ribbon synapses in the developing intact and cultured organ of Corti in the mouseJournal of Neuroscience 2:942–957.
-
Mouse photoreceptor synaptic ribbons lose and regain material in response to illumination changesEuropean Journal of Neuroscience 19:1559–1571.https://doi.org/10.1111/j.1460-9568.2004.03198.x
-
Complexin-I is required for high-fidelity transmission at the endbulb of Held auditory synapseJournal of Neuroscience 29:7991–8004.https://doi.org/10.1523/JNEUROSCI.0632-09.2009
-
Response properties of single auditory nerve fibers in the mouseJournal of Neurophysiology 93:557–569.https://doi.org/10.1152/jn.00574.2004
-
Unconventional molecular regulation of synaptic vesicle replenishment in cochlear inner hair cellsJournal of Cell Science 128:638–644.https://doi.org/10.1242/jcs.162099
-
Relating structure and function of inner hair cell ribbon synapsesCell and Tissue Research 361:95–114.https://doi.org/10.1007/s00441-014-2102-7
-
Elementary properties of CaV1.3 Ca(2+) channels expressed in mouse cochlear inner hair cellsThe Journal of Physiology 588:187–199.https://doi.org/10.1113/jphysiol.2009.181917
-
Visualizing synaptic ribbons in the living cellJournal of Neuroscience 24:9752–9759.https://doi.org/10.1523/JNEUROSCI.2886-04.2004
Article and author information
Author details
David Lopez de la Morena

Lina María Jaime Tobón
Maria Magdalena Picher
Funding
Deutsche Forschungsgemeinschaft (Collaborative Research Center 889, projects A2, A6, and A7)
- Carolin Wichmann
- Nicola Strenzke
- Tobias Moser
Deutsche Forschungsgemeinschaft (Tobias Moser Leibniz program MO 896/51)
- Tobias Moser
Max-Planck-Gesellschaft (Max-Planck-Fellowship)
- Tobias Moser
Niedersächsisches Vorab
- Tobias Moser
The funders had no role in study design, data collection and interpretation, or the decision to submit the work for publication.
Acknowledgements
We thank N Dietrich, T Goldak, S Gerke, C Senger-Freitag and I Herfort for expert technical assistance, Gerhard Hoch for software and analysis development, and Frank Schmitz for providing RBEKO/WT mice.
Ethics
Animal experimentation: All experiments complied with national animal care guidelines and were approved by the University of Göttingen Board for Animal Welfare and the Animal Welfare Office of the State of Lower Saxony (permit number: 14-1391).
Version history
- Received: July 7, 2017
- Accepted: December 19, 2017
- Accepted Manuscript published: January 12, 2018 (version 1)
- Version of Record published: February 1, 2018 (version 2)
Copyright
© 2018, Jean et al.
This article is distributed under the terms of the Creative Commons Attribution License, which permits unrestricted use and redistribution provided that the original author and source are credited.
Metrics
-
- 4,681
- Page views
-
- 610
- Downloads
-
- 62
- Citations
Article citation count generated by polling the highest count across the following sources: Crossref, Scopus, PubMed Central.
Download links
A two-part list of links to download the article, or parts of the article, in various formats.
Downloads (link to download the article as PDF)
Open citations (links to open the citations from this article in various online reference manager services)
Cite this article (links to download the citations from this article in formats compatible with various reference manager tools)
The synaptic ribbon is critical for sound encoding at high rates and with temporal precision
eLife 7:e29275.
https://doi.org/10.7554/eLife.29275
Further reading
-
- Cell Biology
- Chromosomes and Gene Expression
Heat stress is a major threat to global crop production, and understanding its impact on plant fertility is crucial for developing climate-resilient crops. Despite the known negative effects of heat stress on plant reproduction, the underlying molecular mechanisms remain poorly understood. Here, we investigated the impact of elevated temperature on centromere structure and chromosome segregation during meiosis in Arabidopsis thaliana. Consistent with previous studies, heat stress leads to a decline in fertility and micronuclei formation in pollen mother cells. Our results reveal that elevated temperature causes a decrease in the amount of centromeric histone and the kinetochore protein BMF1 at meiotic centromeres with increasing temperature. Furthermore, we show that heat stress increases the duration of meiotic divisions and prolongs the activity of the spindle assembly checkpoint during meiosis I, indicating an impaired efficiency of the kinetochore attachments to spindle microtubules. Our analysis of mutants with reduced levels of centromeric histone suggests that weakened centromeres sensitize plants to elevated temperature, resulting in meiotic defects and reduced fertility even at moderate temperatures. These results indicate that the structure and functionality of meiotic centromeres in Arabidopsis are highly sensitive to heat stress, and suggest that centromeres and kinetochores may represent a critical bottleneck in plant adaptation to increasing temperatures.
-
- Cell Biology
High-altitude polycythemia (HAPC) affects individuals living at high altitudes, characterized by increased red blood cells (RBCs) production in response to hypoxic conditions. The exact mechanisms behind HAPC are not fully understood. We utilized a mouse model exposed to hypobaric hypoxia (HH), replicating the environmental conditions experienced at 6000 m above sea level, coupled with in vitro analysis of primary splenic macrophages under 1% O2 to investigate these mechanisms. Our findings indicate that HH significantly boosts erythropoiesis, leading to erythrocytosis and splenic changes, including initial contraction to splenomegaly over 14 days. A notable decrease in red pulp macrophages (RPMs) in the spleen, essential for RBCs processing, was observed, correlating with increased iron release and signs of ferroptosis. Prolonged exposure to hypoxia further exacerbated these effects, mirrored in human peripheral blood mononuclear cells. Single-cell sequencing showed a marked reduction in macrophage populations, affecting the spleen’s ability to clear RBCs and contributing to splenomegaly. Our findings suggest splenic ferroptosis contributes to decreased RPMs, affecting erythrophagocytosis and potentially fostering continuous RBCs production in HAPC. These insights could guide the development of targeted therapies for HAPC, emphasizing the importance of splenic macrophages in disease pathology.


