The Glucocorticoid Receptor NR3C1 in Testicular Peritubular Cells is Developmentally Regulated and Linked to the Smooth Muscle-Like Cellular Phenotype

 and
and 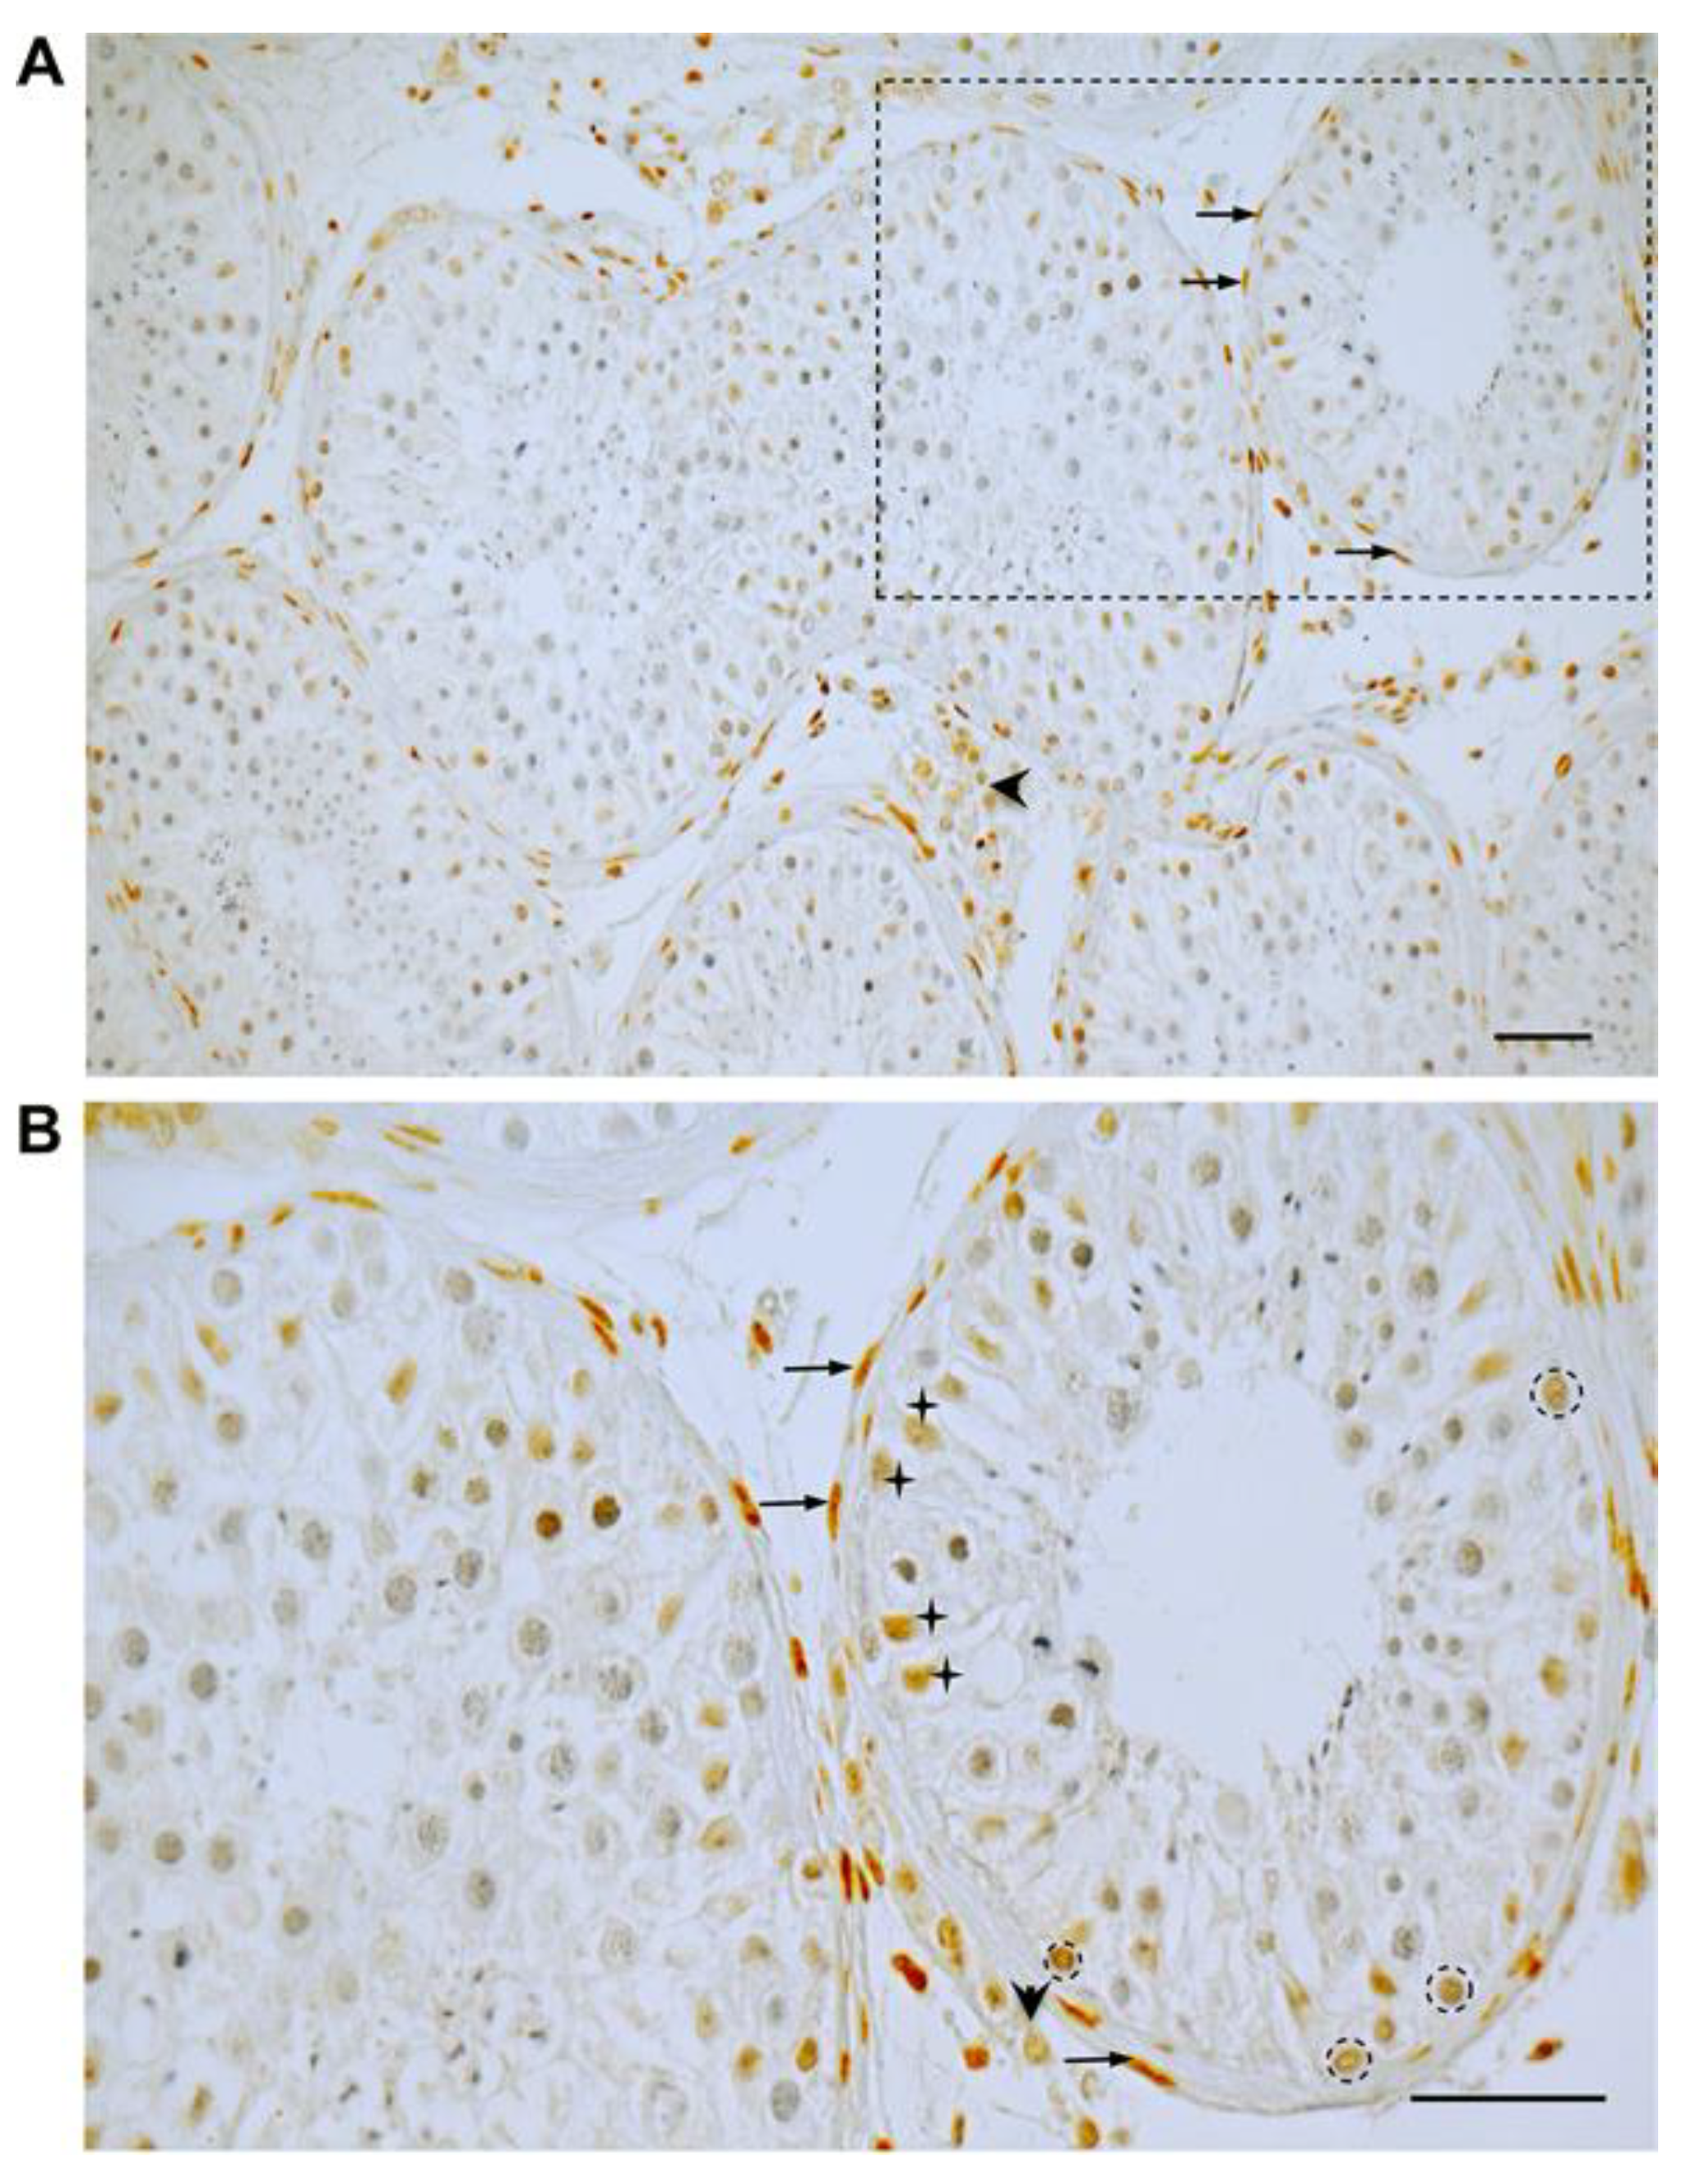
Abstract
:1. Introduction
2. Experimental Section
2.1. Human and Monkey Samples
2.2. Cell Culture
2.3. Determination of Cell Number, Cell Size and Viability
2.4. Isolation of RNA and Protein
2.5. Reverse Transcription (RT-PCR) and Quantitative Real Time PCR (qPCR)
2.6. Western Blotting
2.7. Immunohistochemistry (IHC) and Immunocytochemistry (ICC)
2.8. Immunofluorescence Labeling of Filamentous Actin by Phalloidin
2.9. Cell Contractility Assay
2.10. Electric Cell Impedance Sensing (ECIS) Measurements
2.11. Statistical Analysis
3. Results
3.1. GR Expression in Human Testicular Biopsies of Adult Men with Normal Spermatogenesis
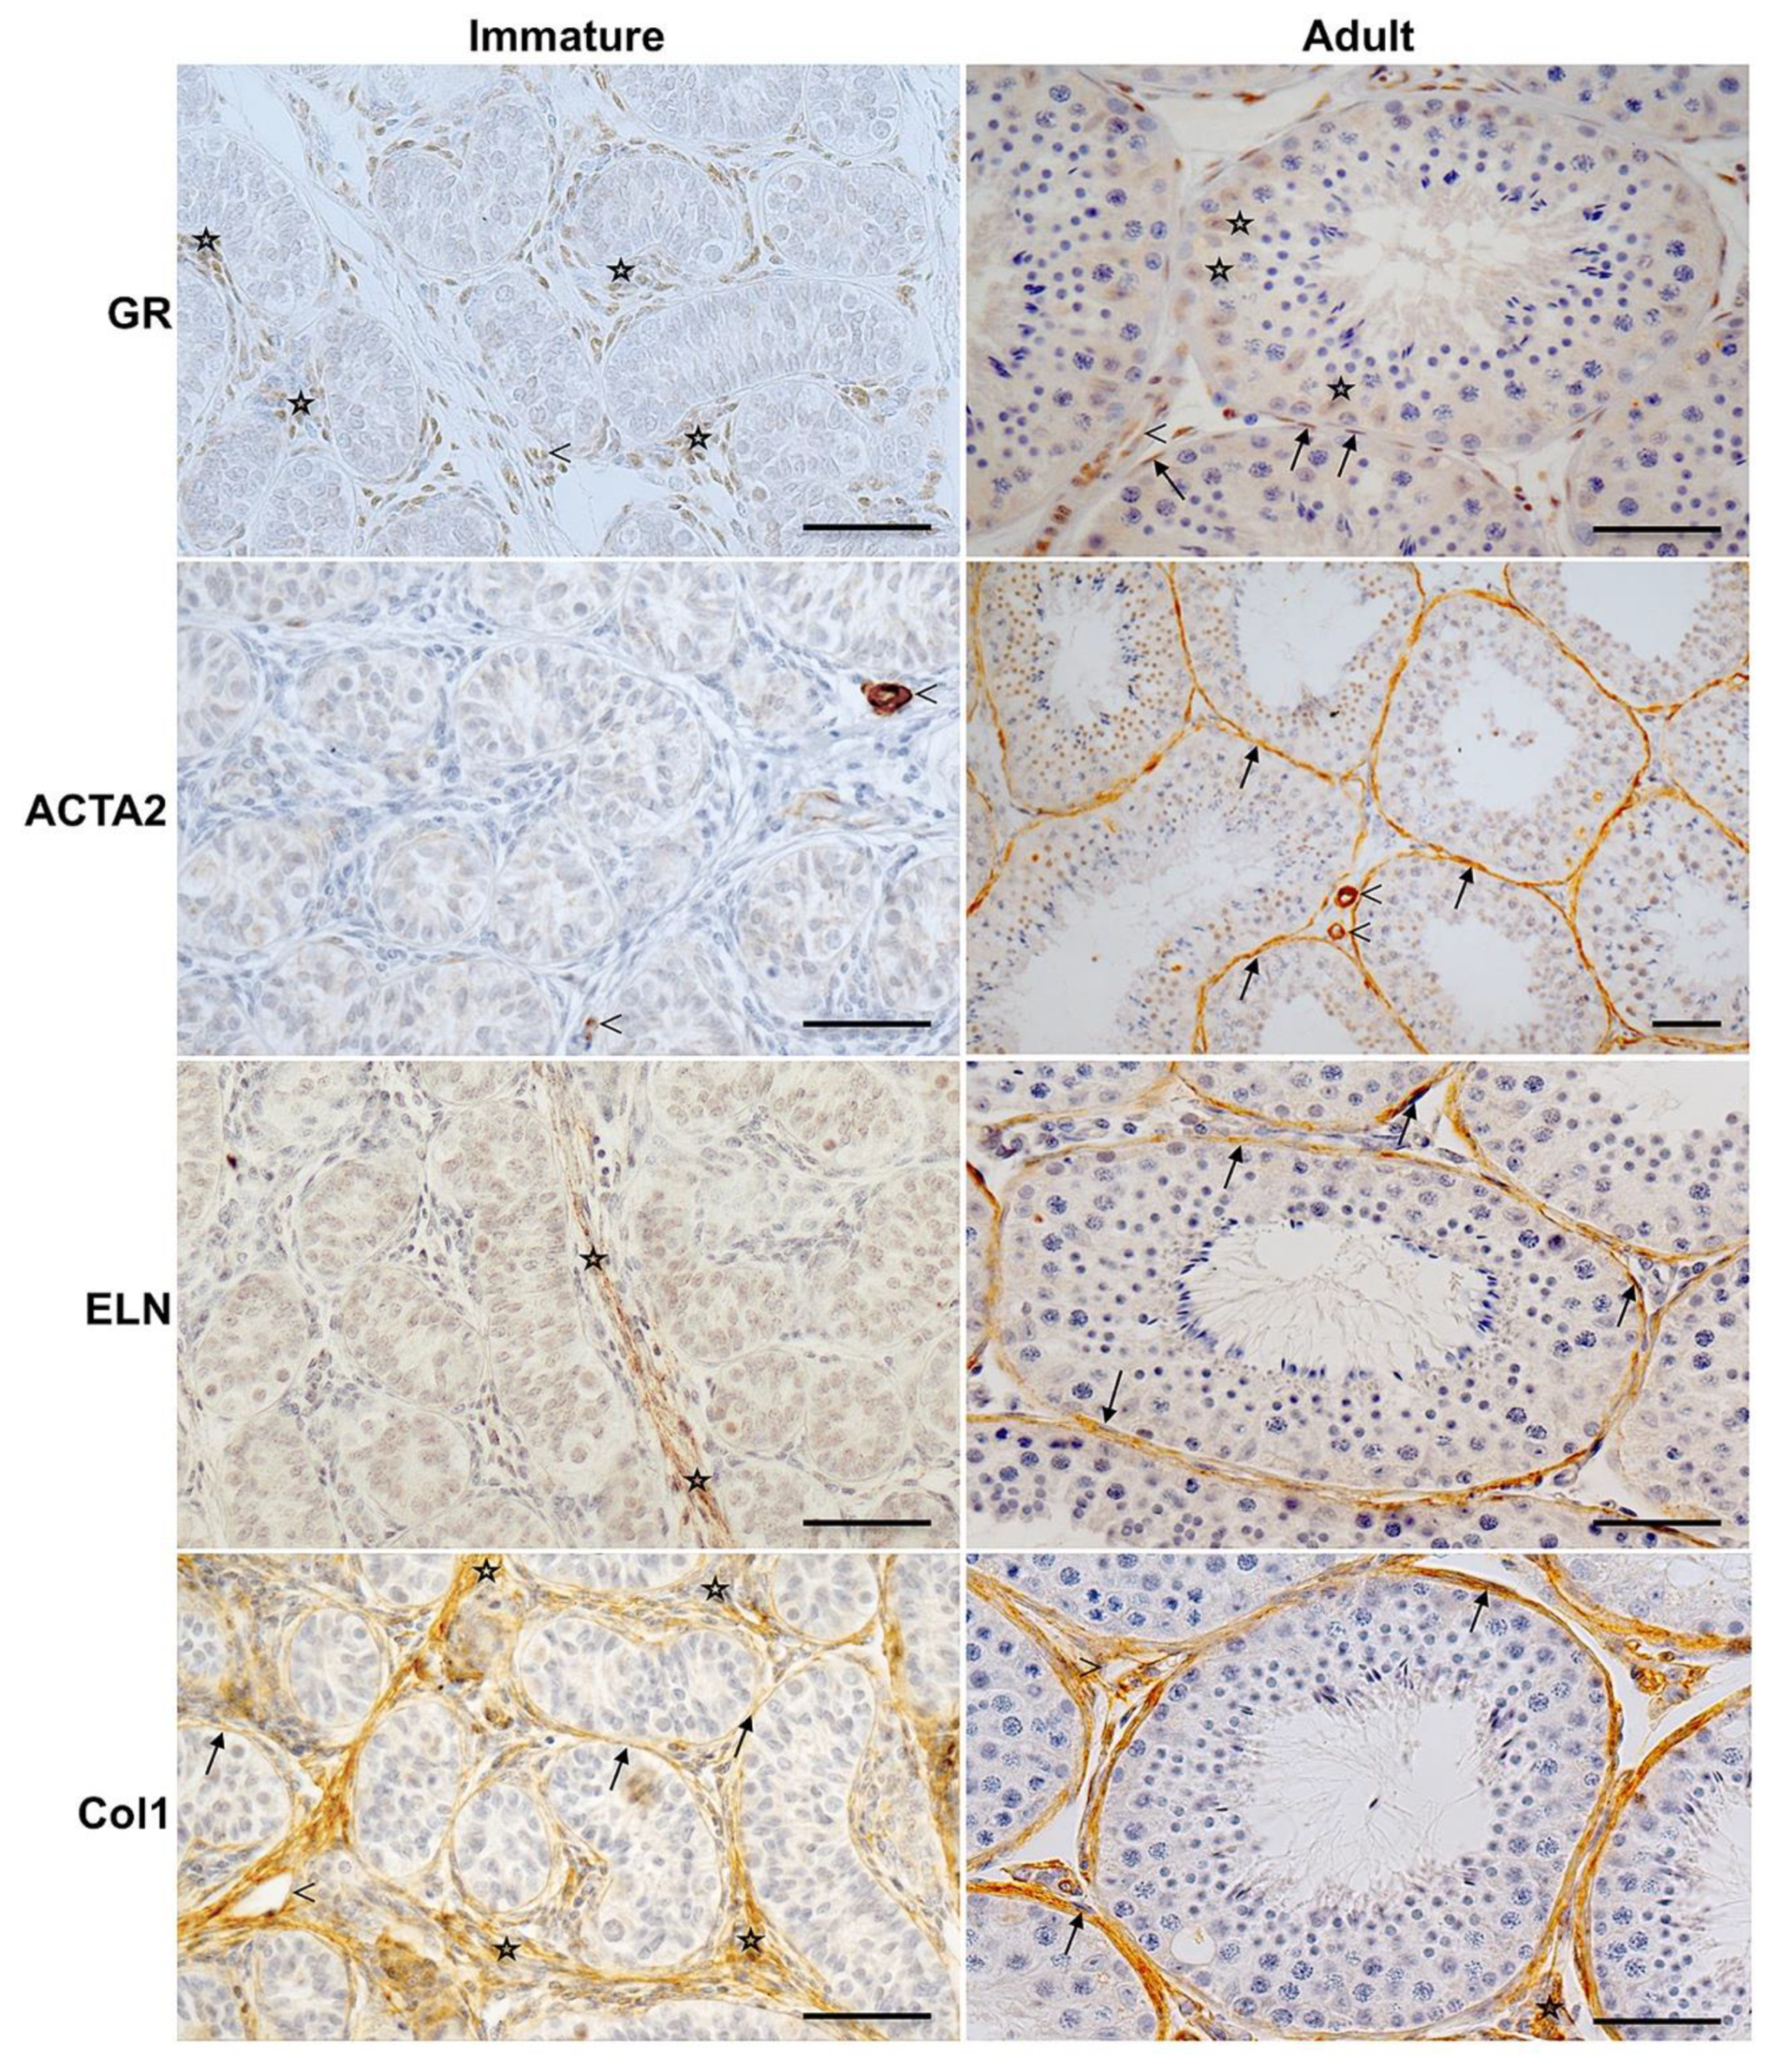
3.2. Age-Dependent GR Expression in the Testes of Rhesus Monkeys
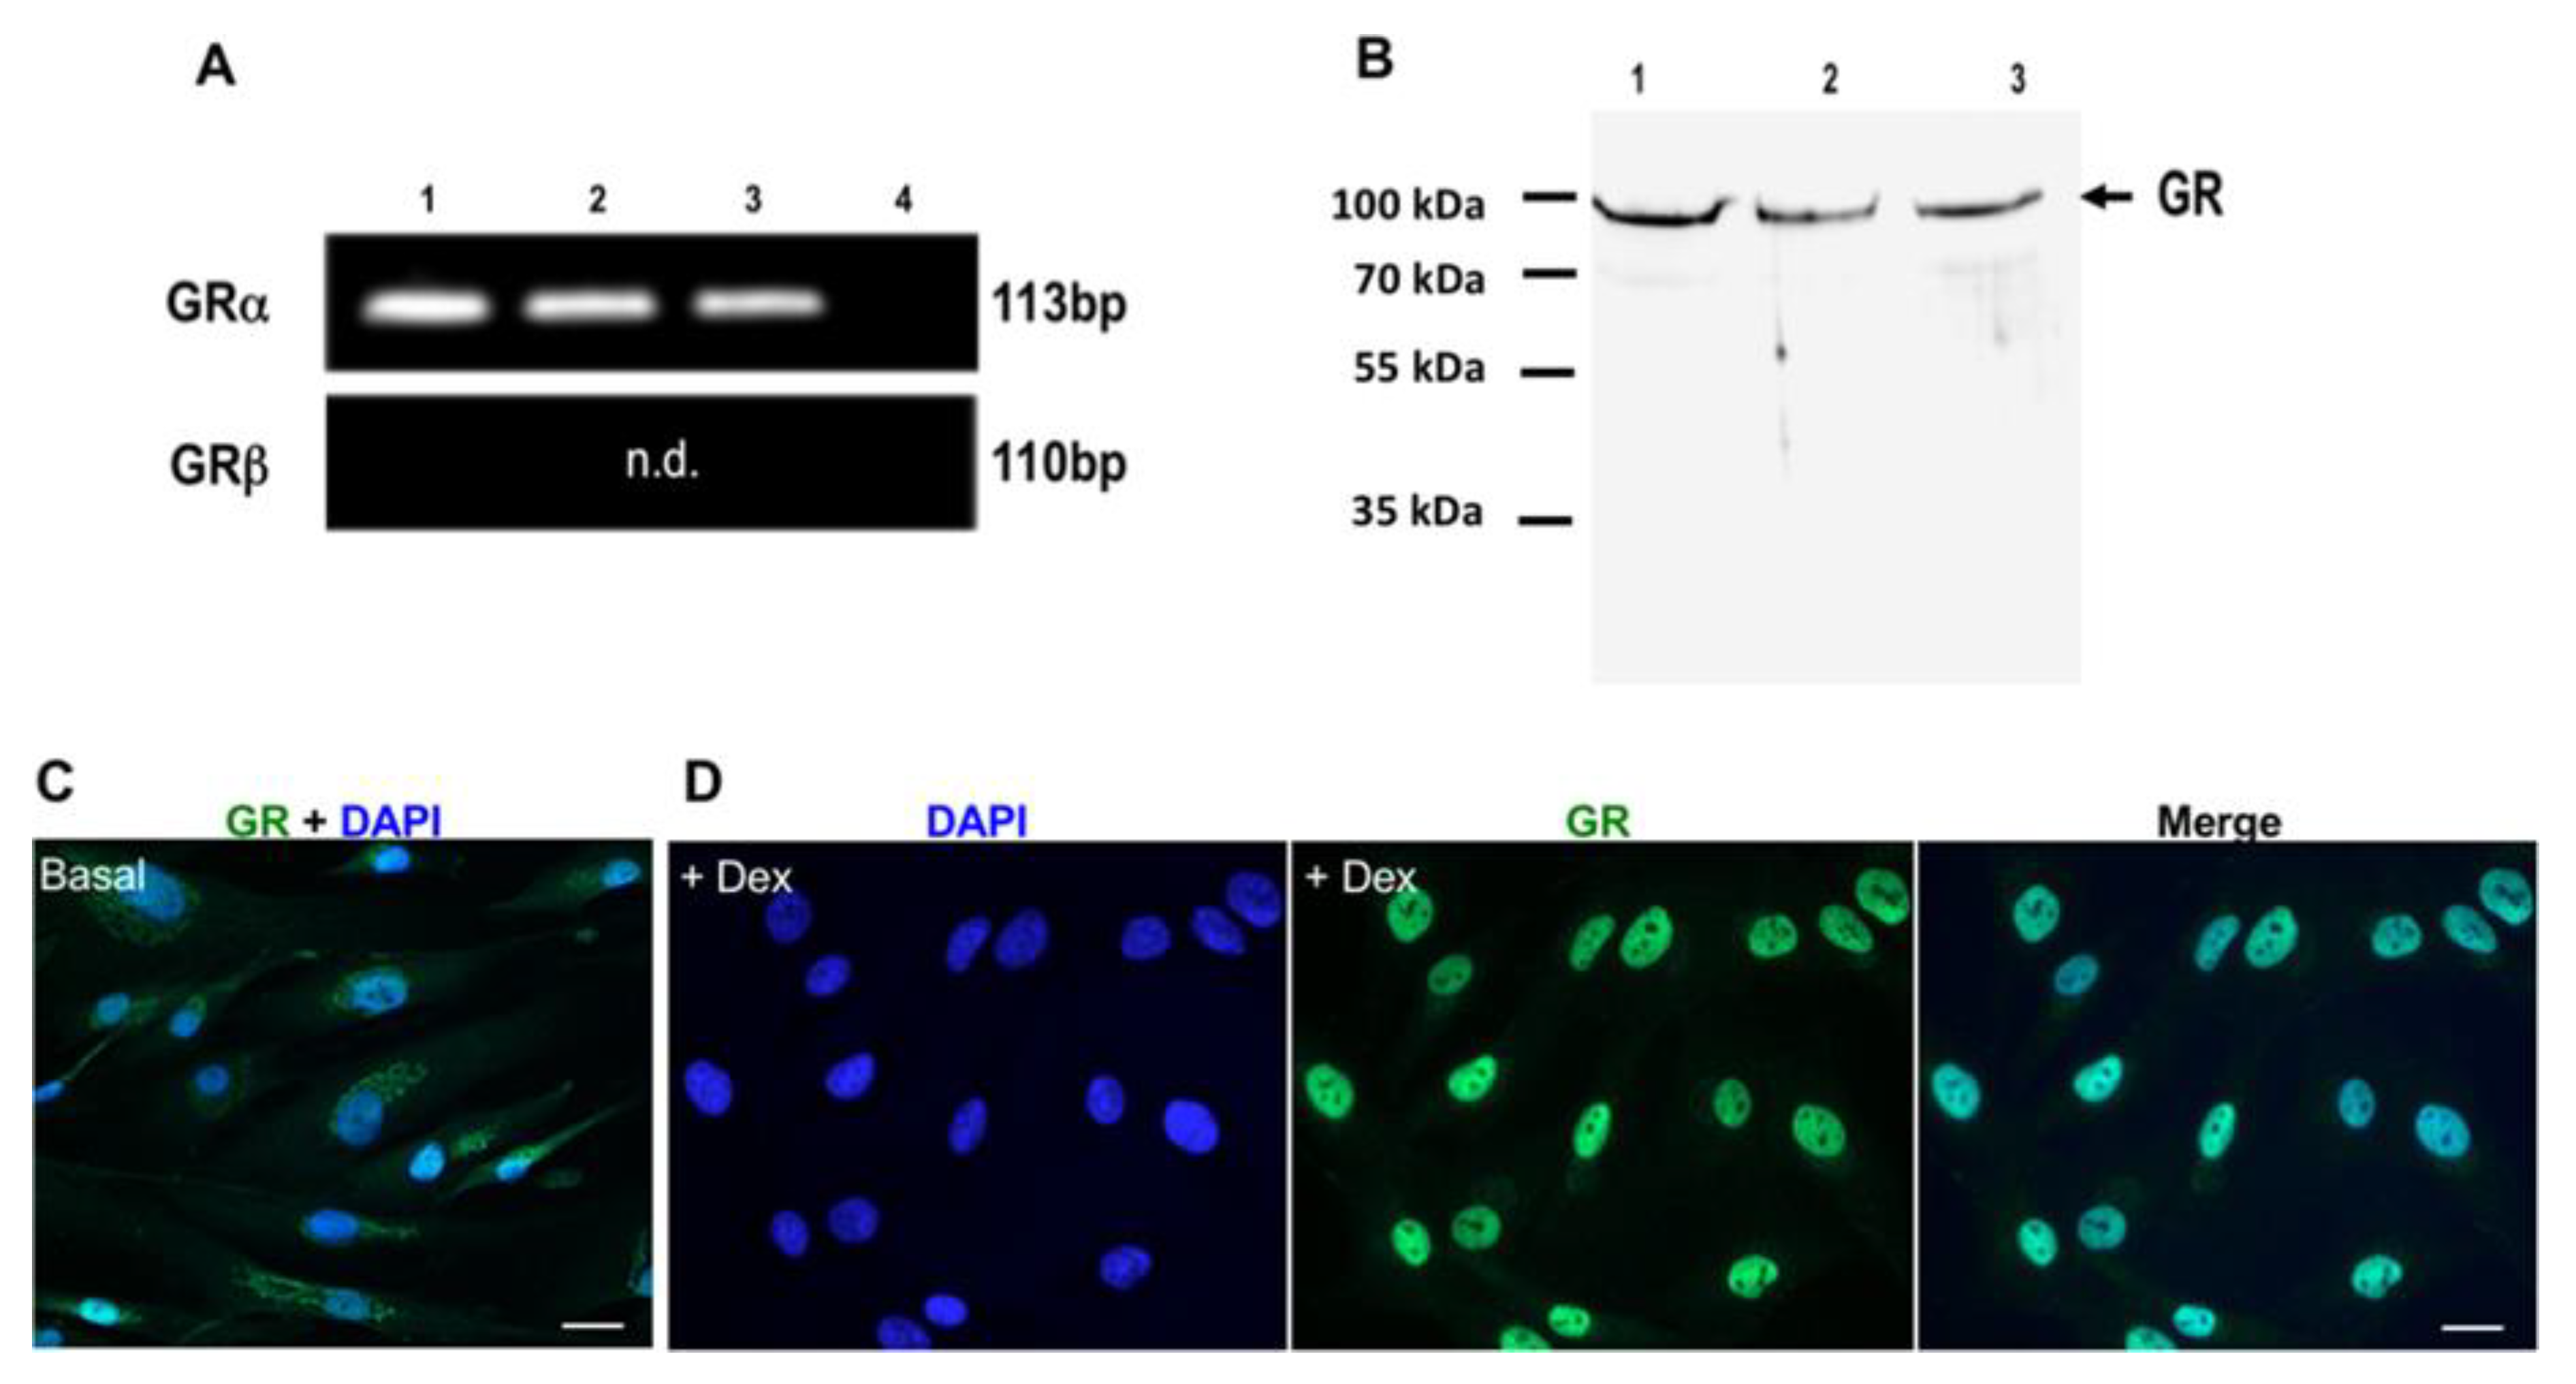
3.3. Expression and Induction of Dex-Dependent Translocation of GR Into the Nucleus
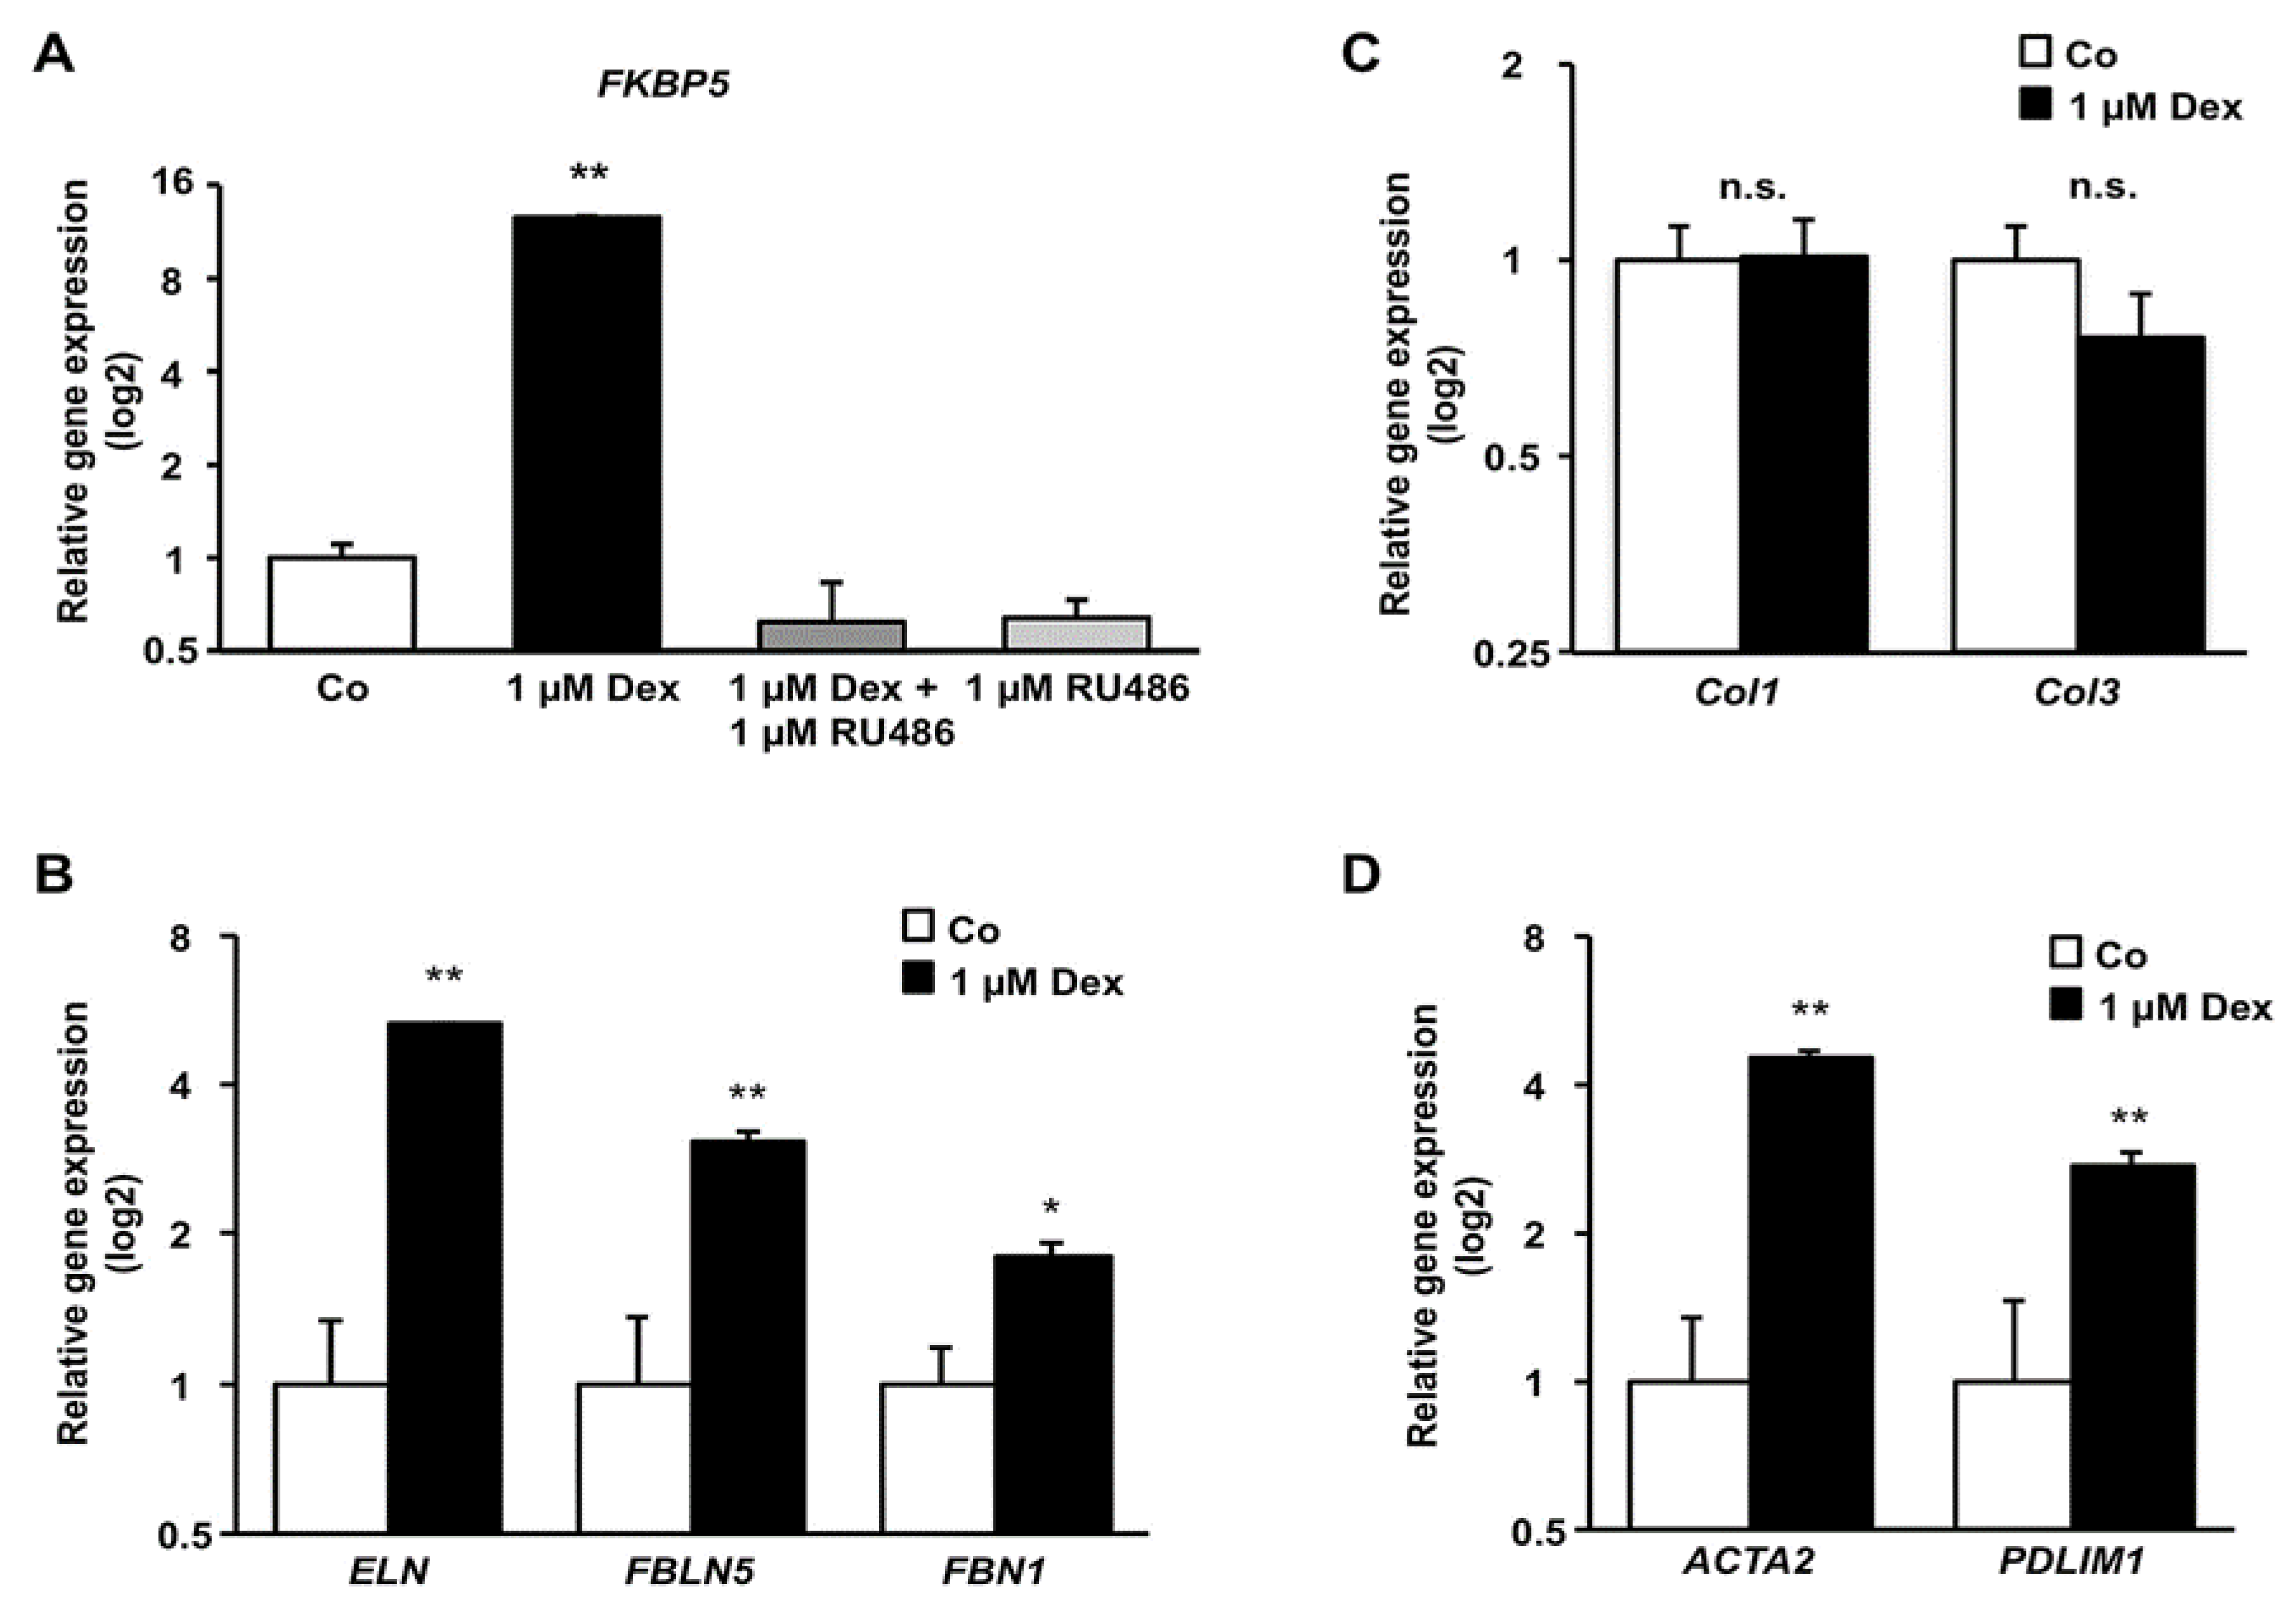
3.4. Effect of Dex on mRNA Level of Components of the Cytoskeleton and Extracellular Matrix
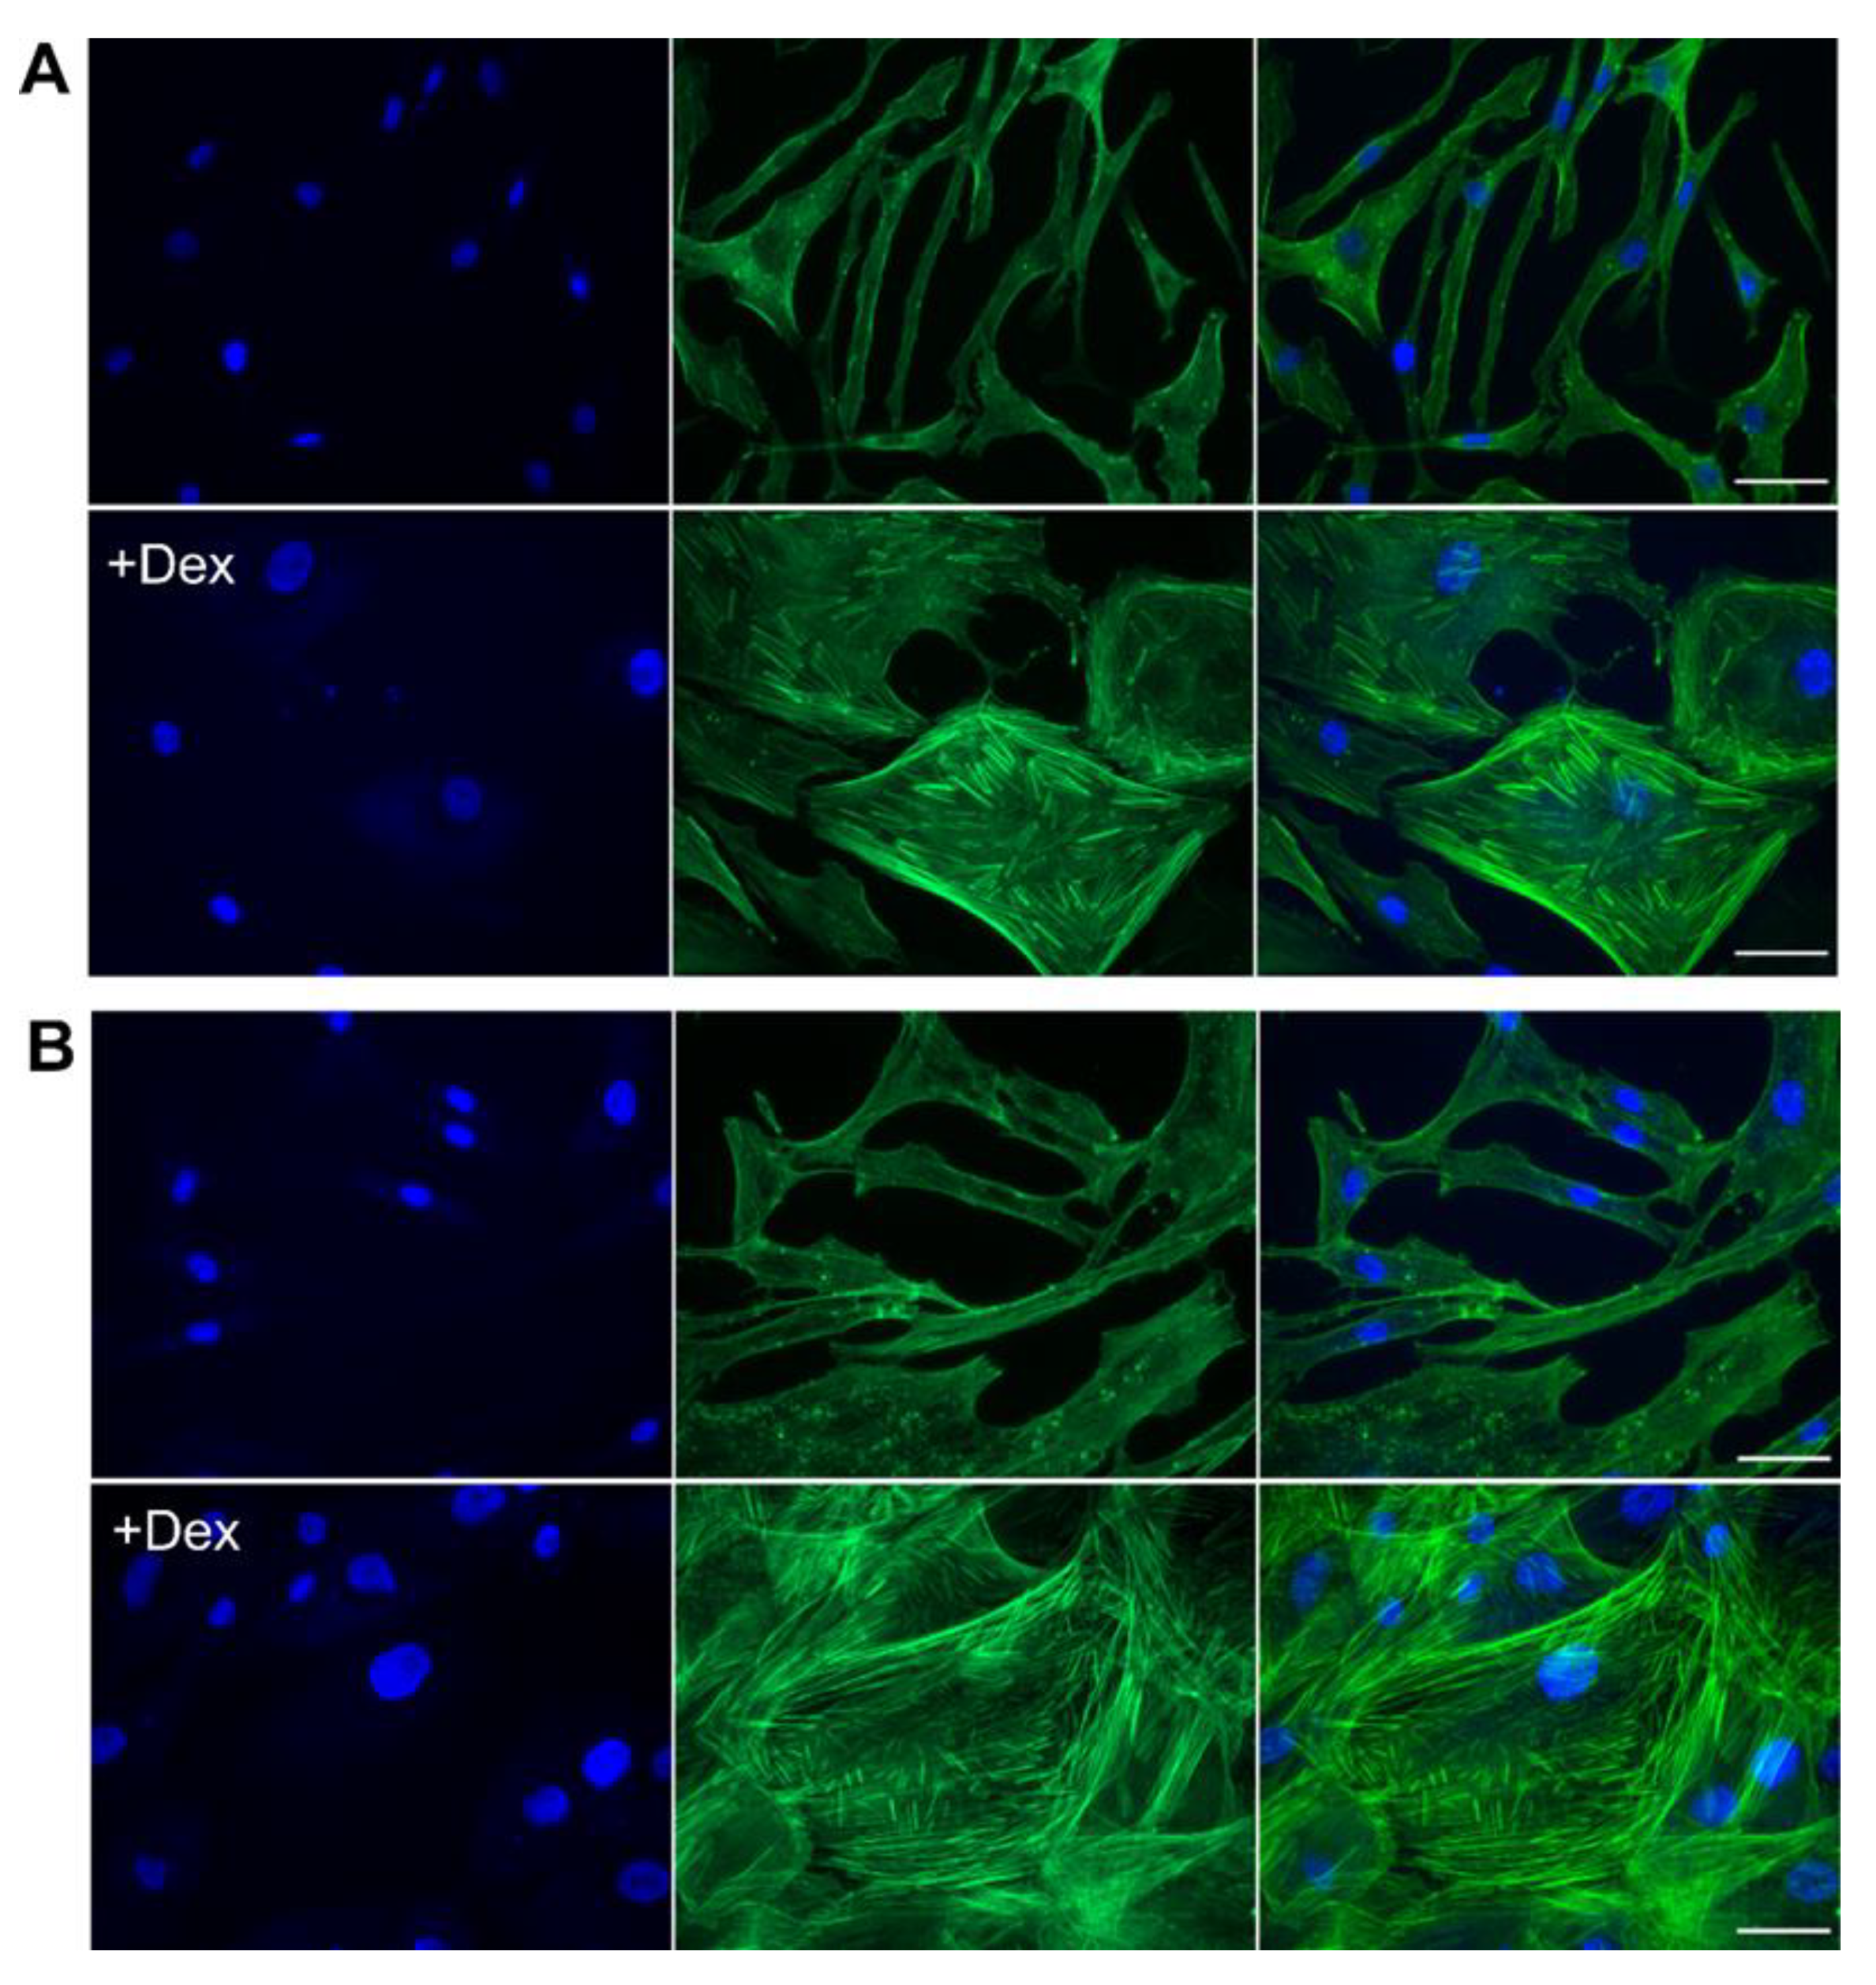
3.5. Dex Caused a Rapid Change in Cellular Morphology and an Increase in Stress Fibers
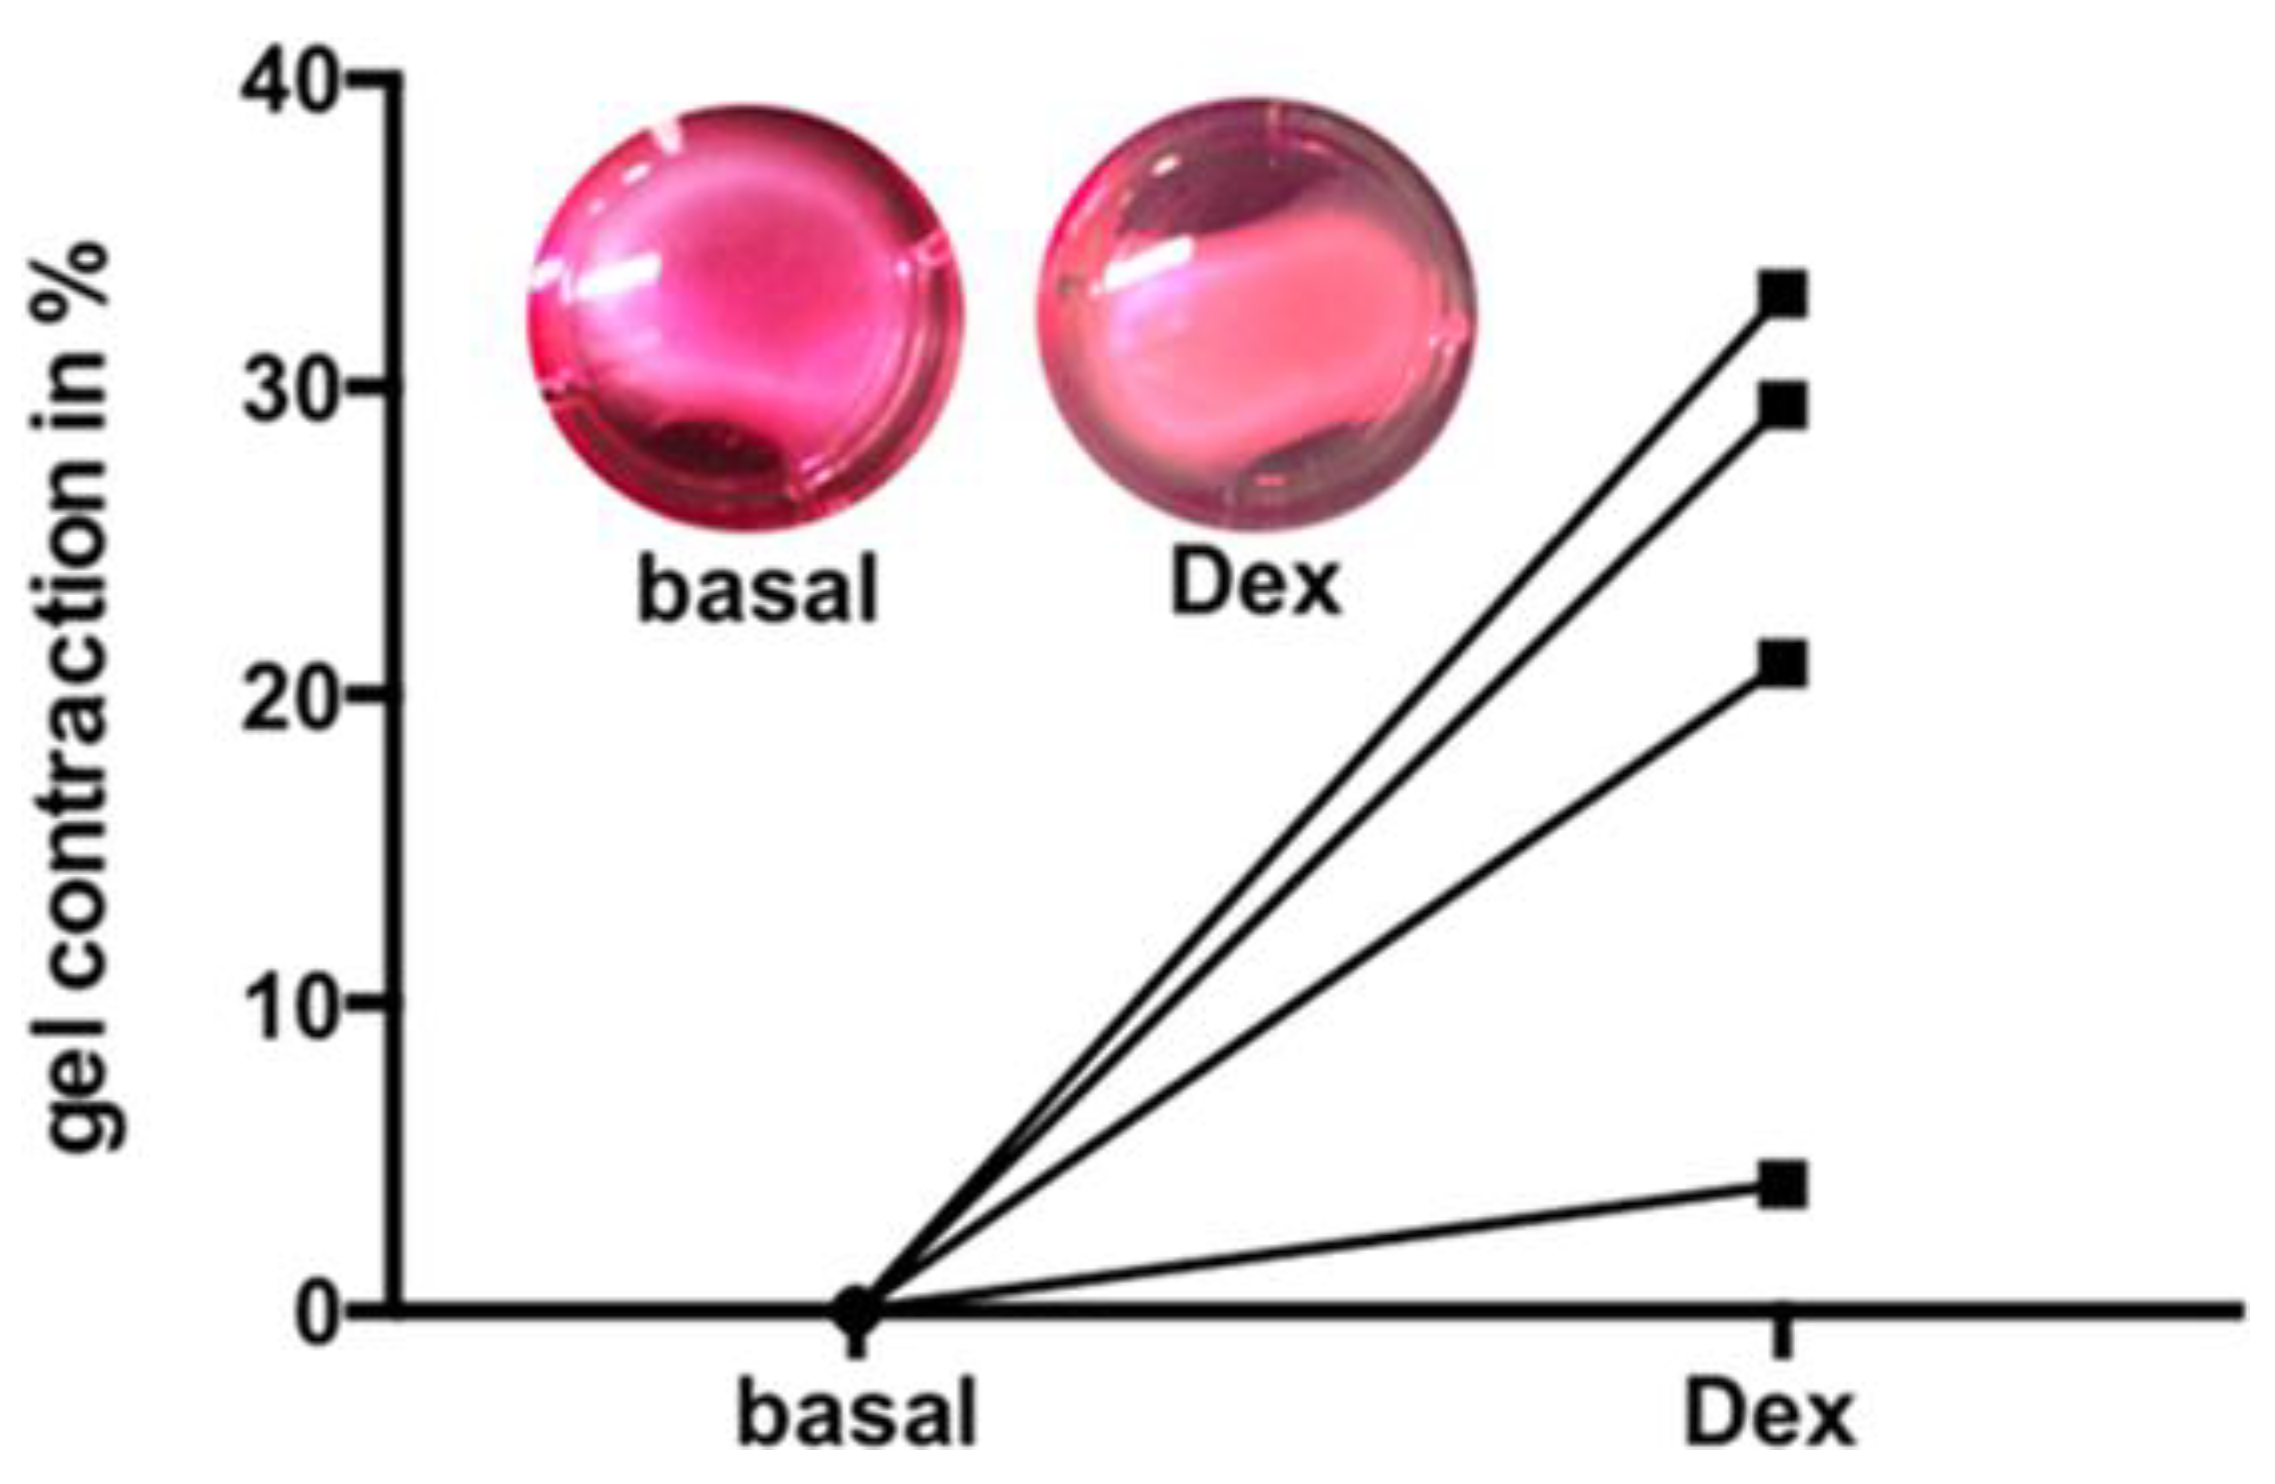
3.6. Dex Induced Increase of Contractility
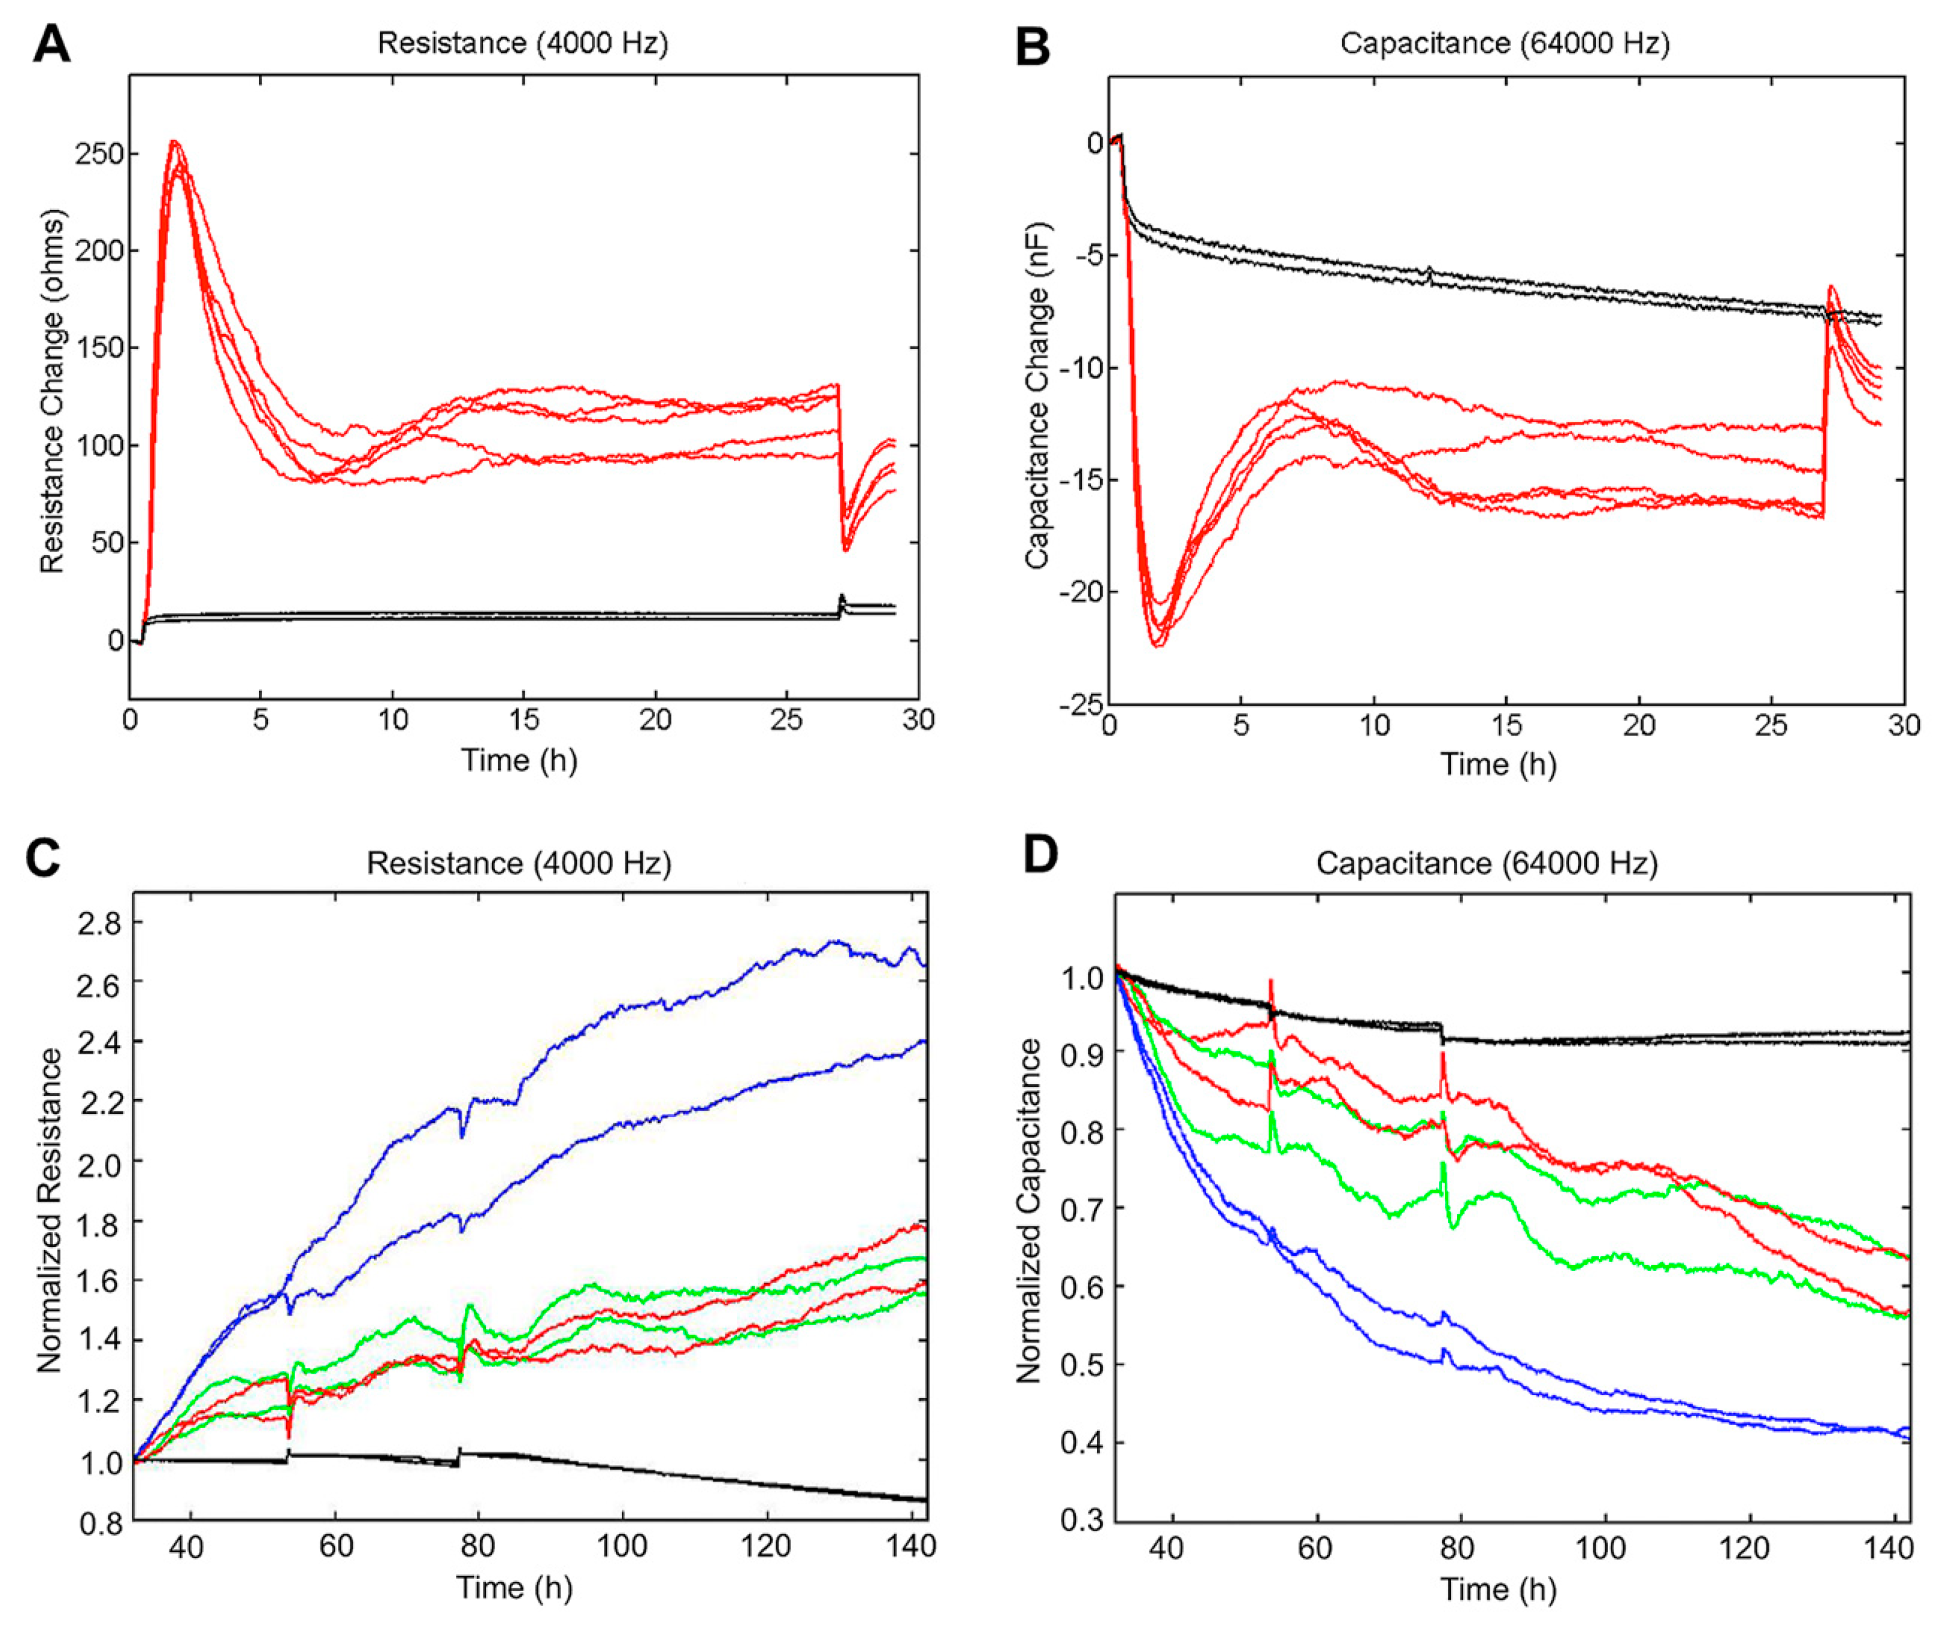
3.7. Electric Cell Substrate Impedance Sensing (ECIS) Measurements to Quantify Cell Behavior
4. Discussion
5. Conclusions
Supplementary Materials
Author Contributions
Funding
Conflicts of Interest
Further Information
References
- Chihara, M.; Yoshihara, K.; Ishiguro, T.; Adachi, S.; Okada, H.; Kashima, K.; Sato, T.; Tanaka, A.; Tanaka, K.; Enomoto, T. Association of NR3C1/Glucocorticoid Receptor gene SNP with azoospermia in Japanese men. J. Obstet. Gynaecol. Res. 2016, 42, 59–66. [Google Scholar] [CrossRef] [PubMed]
- Gabrilove, J.L.; Nicolis, G.L.; Sohval, A.R. The testis in Cushing’s syndrome. J. Urol. 1974, 112, 95–99. [Google Scholar] [CrossRef]
- Tsigos, C.; Chrousos, G.P. Hypothalamic-pituitary-adrenal axis, neuroendocrine factors and stress. J. Psychosom. Res. 2002, 53, 865–871. [Google Scholar] [CrossRef] [Green Version]
- Nordkap, L.; Almstrup, K.; Nielsen, J.E.; Bang, A.K.; Priskorn, L.; Krause, M.; Holmboe, S.A.; Winge, S.B.; Egeberg Palme, D.L.; Morup, N.; et al. Possible involvement of the glucocorticoid receptor (NR3C1) and selected NR3C1 gene variants in regulation of human testicular function. Andrology 2017, 5, 1105–1114. [Google Scholar] [CrossRef] [Green Version]
- Albrecht, M.; Ramsch, R.; Kohn, F.M.; Schwarzer, J.U.; Mayerhofer, A. Isolation and cultivation of human testicular peritubular cells: A new model for the investigation of fibrotic processes in the human testis and male infertility. J. Clin. Endocrinol. Metab. 2006, 91, 1956–1960. [Google Scholar] [CrossRef] [Green Version]
- Mayerhofer, A. Human testicular peritubular cells: More than meets the eye. Reproduction 2013, 145, R107–R116. [Google Scholar] [CrossRef] [Green Version]
- Flenkenthaler, F.; Windschuttl, S.; Frohlich, T.; Schwarzer, J.U.; Mayerhofer, A.; Arnold, G.J. Secretome analysis of testicular peritubular cells: A window into the human testicular microenvironment and the spermatogonial stem cell niche in man. J. Proteome Res. 2014, 13, 1259–1269. [Google Scholar] [CrossRef]
- Welter, H.; Huber, A.; Lauf, S.; Einwang, D.; Mayer, C.; Schwarzer, J.U.; Kohn, F.M.; Mayerhofer, A. Angiotensin II regulates testicular peritubular cell function via AT1 receptor: A specific situation in male infertility. Mol. Cell. Endocrinol. 2014, 393, 171–178. [Google Scholar] [CrossRef]
- Schmid, N.; Flenkenthaler, F.; Stockl, J.B.; Dietrich, K.G.; Kohn, F.M.; Schwarzer, J.U.; Kunz, L.; Luckner, M.; Wanner, G.; Arnold, G.J.; et al. Insights into replicative senescence of human testicular peritubular cells. Sci. Rep. 2019, 9, 15052. [Google Scholar] [CrossRef] [Green Version]
- Domke, L.M.; Franke, W.W. The cell-cell junctions of mammalian testes: II. The lamellar smooth muscle monolayer cells of the peritubular wall are laterally connected by vertical adherens junctions-a novel architectonic cell-cell junction system. Cell Tissue Res. 2019, 375, 451–482. [Google Scholar] [CrossRef] [Green Version]
- De Menezes, A.P. Elastic tissue in the limiting membrane of the human seminiferous tubule. Am. J. Anat. 1977, 150, 349–373. [Google Scholar] [CrossRef]
- Maekawa, M.; Kamimura, K.; Nagano, T. Peritubular myoid cells in the testis: Their structure and function. Arch. Histol. Cytol. 1996, 59, 1–13. [Google Scholar] [CrossRef] [PubMed] [Green Version]
- Welter, H.; Kampfer, C.; Lauf, S.; Feil, R.; Schwarzer, J.U.; Kohn, F.M.; Mayerhofer, A. Partial loss of contractile marker proteins in human testicular peritubular cells in infertility patients. Andrology 2013, 1, 318–324. [Google Scholar] [CrossRef] [PubMed]
- Schlatt, S.; Weinbauer, G.F.; Arslan, M.; Nieschlag, E. Appearance of alpha-smooth muscle actin in peritubular cells of monkey testes is induced by androgens, modulated by follicle-stimulating hormone, and maintained after hormonal withdrawal. J. Androl. 1993, 14, 340–350. [Google Scholar] [PubMed]
- Adam, M.; Urbanski, H.F.; Garyfallou, V.T.; Welsch, U.; Kohn, F.M.; Ullrich Schwarzer, J.; Strauss, L.; Poutanen, M.; Mayerhofer, A. High levels of the extracellular matrix proteoglycan decorin are associated with inhibition of testicular function. Int. J. Androl. 2012, 35, 550–561. [Google Scholar] [CrossRef] [PubMed]
- Frungieri, M.B.; Urbanski, H.F.; Hohne-Zell, B.; Mayerhofer, A. Neuronal elements in the testis of the rhesus monkey: Ontogeny, characterization and relationship to testicular cells. Neuroendocrinology 2000, 71, 43–50. [Google Scholar] [CrossRef]
- Schell, C.; Albrecht, M.; Spillner, S.; Mayer, C.; Kunz, L.; Kohn, F.M.; Schwarzer, U.; Mayerhofer, A. 15-Deoxy-delta 12-14-prostaglandin-J2 induces hypertrophy and loss of contractility in human testicular peritubular cells: Implications for human male fertility. Endocrinology 2010, 151, 1257–1268. [Google Scholar] [CrossRef] [Green Version]
- Windschüttl, S.; Nettersheim, D.; Schlatt, S.; Huber, A.; Welter, H.; Schwarzer, J.U.; Köhn, F.M.; Schorle, H.; Mayerhofer, A. Are testicular mast cells involved in the regulation of germ cells in man? Andrology 2014, 2, 615–622. [Google Scholar] [CrossRef]
- Haimes, J.K.M. Demonstration of a ΔΔCq CalculationMethod to Compute Relative Gene Expression from qPCR Data. In Dharmacon; A Horizon Discovery Group Company: Lafayette, CO, USA, 2014. [Google Scholar]
- Rossi, S.P.; Windschuettl, S.; Matzkin, M.E.; Terradas, C.; Ponzio, R.; Puigdomenech, E.; Levalle, O.; Calandra, R.S.; Mayerhofer, A.; Frungieri, M.B. Melatonin in testes of infertile men: Evidence for anti-proliferative and anti-oxidant effects on local macrophage and mast cell populations. Andrology 2014, 2, 436–449. [Google Scholar] [CrossRef]
- Eubler, K.; Herrmann, C.; Tiefenbacher, A.; Kohn, F.M.; Schwarzer, J.U.; Kunz, L.; Mayerhofer, A. Ca(2+) Signaling and IL-8 Secretion in Human Testicular Peritubular Cells Involve the Cation Channel TRPV2. Int. J. Mol. Sci. 2018, 19, 2829. [Google Scholar] [CrossRef] [Green Version]
- Schindelin, J.; Arganda-Carreras, I.; Frise, E.; Kaynig, V.; Longair, M.; Pietzsch, T.; Preibisch, S.; Rueden, C.; Saalfeld, S.; Schmid, B.; et al. Fiji: An open-source platform for biological-image analysis. Nat. Methods 2012, 9, 676–682. [Google Scholar] [CrossRef] [PubMed] [Green Version]
- Chrousos, G.P. Stress and disorders of the stress system. Nat. Rev. Endocrinol. 2009, 5, 374–381. [Google Scholar] [CrossRef] [PubMed]
- Wiedmer-Bridel, J.; Vogel, A.; Hedinger, C. Elastic fibers in the tunica propria of the seminiferous tubules. Light and electron microscopic investigations. Virchows Arch. B Cell Pathol. 1978, 27, 267–277. [Google Scholar] [CrossRef] [PubMed]
- Ledo, I.; Wu, M.; Katchman, S.; Brown, D.; Kennedy, S.; Hsu-Wong, S.; Uitto, J. Glucocorticosteroids up-regulate human elastin gene promoter activity in transgenic mice. J. Investig. Dermatol. 1994, 103, 632–636. [Google Scholar] [CrossRef] [Green Version]
- Mayer, C.; Adam, M.; Glashauser, L.; Dietrich, K.; Schwarzer, J.U.; Kohn, F.M.; Strauss, L.; Welter, H.; Poutanen, M.; Mayerhofer, A. Sterile inflammation as a factor in human male infertility: Involvement of Toll like receptor 2, biglycan and peritubular cells. Sci. Rep. 2016, 6, 37128. [Google Scholar] [CrossRef] [Green Version]
- Menke, A.; Arloth, J.; Putz, B.; Weber, P.; Klengel, T.; Mehta, D.; Gonik, M.; Rex-Haffner, M.; Rubel, J.; Uhr, M.; et al. Dexamethasone stimulated gene expression in peripheral blood is a sensitive marker for glucocorticoid receptor resistance in depressed patients. Neuropsychopharmacology 2012, 37, 1455–1464. [Google Scholar] [CrossRef]
- Rozsa, F.W.; Reed, D.M.; Scott, K.M.; Pawar, H.; Moroi, S.E.; Kijek, T.G.; Krafchak, C.M.; Othman, M.I.; Vollrath, D.; Elner, V.M.; et al. Gene expression profile of human trabecular meshwork cells in response to long-term dexamethasone exposure. Mol. Vis. 2006, 12, 125–141. [Google Scholar]
- Leventhal, S.M.; Lim, D.; Green, T.L.; Cantrell, A.E.; Cho, K.; Greenhalgh, D.G. Uncovering a multitude of human glucocorticoid receptor variants: An expansive survey of a single gene. BMC Genet. 2019, 20, 16. [Google Scholar] [CrossRef]
- Ren, R.; Oakley, R.H.; Cruz-Topete, D.; Cidlowski, J.A. Dual role for glucocorticoids in cardiomyocyte hypertrophy and apoptosis. Endocrinology 2012, 153, 5346–5360. [Google Scholar] [CrossRef] [Green Version]
- Cruz-Topete, D.; Myers, P.H.; Foley, J.F.; Willis, M.S.; Cidlowski, J.A. Corticosteroids Are Essential for Maintaining Cardiovascular Function in Male Mice. Endocrinology 2016, 157, 2759–2771. [Google Scholar] [CrossRef]
- Clark, R.; Nosie, A.; Walker, T.; Faralli, J.A.; Filla, M.S.; Barrett-Wilt, G.; Peters, D.M. Comparative genomic and proteomic analysis of cytoskeletal changes in dexamethasone-treated trabecular meshwork cells. Mol. Cell. Proteom. 2013, 12, 194–206. [Google Scholar] [CrossRef] [PubMed] [Green Version]


© 2020 by the authors. Licensee MDPI, Basel, Switzerland. This article is an open access article distributed under the terms and conditions of the Creative Commons Attribution (CC BY) license (http://creativecommons.org/licenses/by/4.0/).
Share and Cite
Welter, H.; Herrmann, C.; Dellweg, N.; Missel, A.; Thanisch, C.; Urbanski, H.F.; Köhn, F.-M.; Schwarzer, J.U.; Müller-Taubenberger, A.; Mayerhofer, A. The Glucocorticoid Receptor NR3C1 in Testicular Peritubular Cells is Developmentally Regulated and Linked to the Smooth Muscle-Like Cellular Phenotype. J. Clin. Med. 2020, 9, 961. https://doi.org/10.3390/jcm9040961
Welter H, Herrmann C, Dellweg N, Missel A, Thanisch C, Urbanski HF, Köhn F-M, Schwarzer JU, Müller-Taubenberger A, Mayerhofer A. The Glucocorticoid Receptor NR3C1 in Testicular Peritubular Cells is Developmentally Regulated and Linked to the Smooth Muscle-Like Cellular Phenotype. Journal of Clinical Medicine. 2020; 9(4):961. https://doi.org/10.3390/jcm9040961
Chicago/Turabian StyleWelter, Harald, Carola Herrmann, Nils Dellweg, Annika Missel, Christiane Thanisch, Henryk F. Urbanski, Frank-Michael Köhn, J. Ullrich Schwarzer, Annette Müller-Taubenberger, and Artur Mayerhofer. 2020. "The Glucocorticoid Receptor NR3C1 in Testicular Peritubular Cells is Developmentally Regulated and Linked to the Smooth Muscle-Like Cellular Phenotype" Journal of Clinical Medicine 9, no. 4: 961. https://doi.org/10.3390/jcm9040961