Article

Dysregulation of Lipid Metabolism in Mkp-1 Deficient Mice during Gram-Negative Sepsis

1
Center for Perinatal Research, The Research Institute at Nationwide Children’s Hospital, Columbus, OH 43215, USA
2
Laboratory of Muscle Stem Cells and Gene Regulation, National Institute of Arthritis and Musculoskeletal and Skin Disease, National Institutes of Health, Bethesda, MD 20892, USA
3
Department of Obstetrics and Gynecology, The Ohio State University College of Medicine, Columbus, OH 43210, USA
4
Center for Molecular Medicine and Genetics, Wayne State University School of Medicine, Detroit, MI 48201, USA
5
Department of Pediatrics, The Ohio State University College of Medicine, Columbus, Ohio 43205, USA
*
Author to whom correspondence should be addressed.
Int. J. Mol. Sci. 2018, 19(12), 3904; https://doi.org/10.3390/ijms19123904
Submission received: 9 November 2018 / Revised: 27 November 2018 / Accepted: 30 November 2018 / Published: 6 December 2018

Abstract

:
Mitogen-activated protein kinase phosphatase (Mkp)-1 exerts its anti-inflammatory activities during Gram-negative sepsis by deactivating p38 and c-Jun N-terminal kinase (JNK). We have previously shown that Mkp-1+/+ mice, but not Mkp-1−/− mice, exhibit hypertriglyceridemia during severe sepsis. However, the regulation of hepatic lipid stores and the underlying mechanism of lipid dysregulation during sepsis remains an enigma. To understand the molecular mechanism underlying the sepsis-associated metabolic changes and the role of Mkp-1 in the process, we infected Mkp-1+/+ and Mkp-1−/− mice with Escherichia coli i.v., and assessed the effects of Mkp-1 deficiency on tissue lipid contents. We also examined the global gene expression profile in the livers via RNA-seq. We found that in the absence of E. coli infection, Mkp-1 deficiency decreased liver triglyceride levels. Upon E. coli infection, Mkp-1+/+ mice, but not Mkp-1−/− mice, developed hepatocyte ballooning and increased lipid deposition in the livers. E. coli infection caused profound changes in the gene expression profile of a large number of proteins that regulate lipid metabolism in wildtype mice, while these changes were substantially disrupted in Mkp-1−/− mice. Interestingly, in Mkp-1+/+ mice E. coli infection resulted in downregulation of genes that facilitate fatty acid synthesis but upregulation of Cd36 and Dgat2, whose protein products mediate fatty acid uptake and triglyceride synthesis, respectively. Taken together, our studies indicate that sepsis leads to a substantial change in triglyceride metabolic gene expression programs and Mkp-1 plays an important role in this process.

1. Introduction

Severe sepsis and septic shock are a major cause of death in the United States, accounting for 215,000 deaths and 750,000 hospitalizations annually [1]. The mortality rate of septic shock still approaches 50% despite improvements in critical care medicine [2]. Metabolic dysregulation has been reported in septic patients [3,4,5,6] as well as in experimental animals such as sheep [7], dogs [8], and rodents following sepsis induction [9,10]. Septic patients or animals with Gram-negative bacteria infection often develop hyperlipidemia [11,12,13], which is often referred to as the lipemia of sepsis [14]. Since triglyceride-rich lipoproteins can bind and sequester endotoxin, hyperlipidemia of sepsis is considered a component of the innate, non-adaptive host immune response to infection [14]. In addition to the ability to sequester lipopolysaccharide (LPS), certain fatty acid species interfere with the inflammatory signaling pathway mediated by nuclear factor (NF)-κB [15]. However, derivatives of fatty acids such as arachidonic acid and prostaglandins are important mediators of the systemic inflammatory response, raising the possibility that hyperlipidemia may also be contributing factor to the pathophysiology of sepsis [16]. This is supported by a small study that found a higher incidence of hypertriglyceridemia among non-survivors than among survivors [6]. As septic patients and animals have decreased lipoprotein lipase activity in peripheral tissues such as heart, muscle, and adipose tissue as the result of elevated tumor necrosis factor (TNF)-α levels in the circulation, hypertriglyceridemia during sepsis has been attributed to defective triglyceride clearance in peripheral tissues [17,18,19,20]. However, increased very low density lipoprotein (VLDL)-mediated triglyceride efflux from the liver may also contribute to sepsis-mediated hypertriglyceridemia [21]. In fact, hepatocytes isolated from mice challenged with endotoxin exhibit increased secretion of VLDL, likely as a result of increased expression of apolipoprotein (Apo) b48, Apob100, and microsomal triglyceride transfer proteins [22], the proteins critical to VLDL assembly. One study has shown that TNF-α challenge in mice elevates the hepatic expression of sterol regulatory element-binding transcription factor (Srebf) 1 (also referred to as SREBP-1), a master regulator of lipogenesis and fatty acid synthase (Fasn), which controls the synthesis of saturated fatty acids [23]. However, another study has reported a decreased expression of lipogenesis genes in endotoxin-challenged mice [24]. The mechanisms of hepatic lipid regulation during sepsis remain poorly understood.
Mkp-1 exerts its anti-inflammatory effects by dephosphorylating p38 and JNK during gram-negative bacteria infection [25,26,27,28,29,30]. Previously, we have found that hypertriglyceridemia occurs in E. coli-infected Mkp-1+/+ mice, but not in Mkp-1−/− mice [10], suggesting that Mkp-1 plays an essential role in the sepsis-induced hypertriglyceridemia. To understand the molecular mechanisms by which Mkp-1 regulates lipid metabolism during sepsis, we assessed the liver lipid contents and the global gene expression profiles in wildtype and Mkp-1 deficient mice before and after sepsis induction. We found that E. coli infection enhanced liver triglyceride synthesis in an Mkp-1-dependent manner with an attenuation of the transcriptional program responsible for fatty acid synthesis and fatty acid oxidation. Our studies also suggest that sepsis likely exacerbates liver lipid accumulation through both increased liver fatty acid uptake and decreased fatty acid β-oxidation.

2. Results

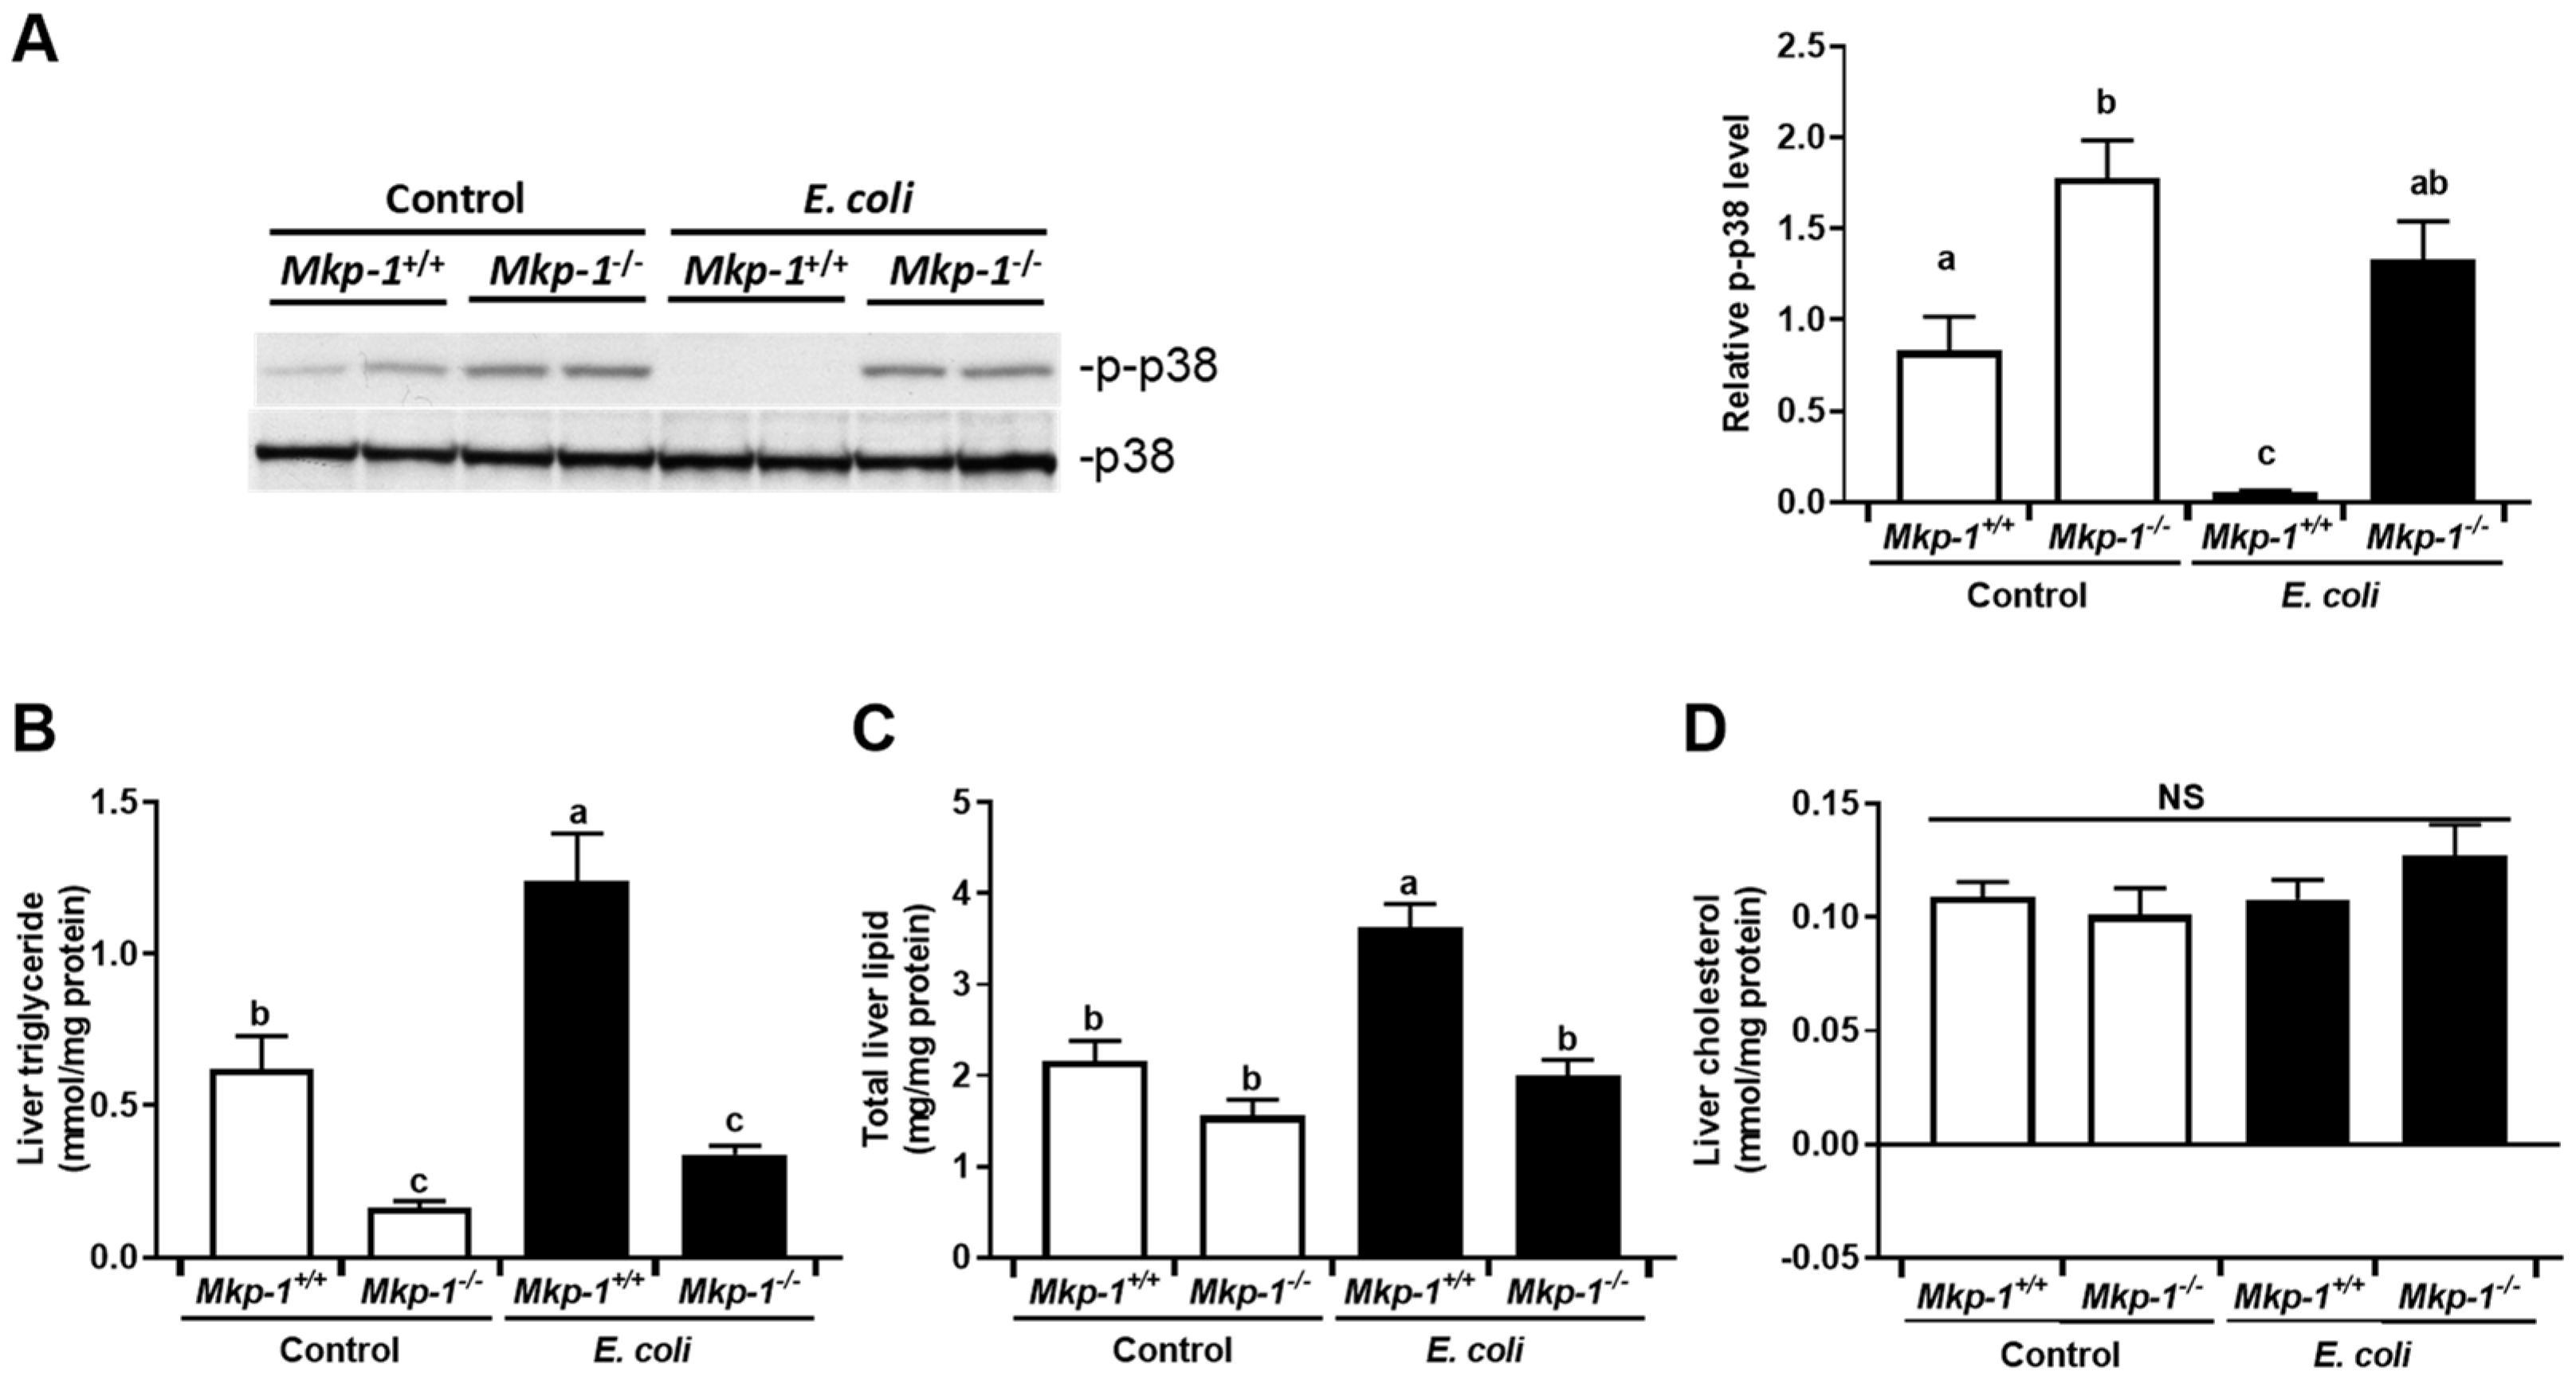
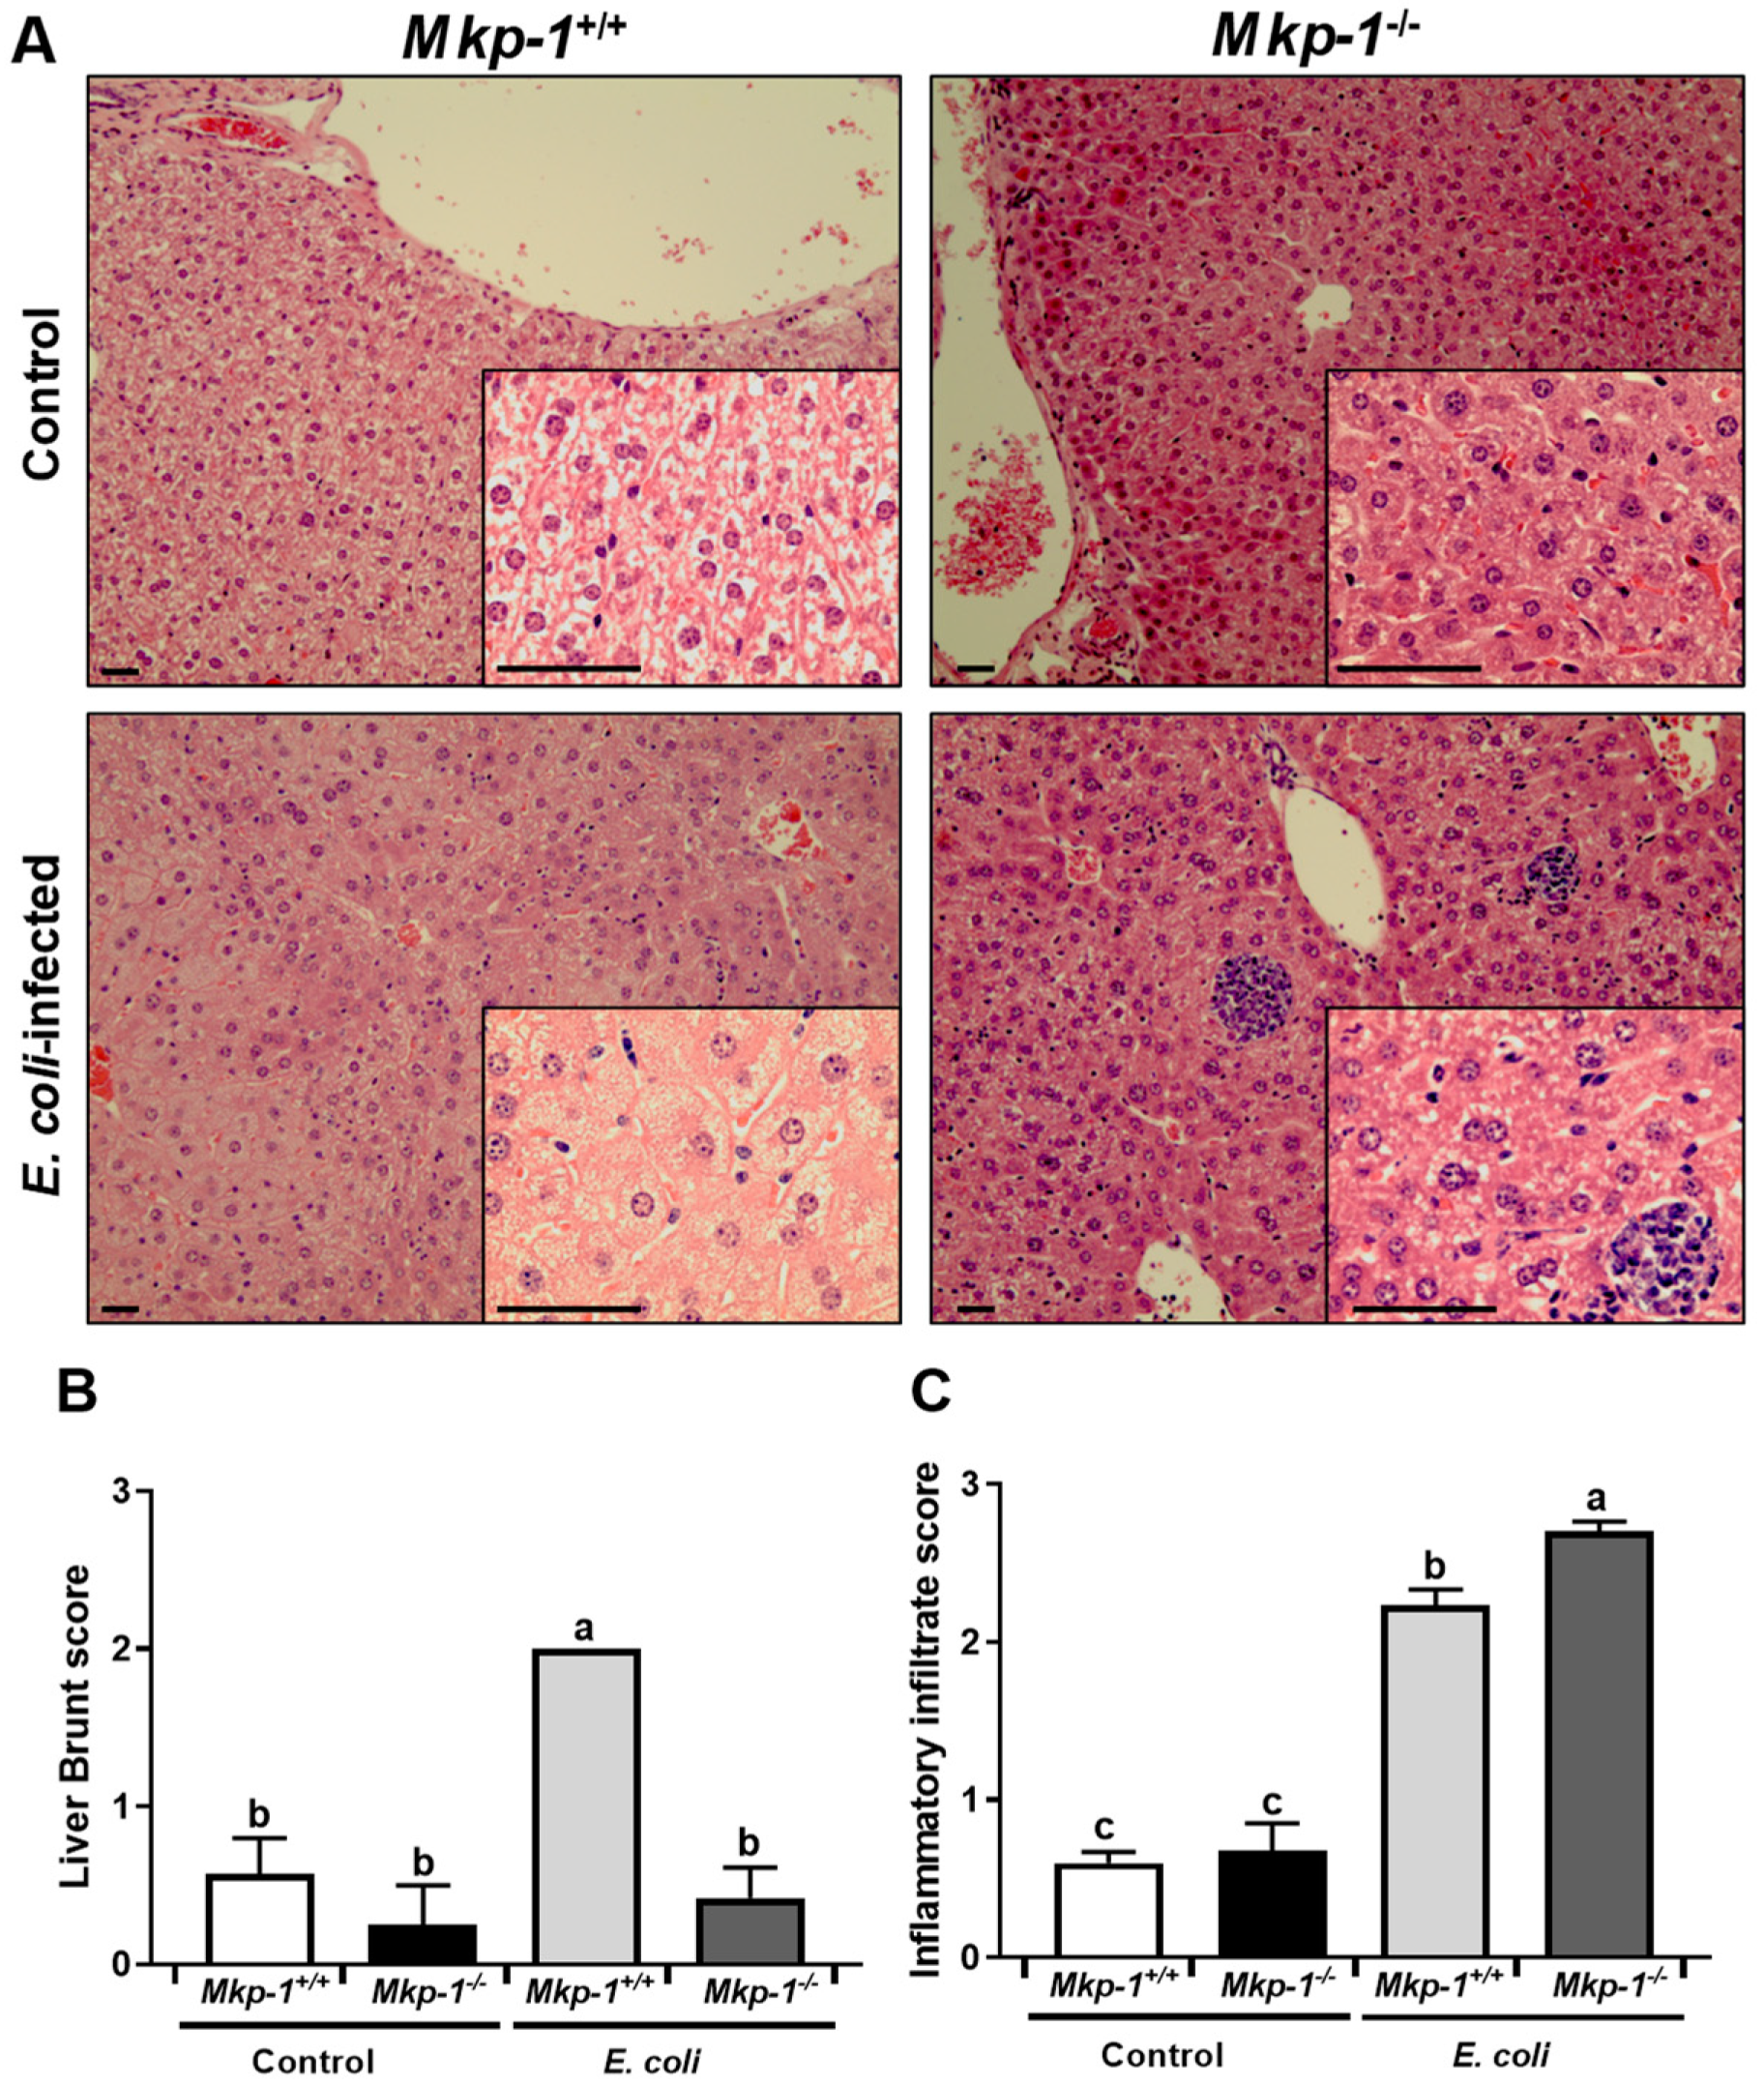
2.1. Changes in p38 Activity and Dysregulation of Lipid Metabolism Caused by Mkp-1 Deficiency and E. coli Infection

Since p38 is a preferred substrate of Mkp-1 [31] and plays a critical role in the regulation of the inflammatory response [25,30,32,33], we assessed p38 activity in the livers of Mkp-1+/+ and Mkp-1−/− mice both before and after E. coli infection (Figure 1A). In the absence of infection liver p38 activity was higher in the Mkp-1−/− mice than in the Mkp-1+/+ mice. In E. coli-infected wildtype mice, liver p38 activity became virtually undetectable 24 h post infection. In contrast, liver p38 activity remained high in E. coli-infected Mkp-1−/− mice. Quantification of p38 activity in the four groups further highlights the essential role of Mkp-1 both in the regulation of basal p38 activity in uninfected mice and particularly in the deactivation of p38 following E. coli infection (Figure 1A, right panel).
We have previously shown that Mkp-1+/+ mice but not Mkp-1−/− mice developed hyperglyceridemia in response to E. coli infection [10]. To understand how Mkp-1 deficiency and sepsis affect liver lipid contents, we measured triglyceride, total lipid, and cholesterol levels in the livers. Consistent with a previous report [34], uninfected Mkp-1−/− mice had lower liver triglyceride than uninfected Mkp-1+/+ mice (Figure 1B). Surprisingly, E. coli infection significantly increased total liver triglyceride levels in Mkp-1+/+ mice, but not in Mkp-1−/− mice (Figure 1C). E. coli infection also increased total liver lipid content in the Mkp-1+/+ mice, but not in Mkp-1−/− mice (Figure 1C), while liver cholesterol content did not differ between groups (Figure 1D). The differences in liver lipid contents were corroborated by histology analyses (Figure 2A). Diffused hepatocellular swelling and clearing, an indication of hepatic glycogen deposition, were seen in both un-infected Mkp-1+/+ and Mkp-1−/− mice, although the hepatocellular swelling and clearing were more prevalent in Mkp-1+/+ mice than in Mkp-1−/− mice (Figure 2A, Top row). Upon E. coli infection, dramatic differences were seen in the histology between the Mkp-1+/+ and Mkp-1−/− livers (Figure 2A, bottom row). Histological examination revealed moderate to marked, centrilobular to midzonal, hepatocyte vacuolation (often referred to as hepatocyte ballooning) in the livers of E. coli-infected Mkp-1+/+ mice, indicating hepatic lipidosis. Additionally, multifocal-random moderate to marked necrosuppurative hepatitis with rare intralesional rod-shaped bacteria were seen throughout the Mkp-1+/+ liver sections. Furthermore, in Mkp-1+/+ liver sections numerous neutrophils and necrotic cellular debris were randomly distributed throughout hepatic parenchyma and occasionally formed abscesses. In contrast, E. coli-infected Mkp-1−/− livers exhibited marked midzonal hepatocellular swelling and clearing, suggesting considerable glycogen levels in these mice. Additionally, multifocal-random and marked necrosuppurative hepatitis was seen in the Mkp-1−/− liver sections. Hepatic abscesses in the Mkp-1−/− livers were predominantly comprised of numerous bacterial rods intermixed with cellular necrotic debris and neutrophils. Quantitation of hepatocyte ballooning using the Brunt liver steatosis scores system confirmed more lipid droplets in liver sections of uninfected Mkp-1+/+ mice that in those of uninfected Mkp-1−/− mice (Figure 2B). E. coli infection further enhanced hepatocyte lipidosis in Mkp-1+/+ mice but not in Mkp-1−/− mice. As expected, E. coli infection resulted in a prominent increase in inflammatory infiltrate score, which is further exacerbated in Mkp-1−/− mice (Figure 2C).

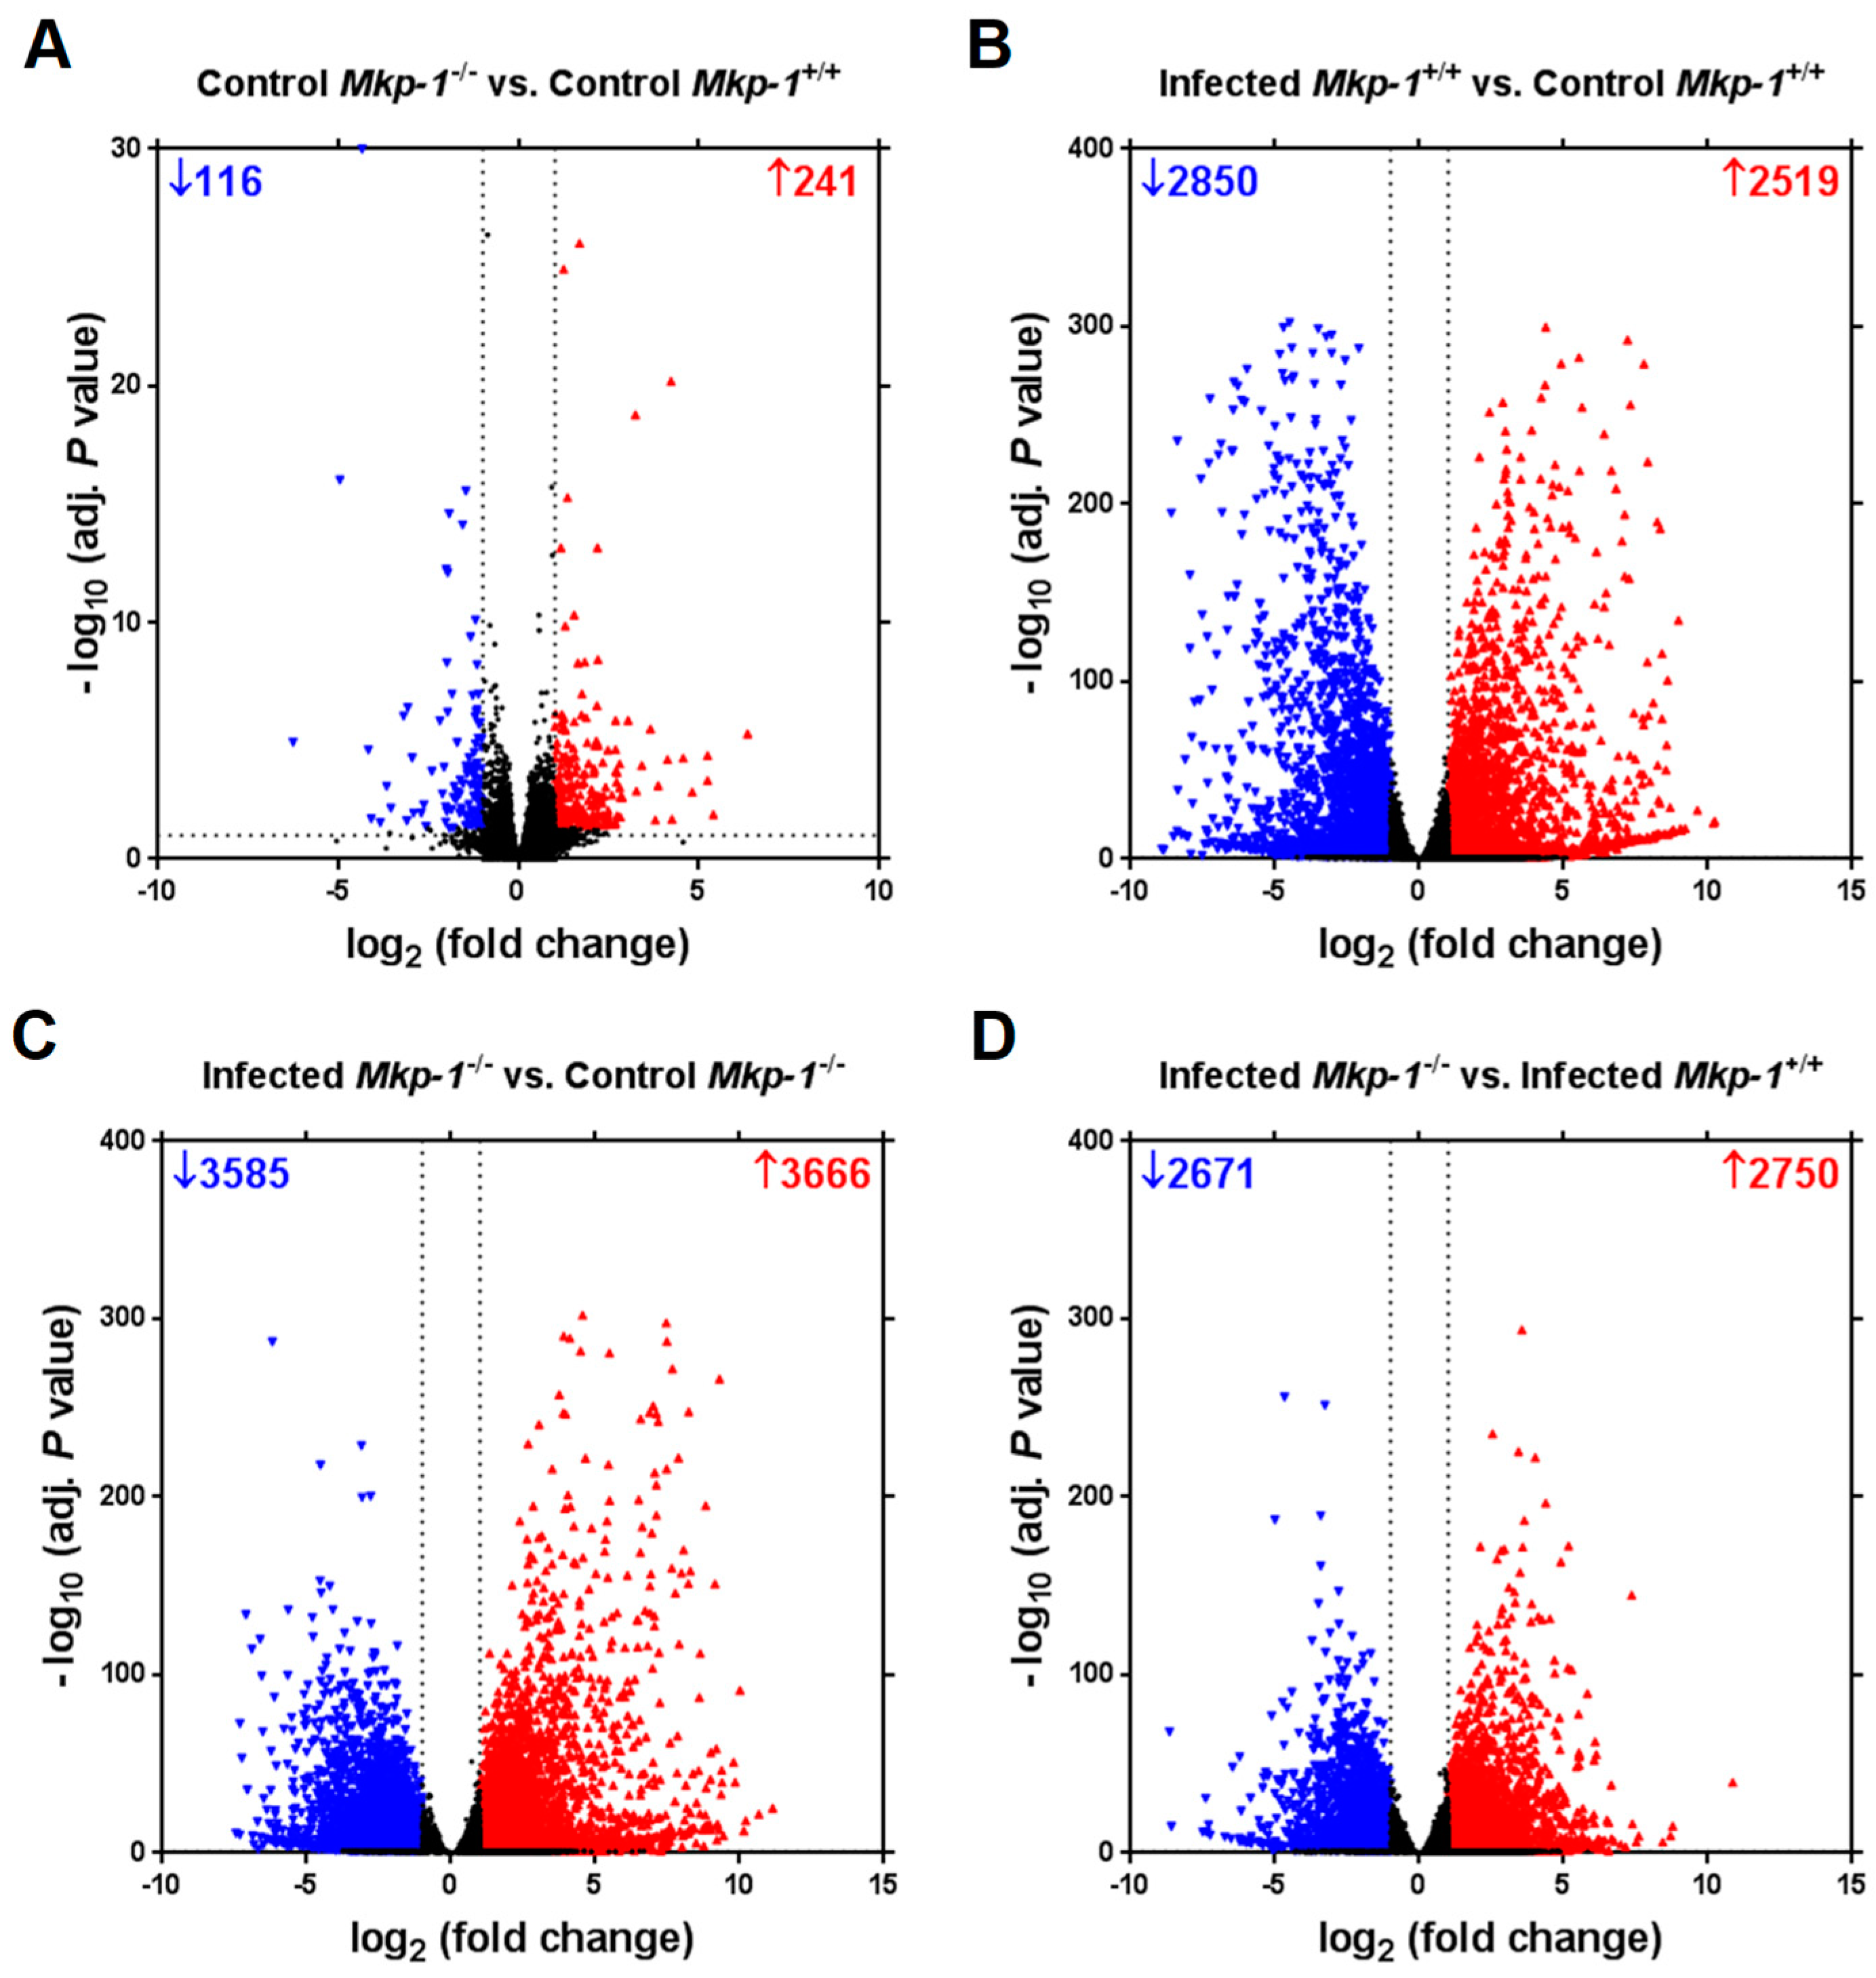
2.2. The Impact of Mkp-1 Deficiency and E. coli Infection on Global Liver Gene Expression Profile

To explore the mechanisms of lipid dysregulation caused by Mkp-1 deficiency and sepsis, RNA-seq was conducted using hepatic RNA extracts. Without E. coli infection, Mkp-1 deficiency increased the mRNA expression of 241 genes and decreased the mRNA expression of 116 genes (Figure 3A). In Mkp-1+/+ mice, E. coli infection enhanced the expression of 2519 genes and lowered the expression of 2850 genes (Figure 3B). In contrast, E. coli infection caused the upregulation of 3666 genes and downregulation of 3585 genes in Mkp-1−/− mice (Figure 3C). Impressively, compared to E. coli-infected wildtype mice, 2750 genes were upregulated and 2671 genes were downregulated in E. coli-infected Mkp-1−/− mice, suggesting profound exacerbation of the host transcriptional responses in the livers of Mkp-1−/− mice (Figure 3D).
We also categorized the differentially expressed genes in the liver, by Panther pathway analysis. In the absence of infection, genes of several pathways were differentially expressed in the livers of Mkp-1−/− mice relative to those of wildtype mice, including the integrin signaling pathway, the p53 pathway, and the p38 pathway (Figure 4A). Consistent with the idea that E. coli infection elicits a landscape change in inflammatory gene expression, upon E. coli infection genes in the Toll-like receptor (TLR) pathway and inflammatory cytokine and chemokine pathways were substantially altered in the wildtype mice (Figure 4B). In the Mkp-1 knockout mice the inflammatory response, indicated by alteration in the chemokine and cytokine signaling pathways, TLR pathways, as well as interleukin signaling pathways, were dramatically enhanced after E. coli infection (Figure 4C). Moreover, blood coagulation, cholesterol biosynthesis, and inflammatory cytokine and chemokine pathways were more robustly altered by Mkp-1 deficiency in the E. coli-infected mice (Figure 4D). Interestingly, the cholesterol biosynthesis as well as blood coagulation genes were significantly altered upon Mkp-1 deletion in the E. coli-infected mice.
We also analyzed the RNA-seq data using DESeq2 algorithm to identify the pathways differentially affected in Mkp-1+/+ and Mkp-1−/− mice after E. coli infection (Figure 5A). Among the pathways that were preferentially affected by E. coli infection in the two strain of mice were various metabolic processes, including retinol metabolism, steroid synthesis, and carbon metabolism (Figure 5B), suggesting an important function of Mkp-1 in broad metabolic functions.

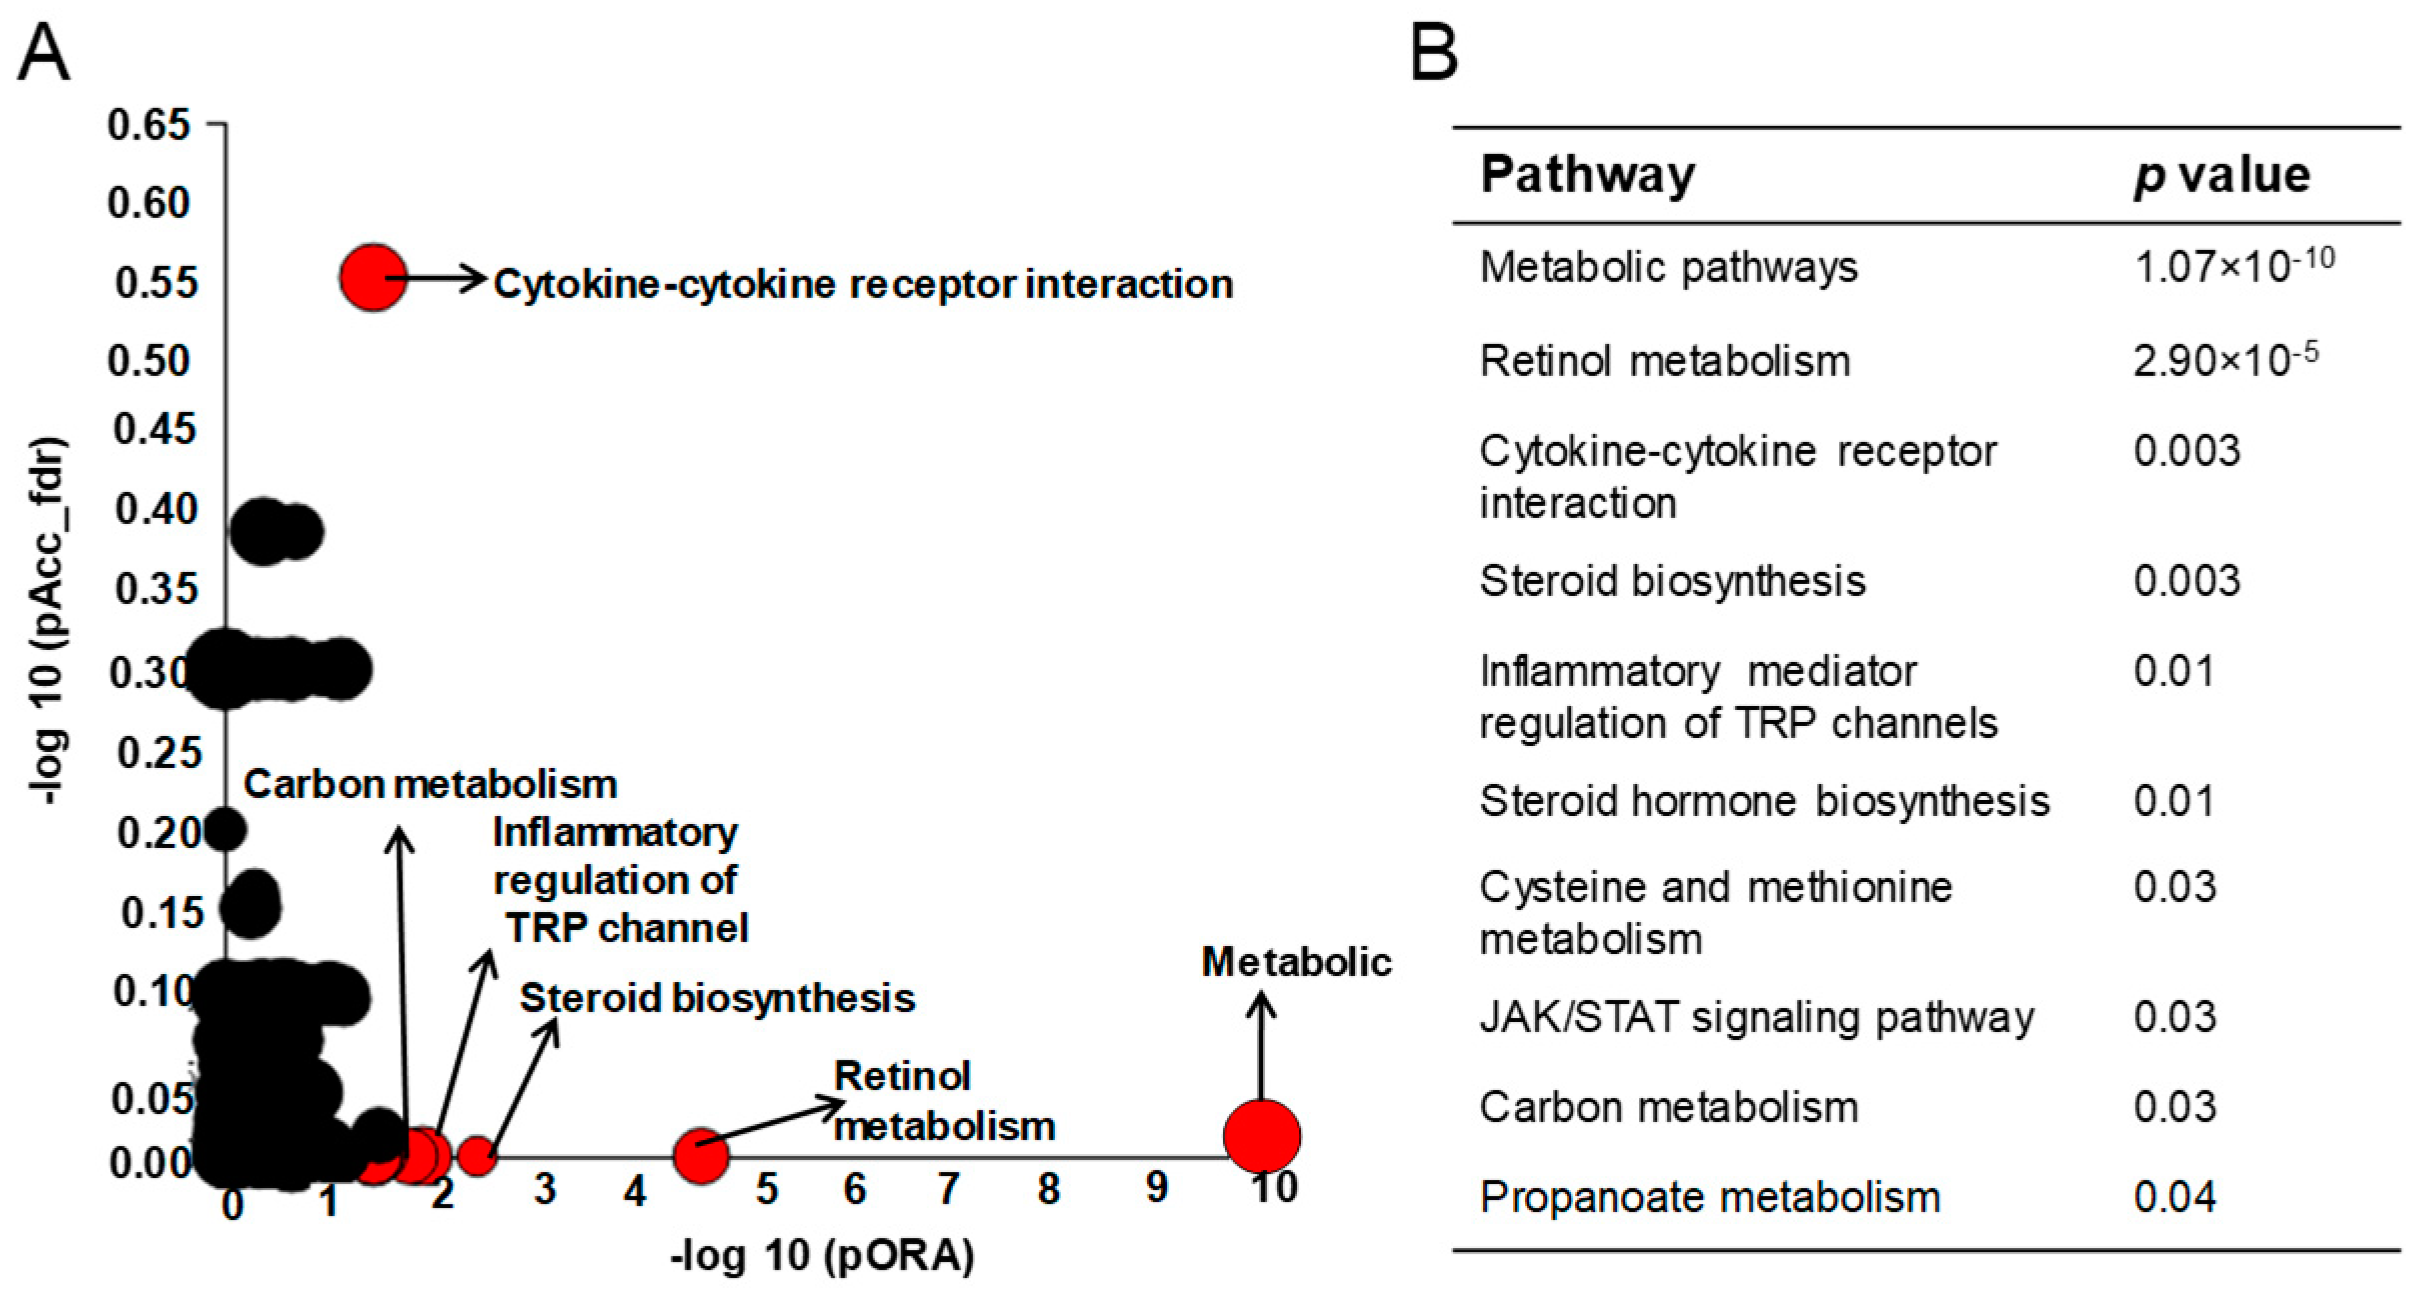
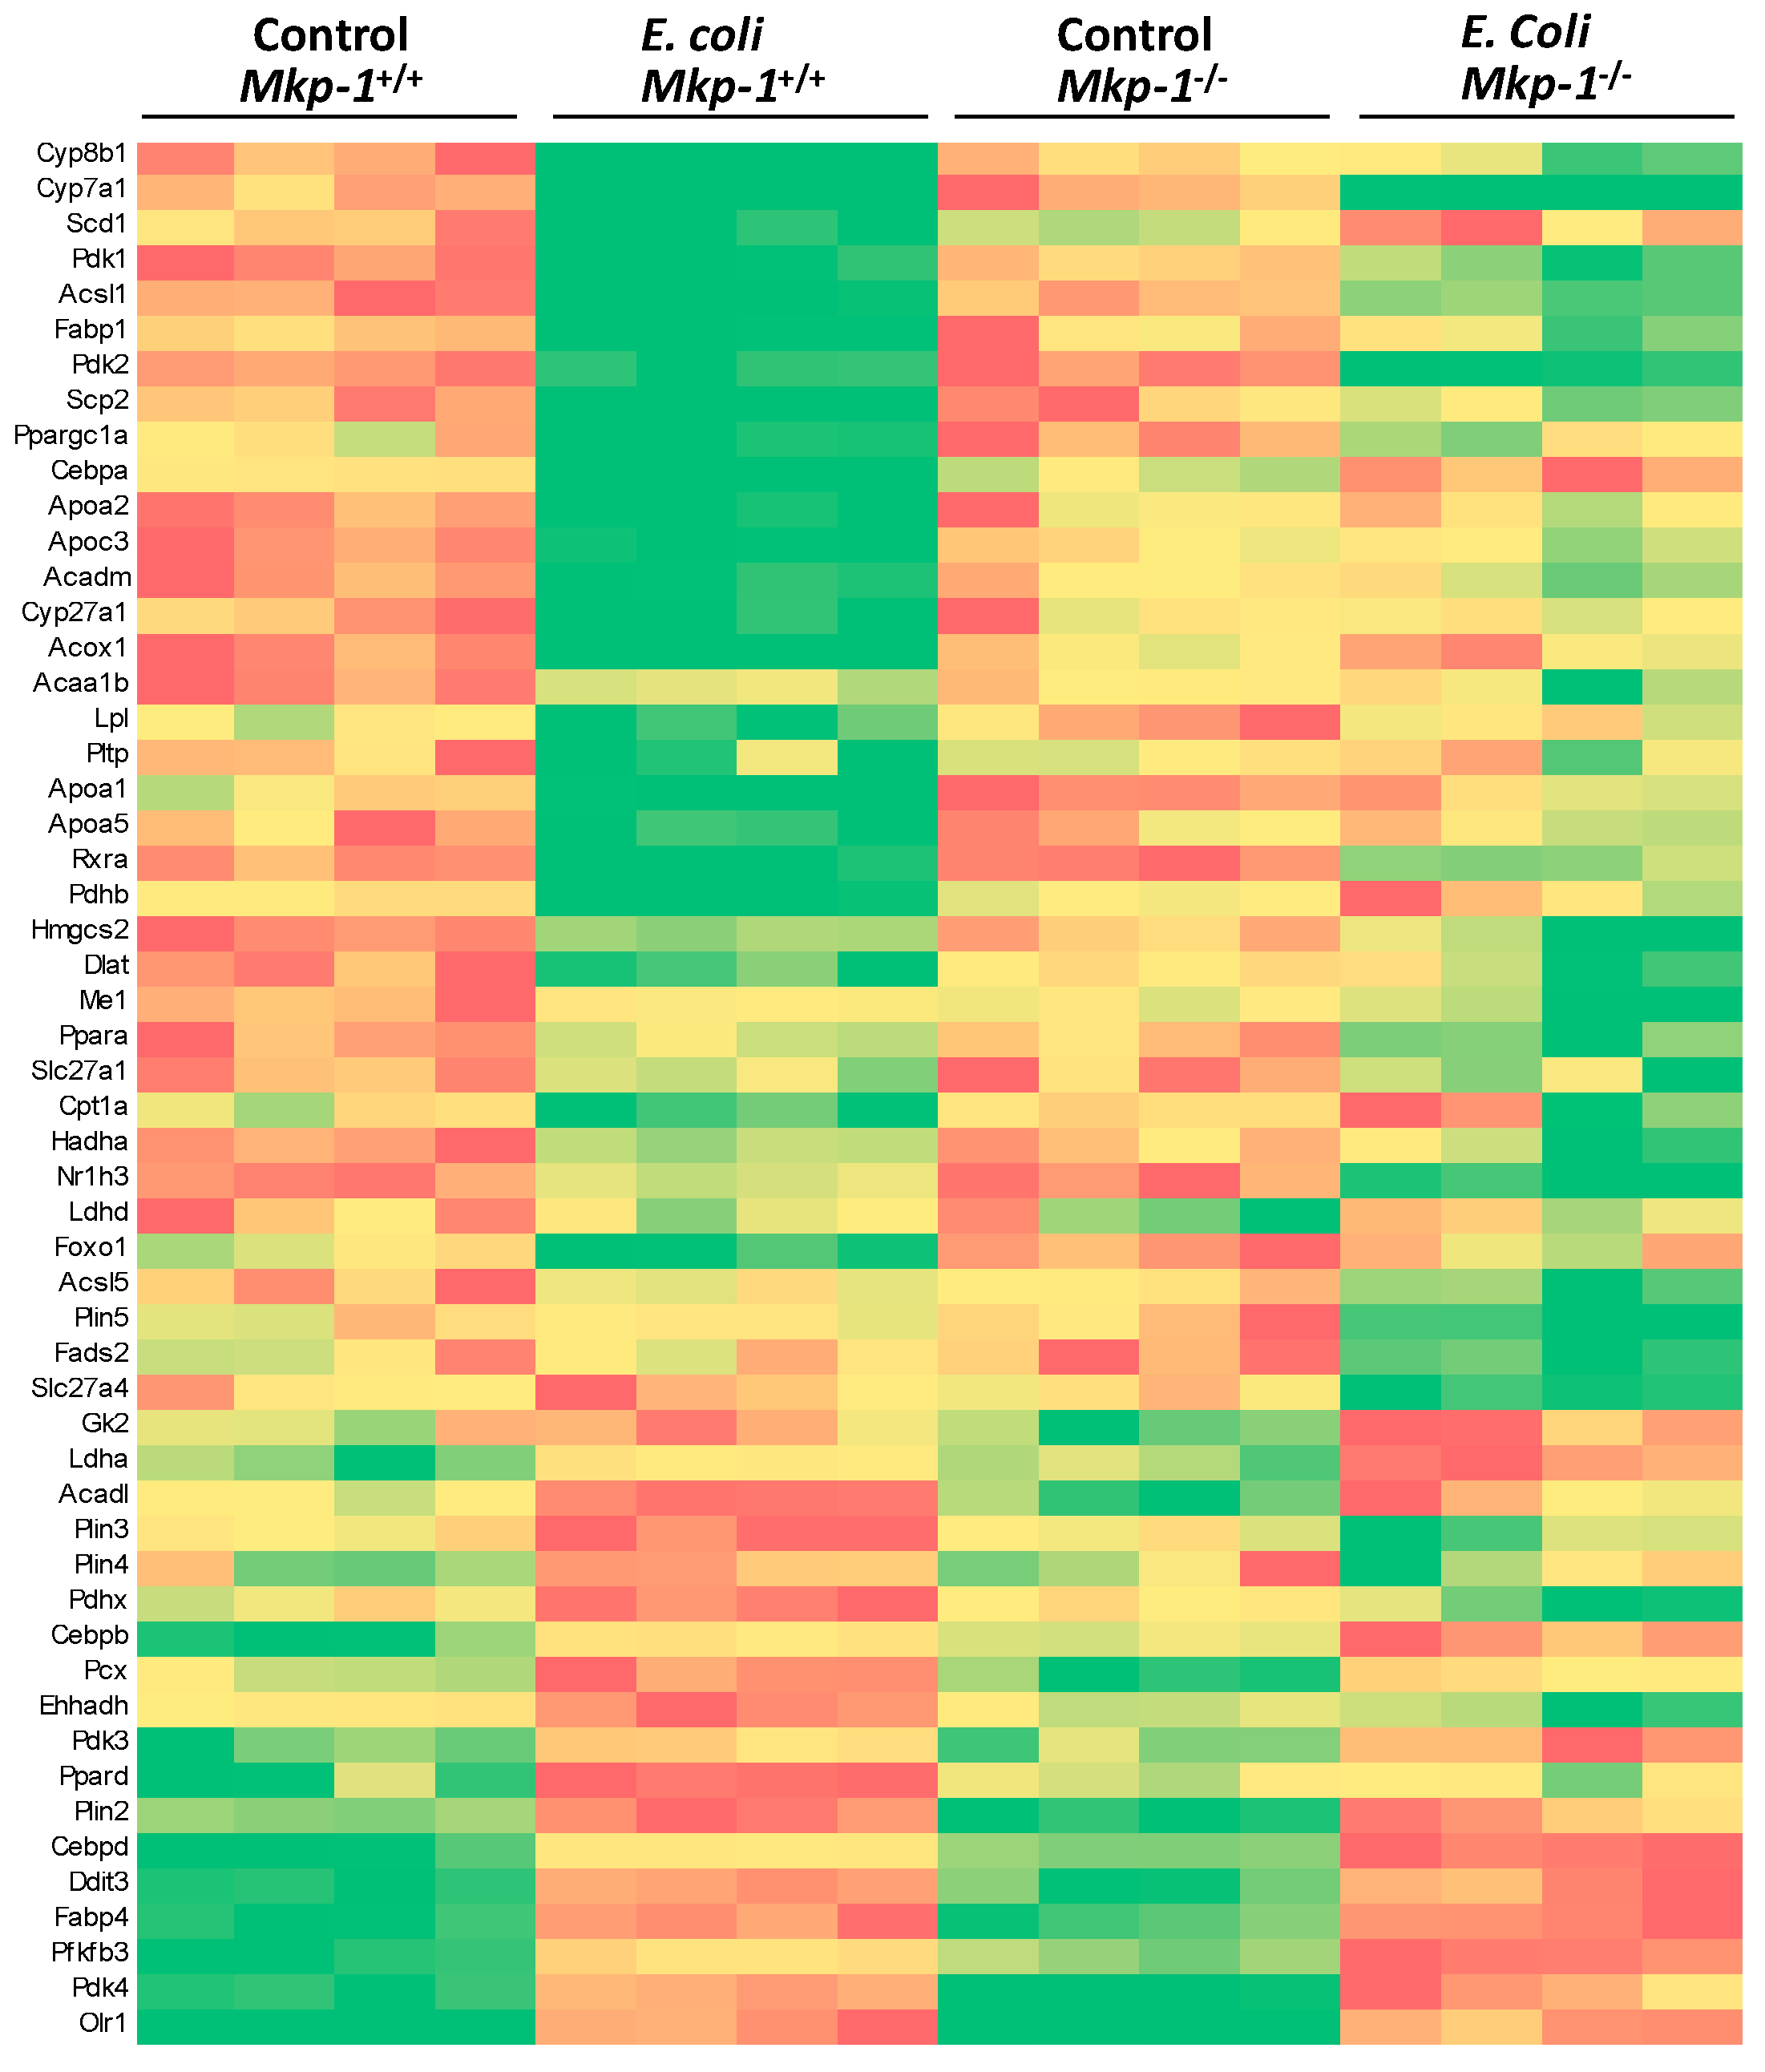
2.3. E. coli Infection Caused a Major Shift in Gene Expression of the Fatty Acid and Glucose Metabolic Programs and Mkp-1 Deficiency Disrupts This Shift

Because of the striking differences in the triglyceride contents between Mkp-1+/+ and Mkp-1−/− mice, particularly after E. coli infection, we focused on the proteins involved in triglyceride and fatty acid metabolisms. We found that fatty acid metabolism and hepatic glycolysis/gluconeogenesis pathways were profoundly altered by both Mkp-1 deficiency and E. coli infection (Figure 6). The heat map presented in Figure 6 depicts the expression levels of carbohydrate metabolism genes significantly altered by E. coli infection and/or Mkp-1 knockout. A number of genes involved in fatty acid transport, such as fatty acid-binding protein 1 (Fabp1) and four apolipoproteins (Apoa1, 2, 5 and Apoc3), were downregulated by E. coli infection in Mkp-1+/+ mice. Additionally, E. coli infection also attenuated the expression of genes involved in fatty acid synthesis and utilization, such as stearoyl-CoA desaturase 1 (Scd1), long chain fatty acid-CoA ligase 1 (Acsl1), acyl-CoA thioesterase (Acot) 1 and 4, peroxisome proliferator-activated receptor (PPAR) γ coactivator 1-α and β (Ppargc1a and b), Forkhead box protein O1 (Foxo1), acetyl-CoA acyltransferase 1 (Acaa1b), and CCAAT/enhancer-binding protein (Cebp) α (Cebpa) in Mkp-1+/+ mice. Furthermore, a number of perilipin (Plin) genes, including Plin 2, 3, and 4 were upregulated in Mkp-1+/+ mice. Interestingly, many genes involved in glycolysis were upregulated by E. coli infection in both Mkp-1+/+ and Mkp-1−/− mice, including pyruvate dehydrogenase kinase (Pdk) 3/4, and 6-phosphofructo-2-kinase/fructose-2,6-biphosphatase 3 (Pfkfb3). Most importantly, E. coli infection-induced changes of the majority of these genes were markedly altered by Mkp-1 deficiency. The profound changes in the transcriptome of the lipid and carbohydrate metabolic pathways suggest that a major shift in carbon/energy metabolism occurred in wildtype mice upon E. coli infection and that the Mkp-1 protein is required for this metabolic shift.

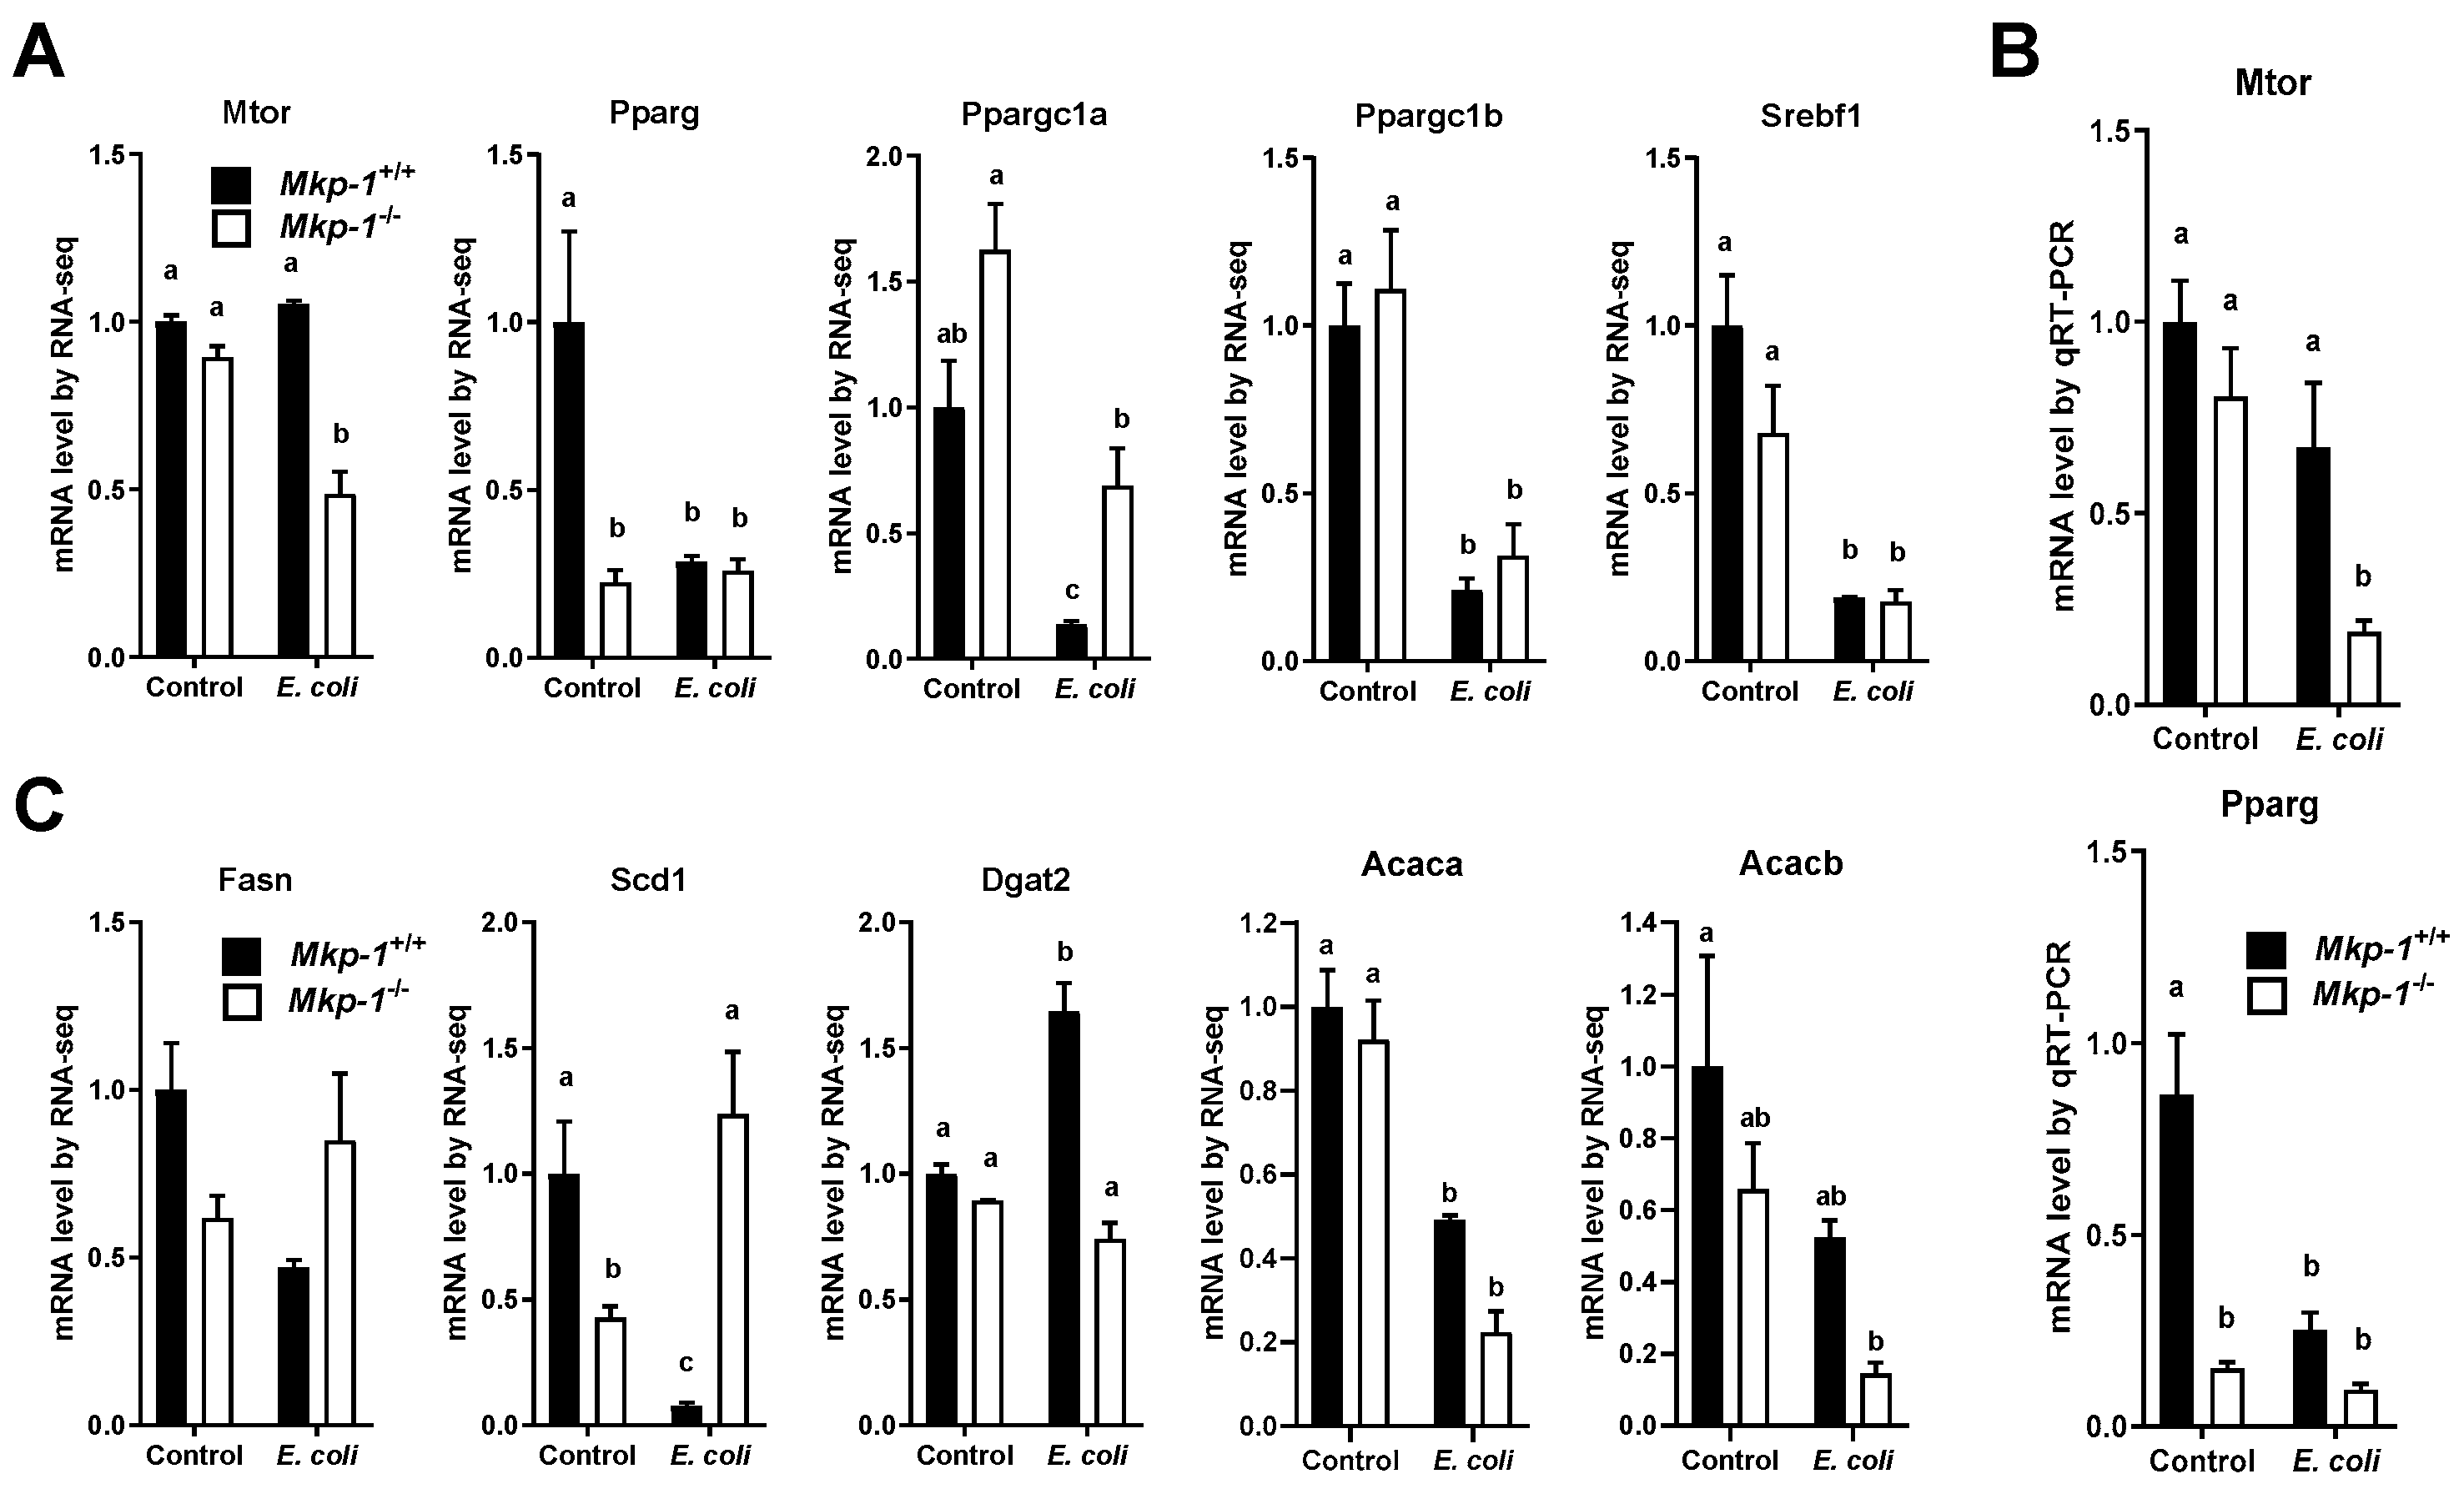
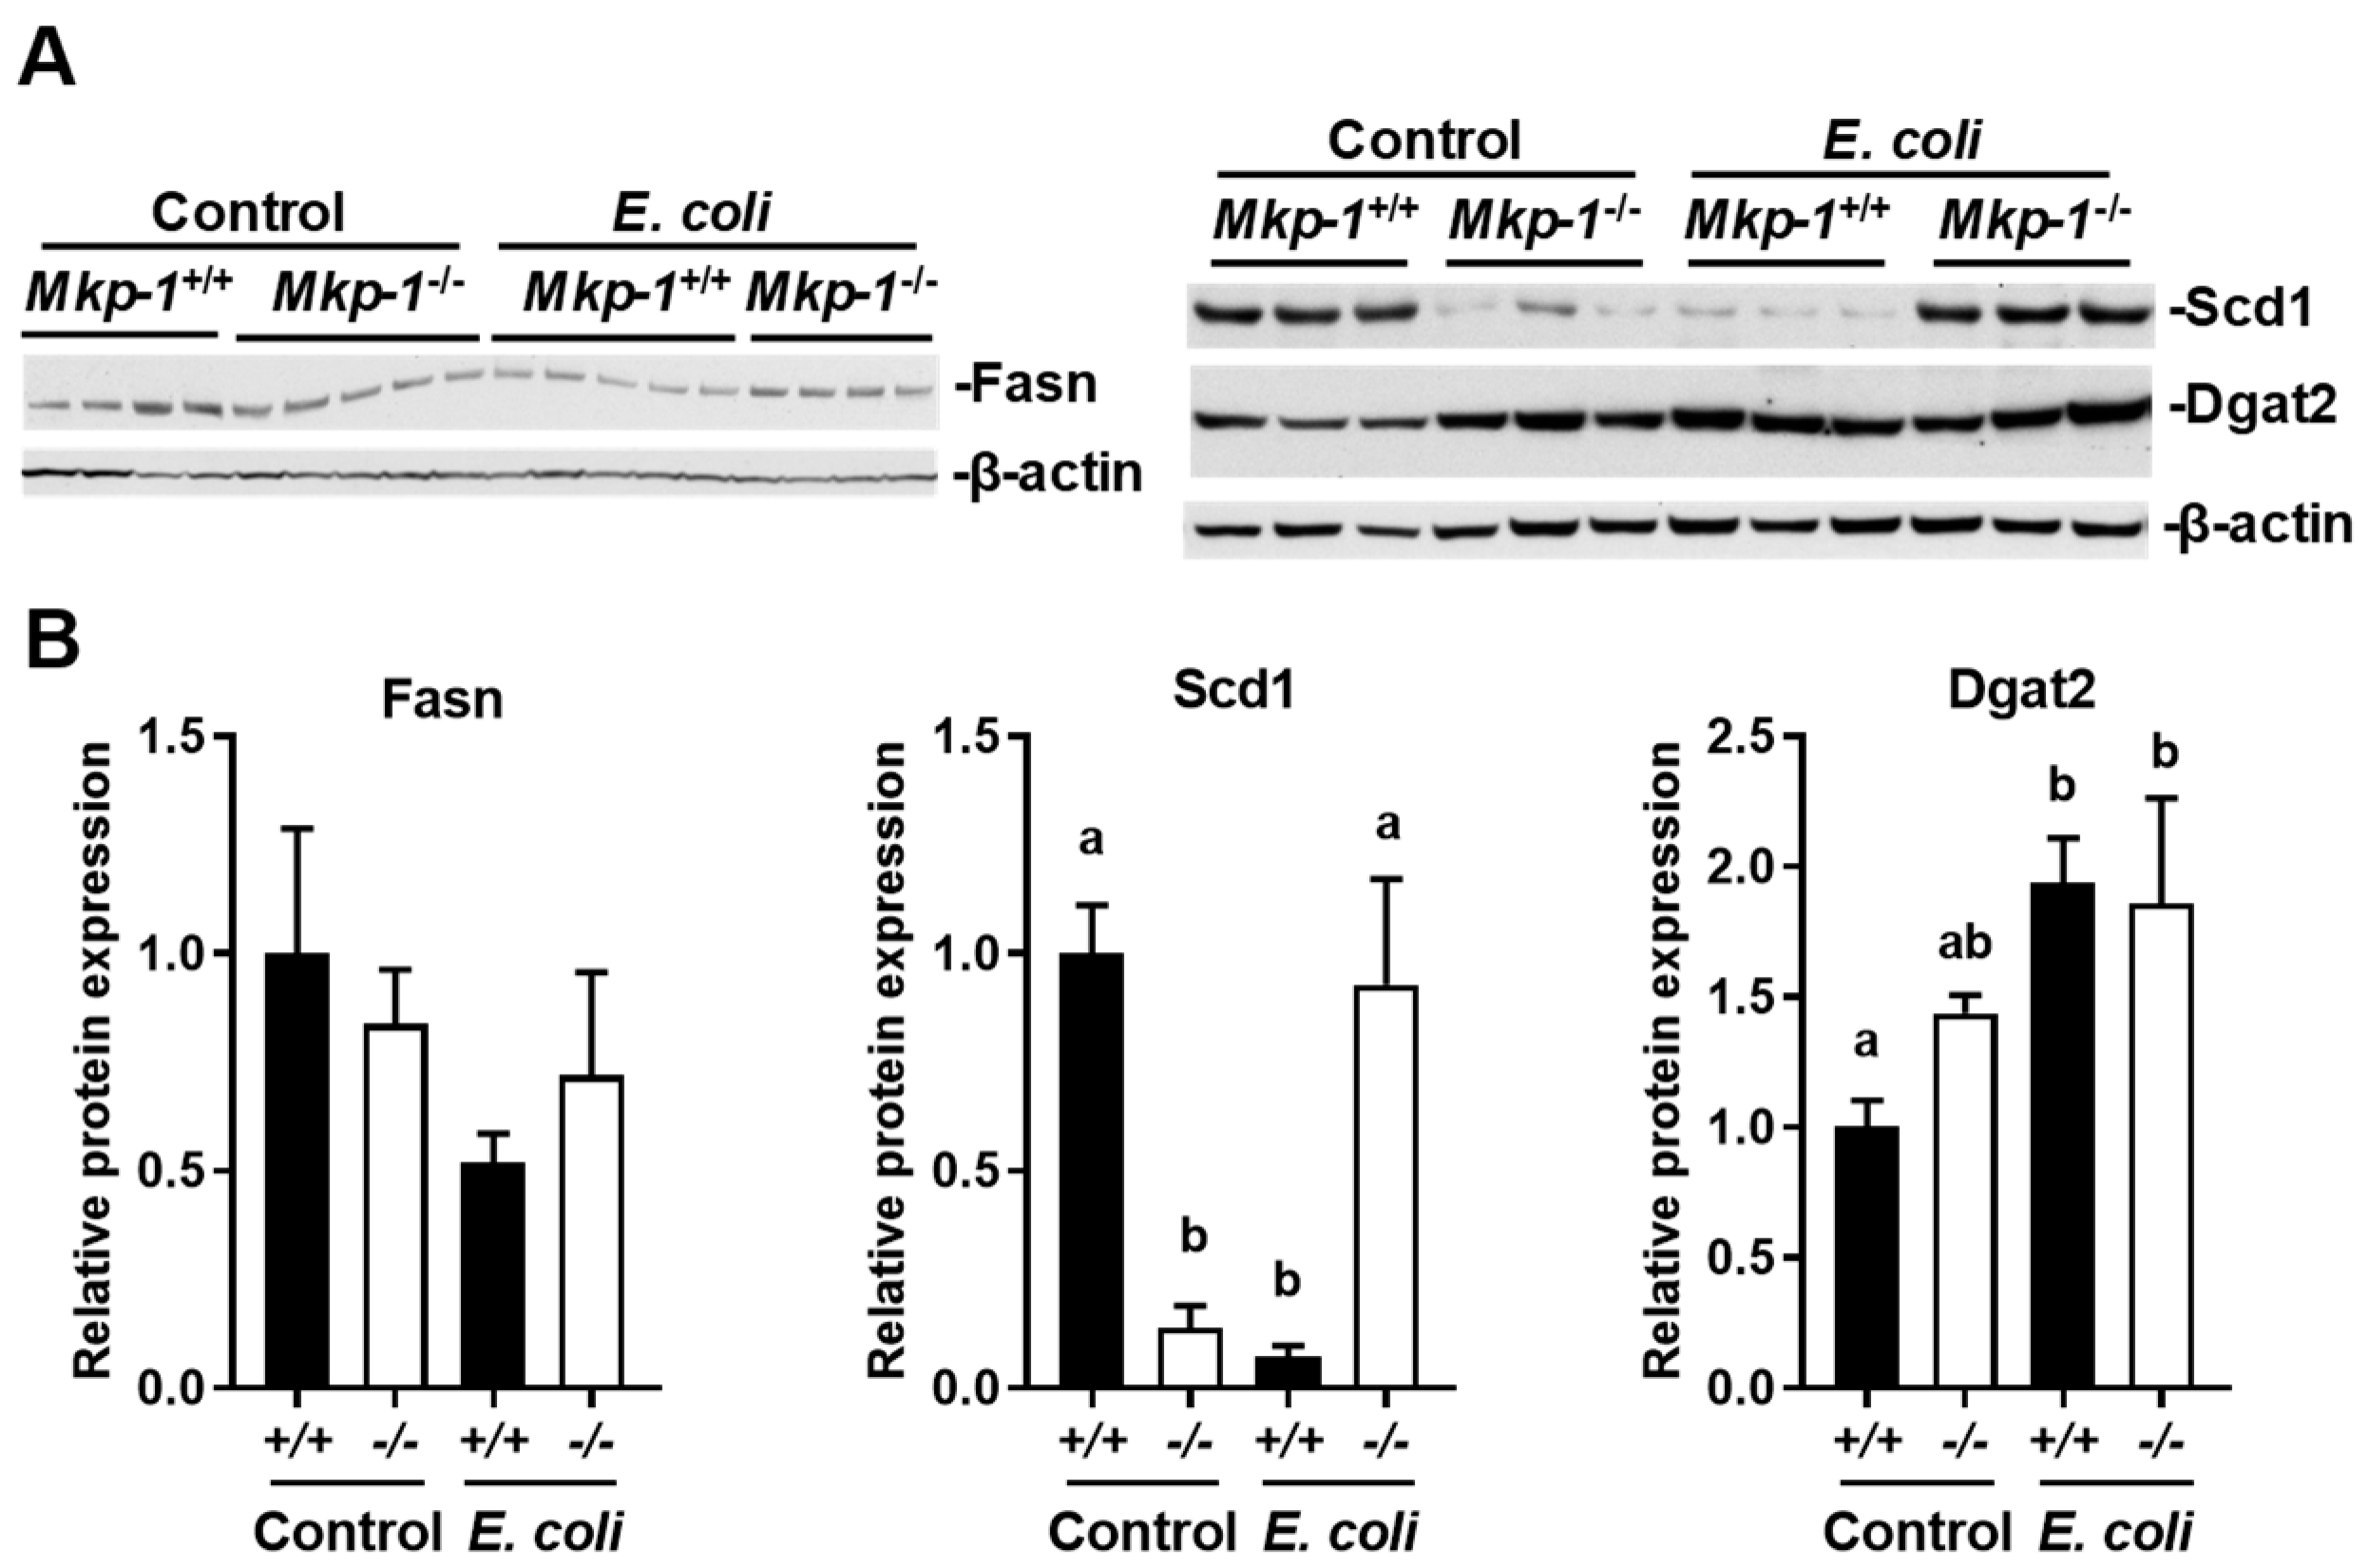
2.4. E. coli Infection Lowers the Expression of Mammalian Target of Rapamycin (mTOR) and Lipogenic Genes

The hepatic mTOR/Akt signaling promotes hepatic lipid biosynthesis by activating SREBP-1 and increasing PPARγ expression [35]. RNA-seq data demonstrated that infected Mkp-1−/− mice had downregulated mTOR (designated as Mtor for mouse) expression relative to infected Mkp-1+/+ mice, although the expression levels in uninfected mice were similar in Mkp-1+/+ and Mkp-1−/− mice (Figure 7A). The expression of Pparg (the murine ortholog of PPARγ) was lower in uninfected Mkp-1−/− mice than in uninfected Mkp-1+/+ mice, although E. coli infection resulted in a decrease in Pparg expression in both groups. The expression of three other lipogenic regulators, Ppargc1a (murine ortholog of PPARγ coactivator (PGC)-1α)), Ppargc1b (murine ortholog of PGC-1β), and Srebf1 (murine ortholog of SREBP-1), were similar between Mkp-1+/+ and Mkp-1−/− mice. E. coli infection resulted in a decrease in their expression in both Mkp-1+/+ and Mkp-1−/− groups. The differences observed by RNA-seq for both Mtor and Pparg expression were confirmed by quantitative reverse transcription PCR (qRT-PCR) (Figure 7B). Additionally, RNA-seq also identifies some differences in the expression of five lipogenic genes, Fasn, Scd1, acetyl-CoA carboxylase α (designated as Acaca for the murine ortholog), acetyl-CoA carboxylase β (designated as Acacb for the murine orthoolog), and diglyceride acyltransferase 2 (Dgat2) (Figure 7C). In Mkp-1+/+ mice, E. coli infection downregulated the expression of Fasn and Scd1 (Figure 7C), but modestly increased the mRNA expression of Dgat2, an enzyme responsible for synthesis of triglyceride from fatty acid and glycerol [36,37]. In contrast, Scd1 expression was enhanced in Mkp-1−/− mice following E. coli infection. Acetyl-CoA carboxylase, particularly Acaca, catalyzes the carboxylation of acetyl-CoA to malonyl-CoA, the rate-limiting step in fatty acid synthesis. Although the levels of liver Acaca mRNA in Mkp-1+/+ and Mkp-1−/− mice were similar, E. coli infection led to a decrease in liver Acaca mRNA expression in both groups (Figure 7C). Unlike Acaca which primarily regulates fatty acid synthesis, Acacb plays an important role in fatty acid oxidation. The expression levels of Acacb mRNA did not substantially differ except between un-infected Mkp-1+/+ and E. coli-infected Mkp-1−/− mice (Figure 7C).
To assess the levels of the lipogenic proteins in the livers, Western blot analyses were performed using liver homogenates (Figure 8). Fasn protein levels in E. coli-infected Mkp-1+/+ mice appeared lower although the difference was not statistically significant (Figure 8). Scd protein levels mirrored the differences in Scd1 mRNA levels. In the absence of E. coli infection, Scd1 protein levels were substantially lower in Mkp-1−/− mice than in Mkp-1+/+ mice. While liver Scd1 protein levels dramatically plummeted in Mkp-1+/+ mice following E. coli infection, liver Scd1 protein levels were significantly increased in Mkp-1−/− mice. Dgat2 protein levels were significantly increased in Mkp-1+/+ mice following E. coli infection, but did not significantly change in Mkp-1−/− mice.

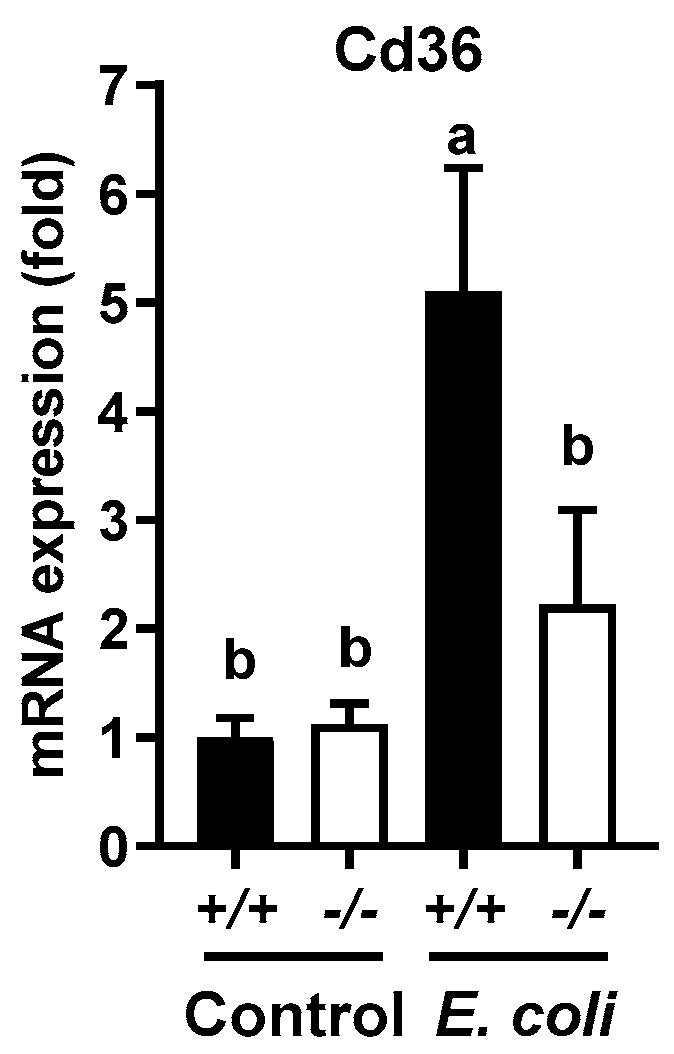
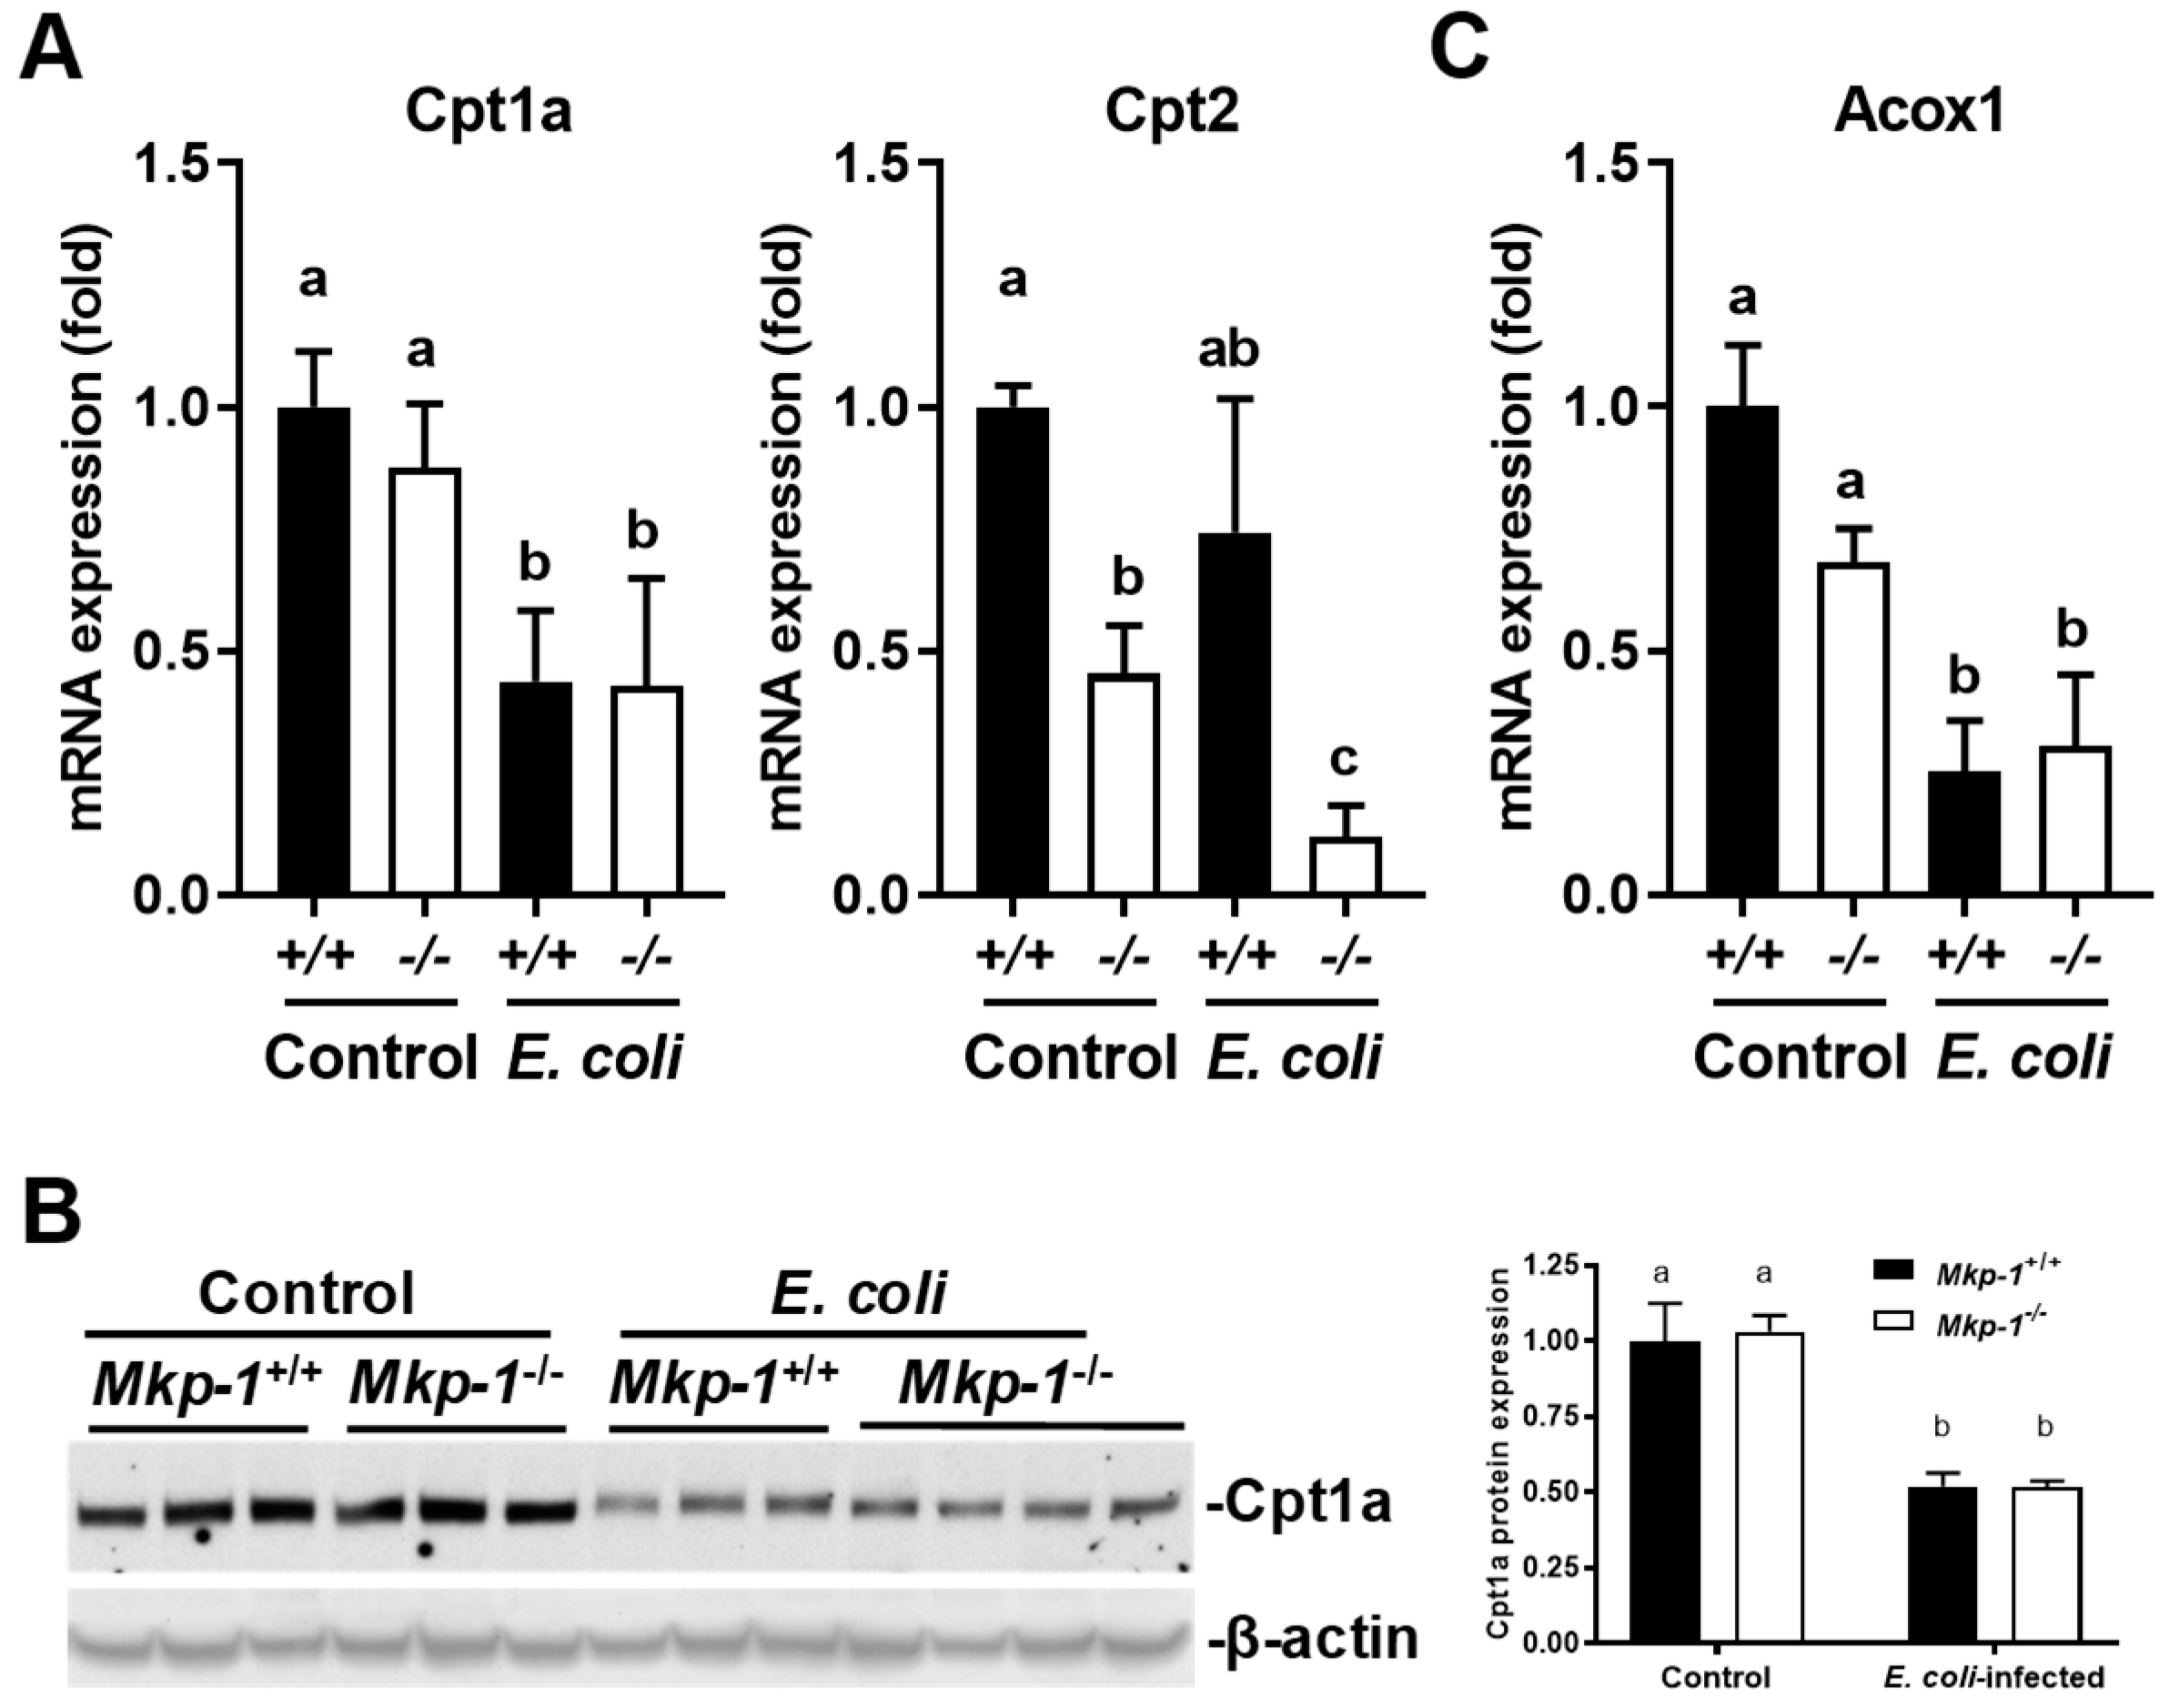
2.5. E. coli Infection Increased the Expression of Genes Involved in Liver Fatty Acid Uptake, and Lowered the Expression of Genes Involved in Mitochondrial and Peroxisomal Fatty Acid Oxidation

Fatty acid uptake is an important mechanism for lipid accumulation in the liver. In response to the decline of blood glucose level, fat tissues release fatty acids through lipolysis. Cluster of differentiation 36 (Cd36) plays an important role in fatty acid uptake from the blood stream for lipogenesis in the liver [38]. To understand the mechanism underlying the differential effects of E. coli infection on liver and blood triglyceride contents of Mkp-1+/+ and Mkp-1−/− mice, we measured Cd36 levels by qRT-PCR (Figure 9). Liver Cd36 mRNA levels were similar between control Mkp-1+/+ and Mkp-1−/− mice, and E. coli infection caused a significant increase in Cd36 mRNA levels in Mkp-1+/+ mice but had little effect on Cd36 mRNA levels in Mkp-1−/− mice.
We also assessed the expression of genes involved in fatty acid β-oxidation through qRT-PCR (Figure 10A). Carnitine palmitoyltransferase I and II (Cpt1a and Cpt2) are essential enzymes for β-oxidation of long chain fatty acid in mitochondria [39,40], while acyl-CoA oxidase 1 (Acox1) mediates fatty acid β-oxidation in peroxisome [39,41]. Cpt1a mRNA expression was significantly decreased in both Mkp-1+/+ and Mkp-1−/− mice upon E. coli infection, although expression levels in control conditions were similar in the two genotypes of mice. Liver Cpt2 mRNA expression levels were lower in control Mkp-1−/− mice than in control Mkp-1+/+ mice. E. coli infection decreased Cpt2 mRNA levels in Mkp-1−/− mice but had little effect in Mkp-1+/+ mice. Acox1 mRNA levels were similar in Mkp-1+/+ and Mkp-1−/− mice, and were decreased in both genotypes upon E. coli infection. Cpt1a protein levels, detected by Western blotting, were similar in un-infected Mkp-1+/+ and Mkp-1−/− mice, and E. coli infection caused a significant decrease in both Mkp-1+/+ and Mkp-1−/− mice (Figure 10B). Taken together, these results suggest that fatty acid oxidation in the liver was decreased with E. coli infection while fatty acid uptake was increased in Mkp-1+/+ but not in Mkp-1−/− mice.

2.6. Effects of E. coli Infection and Mkp-1 Deficiency on the Expression of Phosphoenolpyruvate Carboxykinase 1 (Pck1) Protein

The cytosolic Pck1 protein, often referred to as phosphoenolpyruvate carboxykinase-cytosolic isoform (PEPCK-c), is an important regulator in gluconeogenesis [42,43,44]. Hepatic Pck1 facilitates gluconeogenesis by synthesizing phosphoenolpyruvate from oxaloacetate [45]. Previously, it has been shown that liver Pck1 expression is enhanced in Mkp-1−/− mice in control conditions [46]. Our RNA-seq analysis indicates that liver Pck1 mRNA levels were significantly increased in both Mkp-1+/+ and Mkp-1−/− mice following E. coli infection. Although the basal Pck1 mRNA levels in Mkp-1+/+ and Mkp-1−/− mice were similar (Figure 11A), liver Pck1 protein levels in control Mkp-1−/− mice were significantly higher than those in control Mkp-1+/+ mice (Figure 11B). E. coli infection further enhanced the expression of Pck1 protein in both Mkp-1+/+ and Mkp-1−/− mice (Figure 11B). The enhanced expression of Pck1 suggests that both Mkp-1 knockout and E. coli infection stimulate gluconeogenesis.

3. Discussion

We have previously shown that Mkp-1−/− mice exhibited significant increases in both inflammatory cytokine production and mortality after E. coli infection relative to Mkp-1+/+ mice [10]. Our earlier studies have also shown that E. coli infection triggers a dramatic increase in blood triglyceride levels in Mkp-1+/+ mice but not in Mkp-1−/− mice [10], suggesting profound alterations in lipid metabolism in the Mkp-1−/− mice following E. coli infection. To understand the role of Mkp-1 in the regulation of metabolism during sepsis, we analyzed the lipid contents and global gene expression profiles in the livers of Mkp-1+/+ and Mkp-1−/− mice either in control conditions or after E. coli infection. Here we report that E. coli infection increased liver lipid content in Mkp-1+/+ mice (Figure 1), indicating that hyperlipidemia after E. coli infection was not the result of depletion of hepatic lipid stores. The increase in liver lipid content in Mkp-1+/+ mice was supported by hepatocyte ballooning after E. coli infection (Figure 2). RNA-seq analysis of the liver tissues detected a profound difference in gene expression profiles between wildtype and Mkp-1−/− mice in the liver following E. coli infection (Figure 3). Remarkably, over 5000 genes (>20% of all murine genes) exhibited a >2-fold difference in expression levels between the two groups of mice after E. coli infection (Figure 3D), highlighting the critical role of Mkp-1 in the liver response to sepsis. Interestingly, E. coli infection caused profound changes in the expression of many genes involved in lipid metabolism, including fatty acid uptake, utilization, and synthesis in Mkp-1+/+ mice (Figure 6). However, in Mkp-1−/− mice the E. coli infection-induced changes in lipid metabolism-related genes were profoundly disrupted. In other words, unlike in the wildtype livers, in the absence of Mkp-1 the livers were unable to adjust their lipid metabolic program (Figure 6).

3.1. The Critical Role of Mkp-1 as a p38 Regulator in the Liver

Consistent with the notion that p38 is the preferred substrate of Mkp-1, we found that base line p38 activity was higher in uninfected Mkp-1−/− livers than in Mkp-1+/+ livers (Figure 1A). This indicates that Mkp-1 is critical in the control of p38 activity in the liver under normal conditions. Interestingly, in pre-clinical studies and clinical trials a common side effect of the p38 inhibitors is hepatotoxicity [47], suggesting that base line p38 activity is required for protection of the liver. Elevated base line p38 activity could be directly or indirectly implicated in the changes seen in the metabolic pathways and transcriptome. Remarkably, we found that liver p38 activity is dramatically decreased 24 h after E. coli infection in Mkp-1+/+ mice (Figure 1A), while it remained high in Mkp-1−/− mice. Considering that Mkp-1 is a gene highly inducible by extracellular stimuli [29,32,33,48,49], a systemic E. coli infection likely enhanced the expression of Mkp-1 in the liver of the Mkp-1+/+ leading to the de-phosphorylation of p38. In the absence of the Mkp-1 gene, it is not surprising that p38 remained high in the livers of the E. coli-infected Mkp-1−/− mice. Since p38 plays an important role in inflammatory responses [50], persistently high p38 activity in the livers of E. coli-infected Mkp-1−/− mice provides a plausible explanation for the differential expression of genes involved in inflammation (Figure 4 and Figure 5).

3.2. Mkp-1 and Hyperlipidemia of Sepsis

In a prior study we reported that E. coli infection caused a 13-fold increase in blood triglyceride levels in Mkp-1+/+ mice, but not the Mkp-1−/− mice [10]. This is consistent with the work of others reporting that bacterial endotoxin causes ‘lipemia of sepsis’ by increasing VLDL-mediated triglyceride release from hepatocytes [14], and by limiting lipoprotein lipase-mediated VLDL clearance in peripheral tissues [17,18,51]. Lipoproteins, such as triglyceride-rich VLDL, not only provide fuel to the host to fight against bacterial infection, but also sequester and neutralize endotoxin [14,52]. Therefore, hypertriglyceridemia during sepsis may be an adaptive host response to bacterial infections. Our studies indicate that E. coli infection induced increases in not only blood triglyceride [10] but also liver triglyceride content (Figure 1) in a Mkp-1-dependent manner, raised a strong possibility that the liver actually accelerates glyceride synthesis during sepsis. While it is unclear how the wildtype mice manage to increase blood triglyceride levels, while also increasing liver triglyceride contents, we can speculate. In our experimental setting we observed that Mkp-1+/+ mice usually stop feeding 2–3 h after E. coli infection, which is likely the result of an acute phase response and cytokine storm. Infected mice usually abstain from feeding in the first few days then then resume feeding as they recover. The septic mice were sacrificed at 24 h for the measurement of blood and liver lipid contents. Thus, the acute increase in triglyceride levels in blood and liver of E. coli-infected Mkp-1+/+ mice were unlikely due to increased consumption of food [53]. Instead, the increased blood triglyceride content is probably due to increased catabolism of adipose and muscle tissues, as TNF-α produced following E. coli infection has been shown to suppress lipogenesis and enhance lipolysis in these tissues [54,55]. We speculate that increased liver triglyceride following infection in the wildtype mice is more likely the result of enhanced hepatic lipogenesis from fatty acids and glycerol taken up from the blood rather than from fatty acids synthesized de novo from acetyl-CoA in the liver for the following reasons. First, a number of lipogenic genes involved in triglyceride synthesis from acetyl-CoA, including Pparg (murine ortholog of PPARγ), Ppargc1a/b (murine ortholog of PGC1α/β), Srebf1, Fasn, Scd1, and Acaca that catalyzes the rate-limiting step in fatty acid synthesis, were substantially downregulated (Figure 6 and Figure 7). Second, the expression of Dgat2, the liver enzyme responsible for triglyceride synthesis from fatty acids and glyceride [56], was increased in Mkp-1+/+ mice after E. coli infection (Figure 7C and Figure 8B). Finally, mRNA expression of Cd36, the liver protein mediating fatty acid uptake [38], is markedly upregulated in Mkp-1+/+ mice after E. coli infection. Fatty acids taken up from the blood can be converted in the liver to triglyceride by Dgat2 [56]. We think that the liver likely synthesizes triglyceride for consumption by other organs, because both the mitochondrial fatty acid β-oxidation-related Cpt1a protein [39,40]) and peroxisomal fatty acid β-oxidation protein Acox1 [39,41,57] are downregulated in Mkp-1+/+ mice after E. coli infection (Figure 10). It is worth noting that a recent study has shown that p38 inhibition enhanced parenteral nutrition-induced hepatic steatosis and attenuated the expression of Cpt1a, Acox1, and Ppargc1a in a rat model [58]. The dramatic decrease in p38 activity in E. coli-infected Mkp-1+/+ livers is consistent with the decreased expression of the Cpt1a, Acox1, and Ppargc1a as well as the increased triglyceride content in E. coli-infected Mkp-1+/+ mice.
Several factors can explain why Mkp-1−/− mice failed to develop hyperlipidemia after E. coli infection like the Mkp-1+/+ mice did. First, it has been shown that Mkp-1−/− mice on chow diet have lower adipose mass and higher metabolic activity with enhanced glucogenic activity under normal conditions [34]. Because Mkp-1−/− mice had lower fat mass, E. coli infection might not be able to trigger the release of fatty acids and glycerol from adipose tissue into the circulation. It is also possible that exacerbated production of large quantities of pro- and anti-inflammatory cytokines in Mkp-1−/− mice disrupted the normal triglyceride mobilization program in the adipose tissues. Alternatively, in the absence of Mkp-1, the livers might not be able to esterify the fatty acids released by adipose tissues into VLDL triglycerides in the liver. However, considering the normal Dgat2 protein levels in the livers of E. coli-infected Mkp-1−/− mice (Figure 8), we think this is unlikely.
Previously, it has been shown that liver-specific Mkp-1 deletion enhances gluconeogenesis [34,46,59,60]. Furthermore, it has been found that Mkp-1−/− livers exhibit decreased Pparg and Srebf1 expression and increased Ppargc1a and Pck1 expression [46,60]. Our analyses, for the most part, corroborated their findings (Figure 6), although in our hands the difference in the liver expression of Ppargc1a and Srebf1 expression between Mkp-1+/+ and Mkp-1−/− mice was not significant. Consistent with the elevated Pck1 expression in liver-specific Mkp-1 knockout mice [46], we also found that liver Pck1 protein expression was significantly higher in the un-infected Mkp-1−/− mice than in un-infected Mkp-1+/+ mice (Figure 11). The dramatically enhanced Pck1 expression suggests that in the absence of Mkp-1 animals adapt a more active ‘wasting’ program to meet their metabolic needs, partially explaining how Mkp-1−/− mice utilize less glycogen following E. coli infection [10].
While our analyses shed insight into the mechanisms by which Mkp-1 facilitates hyperlipidemia during sepsis through a transcriptome lens, there are some limitations that need to be considered. RNA-seq performed here only gives a snap-shot of the transcriptome 24 h post-infection and prior to infection, the transitional transcriptome might be equally important in understanding the role of Mkp-1 in lipid metabolism during sepsis. Additionally, there were some disparities between RNA-seq data set, the qRT-PCR data, and/or Western blotting results. Despite these limitations, our analyses provide novel information on the function of Mkp-1 in the orchestration of lipid metabolic changes to facilitate immune defense. Our results clearly indicate that Mkp-1 plays an important role in the regulation of both the inflammatory response and metabolic programming during host defense against bacterial infection.

4. Materials and Methods

4.1. Experimental Animals and E. coli Infection

The present study was approved by the Institutional Animal Care and Use Committee of the Research Institute at Nationwide Children’s Hospital (01505AR, 9 January 2017). Mkp-1−/− mice and the Mkp-1+/+ controls on a C57/129 mixed background [61] were kindly provided by Bristol-Myers Squibb Pharmaceutical Research Institute. In the absence of challenge, Mkp-1−/− mice exhibit no sign of abnormality or growth retardation. All mice were housed with a 12 h alternating light-dark cycle at room temperature, and had free access to standard chow diet and water throughout the study. Mkp-1−/− and Mkp-1+/+ mice were infected with or without E. coli as previously described [10]. Briefly, E. coli (O55:B5, ATCC 12014), purchased from American Type Culture Collection (Manassas, VA, USA), was grown in Luria broth at 37 °C for 18 h. The bacteria were pelleted by centrifugation, washed three times with phosphate-buffered saline (PBS), and finally suspended in PBS. E. coli was injected to the tail veins of mice at 2.5 × 10⁷ CFU/g body weight. Infected mice were euthanized 24 h later by pentobarbital over dose. Blood was collected through cardiac puncture, and coagulated blood was centrifuged to obtain serum. The liver of each mouse was excised with a small piece preserved in formalin for histological assessment and the rest of the liver snap-frozen in liquid nitrogen prior to storage at −80 °C.

4.2. Biochemical Assessment of Liver Lipid

Hepatic total lipid was extracted and determined gravimetrically as described [62]. Extracted liver lipid was solubilized to determine triglyceride and cholesterol spectrophotometrically using a triglyceride or cholesterol measuring kit (Pointe Scientific, Canton, MI, USA), according to the manufacturer’s instructions.

4.3. Histological Assessment of Liver Lipid Content

Hematoxylin and eosin (H&E) staining was conducted on paraffin-embedded liver sections (5 μm). The slides were evaluated blindly by a veterinary pathologist for histologically abnormalities. Images of ten randomly selected fields were captured (400× magnification) to assess liver lipid content using the established Brunt scoring system for assessing liver steatosis [63]. In brief, the liver lipid levels were scored as: grade 0 for <5% hepatocytes without lipid droplets; grade 1 for 5–33% of hepatocytes containing visible lipid droplets; grade 2 for fatty hepatocytes occupying 33–66% of the hepatic parenchyma; or grade 3 for >66% hepatocytes containing lipid droplets.

4.4. Liver RNA Extraction

Total RNA was extracted from frozen liver tissues using Trizol reagent (Thermo Fisher Scientific, Waltham, MA, USA), solubilized in UltraPure RNase/DNase-free water (Thermo Fisher Scientific), and quantified by using NanoDrop ND-1000 spectrophotometer (Marshall Scientific, Hampton, NH, USA).

4.5. RNA-Seq

For RNA-seq analyses, 1 µg total RNA was used as starting material. First, cytoplasmic and mitochondrial ribosomal RNAs were depleted using a NEBNext rRNA Depletion Kit (New England Biolabs, Ipswich, MA, USA), according to the manufacture’s recommendations. The samples were then digested with DNase I to remove contaminated genomic DNA, and purified using NEBNext RNA Sample Purification Beads (New England Biolabs). The RNA library was prepared using a NEBNext Ultra Directional RNA Library Prep Kit for Illumina (New England Biolabs). Briefly, RNA was fragmented, and then cDNAs were synthesized using random primers. The resulting double-strand cDNA was then subject to end-repair, adapter ligation, and PCR amplification to generate the library. The indexed RNA-seq libraries were quantitated by quantitative PCR, pooled with equimolar amounts and sequenced on an illumina HiSeq 3000 sequencer using a 2 × 125 cycle run, as previously described [64,65].
Following computational de-multiplexing, single end reads (50 bp) in the FASTQ format were generated. Quality control and adapter trimming were accomplished using the FastQC (version 0.11.3) and Trim Galore (version 0.4.0) software packages. Trimmed reads were mapped to the Genome Reference Consortium GRCm38 (mm10) murine genome assembly using TopHat2 (version 2.1.0), and feature counts were generated using HTSeq (version 0.6.1). Statistical analysis for differential expression was performed using the DESeq2 package (version 1.16.1) in R, with the default Benjamini-Hochberg p value adjustment method. Statistically significant differential expression thresholds included an adjusted p value <0.05 and an absolute value linear fold change of 2 or greater. Overrepresentation analysis for select gene sets comprising five or more members was determined using hypergeometric statistical testing (hyper function in R Documentation). Additionally, significantly impacted pathways were analyzed using Advaita Bio’s iPathwayGuide (https://www.advaitabio.com/ipathwayguide).

4.6. qRT-PCR

To confirm the result of RNA-seq, qRT-PCR was performed as previously described [62] with minor modifications. Briefly, genomic DNA was removed by digesting the total RNA with RQ1 RNase-Free DNase (Promega, Madison, WI, USA). Liver RNA was then reverse transcribed on PTC-200 DNA Engine Cycler (Bio-Rad, Hercule, CA, USA) with High-Capacity cDNA Reverse Transcription Kit (Applied Biosystems, Foster City, CA, USA). qRT-PCR was performed using PowerUp SYBR Green PCR Master Mix (Applied Biosystems) on a Realplex2 Mastercycler (Eppendorf, Hauppauge, NY, USA). All primers were synthesized by Integrated DNA Technologies (Coralville, IA, USA). Table 1 listed the primer sequences for the mRNAs of the following proteins, including proteins involved in fatty acid uptake, synthesis, oxidation, or their regulation: Cd36, Cpt1a/2, Acox1, Pck1, and Mtor. Hepatic mRNA expression of the genes of interest was calculated relative to 18s using the 2−ΔΔCt method [66].

4.7. Western Blotting

Frozen liver tissues were homogenized in lysis buffer (20 mM HEPES, pH7.4, 50 mM β-glycerol phosphate, 2 mM EGTA, 1 mM DTT, 10 mM NaF, 1 mM sodium orthovanadate, 10% glycerol, 1 mM PMSF, 2 µM leupeptin, 1.5 µM pepstatin, 0.3 µM aprotinin, and 50 nM microcystin-LR), using a Bullet Blender (Next Advance, Troy, NY, USA). Triton X-100 was then added to the homogenates to a final concentration of 1%, and the homogenates were incubated at 4 °C on a rotator at 300 rpm for 30 min. The homogenates were then centrifuged at 14,000× g for 10 min to collect the supernatants, and the protein concentrations were measured using a Protein Assay Kit (Bio-Rad). Extracted liver proteins were then separated on a NuPage 10% Bis-Tris gel (Invitrogen, Carlsbad, CA, USA), and transferred to nitrocellulose membranes. Membranes were probed for 1 h at room temperature or overnight at 4 °C with a primary antibody against a protein of interest. After washing three times with Tris-buffered saline with 0.1% Tween-20, membranes were incubated with a horseradish peroxidase-conjugated anti-rabbit or anti-mouse secondary antibody (GE Healthcare, Piscataway, NJ, USA). Mouse monoclonal antibodies against Cpt1a, Dgat2, Fasn, Pck1, and Scd1 as well as the rabbit polyclonal antibody against total p38 were purchased from Santa Cruz Biotechnology (Santa Cruz, CA, USA). Mouse monoclonal antibody against β-actin was purchased from Sigma-Aldrich (St. Louis, MO, USA). The rabbit polyclonal antibody against phospho-p38 was purchased from Cell Signaling (Danvers, MA, USA). Immunoreactive bands were developed using enhanced chemiluminescence reagent (Millipore, Burlington, MA, USA). The Western blot images were acquired using Epson Perfection 4990 PHOTO scanner (Epson, Long Beach, CA, USA) and intensities of the immunoreactive bands were measured by densitometry using the UVP Vison Works LS software (Upland, CA, USA).

4.8. Statistical Analysis

Data were analyzed using GraphPad Prism 7 (GraphPad Software; La Jolla, CA, USA). The main effects and their interaction were evaluated by two-way ANOVA with Tukey post-hoc test to detect group differences. In addition, two-tail student’s t-test was conducted to detect statistical difference of the biomarkers measured in only two groups. Variables with unequal variance were log-transformed to achieve a normal distribution. Differences with p < 0.05 were considered significant.

4.9. Data Availability

The main data supporting the findings of this study are available from the NCBI GENE Expression Omnibus GES122741. For additional information contact the corresponding author.

Author Contributions

Y.L. and J.L. designed the study; J.L., X.W. (Xanxi Wang), X.W. (Xiantao Wang), A.J.B., W.M.W., and S.G.K. conducted experiments; J.L., A.J.B., S.G.K., W.E.A.I., D.A., L.D.N., L.S., I.B., M.H., and Y.L. analyzed the data. J.L. and Y.L. wrote the manuscript. All authors read, provided substantial intellectual input, and approved the final manuscript.

Funding

This research was funded by grants from NIH (R01 AI68956 and R01 AI124029 to Y.L., and R01 HL113508 to L.S.).

Acknowledgments

We are grateful to Bristol-Myers Squibb Pharmaceutical Research Institute for proving Mkp-1 knockout mice. We thank Tiffany Jenkins for assistance with histological analysis. We also gratefully acknowledge Xiaomei Meng for technical assistance. We thank Harshan Pisharath, Laura Goodchild, and James Cooper for vivarium expertise.

Conflicts of Interest

The authors declare no conflict of interest.

Abbreviations

Acaa1Acetyl-CoA acyltransferase 1
AcacaAcetyl-CoA carboxylase α
AcacbAcetyl-CoA carboxylase β
Acsl1Long chain fatty acid-CoA ligase 1
AcotAcyl-CoA thioesterase
Acox1Acyl-CoA oxidase 1
ANOVAAnalysis of variance
ApoApolipoprotein
Cd36
CFU
Cluster of differentiation 36
Colony forming units
CebpCCAAT/enhancer-binding protein
CptCarnitine palmitoyltransferase
Dgat2Diglyceride acyltransferase 2
Fabp1Fatty acid-binding protein 1
FasnFatty acid synthase
Foxo1
JNK
Forkhead box protein O1
c-Jun N-terminal kinase
LPSLipopolysaccharide
Mkp-1MAP kinase phosphatase-1
MtorMammalian target of rapamycin
NF-κBNuclear factor-κB
PBSPhosphate-buffered saline
Pck1/PEPCK-cPhosphoenolpyruvate carboxykinase, cytosolic isoform
PlinPerilipin
Pparg/PPARγPeroxisome proliferator-activated receptor γ
Ppargc1/PGC-1PPARγ coactivator 1
Scd1Stearoyl-CoA desaturase 1
qRT-PCRQuantitative reverse transcription PCR
Srebf1/SREBP-1Sterol regulatory element-binding transcription factor 1
TLRToll-like receptor
TNF-αTumor necrosis factor-α
VLDLVery low-density lipoprotein

References

  1. Angus, D.C.; Linde-Zwirble, W.T.; Lidicker, J.; Clermont, G.; Carcillo, J.; Pinsky, M.R. Epidemiology of Severe Sepsis in the United States: Analysis of Incidence, Outcome, and Associated Costs of Care. Crit. Care Med. 2001, 29, 1303–1310. [Google Scholar] [CrossRef] [PubMed]
  2. Mayr, F.B.; Yende, S.; Angus, D.C. Epidemiology of Severe Sepsis. Virulence 2014, 5, 4–11. [Google Scholar] [CrossRef] [PubMed]
  3. Trager, K.; DeBacker, D.; Radermacher, P. Metabolic Alterations in Sepsis and Vasoactive Drug-Related Metabolic Effects. Curr. Opin. Crit Care. 2003, 9, 271–278. [Google Scholar] [CrossRef] [PubMed]
  4. Miller, S.I.; Wallace, R.J., Jr.; Musher, D.M.; Septimus, E.J.; Kohl, S.; Baughn, R.E. Hypoglycemia As a Manifestation of Sepsis. Am. J. Med. 1980, 68, 649–654. [Google Scholar] [CrossRef]
  5. Chiolero, R.; Revelly, J.P.; Tappy, L. Energy Metabolism in Sepsis and Injury. Nutrition 1997, 13, 45S–51S. [Google Scholar] [CrossRef]
  6. Cetinkaya, A.; Erden, A.; Avci, D.; Karagoz, H.; Karahan, S.; Basak, M.; Bulut, K.; Gencer, V.; Mutlu, H. Is Hypertriglyceridemia a Prognostic Factor in Sepsis? Ther. Clin. Risk Manag. 2014, 10, 147–150. [Google Scholar] [CrossRef] [PubMed]
  7. Naylor, J.M.; Kronfeld, D.S. In Vivo Studies of Hypoglycemia and Lactic Acidosis in Endotoxic Shock. Am. J. Physiol. 1985, 248, E309–E316. [Google Scholar] [CrossRef]
  8. Berk, J.L.; Hagen, J.F.; Beyer, W.H.; Gerber, M.J. Hypoglycemia of Shock. Ann. Surg. 1970, 171, 400–408. [Google Scholar] [CrossRef]
  9. Woodske, M.E.; Yokoe, T.; Zou, B.; Romano, L.C.; Rosa, T.C.; Garcia-Ocana, A.; Alonso, L.C.; O’Donnell, C.P.; McVerry, B.J. Hyperinsulinemia Predicts Survival in a Hyperglycemic Mouse Model of Critical Illness. Crit Care Med. 2009, 37, 2596–2603. [Google Scholar] [CrossRef]
  10. Frazier, W.J.; Wang, X.; Wancket, L.M.; Li, X.A.; Meng, X.; Nelin, L.D.; Cato, A.C.; Liu, Y. Increased Inflammation, Impaired Bacterial Clearance, and Metabolic Disruption after Gram-Negative Sepsis in Mkp-1-Deficient Mice. J. Immunol. 2009, 183, 7411–7419. [Google Scholar] [CrossRef] [Green Version]
  11. Kaufmann, R.L.; Matson, C.F.; Rowberg, A.H.; Beisel, W.R. Defective Lipid Disposal Mechanisms During Bacterial Infection in Rhesus Monkeys. Metabolism 1976, 25, 615–624. [Google Scholar] [CrossRef]
  12. Griffiths, J.; Groves, A.C.; Leung, F.Y. Hypertriglyceridemia and Hypoglycemia in Gram-Negative Sepsis in the Dog. Surg. Gynecol. Obstet. 1973, 136, 897–903. [Google Scholar] [PubMed]
  13. Gallin, J.I.; Kaye, D.; O’Leary, W.M. Serum Lipids in Infection. N. Engl. J. Med. 1969, 281, 1081–1086. [Google Scholar] [CrossRef] [PubMed]
  14. Harris, H.W.; Gosnell, J.E.; Kumwenda, Z.L. The Lipemia of Sepsis: Triglyceride-Rich Lipoproteins As Agents of Innate Immunity. J. Endotoxin. Res. 2000, 6, 421–430. [Google Scholar] [PubMed]
  15. Wendel, M.; Paul, R.; Heller, A.R. Lipoproteins in Inflammation and Sepsis. II. Clinical Aspects. Intensive Care Med. 2007, 33, 25–35. [Google Scholar] [CrossRef]
  16. Lefer, A.M. Significance of Lipid Mediators in Shock States. Circ. Shock 1989, 27, 3–12. [Google Scholar] [PubMed]
  17. Kawakami, M.; Cerami, A. Studies of Endotoxin-Induced Decrease in Lipoprotein Lipase Activity. J. Exp. Med. 1981, 154, 631–639. [Google Scholar] [CrossRef]
  18. Lanza-Jacoby, S.; Lansey, S.C.; Cleary, M.P.; Rosato, F.E. Alterations in Lipogenic Enzymes and Lipoprotein Lipase Activity During Gram-Negative Sepsis in the Rat. Arch. Surg. 1982, 117, 144–147. [Google Scholar] [CrossRef]
  19. Beutler, B.; Greenwald, D.; Hulmes, J.D.; Chang, M.; Pan, Y.C.; Mathison, J.; Ulevitch, R.; Cerami, A. Identity of Tumour Necrosis Factor and the Macrophage-Secreted Factor Cachectin. Nature 1985, 316, 552–554. [Google Scholar] [CrossRef]
  20. Beutler, B.A.; Cerami, A. Recombinant Interleukin 1 Suppresses Lipoprotein Lipase Activity in 3T3-L1 Cells. J. Immunol. 1985, 135, 3969–3971. [Google Scholar]
  21. Tall, A.R.; Yvan-Charvet, L. Cholesterol, Inflammation and Innate Immunity. Nat. Rev. Immunol. 2015, 15, 104–116. [Google Scholar] [CrossRef] [PubMed]
  22. Aspichueta, P.; Perez-Agote, B.; Perez, S.; Ochoa, B.; Fresnedo, O. Impaired Response of VLDL Lipid and ApoB Secretion to Endotoxin in the Fasted Rat Liver. J. Endotoxin. Res. 2006, 12, 181–192. [Google Scholar] [CrossRef] [PubMed]
  23. Endo, M.; Masaki, T.; Seike, M.; Yoshimatsu, H. TNF-Alpha Induces Hepatic Steatosis in Mice by Enhancing Gene Expression of Sterol Regulatory Element Binding Protein-1c (SREBP-1c). Exp. Biol. Med. 2007, 232, 614–621. [Google Scholar]
  24. Ohhira, M.; Motomura, W.; Fukuda, M.; Yoshizaki, T.; Takahashi, N.; Tanno, S.; Wakamiya, N.; Kohgo, Y.; Kumei, S.; Okumura, T. Lipopolysaccharide Induces Adipose Differentiation-Related Protein Expression and Lipid Accumulation in the Liver Through Inhibition of Fatty Acid Oxidation in Mice. J. Gastroenterol. 2007, 42, 969–978. [Google Scholar] [CrossRef]
  25. Liu, Y.; Shepherd, E.G.; Nelin, L.D. MAPK Phosphatases—Regulating the Immune Response. Nat. Rev. Immunol. 2007, 7, 202–212. [Google Scholar] [CrossRef]
  26. Wang, X.; Nelin, L.D.; Kuhlman, J.R.; Meng, X.; Welty, S.E.; Liu, Y. The Role of MAP Kinase Phosphatase-1 in the Protective Mechanism of Dexamethasone Against Endotoxemia. Life Sci. 2008, 83, 671–680. [Google Scholar] [CrossRef]
  27. Wang, X.; Zhao, Q.; Matta, R.; Meng, X.; Liu, X.; Liu, C.G.; Nelin, L.D.; Liu, Y. Inducible Nitric-Oxide Synthase Expression Is Regulated by Mitogen-Activated Protein Kinase Phosphatase-1. J. Biol. Chem. 2009, 284, 27123–27134. [Google Scholar] [CrossRef] [PubMed]
  28. Zhao, Q.; Shepherd, E.G.; Manson, M.E.; Nelin, L.D.; Sorokin, A.; Liu, Y. The Role of Mitogen-Activated Protein Kinase Phosphatase-1 in the Response of Alveolar Macrophages to Lipopolysaccharide: Attenuation of Proinflammatory Cytokine Biosynthesis Via Feedback Control of P38. J. Biol. Chem. 2005, 280, 8101–8108. [Google Scholar] [CrossRef]
  29. Zhao, Q.; Wang, X.; Nelin, L.D.; Yao, Y.; Matta, R.; Manson, M.E.; Baliga, R.S.; Meng, X.; Smith, C.V.; Bauer, J.A.; et al. MAP Kinase Phosphatase 1 Controls Innate Immune Responses and Suppresses Endotoxic Shock. J. Exp. Med. 2006, 203, 131–140. [Google Scholar] [CrossRef]
  30. Lang, R.; Hammer, M.; Mages, J. DUSP Meet Immunology: Dual Specificity MAPK Phosphatases in Control of the Inflammatory Response. J. Immunol. 2006, 177, 7497–7504. [Google Scholar] [CrossRef] [Green Version]
  31. Franklin, C.C.; Kraft, A.S. Conditional Expression of the Mitogen-Activated Protein Kinase (MAPK) Phosphatase MKP-1 Preferentially Inhibits P38 MAPK and Stress-Activated Protein Kinase in U937 Cells. J. Biol. Chem. 1997, 272, 16917–16923. [Google Scholar] [CrossRef] [PubMed]
  32. Chi, H.; Barry, S.P.; Roth, R.J.; Wu, J.J.; Jones, E.A.; Bennett, A.M.; Flavell, R.A. Dynamic Regulation of Pro- and Anti-Inflammatory Cytokines by MAPK Phosphatase 1 (MKP-1) in Innate Immune Responses. Proc. Natl. Acad. Sci. USA 2006, 103, 2274–2279. [Google Scholar] [CrossRef] [PubMed]
  33. Salojin, K.V.; Owusu, I.B.; Millerchip, K.A.; Potter, M.; Platt, K.A.; Oravecz, T. Essential Role of MAPK Phosphatase-1 in the Negative Control of Innate Immune Responses. J. Immunol. 2006, 176, 1899–1907. [Google Scholar] [CrossRef] [PubMed] [Green Version]
  34. Wu, J.J.; Roth, R.J.; Anderson, E.J.; Hong, E.G.; Lee, M.K.; Choi, C.S.; Neufer, P.D.; Shulman, G.I.; Kim, J.K.; Bennett, A.M. Mice Lacking MAP Kinase Phosphatase-1 Have Enhanced MAP Kinase Activity and Resistance to Diet-Induced Obesity. Cell Metab. 2006, 4, 61–73. [Google Scholar] [CrossRef] [PubMed]
  35. Laplante, M.; Sabatini, D.M. An Emerging Role of MTOR in Lipid Biosynthesis. Curr. Biol. 2009, 19, R1046–R1052. [Google Scholar] [CrossRef] [PubMed] [Green Version]
  36. Cases, S.; Stone, S.J.; Zhou, P.; Yen, E.; Tow, B.; Lardizabal, K.D.; Voelker, T.; Farese, R.V., Jr. Cloning of DGAT2, a Second Mammalian Diacylglycerol Acyltransferase, and Related Family Members. J. Biol. Chem. 2001, 276, 38870–38876. [Google Scholar] [CrossRef] [PubMed] [Green Version]
  37. Lardizabal, K.D.; Mai, J.T.; Wagner, N.W.; Wyrick, A.; Voelker, T.; Hawkins, D.J. DGAT2 Is a New Diacylglycerol Acyltransferase Gene Family: Purification, Cloning, and Expression in Insect Cells of Two Polypeptides From Mortierella Ramanniana With Diacylglycerol Acyltransferase Activity. J. Biol. Chem. 2001, 276, 38862–38869. [Google Scholar] [CrossRef]
  38. Zhou, J.; Febbraio, M.; Wada, T.; Zhai, Y.; Kuruba, R.; He, J.; Lee, J.H.; Khadem, S.; Ren, S.; Li, S.; et al. Hepatic Fatty Acid Transporter Cd36 Is a Common Target of LXR, PXR, and PPARgamma in Promoting Steatosis. Gastroenterology 2008, 134, 556–567. [Google Scholar] [CrossRef]
  39. Nakamura, M.T.; Yudell, B.E.; Loor, J.J. Regulation of Energy Metabolism by Long-Chain Fatty Acids. Prog. Lipid Res. 2014, 53, 124–144. [Google Scholar] [CrossRef]
  40. Bonnefont, J.P.; Djouadi, F.; Prip-Buus, C.; Gobin, S.; Munnich, A.; Bastin, J. Carnitine Palmitoyltransferases 1 and 2: Biochemical, Molecular and Medical Aspects. Mol. Asp. Med. 2004, 25, 495–520. [Google Scholar] [CrossRef]
  41. Moreno-Fernandez, M.E.; Giles, D.A.; Stankiewicz, T.E.; Sheridan, R.; Karns, R.; Cappelletti, M.; Lampe, K.; Mukherjee, R.; Sina, C.; Sallese, A.; et al. Peroxisomal Beta-Oxidation Regulates Whole Body Metabolism, Inflammatory Vigor, and Pathogenesis of Nonalcoholic Fatty Liver Disease. JCI Insight 2018, 3, 93626. [Google Scholar] [CrossRef] [PubMed]
  42. Hakimi, P.; Johnson, M.T.; Yang, J.; Lepage, D.F.; Conlon, R.A.; Kalhan, S.C.; Reshef, L.; Tilghman, S.M.; Hanson, R.W. Phosphoenolpyruvate Carboxykinase and the Critical Role of Cataplerosis in the Control of Hepatic Metabolism. Nutr. Metab. 2005, 2, 33. [Google Scholar] [CrossRef] [PubMed]
  43. Horike, N.; Sakoda, H.; Kushiyama, A.; Ono, H.; Fujishiro, M.; Kamata, H.; Nishiyama, K.; Uchijima, Y.; Kurihara, Y.; Kurihara, H.; et al. AMP-Activated Protein Kinase Activation Increases Phosphorylation of Glycogen Synthase Kinase 3beta and Thereby Reduces CAMP-Responsive Element Transcriptional Activity and Phosphoenolpyruvate Carboxykinase C Gene Expression in the Liver. J. Biol. Chem. 2008, 283, 33902–33910. [Google Scholar] [CrossRef]
  44. Gomez-Valades, A.G.; Mendez-Lucas, A.; Vidal-Alabro, A.; Blasco, F.X.; Chillon, M.; Bartrons, R.; Bermudez, J.; Perales, J.C. Pck1 Gene Silencing in the Liver Improves Glycemia Control, Insulin Sensitivity, and Dyslipidemia in Db/Db Mice. Diabetes 2008, 57, 2199–2210. [Google Scholar] [CrossRef] [PubMed]
  45. Xiong, Y.; Lei, Q.Y.; Zhao, S.; Guan, K.L. Regulation of Glycolysis and Gluconeogenesis by Acetylation of PKM and PEPCK. Cold Spring Harb. Symp. Quant. Biol. 2011, 76, 285–289. [Google Scholar] [CrossRef] [PubMed] [Green Version]
  46. Lawan, A.; Zhang, L.; Gatzke, F.; Min, K.; Jurczak, M.J.; Al-Mutairi, M.; Richter, P.; Camporez, J.P.; Couvillon, A.; Pesta, D.; et al. Hepatic Mitogen-Activated Protein Kinase Phosphatase 1 Selectively Regulates Glucose Metabolism and Energy Homeostasis. Mol. Cell Biol. 2015, 35, 26–40. [Google Scholar] [CrossRef] [PubMed]
  47. Sweeney, S.E.; Firestein, G.S. Mitogen Activated Protein Kinase Inhibitors: Where are we now and where are we going? Ann. Rheum. Dis. 2006, 65 (Suppl. 3), iii83–iii88. [Google Scholar] [CrossRef]
  48. Chen, P.; Li, J.; Barnes, J.; Kokkonen, G.C.; Lee, J.C.; Liu, Y. Restraint of Proinflammatory Cytokine Biosynthesis by Mitogen-Activated Protein Kinase Phosphatase-1 in Lipopolysaccharide-Stimulated Macrophages. J. Immunol. 2002, 169, 6408–6416. [Google Scholar] [CrossRef] [Green Version]
  49. Hammer, M.; Mages, J.; Dietrich, H.; Servatius, A.; Howells, N.; Cato, A.C.; Lang, R. Dual Specificity Phosphatase 1 (DUSP1) Regulates a Subset of LPS-Induced Genes and Protects Mice From Lethal Endotoxin Shock. J. Exp. Med. 2006, 203, 15–20. [Google Scholar] [CrossRef]
  50. Lee, J.C.; Kassis, S.; Kumar, S.; Badger, A.; Adams, J.L. P38 Mitogen-Activated Protein Kinase Inhibitors—Mechanisms and Therapeutic Potentials. Pharmacol. Ther. 1999, 82, 389–397. [Google Scholar] [CrossRef]
  51. Bagby, G.J.; Spitzer, J.A. Lipoprotein Lipase Activity in Rat Heart and Adipose Tissue During Endotoxic Shock. Am. J. Physiol. 1980, 238, H325–H330. [Google Scholar] [CrossRef] [PubMed]
  52. Harris, H.W.; Grunfeld, C.; Feingold, K.R.; Rapp, J.H. Human Very Low Density Lipoproteins and Chylomicrons Can Protect Against Endotoxin-Induced Death in Mice. J. Clin. Investig. 1990, 86, 696–702. [Google Scholar] [CrossRef] [PubMed]
  53. Bechmann, L.P.; Hannivoort, R.A.; Gerken, G.; Hotamisligil, G.S.; Trauner, M.; Canbay, A. The Interaction of Hepatic Lipid and Glucose Metabolism in Liver Diseases. J. Hepatol. 2012, 56, 952–964. [Google Scholar] [CrossRef] [PubMed]
  54. Beutler, B.; Mahoney, J.; Le, T.N.; Pekala, P.; Cerami, A. Purification of Cachectin, a Lipoprotein Lipase-Suppressing Hormone Secreted by Endotoxin-Induced RAW 264.7 Cells. J. Exp. Med. 1985, 161, 984–995. [Google Scholar] [CrossRef] [PubMed]
  55. Beutler, B.A.; Milsark, I.W.; Cerami, A. Cachectin/Tumor Necrosis Factor: Production, Distribution, and Metabolic Fate in Vivo. J. Immunol. 1985, 135, 3972–3977. [Google Scholar] [PubMed]
  56. Chen, H.C.; Farese, R.V., Jr. DGAT and Triglyceride Synthesis: A New Target for Obesity Treatment? Trends Cardiovasc. Med. 2000, 10, 188–192. [Google Scholar] [CrossRef]
  57. Vluggens, A.; Andreoletti, P.; Viswakarma, N.; Jia, Y.; Matsumoto, K.; Kulik, W.; Khan, M.; Huang, J.; Guo, D.; Yu, S.; et al. Reversal of Mouse Acyl-CoA Oxidase 1 (ACOX1) Null Phenotype by Human ACOX1b Isoform. Lab Investig. 2010, 90, 696–708. [Google Scholar] [CrossRef]
  58. Xiao, Y.; Wang, J.; Yan, W.; Zhou, K.; Cao, Y.; Cai, W. P38alpha MAPK Antagonizing JNK to Control the Hepatic Fat Accumulation in Pediatric Patients Onset Intestinal Failure. Cell Death Dis. 2017, 8, e3110. [Google Scholar] [CrossRef]
  59. Lawan, A.; Shi, H.; Gatzke, F.; Bennett, A.M. Diversity and Specificity of the Mitogen-Activated Protein Kinase Phosphatase-1 Functions. Cell Mol. Life Sci. 2013, 70, 223–237. [Google Scholar] [CrossRef]
  60. Lawan, A.; Bennett, A.M. Mitogen-Activated Protein Kinase Regulation in Hepatic Metabolism. Trends Endocrinol. Metab. 2017, 28, 868–878. [Google Scholar] [CrossRef]
  61. Dorfman, K.; Carrasco, D.; Gruda, M.; Ryan, C.; Lira, S.A.; Bravo, R. Disruption of the Erp/Mkp-1 Gene Does Not Affect Mouse Development: Normal MAP Kinase Activity in ERP/MKP-1-Deficient Fibroblasts. Oncogene 1996, 13, 925–931. [Google Scholar] [PubMed]
  62. Li, J.; Sapper, T.N.; Mah, E.; Rudraiah, S.; Schill, K.E.; Chitchumroonchokchai, C.; Moller, M.V.; McDonald, J.D.; Rohrer, P.R.; Manautou, J.E.; et al. Green Tea Extract Provides Extensive Nrf2-Independent Protection Against Lipid Accumulation and NFkappaB Pro-Inflammatory Responses During Nonalcoholic Steatohepatitis in Mice Fed a High-Fat Diet. Mol. Nutr. Food Res. 2016, 60, 858–870. [Google Scholar] [CrossRef] [PubMed]
  63. Brunt, E.M.; Kleiner, D.E.; Wilson, L.A.; Belt, P.; Neuschwander-Tetri, B.A. Nonalcoholic Fatty Liver Disease (NAFLD) Activity Score and the Histopathologic Diagnosis in NAFLD: Distinct Clinicopathologic Meanings. Hepatology 2011, 53, 810–820. [Google Scholar] [CrossRef] [PubMed]
  64. Greer, Y.E.; Porat-Shliom, N.; Nagashima, K.; Stuelten, C.; Crooks, D.; Koparde, V.N.; Gilbert, S.F.; Islam, C.; Ubaldini, A.; Ji, Y.; et al. ONC201 Kills Breast Cancer Cells in Vitro by Targeting Mitochondria. Oncotarget 2018, 9, 18454–18479. [Google Scholar] [CrossRef] [PubMed]
  65. Benhalevy, D.; Gupta, S.K.; Danan, C.H.; Ghosal, S.; Sun, H.W.; Kazemier, H.G.; Paeschke, K.; Hafner, M.; Juranek, S.A. The Human CCHC-Type Zinc Finger Nucleic Acid-Binding Protein Binds G-Rich Elements in Target MRNA Coding Sequences and Promotes Translation. Cell Rep. 2017, 18, 2979–2990. [Google Scholar] [CrossRef] [PubMed]
  66. Livak, K.J.; Schmittgen, T.D. Analysis of Relative Gene Expression Data Using Real-Time Quantitative PCR and the 2−∆∆Ct Method. Methods 2001, 25, 402–408. [Google Scholar] [CrossRef] [PubMed]
Figure 1. Liver p38 activity and lipid contents before and after E. coli infection. Mkp-1+/+ and Mkp-1−/− mice were either infected i.v. with E. coli at a dose of 2.5 × 10⁷ colony forming units (CFU)/g of body weight or injected with PBS. Mice were euthanized after 24 h, and livers were harvested. (A) Phospho-p38 levels in the livers of control and E. coli-infected mice. Parts of the livers were homogenized to extract soluble proteins. Protein samples (40 µg) from distinct animals were resolved to detect phospho-p38 by Western blotting, using a polyclonal antibody against phospho-p38. The membranes were stripped and reblotted with p38 antibody to verify comparable loading. Images shown in the left panel are representative results. Bar graph in the right panel represent quantification of phosphor-p38 (p-p38) levels in each groups (n = 4). Groups marked with distinct letters above the bars indicate significant differences (p < 0.05, two-way Analysis of variance (ANOVA)); (B) Liver triglyceride; (C) Total liver lipid; (D) Liver cholesterol. Values in B-D represent means ± SE from 10 different animals, and data were analyzed by two-way ANOVA with Tukey post-test to evaluate main and interactive effects. NS: not significant.
Ijms 19 03904 g001
Figure 2. Liver histology of Mkp-1+/+ and Mkp-1−/− mice before and after E. coli infection. Control and E. coli-infected mice (2.5 × 10⁷ CFU/g of body weight, i.v.) were euthanized 24 h post infection. Small portions of the livers were excised and fixed in formalin, paraffinized, and sectioned for histological assessment. Liver lipid level was scored according to Brunt steatosis scoring system. (A) Histology of livers from control and E. coli-infected mice. Images are representative H&E-stained liver sections. Outset magnification ×100; inset ×400; (B) Liver lipid score evaluated by the Brunt steatosis scoring system; (C) Hepatic inflammatory infiltrate score. Hepatic inflammatory infiltrate score was evaluated by counting neutrophils in 20 randomly selected optical fields. Two-way ANOVA was conducted to detect group differences. Groups without a common superscript were significantly different (p < 0.05).
Ijms 19 03904 g002
Figure 3. Differentially expressed genes in Mkp-1+/+ and Mkp-1−/− mice before and following E. coli infection. Mkp-1+/+ and Mkp-1−/− mice were either infected i.v. with E. coli at a dose of 2.5 × 10⁷ CFU/g of body weight or injected with PBS (controls). Mice were euthanized after 24 h, and total RNA was isolated from the livers of four mice using Trizol for RNA-seq analyses. Volcano plots show the extent of differentially expressed gene (adjusted p value < 0.05, absolute value of log2 fold change 2) in each of four comparisons: control Mkp-1+/+ vs. control Mkp-1−/− (A), infected Mkp-1+/+ vs. control Mkp-1+/+ (B), infected Mkp-1−/− vs. control Mkp-1−/− (C), and infected Mkp-1−/− vs. infected Mkp-1+/+ (D).
Ijms 19 03904 g003
Figure 4. Pathway over-representation analysis for differentially expressed transcripts in control and E. coli-infected Mkp-1+/+ and Mkp-1−/− mice. RNA-seq data were analyzed with the Panther pathway classification system. Bar plots depict overrepresented Panther pathways affected by Mkp-1 knockout and/or E. coli infection in the following comparisons: control Mkp-1−/− vs. control Mkp-1+/+ (A), E. coli-infected Mkp-1+/+ vs. control Mkp-1+/+ (B), E. coli-infected Mkp-1−/− vs. control Mkp-1−/− (C), and E. coli-infected Mkp-1−/− vs. E. coli-infected Mkp-1+/+ (D). Dotted lines indicate p = 0.05 on the –log10 scale.
Ijms 19 03904 g004
Figure 5. Differential affected pathways in the livers of Mkp-1+/+ and Mkp-1−/− mice by E. coli infection. The RNA-seq data were analyzed using the iPathwayGuide analytic platform to identify the pathways differentially modulated in Mkp-1+/+ and Mkp-1−/− mice by E. coli infection. (A) Pathways differentially modulated in Mkp-1+/+ and Mkp-1−/− mice. Pathway analysis was done on the differentially expressed genes (>2-fold change either direction) using iPathwayGuide analysis tool. Each pathway is represented by a single dot in the graph for over-representation on the horizontal axis (pORA) and the perturbation on the vertical axis (pAcc), with the size of the dot proportional to the number of genes differentially modulated in that pathway. Differentially modulated pathways (FDR < 5%) were shown in red and pathways that did not reach statistical significance were shown in black. Note: In both axis, p-values are shown on the −log10 scale; (B) The top 10 pathways differentially modulated in Mkp-1+/+ and Mkp-1−/− mice by E. coli infection according to the pORA values.
Ijms 19 03904 g005
Figure 6. Expression of fatty acid metabolism genes significantly altered by E. coli infection and/or Mkp-1 knockout. Heat map showing relative changes in expression of select transcripts in individual mice as assessed using RNA-seq. The color gradient ranges from red (highest levels of expression) to green (lowest expression levels), with yellow representing intermediate levels. Note: Each lane represents a different animal, and only significantly affected genes were shown in the heat map (p < 0.05, Student’s t-test, n = 4).
Ijms 19 03904 g006
Figure 7. Hepatic mRNA expression of lipogenesis genes before and after E. coli infection. Mkp-1+/+ and Mkp-1−/− mice were either infected i.v. with E. coli at a dose of 2.5 × 10⁷ CFU/g of body weight or injected with PBS. Mice were euthanized after 24 h, and total RNA was isolated from the livers using Trizol. mRNA expression for different genes was assessed based on the RNA-seq data set, or quantified via qRT-PCR. Expression in un-infected Mkp-1+/+ mice was set as 1. Values represent means ± S.E. from 4 animals for RNA-seq and 4–7 animals for qRT-PCR in each group. (A) Expression levels of lipogenic regulator genes based on RNA-seq; (B) Expression levels of Mtor and Pparg based on qRT-PCR; (C) Expression levels of lipogenic genes based on RNA-seq. Values in the graphs were compared by two-way ANOVA. Groups marked with distinct letters above the bars indicate significant differences (p < 0.05).
Ijms 19 03904 g007
Figure 8. Levels of liver lipogenic proteins in control and E. coli-infected mice. Control and E. coli-infected mice (2.5 × 10⁷ CFU/g of body weight, i.v.) were euthanized 24 h post infection. (A) Representative results of Western blot analyses. Liver protein extracts from control or E. coli-infected Mkp-1+/+ and Mkp-1−/− mice were subjected to Western blotting with the indicated antibodies. The housekeeping protein β-actin was used as a control for normalization of protein loading; (B) Quantification of protein expression. The images were scanned by densitometry and expression levels normalized to β-actin. The expression level in control Mkp-1+/+ mice was set as 1. The results were analyzed by two-way ANOVA. Groups marked with distinct letters above the bars indicate significant differences (p < 0.05).
Ijms 19 03904 g008
Figure 9. Liver mRNA expression levels of Cd36 in control and E. coli-infected mice. Control and E. coli-infected mice (2.5 × 10⁷ CFU/g of body weight, i.v.) were euthanized 24 h post infection. Total RNA was isolated from the livers using Trizol. Cd36 mRNA levels were assessed via qRT-PCR. Expression in un-infected Mkp-1+/+ mice was set as 1. Values represent means ± S.E. from 4–7 animals in each group. The results were analyzed by two-way ANOVA. Groups marked with distinct letters above the bars indicate significant differences (p < 0.05).
Ijms 19 03904 g009
Figure 10. Hepatic expression of fatty acid β-oxidation proteins or genes before and after E. coli infection. Mkp-1+/+ and Mkp-1−/− mice were either infected i.v. with E. coli at a dose of 2.5 × 10⁷ CFU/g of body weight or injected with PBS. Livers were harvested 24 h post infection to isolate total RNA or protein. The mRNA and protein levels were assessed by qRT-PCR or Western blot analyses. (A) mRNA levels of fatty acid oxidation proteins assessed by qRT-PCR; (B) Representative Western blot of Cpt1a protein. Forty µg of protein for each sample was used for Western blot analysis. Each lane represents an individual animal. The membrane was stripped and reblotted with β-actin antibody to verify comparable loading. The densities of the bands were determined by densitometry, normalized to β-actin levels, and the relative expression level of Cpt1a protein in each group was depicted as means ± SE in the graph on the right (n = 3–4 mice per group); (C) Acox1 mRNA levels assessed by qRT-PCR. Expression in un-infected Mkp-1+/+ mice was set as 1. Values represent means ± S.E. of 3–5 different animals in each group. Values were compared by two-way ANOVA. Groups marked with distinct letters above the bars indicate significant differences (p < 0.05).
Ijms 19 03904 g010
Figure 11. Hepatic PCK1 expression in Mkp-1+/+ and Mkp-1−/− mice before and after E. coli infection. Mkp-1+/+ and Mkp-1−/− mice were either infected i.v. with E. coli at a dose of 2.5 × 10⁷ CFU/g of body weight or injected with PBS. Mice were euthanized after 24 h to extract total RNA and protein. (A) Pck1 mRNA expression levels were quantitated via qRT-PCR. Expression in un-infected Mkp-1+/+ mice was set as 1. Values represent means ± S.E. from 4–5 different animals in each group; (B) Liver Pck1 protein levels. Liver protein extracts from control or E. coli-infected Mkp-1+/+ and Mkp-1−/− mice were subjected to Western blotting with a mouse monoclonal antibody against Pck1. Each lane represents an individual animal. The membranes were stripped and then used to blotting with β-actin antibody. Representative results from Western blot analyses are shown. The densities of the bands were determined by densitometry, and normalized to β-actin levels, and the relative expression levels of Pck1 protein in each group were depicted as means ± SE in the graph below. Values were compared by two-way ANOVA. Groups marked with distinct letters above the bars indicate significant differences (p < 0.05).
Ijms 19 03904 g011
Table 1. Primers used for qRT-PCR reactions.
GeneForward PrimerReverse Primer
18sGTAACCCGTTGAACCCCATTCCATCCAATCGGTAGTAGCG
Acox1CAGGAAGAGCAAGGAAGTGGCCTTTCTGGCTGATCCCATA
Cd36ATGGGCTGTGATCGGAACTGTTTGCCACGTCATCTGGGTTT
Cpt1aCAGAGGATGGACACTGTAAAGGCGGCACTTCTTGATCAAGCC
Cpt2GGATAAACAGAATAAGCACACCAGAAGGAACAAAGCGGATGAG
MtorATTCAATCCATAGCCCCGTCTGCATCACTCGTTCATCCTG
Pck1TCTCTGATCCAGACCTTCCAAGAAGTCCAGACCGTTATGCAG
PpargCCAGAGTCTGCTGATCTGCGGCCACCTCTTTGCTCTGATC

