 Shane Austin1†
 Mojtaba Tavakoli1‡
 Christina Pfeiffer1‡Julia Seifert1
 Andrea Mattarei2
 Diego De Stefani3
 Mario Zoratti3,4
 Karin Nowikovsky1*
- 1Department of Internal Medicine I and Comprehensive Cancer Center, Medical University of Vienna, Vienna, Austria
- 2Department of Chemical Sciences, Università di Padova, Padova, Italy
- 3Department of Biomedical Sciences, Università di Padova, Padova, Italy
- 4Institute of Neuroscience (CNR), Padova, Italy
Ca2+ transport across the inner membrane of mitochondria (IMM) is of major importance for their functions in bioenergetics, cell death and signaling. It is therefore tightly regulated. It has been recently proposed that LETM1—an IMM protein with a crucial role in mitochondrial K+/H+ exchange and volume homeostasis—also acts as a Ca2+/H+ exchanger. Here we show for the first time that lowering LETM1 gene expression by shRNA hampers mitochondrial K+/H+ and Na+/H+ exchange. Decreased exchange activity resulted in matrix K+ accumulation in these mitochondria. Furthermore, LETM1 depletion selectively decreased Na+/Ca2+ exchange mediated by NCLX, as observed in the presence of ruthenium red, a blocker of the Mitochondrial Ca2+ Uniporter (MCU). These data confirm a key role of LETM1 in monovalent cation homeostasis, and suggest that the effects of its modulation on mitochondrial transmembrane Ca2+ fluxes may reflect those on Na+/H+ exchange activity.
Highlights
• Monovalent cation homeostasis is dysregulated upon LETM1 depletion
• K+/H+ exchange activity is decreased in LETM1 knockdown cells
• LETM1 depletion results in K+ accumulation in the mitochondrial matrix
• LETM1 knockdown does not affect expression of major mitochondrial Ca2+ transport modulators
• LETM1-regulated mitochondrial Ca2+ fluxes are dependent on Na+
Introduction
The chemiosmotic theory is the cornerstone of the current model of mitochondrial energy conservation and whole cell bioenergetics. An essential feature of the chemiosmotic theory relies on the existence of mitochondrial cation/proton exchangers (third postulate) (Mitchell, 1966, 2011). These exchangers are understood to maintain mitochondrial matrix cation concentrations far from electrochemical equilibrium, thus setting mitochondrial volume at steady-state (Garlid, 1988a). Historically, two monovalent cation/proton electroneutral exchange activities have been described: one highly selective for Na+ (Na+/H+ exchanger, NHE), the other more promiscuous (accepting K+, Na+, and Li+). Given the ion composition of the cytoplasm and mitochondrial matrix, this latter non-selective antiporter has been generally considered to function as a K+/H+ exchanger (KHE) (Nakashima and Garlid, 1982).
K+/H+ exchange is central to mitochondrial volume homeostasis, given that K+ is the most abundant intracellular monovalent cation. This is pointed out in some of the earliest accounts of the process (Garlid, 1988a). The properties of the electroneutral KHE, compensating K+ efflux by H+ intake, have been extensively studied in the 1980s using isolated mitochondria (Nakashima and Garlid, 1982; Brierley et al., 1984; Garlid et al., 1986). KHE activity is stimulated by decrease of medium osmolarity and increase of pH. Equally, inhibition by Mg2+, quinine and inhibitors of the respiratory chain is well described (Brierley et al., 1984; Garlid et al., 1986; Welihinda et al., 1993). Remarkably, K+ efflux rates depend not only on the K+ and H+ gradients, but also on the magnitude of the transmembrane potential. This has been ascribed to the modulation of the active conformation of the antiporter by ΔΨ, and it is not in contradiction with the key feature of electroneutrality (Bernardi and Azzone, 1983).
The mitochondrial NHE also has a role in ion homeostasis (Nath and Garlid, 1988), and it was initially characterized as involved in the regulation of mitochondrial Ca2+ (Garlid, 1988b). The NHE is insensitive to classical KHE inhibitors (Mg2+, quinine or DCCD) (Nakashima and Garlid, 1982; McCormack and Denton, 1986). As mentioned, a key functional difference between the two activities is that while the NHE is selective for Na+ and Li+ over K+ (Mitchell and Moyle, 1969), the KHE discriminates poorly between K+ and other monovalent cations (Nath and Garlid, 1988). A differential regulation of KHE-mediated electroneutral cation fluxes is however provided by Mg2+, which can block K+ but not Na+ antiport (Bernardi, 1999). In contrast, the NHE is competitively inhibited by Li+ but appears not to be regulated by any other cations (Nath and Garlid, 1988).
To date the molecular identity of the KHE remains unknown. Garlid and colleagues identified an 82 kDa protein able to mediate K+/H+ exchange in liposomes, and proposed it as the mitochondrial KHE (Li et al., 1990). A decade later, the protein Mdm38p was identified in yeast to be responsible for regulating mitochondrial volume (Nowikovsky et al., 2004). This protein possesses several properties expected of the mitochondrial KHE and its mammalian homolog, LETM1, has been shown to be necessary and sufficient to control K+/H+ exchange (Froschauer et al., 2005). Strong evidence of an essential role of LETM1 (Blomen et al., 2015; Wang et al., 2015) is in line with the notion of the vital function in maintaining the mitochondrial volume homeostasis, as postulated by P. Mitchell and with the finding that loss of LETM1 on one allele is sufficient to determine (or cause) the Wolf Hirschhorn syndrome (WHS). However, the identity of LETM1 as the KHE itself or a key factor of mitochondrial K+/H+ exchange has been challenged by reports that it operates as a mitochondrial Ca2+/H+ exchanger (Jiang et al., 2009, 2013; Tsai et al., 2014). Jiang and co-workers performed a genome-wide RNAi screen using Drosophila cells expressing the fluorescent mitochondrial-pericam Ca2+ probe (mt-pericam) (Jiang et al., 2009). In these assays, mt-pericam reported in situ Ca2+ levels in intact cells upon addition of thapsigargin, a SERCA blocker known to increase cytosolic Ca2+. These measurements as outlined in the Supplementary Methods (Jiang et al., 2009, SOM Text) were performed in Krebs-Ringer-HEPES buffer which contained 125 mM NaCl. The article demonstrated that cells with impaired LETM1 expression had reduced mt-pericam fluorescence.
Ca2+, which purportedly regulates mitochondrial kinases and dehydrogenases, is readily taken up in energized mitochondria by the MCU complex (Baughman et al., 2011; De Stefani et al., 2011). Yet, excess matrix Ca2+ would cause the calcification of the organelle, a condition that is not observed in vivo. As it is the case also for K+, efflux systems in the mitochondrial inner membrane must operate to prevent Ca2+ from distributing according to the transmembrane potential (Δψ). Mitochondrial Ca2+ release has been shown to be induced by Na+ and mediated by a Na+/Ca2+ antiporter, which exchanges mitochondrial Ca2+ for external Na+ (Carafoli et al., 1974). A NHE is then required to release matrix Na+ in exchange for external H+, allowing the Na+/Ca2+ exchange to continue (McCormack and Denton, 1986). While NCLX (SLC8B1) has been identified as the mitochondrial Na+/Ca+ antiporter (Palty et al., 2010), an additional Ca2+ efflux pathway is thought to be provided by a Ca2+/H+ exchanger (CHX) (McCormack and Denton, 1986; Kamer and Mootha, 2015). It has been proposed that this exchange is carried out by LETM1 (Jiang et al., 2009, 2013; Tsai et al., 2014). The interplay of NCLX and CHX in mitochondria Ca2+ dynamics is essential, as was recognized as early as the 1970s and continues to be well appreciated today (Carafoli, 1979; Kamer and Mootha, 2015). In fact, both components are fundamental players in any model of the mitochondrial Ca2+ cycle. This is so despite the molecular identity of NCLX having only recently been determined and the CHX function of LETM1 being still debated (Palty et al., 2010; Nowikovsky and Bernardi, 2014). Given this background, we hypothesized that LETM1/KHE may influence electroneutral Ca2+ transport indirectly via its regulation of monovalent cation homeostasis. Here we investigate the effect of LETM1 knockdown on monovalent cation exchange and mitochondrial Ca2+ transport activities and clarify LETM1 functions under physiological conditions.
Methods
Antibodies
Antibodies used were as follows: LETM1 (H00003954-M03, Abnova, Taipei, Taiwan), GAPDH (sc25778, Santa Cruz Biotechnology, Dallas, TX). Secondary HRP conjugated AffiniPure antibodies were from Jackson Immunoresearch (West Grove, PA): goat anti-mouse (115-035-008) and goat anti-rabbit (111-035-008).
Reagents
All reagents were from Sigma Aldrich (Vienna, Austria) unless otherwise indicated. Thapsigargin was from Tocris (Bristol, UK) and puromycin from Invivogen (San Diego, CA). All buffers as formulated were completed with MilliQ (Billerica, MA) ddH2O.
Primers and Plasmids
Primers are listed in the Table S1. All primers were from Microsynth (Balgach, Switzerland). All shRNA constructs were obtained from Origene Technologies (Rockville, MD). Product numbers for control and constructs by gene are: LETM1 #1 TR311758A) and #2 (TR311758D). Sequences of shRNA constructs and targeted exons can be found in Table S2. pcDNA3 mtRFP was obtained as a generous gift from Prof. Tullio Pozzan (University of Padova, Italy).
Cells
HeLa cells were a gift from E. Tomasich (Medical University of Vienna, Austria). All cells were maintained in DMEM (Gibco) supplemented with 10% (v/v) FBS (Gibco) and 1X penicillin/streptomycin/glutamine (Gibco). Cells were regularly screened for mycoplasma (MycoAlert Lonza kit).
Stable Cell Generation
Cells were transfected with Turbofect (Invitrogen, Paisley, UK) according to manufacturer's instructions; 48 h post transfection the media was changed to growth media with puromycin (2 μg/mL). After a resistant population of cells was established, cells were maintained in growth medium containing puromycin (2 μg/mL).
Immunoblotting
Cells were washed with PBS (Gibco) then harvested using lysis buffer (150 mM NaCl, 50 mM Tris (pH 8), 1% IGEPAL C360 and one tablet of protease inhibitors with EDTA (Roche) per 10 mL). Cell lysates were vortexed for 30 min at 4°C and then cleared by centrifugation at 15,000 g for 15 min, 4°C. Proteins were quantified by Bradford assay (Bio-Rad, Hercules, CA) using BSA as standard. Protein lysates were separated by SDS-PAGE and blotted onto 0.45 μm PVDF membranes (ThermoFisher Scientific, Rockford, IL). Membranes were immunoblotted as indicated and fat-free milk was used as blocking medium. Blots were quantified using the BioRad Image Lab (v5.2.1) software.
qPCR
Total RNA was isolated from cells using TRIzol reagent (Invitrogen) according to the manufacturer's instructions. Total RNA was DNase I (Invitrogen) digested before reverse transcription using the High-Capacity cDNA Reverse Transcription Kit (AB Biosystems, Foster City, CA). Diluted cDNA was then used for quantitative PCR using the GoTaq qPCR master mix (Promega, Madison, WI) and the reaction was run on the StepOne Plus (AB Biosystems). Analysis was performed using the StepOne Plus software (v2.3) and Expression Suite (v1.0.3).
Ca2+ Uptake/Efflux Assays
Cell counting, harvesting and permeabilization were performed as in Wilfinger et al. (2016), with only minor modification. Permeabilized cells were studied in either intracellular like buffer I (ICL buffer I) (130 mM KCl, 10 mM Tris-MOPS (pH 7.4), 10 μM EGTA-Tris, 1 mM KPi, 5 mM malate, 5 mM sodium glutamate, 1 μM Ca2+ green 5N) or intracellular like buffer II (ICL buffer II) (130 mM KCl, 10 mM Tris-MOPS (pH 7.4), 10 μM EGTA-Tris, 1 mM KPi, 5 mM malate, 5 mM glutamic acid, 1 μM Ca2+ green 5N).Importantly, these buffers are identical, with the exception that ICL I contains sodium glutamate and ICL II glutamic acid. The pH of the ICL buffers was verified prior to measurements. Sequential additions of 10 μM Ca2+ (as CaCl2), 0.2 μM ruthenium red (RR) or 1.2 μM ruthenium 360 (R360), 10 mM Na+ (as sodium acetate, NaOAc) and 2 μM FCCP were as indicated in Figure 4. Ca2+ uptake/release measurements were performed at 25°C on a LS55 spectrofluorometer (Perkin Elmer) with the following parameters, λex = 505 nm, λem = 535 nm, slit width: 2.5 nm.
Mitochondrial Swelling Assays
Isolated mitochondria (Frezza et al., 2007) were deenergized by incubation with 5 μM antimycin A for 10 min at RT (25°C). Mitochondria were pelleted and resuspended in isotonic isolation buffer (10 mM Tris-MOPS (pH 7.4), 1 mM EGTA-Tris (pH 7.4), 200 mM sucrose) at a concentration of 1 mg/mL and placed in a cuvette. In the case of KOAc-induced swelling, mitochondria were additionally depleted of Mg2+ immediately prior to measurement by incubation with 1 μM A23187 and 1 mM EDTA to eliminate Mg2+, the blocker of the KHE. To measure KOAc- or NaOAc-induced passive swelling, KOAc (as described in Nowikovsky et al., 2004: 55 mM KOAc, 5 mM TES, 0.1 mM EDTA) or NaOAc (55 mM NaOAc, 5 mM TES, 0.1 mM EDTA) buffer, respectively, was added and the optical density changes were immediately recorded at 25°C using an UltroSpec 1100 Pro spectrophotometer (Biochrom, Cambridge, UK). Swelling rate was quantified by fitting the raw swelling data for one-component exponential decay as shown, and the k value was used to quantify the rate of the process.
Mitochondrial Membrane Potential
Cells (2 × 10⁸) were harvested and permeabilized as described in Wilfinger et al. (2016). Rhodamine123 (Molecular Probes) was used as ΔΨ probe at a concentration of 0.15 μM in ICL buffer II. Mitochondria were energized with glutamate (5 mM) and malate (5 mM), maximal mitochondrial depolarization was achieved by the addition of FCCP (1 μM). Measurements were performed at 37°C on a LS55 spectrofluorometer with the following parameters: λex = 503 nm, λem = 523 nm, slit width: Ex-3.5 nm, Em-2.5 nm.
Mitochondrial Potassium Indicator
The potassium probe mitoPOP was used to monitor the mitochondrial K+ concentration. The probe was tested for its pH and K+ sensitivity as follows: pH sensitivity was measured by dissolving 10 μM mitoPOP in a solution containing 150 mM KCl and 25 mM MES (pH 6.5), HEPES (pH 7 and 7.4) or TRIS (pH 8 and 8.5). Fluorescence was recorded in a microplate reader (Perkin Elmer Envision) using 485/10 nm and 535/30 nm bandpass filters for excitation and emission, respectively. Raw fluorescence values were blank subtracted, normalized on neutral pH and plotted against pH values. In parallel, K+ sensitivity was tested by dissolving 10 μM mitoPOP in a solution containing 25 mM HEPES (pH 7) and 0, 150, or 300 mM KCl at 25°C. Raw fluorescence values (measured as described above) were blank subtracted, normalized on K+-free medium and plotted against [K+].
Cells (30,000/well) were loaded with mitoPOP (1 μM) for 45 min at 37°C under cell culture conditions in modified Krebs-Ringer buffer (135 mM NaCl, 5 mM KCl, 1mM MgSO4, 0.4 mM K2HPO4, 20 mM HEPES, 5.5 mM glucose, 1 mM CaCl2, pH = 7.4). Cells were washed once with Krebs-Ringer buffer and then incubated for 5 min in 140 mM Tris-KCl (pH 7.4). Thereafter increasing K+ or sucrose concentrations were added as indicated for the in situ response curve. Measurements were performed on a TriStar plate reader (λex:485 nm, λem:535 nm) at 25°C. Cells were subsequently counted by Trypan blue exclusion to normalize fluorescence readings to cell number. As a double control, to directly normalize the results to the amount of mitochondria independently of potentially variable cell numbers, cells plated in duplicates were analogously loaded with MitoTracker green (50 nM, Molecular Probes) at 37°C for 30 min. The staining was washed once, the fluorescence intensity quantified as above in KCl buffer and used to normalize mitoPOP fluorescence values.
Microscopy
Scrambled shRNA-transfected (control) HeLa cells were seeded onto an Ibidi μ-slide (Martinsried, Germany) and transfected as previously described with pcDNA3 mtRFP and stained with mitoPOP for the last 45 min prior to visualization. The cells were visualized and images acquired on an LSM780 confocal microscope. Microscope, objective and aperture specifications may be found in Wilfinger et al. (2016).
Statistical Testing
All statistical analyses were performed using GraphPad (La Jolla, CA) Prism v6 for Windows. Similarly, all graphs were generated with GraphPad Prism. One way ANOVA with Dunnett's posttest was performed in each case to assess significance. Individual p-values are indicated in the figure legends.
Results
LETM1 Knockdown Does Not Affect MCU and NCLX1 Expression
To address the role of LETM1 in mitochondrial K+ and Ca2+ release, we stably transfected HeLa cells with shRNAs targeted against LETM1, or randomly scrambled constructs. HeLa cell lines with LETM1 knockdown of varying efficiency were obtained. We observed that the most efficient viable knockdown had a 50% reduction in gene expression when compared to scramble controls (shSCR). This was achieved with shRNA LETM1 #2, while for another construct, shRNA LETM1 #1, no significant reduction was observed (Figure 1C). However, surprisingly, at the protein level both knockdown cell lines showed decreased LETM1 expression, with shLETM1 #2 proving more efficient than shLETM1 #1 (Figures 1A,B). As mentioned before, WHS patients have only one copy of LETM1, hence a reduction of 50% is clinically relevant (Hart et al., 2014). We further asked if reduced LETM1 expression altered the expression of known mitochondrial Ca2+ transporters, the mitochondrial Ca2+ uniporter (MCU) or NCLX (SLC8B1), and found both genes had comparable transcription levels regardless of LETM1 expression (Figure 1C). To further exclude that LETM1 KD may lead to loss of mitochondrial DNA and reduced mitochondrial mass, we compared the expression of the mitochondrially-encoded genes COX1 and ATP6 to that of a nuclear gene (18S) in our shLETM1 and control cells, and found no differences (Figure 1D).
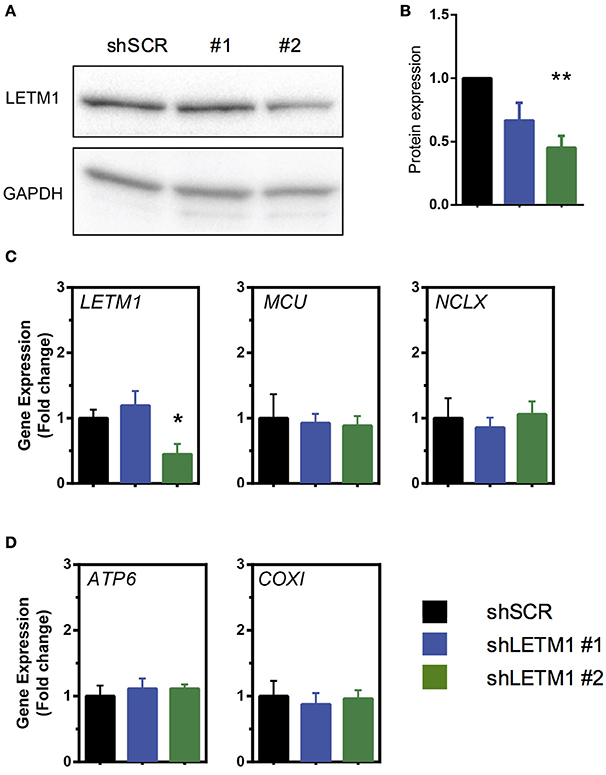
Figure 1. Mitochondrial Ca2+ modulators are unaffected by LETM1 expression. (A) Immunoblot of scrambled control (SCR) and LETM1 knockdown cells (#1, #2) for LETM1 and GAPDH as indicated. (B) Densiometric quantification of five independent immunoblots of samples as shown in (A). Data shown are mean LETM1 expression relative to loading control ± SEM (n = 5). **p < 0.01, one way ANOVA with Dunnett's multiple comparisons test. (C) Gene expression of (left to right as indicated): LETM1, MCU, NCLX (SLC8B1) in shSCR control and shLETM1 cells. All data are mean gene expression relative to TBP of n = 4–5 independent experiments ± SEM. *p < 0.05, one way ANOVA with Dunnett's multiple comparisons test. (D) Gene expression of mitochondrially encoded genes (left to right as indicated): ATP6, COXI, compared to a nucleus-encoded control (18S) in shSCR control and shLETM1 cells. All data are mean gene expression relative to TBP of n = 4 independent experiments ± SEM.
Mitochondrial K+ and Na+ Efflux Is Reduced upon LETM1 Knockdown
So far, LETM1-dependent KHE activity has been assessed in S. cerevisiae, a yeast species that lacks mitochondrial Ca2+ transport systems. Using light scattering-based assays, yeast mitochondria devoid of LETM1 were shown to be refractory to KOAc-induced swelling, indicating reduced KHE activity and matrix K+ overload (Nowikovsky et al., 2004). To date, light scattering monitoring of passive swelling represents the most reliable way to evaluate KHE activity (Nakashima and Garlid, 1982; Garlid et al., 1986). Incubation of isolated non-respiring mitochondria in KOAc results in a rapid diffusion of acetic acid into the matrix where it deprotonates. The dissociation of H+ from AcO− leads to the acidification of the matrix catalysing the uptake of K+ in exchange for H+. The matrix accumulation of K+ acetate induces matrix swelling which is seen as decreased of scattered light or optical density. Here, we applied the light scattering approach to isolated mitochondria from HeLa cells, and monitored for the first time the changes in optical density (OD) of suspensions of control and LETM1 KD mitochondria (Figure 2).
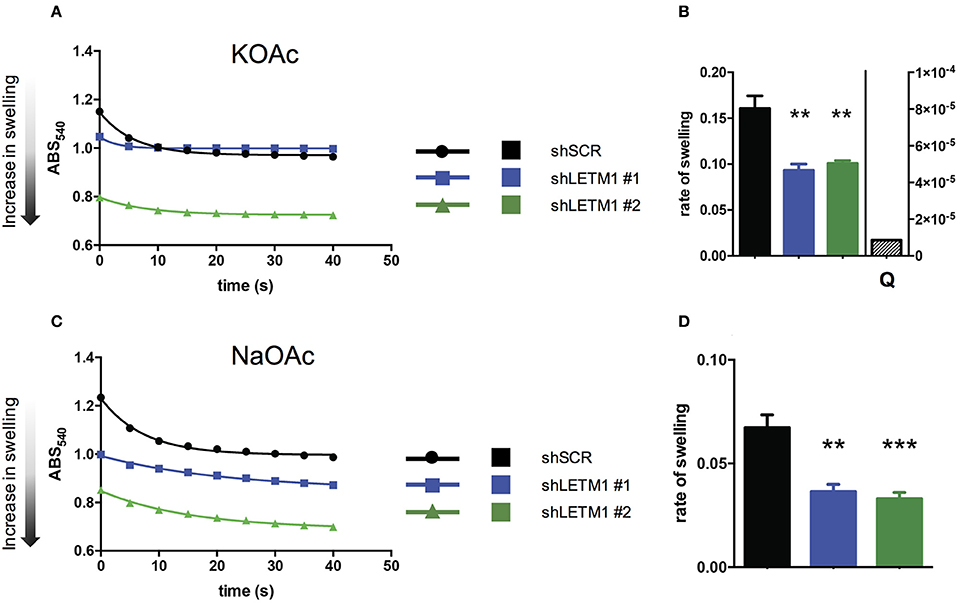
Figure 2. LETM1 expression regulates mitochondrial KHE. (A) Representative trace of KOAc induced swelling in shSCR (black circles) and shLETM1 (#1 blue squares, #2 green triangles) isolated mitochondria. The increase of matrix volume corresponds to the decrease of optical density, as indicated by the arrow. (B) Quantification of three independent swelling experiments as shown in (A). Control demonstrating inhibition of swelling with quinine (shSCR + Q- quantified on right axis) is the average of two independent experiments with 1 mM quinine in swelling buffer. Data are means ± SEM (n = 3). **p < 0.01, one way ANOVA with Dunnett's multiple comparisons test. (C) Representative trace of NaOAc induced swelling in shSCR (black circles) and shLETM1 (#1 blue squares, #2 green triangles) isolated mitochondria. (D) Quantification of four independent swelling experiments as shown in (C). Data are means ± SEM (n = 4). **p < 0.01, ***p < 0.005 one way ANOVA with Dunnett's multiple comparisons test.
To reveal changes in the activity of the mitochondrial KHE we used hypotonic KOAc buffer, and deenergized mitochondria depleted of Mg2+, a known inhibitor of KHE activity. Incubation of isolated non-respiring mitochondria in KOAc leads to the acidification of the matrix, catalysing the uptake of K+ in exchange for H+. The matrix accumulation of K+ induces matrix swelling which is seen as decreased scattered light or optical density. In general, while a rapid and high amplitude swelling is expected from mitochondria with functional KHE, a reduction of KHE activity will be reflected by lesser swelling. We observed that shLETM1 #1 and #2 mitochondria had slower and decreased swelling as compared to shSCR controls, as reflected by a reduced and slower decrease of scattered light. The decrease of OD was inhibited by quinine, the inhibitor of KHE, confirming that the changes in OD were due to KHE activity (Figures 2A,B). Moreover, the matrix volume of shLETM1 mitochondria was increased as compared to that of shSCR mitochondria, as indicated by a lower OD from the beginning of recording, suggesting a higher content of osmolytes (Figure 2A). The mitochondrial Na+/H+ exchange activity was assayed in a similar swelling assay. In this case, Mg2+ depletion was not carried out and Na+ fluxes could not be inhibited by quinine (Bernardi, 1999). We obtained qualitatively identical results: both shLETM1 knockdown mitochondria displayed decreased swelling (Figures 2C,D). The data collected here using well-established and reliable methods, establish that LETM1 downregulation results in a significant decrease of proton exchange for each monovalent cation, K+ or Na+.
K+ Is Accumulated in the Matrix of LETM1-Depleted Mitochondria
Reduced KHE activity should result in accumulation of K+ in the matrix of energized mitochondria. To directly assess whether K+ indeed accumulated in LETM1 KD mitochondria, we employed a mitochondria-targeted fluorescent K+ probe (mitoPOP) which accumulates in the mitochondrial matrix due to the latter's negative electrical potential (Mattarei et al., unpublished results). The specific localization of the probe was confirmed by co-localization with mtRFP in shSCR control cells (Figures 3A–C). A titration of mitoPOP fluorescence as a function of [K+] (Figure 3D) and pH (Figure 3E) demonstrated the sensitivity of the probe for K+ changes in the desired concentration range and its insensitivity to pH (Figures 3D,E). In order to assess K+ differences in LETM1 KD cells, we preliminarily confirmed that the membrane potential was unaffected by LETM1 KD (Figure 3F) as previously reported (Doonan et al., 2014). Significant changes of the in situ mitochondrial transmembrane potential upon increasing additions of KCl up to 400 mM were excluded in experiments employing TMRM (Figure S1A). To demonstrate a response to K+ in situ, we then added KCl to intact shSCR mitoPOP-loaded HeLa cells. This did generate a response curve (Figure 3G). In comparison, adding sucrose to intact shSCR cells at increasing concentration had no effect on the mitoPOP fluorescence (Figure 3H and Figure S1B), thus excluding increasing osmotic pressure and confirming increasing K+ concentration as the reason for the observed fluorescence changes. Lastly, to assess if matrix K+ accumulation occurs in LETM1 KD cells, KD and control cells were exposed to a solution of 140 mM KCl after mitoPOP loading (Figures 3I,J). A 1.6-fold increase in fluorescence was observed in shLETM1 #2 cells in comparison to shSCR control cells, while shLETM1 #1 cells showed a more modest 1.3-fold increase. Together these results confirm that reduced KHE activity leads to matrix accumulation of K+ in LETM1-depleted cells.
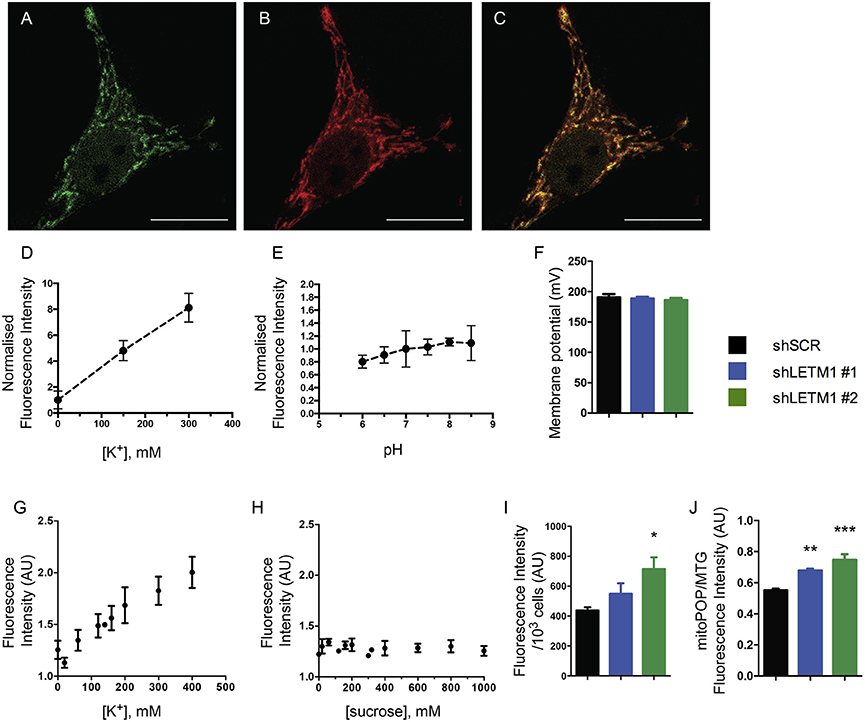
Figure 3. LETM1 depletion results in K+ accumulation in the matrix. (A–C) Intact HeLa control cells expressing mtRFP (B) were loaded with mitoPOP (A), to demonstrate mitochondrial localization of the probe merged image (C). Confocal microscopy images are representative of cells in 2 independent experiments. Scale bar: 20 μm in all images. (D) Fluorescence intensity (normalized on K+-free medium) of the mitoPOP probe in response to different [K+]. Data are means ± SD (n = 3). (E) Fluorescence intensity (normalized on neutral pH) of the mitoPOP probe at different pH values. Data are means ± SD (n = 3). (F) Mitochondrial membrane potential of permeabilized HeLa control (shSCR) and LETM1 knockdown (shLETM1 #1, #2) cells. Data are means ± SD (n = 3). (G) Response curve obtained by addition of KCl as indicated to individual wells containing intact HeLa control cells loaded with mitoPOP indicator. Data are means ± SEM (n = 3). (H) Response curve obtained by addition of sucrose as indicated to individual wells containing intact HeLa control cells loaded with mitoPOP indicator. Data are means ± average deviation (n = 2) conducted in technical duplicates. (I) Normalized mitoPOP fluorescence intensity of intact HeLa control (shSCR) and LETM1 knockdown (shLETM1 #1, #2) cells. Fluorescence values were normalized to the cell number after measurement. Data are means ± SEM (n = 5). *p < 0.05, one way ANOVA with Dunnett's multiple comparisons test. (J) MitoPOP fluorescence intensity of intact HeLa control (shSCR) and LETM1 knockdown (shLETM1 #1, #2) cells, normalized to MitoTracker Green fluorescence. Data are means ± average deviation (n = 4). **p < 0.01, ***p < 0.005, one way ANOVA with Dunnett's multiple comparisons test.
LETM1-Dependent Mitochondrial Ca2+ Uptake and Release Is Affected by the Presence of Na+
Using our shLETM1 cells we performed mitochondrial Ca2+ uptake and release experiments similar in setup to those of Doonan et al. (2014) (Figure 4A). One pulse of Ca2+ was added to permeabilized LETM1 KD or control cells suspended in ICL buffer I containing the Ca2+ indicator Ca2+ 5N Green (Figure 4A, first arrow). Next, RR, an inhibitor of MCU, was added to block Ca2+ uptake and induce H+- and Na+-dependent Ca2+ release. As expected, a slow Ca2+ extrusion was observed (Figure 4A, second arrow). This was followed by a single pulse of the uncoupler FCCP to release sequestered mitochondrial Ca2+ (Doonan et al., 2014) (Figure 4A, third/fourth arrow). Consistent with the findings of Doonan et al., shLETM1 #2 cells had reduced mitochondrial Ca2+ efflux (Figures 4A–D), in a fashion that was dependent on LETM1 expression. The assays conducted at 25°C or 37°C showed comparable results. Based on the hypothesis that LETM1 embodies the KHE, which also transports Na+ (Nowikovsky et al., 2004; Froschauer et al., 2005), we next assessed Ca2+ transport in Na+-free buffer (ICL buffer II) (Figure 4E). In the absence of Na+, no change in Ca2+ efflux between cells expressing LETM1 at wild-type or knockdown levels was observed (Figures 4E,F). Next, the Na+-induced Ca2+ release was initiated by the addition of a Na+ pulse (Figure 4E, third arrow). As illustrated in Figure 4G, shLETM1 #2 showed reduced Na+-induced Ca2+ release. A comparison of the results obtained in the presence or absence of Na+ suggests that the effect of LETM1 on Ca2+ efflux depends on Na+ (Figures 4B,D,G vs. Figure 4F). For further validation, we subjected LETM1 control and knockdown cells to Ca2+ uptake/release assays in presence of the NCLX inhibitor CGP37157 using the Na+ replete buffer. This allows monitoring mitochondrial Ca2+ release that is not due to NCLX. As shown in Figures 4H–K. we found similar Na+-independent Ca2+ mitochondrial release activities in presence or absence of LETM1. The results were consistent at 25°C (4H, I) and 37°C (4J, K). To additionally evaluate the role of the KHE in mitochondrial Ca2+ fluxes using a pharmacological approach, we resuspended shSCR cells in Na+-replete buffer, and quantified Na+-dependent Ca2+ fluxes in control cells in the absence or presence of the KHE inhibitor quinine. As shown in Figures 4L,M, inhibition of the KHE severely decreased the Na+-dependent Ca2+ efflux in comparison to vehicle controls. These data support the hypothesis that the deregulation of mitochondrial monovalent cation homeostasis induced by KHE dysfunction reduces Ca2+ efflux.
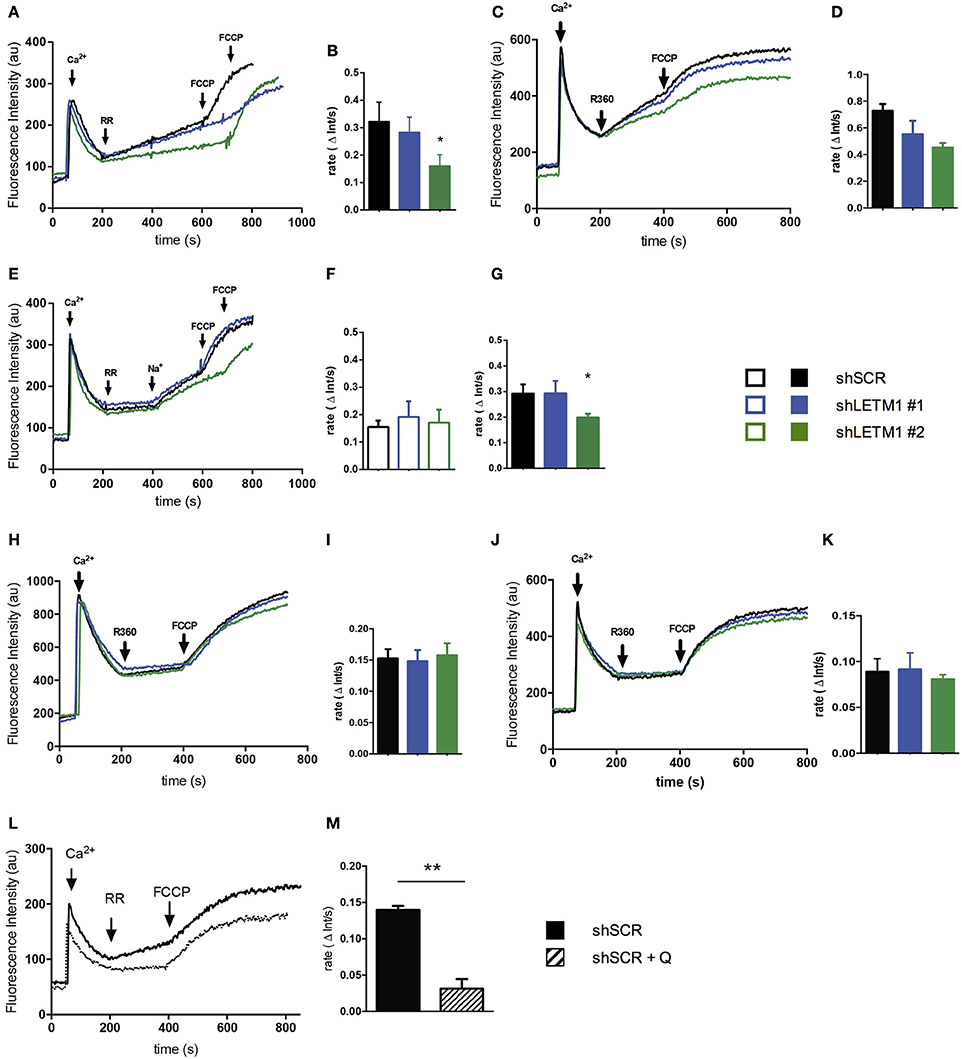
Figure 4. LETM1-mediated mitochondrial Ca2+ fluxes are Na+-dependent. (A) Representative trace of permeabilized scrambled control (shSCR) and LETM1 knockdown (shLETM1 #1, #2) cells in ICL buffer I (Na+ replete) containing Ca2+ Green 5N. Additions were made as indicated by arrows: Ca2+ (10 μM; 60 s), ruthenium red (RR) (0.2 μM; 200 s), FCCP (2 μM; 600/700 s). Recordings were performed at 25°C. (B) Quantification of Ca2+ efflux rate as shown in (A) between 200 and 400 s. Data shown are mean efflux rate ± SEM (n = 4). *p < 0.05, one way ANOVA with Dunnett's multiple comparisons test. (C) Representative trace of permeabilized scrambled control (shSCR) and LETM1 knockdown (shLETM1 #1, #2) cells in ICL buffer I (Na+ replete) containing Ca2+ Green 5N. Additions were made as indicated by arrows: Ca2+ (10 μM; 60 s), ruthenium 360 (R360) (1.4 μM; 200 s) the active ingredient in ruthenium red, FCCP (2 μM; 400 s). Recordings were performed at 37°C. (D) Quantification of Ca2+ efflux rate as shown in (C) between 200 and 400 s. Data shown are mean efflux rate ± average deviation (n = 2). (E) Representative trace of permeabilized scrambled control (shSCR) and LETM1 knockdown (shLETM1 #1, #2) cells in ICL buffer II (Na+-free) containing Ca2+ Green 5N. Additions were made as indicated by arrows: Ca2+ (10 μM; 60 s), RR (0.2 μM; 200 s), Na+ (10 mM; 400 s), FCCP (2 μM; 600/700 s). Recordings were performed at 25°C. (F) Quantification of Ca2+ efflux rate as shown in (E) between 200 and 400 s. Data shown are mean efflux rate ± SEM (n = 5). (G) Quantification of Ca2+ efflux rate as shown in (E) between 400 and 600 s. Data shown are mean efflux rate ± SEM (n = 5). *p < 0.05, one way ANOVA with Dunnett's multiple comparisons test. (H) Representative trace of permeabilized scramble control (shSCR) and LETM1 knockdown (shRNA #1, #2) as in (A) but in presence of CGP37175 an inhibitor of the Na+/Ca2+ exchanger (10 μM). (I) Quantification of Ca2+ efflux rate as shown in (H) between 200 and 400 s. Data shown are mean efflux rate ± SEM (n = 3–6). (J) Representative trace of permeabilized scramble control (shSCR) and LETM1 knockdown (shRNA #1, #2) as in (C) but in presence of CGP37175 as above. (K) Quantification of Ca2+ efflux rate as shown in (J) between 200 and 400 s. Data shown are mean efflux rate ± average deviation (n = 2). (L) Representative trace of permeabilized scrambled control (shSCR) cells treated with quinine (1 mM, dotted line) or vehicle control (ethanol, solid line) in ICL buffer I (Na+ replete) containing Ca2+ Green 5N. Additions were made as indicated by arrows: Ca2+ (10 μM; 60 s), RR (0.2 μM; 200 s), FCCP (2 μM; 400 s). Recordings were performed at 25°C. (M) Quantification of Ca2+ efflux rate as shown in (B). Data shown are mean efflux rate ± SEM (n = 3). **p < 0.01, unpaired students t-test.
Discussion
The function of LETM1 in mitochondrial cation exchange has recently been a matter of debate. Studies in yeast, mammalian cell culture, Trypanosoma, C. elegans and Drosophila have demonstrated a role for this protein in K+/H+ exchange. While LETM1 has also been proposed to directly mediate mitochondrial Ca2+ uptake and efflux in Drosophila, mammalian cell culture and cell-free systems (Jiang et al., 2009, 2013; Doonan et al., 2014; Tsai et al., 2014), our data and those of others question this notion (Hashimi et al., 2013; De Marchi et al., 2014).
In this study, we show that decreased LETM1 expression substantially reduced not only K+/H+ exchange, which was expected, but also Na+/H+ exchange (Figures 2C,D), which is novel. These data support the earlier demonstration that LETM1 is an essential element of the mitochondrial KHE (Nowikovsky et al., 2004; Froschauer et al., 2005; Hashimi et al., 2013) and extend the range of functions of LETM1 to regulation of Na+-dependent processes. Both K+ and Na+ are fundamental for mitochondrial osmotic balance. The maintenance of their homeostasis is assured by mitochondrial exchange activities: KHE, which handles both K+ and Na+, and NHE, which is specific for Na+. Taking the demonstrated function of LETM1 in KHE into account, its discovery as a CHX in the Drosophila S2 screen was surprising (Jiang et al., 2009). We have already commented on the direction of a putative LETM1-mediated Ca2+/H+ exchange given a stoichiometry of Ca2+/2H+ (Nowikovsky and Bernardi, 2014). Thus, its function as a Ca2+ efflux mechanism must be considered. In direct contrast to the findings of the Drosophila screen and others (Jiang et al., 2013; Tsai et al., 2014), De Marchi et al. found that exogenous LETM1 expression led to a direct increase in K+-induced proton extrusion, a feature consistent with the KHE (De Marchi et al., 2014). This finding is coherent with a reduced K+/H+ exchange when LETM1 expression is decreased (this paper). A consequence of impaired KHE is K+ overload as has been demonstrated here and in yeast (Nowikovsky et al., 2004). Furthermore, recent data in Trypanosoma provide a substantial basis for the notion of an evolutionarily conserved function of LETM1 in KHE (Hashimi et al., 2013).
We have shown that LETM1 depletion reduces mitochondrial K+ and Na+ exchange for protons. Further, we have demonstrated that LETM1-depleted mitochondria have a reduced Ca2+ efflux in buffer containing Na+, while the efflux is unchanged in a Na+-free buffer. Of note, the Na+-independent Ca2+ release only accounts for a minor part of the mitochondrial Ca2+ efflux. Although the data of Doonan et al. are both convincing and technically sound, little consideration is given to the key observation that there is no difference in Ca2+/H+ fluxes after the addition of CGP37157, an inhibitor of the mitochondrial NCLX. Careful consideration of these data illustrates that the proposed LETM1-mediated Ca2+/H+ fluxes are unchanged when LETM1 expression is reduced (Doonan et al., 2014), in contrast to mitochondrial Ca2+/Na+ exchange. Contextually, this suggests LETM1 is not responsible for Ca2+/H+ fluxes in vivo. Furthermore, it has been reported that LETM1 does not mediate the bulk of electroneutral Ca2+ efflux in HeLa cells for which NCLX would instead be responsible (De Marchi et al., 2014). Thus, two possible explanations are apparent. One is that LETM1 may be directly involved in the regulation of the NCLX. However, our results indicate that LETM1 does not affect expression of NCLX, weakening this hypothesis. Alternatively, LETM1 may alter the efficiency of NCLX function by an indirect mechanism. Following the principles of non-equilibrium thermodynamics (De Stefani et al., 2016), high matrix Na+ concentration is expected to lower the activity of NCLX by decreasing the inward-directed Na+ chemical gradient. Furthermore, reduced monovalent cation translocation from the matrix would imply increased matrix alkalization, which might affect NCLX activity.
Based on the results presented above, we propose that LETM1 participates in Na+ cycling and thereby indirectly modulates Ca2+ fluxes. Indeed, Na+-driven Ca2+ release was proposed to be regulated by the combined activity of the NHE with the NCLX to dissipate excess Na+ or with the HCHX to dissipate excess H+ (Carafoli, 1979). Impairment of the KHE results in K+ and Na+ overload, the latter most likely slowing down the coordinated activities of NHE and NCLX, and thus resulting in decreased Ca2+ efflux. Less KHE activity most likely increases matrix alkalization, this also impinges on the NHE/NCLX. These simplified models, however, cannot account for the myriad of conditions, including changes of the matrix volume, increase of pH and the formation of Ca2+-phosphate precipitation, that play an important role in controlling the mitochondrial Ca2+ buffering capacity in vivo. Experimental systems using isolated cardiac mitochondria supported this notion (Blomeyer et al., 2013, 2016). Accordingly, changes in matrix Ca2+ buffering influence Ca2+ uptake and release, and thus Ca2+ sequestration, a non-negligible component of the mitochondrial Ca2+ cycle. Presumably, perturbations of matrix Na+ or pH also affect mitochondrial Ca2+ dynamics as highlighted earlier. Our results and model are in line with the idea of a mitochondrial Ca2+ cycle, which to maintain steady state, requires several components: MCU, NCLX, NHE, CHX, and KHE (Carafoli, 1979; McCormack and Denton, 1986; Kamer and Mootha, 2015) (Figure 5). Supporting this notion, addition of quinine mimics LETM1 depletion and thus shifts the balance of mitochondrial monovalent cations- increasing matrix K+ and likely matrix Na+. These perturbations significantly reduced mitochondrial Ca2+ efflux, reinforcing the importance of KHE activity for Ca2+ homeostasis. Despite our proposed mechanism of how LETM1 interplays with mitochondrial Ca2+ uptake and release via its role in mitochondrial monovalent cation homeostasis, the role of LETM1 EF hands in relation to osmotic regulation still needs to be addressed. Indeed, the presence of the EF hands has been reported to significantly affect Ca2+ uptake in mammalian systems (Doonan et al., 2014). While it is surprising that a mutation of the LETM1 EF hands can inhibit the Ca2+ uptake activity of MCU, one could speculate that this simple deletion elicits an unforeseen change in structure which prevents the activity or interaction with other crucial protein partners. However, these explanations are speculative and require further detailed investigation. Cell-free assay systems are indeed powerful tools to assess ion fluxes and protein activity. Nevertheless, these are simplified systems capable of reporting the activity of a single protein in isolation. Apparently, LETM1 can exhibit Ca2+/H+ exchange activity in vitro, as demonstrated by Tsai et al. or just recently by Shao et al. (Shao et al., 2016). Other factors crucial to osmotic balance such as the effects of other solute carriers and channels cannot be suitably assessed in these systems. Moreover, experiments to convincingly refute the role of LETM1 in regulating K+/H+ activities under physiologically relevant conditions are lacking. Whereas, experiments such as those by Hashimi et al. (2013) and De Marchi et al. (2014) continue to support the role of LETM1 in the KHE or question the involvement of LETM1 in Ca2+/H+ or Ca2+/Na+ exchange.
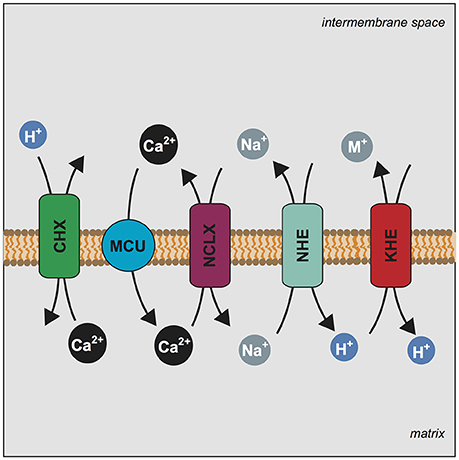
Figure 5. LETM1 dependent Ca2+ efflux is modulated by mitochondrial Na+ homeostasis. Mechanism illustrating the central players of the mitochondrial Ca2+ cycle and the proposed role of LETM1 in Ca2+ homeostasis. Stoichiometry of exchange is ignored for simplicity. Mitochondrial Calcium Uniporter (MCU) (blue circle) conducts the electrophoretic uptake of Ca2+ into mitochondria; this is regulated by members of the MCU core complex (EMRE, MICU1, MICU2). Mitochondrial Ca2+ efflux is executed by NCLX (SLC8B1) (purple rectangle) and the proposed Ca2+/H+ exchanger (CHX) (green rectangle). Na+ homeostasis is further regulated by a mitochondrial Na+/H+ exchanger (NHE) (teal rectangle), which would allow for the efflux of Na+. Additionally, mitochondrial K+/H+ exchange is executed by the KHE (LETM1) (red rectangle) a non-specific exchanger of monovalent cations (M+); the KHE can also extrude Na+. We propose that alteration of KHE activity by modulation of LETM1 levels affects Na+ homeostasis and this ultimately has an effect on Ca2+ release.
Conclusions
We believe our results may well conclude the debate on the fundamental function of LETM1. We have shown that Na+-mediated mitochondrial Ca2+ efflux is susceptible to changes of LETM1-dependent KHE and NHE activity. This confirms once again the central function of LETM1 in mitochondrial osmotic balance and offers explanations for the changes in Ca2+ dynamics observed in vitro. Indeed, by modifying the activity of the KHE and monovalent cation homeostasis, alterations of LETM1 function will affect mitochondrial Ca2+ cycling independently of the expression level of any Ca2+ cycle component.
Author Contributions
SA and KN conceptualized and designed experiments. AM, DD, and MZ synthesized, validated and provided the mitoPOP probe. SA, MT, CP, and JS performed experiments, developed methods and analyzed data. SA, CP, and MT generated figures and performed statistical analyses. SA and KN wrote the manuscript. All authors approved the final version of the manuscript. KN conceived the project and supervised the study.
Conflict of Interest Statement
The authors declare that the research was conducted in the absence of any commercial or financial relationships that could be construed as a potential conflict of interest.
Acknowledgments
The authors wish to thank Paolo Bernardi for helpful discussion, Beate Lichtenberger and Nikolai Holder for proofreading the manuscript. Additionally, we wish to thank S. Farooqui for his support, Kristina Kuehrer for excellent technical support, and M. Groeger and S. Rauscher for their assistance at the Core Facility Imaging of the Medical University of Vienna. This work was funded by a grant from the FWF Austrian Science Fund P24271 to KN. SA is funded by a DOC fellowship of the Austrian Academy of Sciences. MZ and AM were supported by the Italian Ministry of Education, University and Research (MIUR) (PRIN n. 20107Z8XBW_004 and PRONAT project), and by the CNR (Project of Special Interest on Aging and InterOmics project). DD was supported by grants from University of Padova and MIUR.
Supplementary Material
The Supplementary Material for this article can be found online at: https://www.frontiersin.org/articles/10.3389/fphys.2017.00839/full#supplementary-material
Table S1. Primers used in the study listed by gene which is targeted.
Table S2. List of shRNA constructs used, TR311758A is listed as shRNA #1 in this study, while TR311758D is listed as shRNA #2. The exon given is based on the sequence targeted in the accession number given.
Figure S1. Potassium (K+) and ΔΨm dynamics in HeLa cells. After loading with either mitoPOP (green traces) or TMRM (red traces), normalized fluorescence (F/F0) was recorded. When indicated, KCl (A) or sucrose (B) were added. Data are presented as mean ± S.D., n = 10 cells
Abbreviations
ΔΨ, mitochondrial membrane potential; CHX, Ca2+/H+ exchanger; CsA, cyclosporin A; Da, Dalton; DCCD, dicyclohexylcarbodiimide; FCCP, Carbonyl cyanide 4-(trifluoromethoxy)phenylhydrazone; KD, knockdown; KHE, K+/H+ exchanger; KOAc, potassium acetate; MCU, mitochondrial Ca2+ uniporter; mPTP, mitochondrial permeability transition pore; NaOAc, sodium acetate; NHE, Na+/H+ exchanger; OD, optical density; SERCA, sarco/endoplasmic reticulum Ca2+-ATPase; RR, ruthenium red; R360, ruthenium 360; RT, room temperature; SD, standard deviation; SEM, standard error of the mean; TBP, TATA-box-binding protein; WHS, Wolf Hirschhorn syndrome.
References
Baughman, J. M., Perocchi, F., Girgis, H. S., Plovanich, M., Belcher-Timme, C. A., Sancak, Y., et al. (2011). Integrative genomics identifies MCU as an essential component of the mitochondrial calcium uniporter. Nature 476, 341–345. doi: 10.1038/nature10234
Bernardi, P. (1999). Mitochondrial transport of cations: channels, exchangers, and permeability transition. Physiol. Rev. 79, 1127–1155.
Bernardi, P., and Azzone, G. F. (1983). Electroneutral H+-K+ exchange in liver mitochondria. regulation by membrane potential. Biochim. Biophys. Acta 724, 212–223. doi: 10.1016/0005-2728(83)90140-8
Blomen, V. A., Májek, P., Jae, L. T., Bigenzahn, J. W., Nieuwenhuis, J., Staring, J., et al. (2015). Gene essentiality and synthetic lethality in haploid human cells. Science 350, 1092–1096. doi: 10.1126/science.aac7557
Blomeyer, C. A., Bazil, J. N., Stowe, D. F., Dash, R. K., and Camara, A. K. (2016). Mg(2+) differentially regulates two modes of mitochondrial Ca(2+) uptake in isolated cardiac mitochondria: implications for mitochondrial Ca(2+) sequestration. J. Bioenerg. Biomembr. 48, 175–188. doi: 10.1007/s10863-016-9644-1
Blomeyer, C. A., Bazil, J. N., Stowe, D. F., Pradhan, R. K., Dash, R. K., and Camara, A. K. (2013). Dynamic buffering of mitochondrial Ca2+ during Ca2+ uptake and Na+-induced Ca2+ release. J. Bioenerg. Biomembr. 45, 189–202. doi: 10.1007/s10863-012-9483-7
Brierley, G. P., Jurkowitz, M. S., Farooqui, T., and Jung, D. W. (1984). K+/H+ antiport in heart mitochondria. J. Biol. Chem. 259, 14672–14678.
Carafoli, E. (1979). The calcium cycle of mitochondria. FEBS Lett. 104, 1–5. doi: 10.1016/0014-5793(79)81073-X
Carafoli, E., Tiozzo, R., Lugli, G., Crovetti, F., and Kratzing, C. (1974). The release of calcium from heart mitochondria by sodium. J. Mol. Cell. Cardiol. 6, 361–371. doi: 10.1016/0022-2828(74)90077-7
De Marchi, U., Santo-Domingo, J., Castelbou, C., Sekler, I., Wiederkehr, A., and Demaurex, N. (2014). NCLX protein, but not LETM1, mediates mitochondrial Ca2+ extrusion, thereby limiting Ca2+-induced NAD(P)H production and modulating matrix redox state. J. Biol. Chem. 289, 20377–20385. doi: 10.1074/jbc.M113.540898
De Stefani, D., Raffaello, A., Teardo, E., Szabò, I., and Rizzuto, R. (2011). A forty-kilodalton protein of the inner membrane is the mitochondrial calcium uniporter. Nature 476, 336–340. doi: 10.1038/nature10230
De Stefani, D., Rizzuto, R., and Pozzan, T. (2016). Enjoy the trip: calcium in Mitochondria back and forth. Annu. Rev. Biochem. 85, 161–192. doi: 10.1146/annurev-biochem-060614-034216
Doonan, P. J., Chandramoorthy, H. C., Hoffman, N. E., Zhang, X., Cárdenas, C., Shanmughapriya, S., et al. (2014). LETM1-dependent mitochondrial Ca2+ flux modulates cellular bioenergetics and proliferation. FASEB J. 28, 4936–4949. doi: 10.1096/fj.14-256453
Frezza, C., Cipolat, S., and Scorrano, L. (2007). Organelle isolation: functional mitochondria from mouse liver, muscle and cultured fibroblasts. Nat. Protoc. 2, 287–295. doi: 10.1038/nprot.2006.478
Froschauer, E., Nowikovsky, K., and Schweyen, R. J. (2005). Electroneutral K+/H+ exchange in mitochondrial membrane vesicles involves Yol027/Letm1 proteins. Biochim. Biophys. Acta 1711, 41–48. doi: 10.1016/j.bbamem.2005.02.018
Garlid, K. D. (1988a). “Mitochondrial volume control,” in Integration of Mitochondrial Function, eds J. J. Lemasters, C. R. Hackenbrock, R. G. Thurman, and H. V. Westerhoff (Boston, MA: Springer), 259–278.
Garlid, K. D. (1988b). “Sodium/proton antiporters in the mitochondrial inner membrane,” in Cellular Ca2+ Regulation, eds D. R. Pfeiffer, J. B. McMillin, and S. Little (Boston, MA: Springer), 37–46.
Garlid, K. D., Diresta, D. J., Beavis, A. D., and Martin, W. H. (1986). On the mechanism by which dicyclohexylcarbodiimide and quinine inhibit K+ transport in rat liver mitochondria. J. Biol. Chem. 261, 1529–1535.
Hart, L., Rauch, A., Carr, A. M., Vermeesch, J. R., and O'driscoll, M. (2014). LETM1 haploinsufficiency causes mitochondrial defects in cells from humans with Wolf-Hirschhorn syndrome: implications for dissecting the underlying pathomechanisms in this condition. Dis. Model. Mech. 7, 535–545. doi: 10.1242/dmm.014464
Hashimi, H., McDonald, L., Stríbrná, E., and Lukeš, J. (2013). Trypanosome Letm1 protein is essential for mitochondrial potassium homeostasis. J. Biol. Chem. 288, 26914–26925. doi: 10.1074/jbc.M113.495119
Jiang, D., Zhao, L., and Clapham, D. E. (2009). Genome-wide RNAi screen identifies Letm1 as a mitochondrial Ca2+/H+ antiporter. Science 326, 144–147. doi: 10.1126/science.1175145
Jiang, D., Zhao, L., Clish, C. B., and Clapham, D. E. (2013). Letm1, the mitochondrial Ca2+/H+ antiporter, is essential for normal glucose metabolism and alters brain function in Wolf-Hirschhorn syndrome. Proc. Natl. Acad. Sci. U.S.A. 110, E2249–E2254. doi: 10.1073/pnas.1308558110
Kamer, K. J., and Mootha, V. K. (2015). The molecular era of the mitochondrial calcium uniporter. Nat. Rev. Mol. Cell Biol. 16, 545–553. doi: 10.1038/nrm4039
Li, X. Q., Hegazy, M. G., Mahdi, F., Jezek, P., Lane, R. D., and Garlid, K. D. (1990). Purification of a reconstitutively active K+/H+ antiporter from rat liver mitochondria. J. Biol. Chem. 265, 15316–15322.
McCormack, J. G., and Denton, R. M. (1986). Ca-2+ as a 2nd messenger within mitochondria. Trends Biochem. Sci. 11, 258–262. doi: 10.1016/0968-0004(86)90190-8
Mitchell, P. (1966). Chemiosmotic coupling in oxidative and photosynthetic phosphorylation. Biol. Rev. Camb. Philos. Soc. 41, 445–502. doi: 10.1111/j.1469-185X.1966.tb01501.x
Mitchell, P. (2011). Chemiosmotic coupling in oxidative and photosynthetic phosphorylation. 1966. Biochim. Biophys. Acta 1807, 1507–1538. doi: 10.1016/j.bbabio.2011.09.018
Mitchell, P., and Moyle, J. (1969). Translocation of some anions cations and acids in rat liver mitochondria. Eur. J. Biochem. 9, 149–155. doi: 10.1111/j.1432-1033.1969.tb00588.x
Nakashima, R. A., and Garlid, K. D. (1982). Quinine inhibition of Na+ and K+ transport provides evidence for two cation/H+ exchangers in rat liver mitochondria. J. Biol. Chem. 257, 9252–9254.
Nath, S., and Garlid, K. D. (1988). “Lithium Ion is a competitive inhibitor of the Na+ Selective Na+/H+ Antiporter from Mitochondria,” in Integration of Mitochondrial Function, eds J. J. Lemasters, C. R. Hackenbrock, R. G. Thurman, and H. V. Westerhoff (Boston, MA: Springer), 357–364.
Nowikovsky, K., and Bernardi, P. (2014). LETM1 in mitochondrial cation transport. Front. Physiol. 5:83. doi: 10.3389/fphys.2014.00083
Nowikovsky, K., Froschauer, E. M., Zsurka, G., Samaj, J., Reipert, S., Kolisek, M., et al. (2004). The LETM1/YOL027 gene family encodes a factor of the mitochondrial K+ homeostasis with a potential role in the Wolf-Hirschhorn syndrome. J. Biol. Chem. 279, 30307–30315. doi: 10.1074/jbc.M403607200
Palty, R., Silverman, W. F., Hershfinkel, M., Caporale, T., Sensi, S. L., Parnis, J., et al. (2010). NCLX is an essential component of mitochondrial Na+/Ca2+ exchange. Proc. Natl. Acad. Sci. U.S.A. 107, 436–441. doi: 10.1073/pnas.0908099107
Shao, J., Fu, Z., Ji, Y., Guan, X., Guo, S., Ding, Z., et al. (2016). Leucine zipper-EF-hand containing transmembrane protein 1 (LETM1) forms a Ca2+/H+ antiporter. Sci. Rep. 6:34174. doi: 10.1038/srep34174
Tsai, M. F., Jiang, D., Zhao, L., Clapham, D., and Miller, C. (2014). Functional reconstitution of the mitochondrial Ca2+/H+ antiporter LETM1. J. Gen. Physiol. 143, 67–73. doi: 10.1085/jgp.201311096
Wang, T., Birsoy, K., Hughes, N. W., Krupczak, K. M., Post, Y., Wei, J. J., et al. (2015). Identification and characterization of essential genes in the human genome. Science 350, 1096–1101. doi: 10.1126/science.aac7041
Welihinda, A. A., Trumbly, R. J., Garlid, K. D., and Beavis, A. D. (1993). On the regulation of Na+/H+ and K+/H+ antiport in yeast mitochondria: evidence for the absence of an Na(+)-selective Na+/H+ antiporter. Biochim. Biophys. Acta 1144, 367–373. doi: 10.1016/0005-2728(93)90122-V
Keywords: LETM1, mitochondrial cation/proton exchange, mitochondrial volume homeostasis, potassium, sodium, calcium
Citation: Austin S, Tavakoli M, Pfeiffer C, Seifert J, Mattarei A, De Stefani D, Zoratti M and Nowikovsky K (2017) LETM1-Mediated K+ and Na+ Homeostasis Regulates Mitochondrial Ca2+ Efflux. Front. Physiol. 8:839. doi: 10.3389/fphys.2017.00839
Received: 08 June 2017; Accepted: 09 October 2017;
Published: 17 November 2017.
Edited by:
Gyorgy Hajnoczky, Thomas Jefferson University, United StatesReviewed by:
Luca Pellegrini, Laval University, CanadaAmadou K. S. Camara, Medical College of Wisconsin, United States
Shey-Shing Sheu, University of Rochester, United States
Copyright © 2017 Austin, Tavakoli, Pfeiffer, Seifert, Mattarei, De Stefani, Zoratti and Nowikovsky. This is an open-access article distributed under the terms of the Creative Commons Attribution License (CC BY). The use, distribution or reproduction in other forums is permitted, provided the original author(s) or licensor are credited and that the original publication in this journal is cited, in accordance with accepted academic practice. No use, distribution or reproduction is permitted which does not comply with these terms.
*Correspondence: Karin Nowikovsky, karin.nowikovsky@meduniwien.ac.at
†Present Address: Shane Austin, Department of Biological and Chemical Sciences, University of the West Indies, Bridgetown, Barbados
‡These authors have contributed equally to this work.