 Neetu Saini
 Sowmya Lakshminarayanan
 Priyanka Kundu
 Apurva Sarin
- 1Regulation of Cell Fate, Institute for Stem Cell Science and Regenerative Medicine (inStem), Bengaluru, India
- 2Department of Biology, Manipal Academy of Higher Education, Manipal, India
- 3National Centre for Biological Science, TATA Institute of Fundamental Research (TIFR), Bengaluru, India
As the major hub of metabolic activity and an organelle sequestering pro-apoptogenic intermediates, mitochondria lie at the crossroads of cellular decisions of death and survival. Intracellular calcium is a key regulator of these outcomes with rapid, uncontrolled uptake into mitochondria, activating pro-apoptotic cascades that trigger cell death. Here, we show that calcium uptake and mitochondrial metabolism in murine T-regulatory cells (Tregs) is tuned by Notch1 activity. Based on analysis of Tregs and the HEK cell line, we present evidence that modulation of cellular calcium dynamics underpins Notch1 regulation of mitochondrial homeostasis and consequently anti-apoptotic activity. Targeted siRNA-mediated ablations reveal dependency on molecules controlling calcium release from the endoplasmic reticulum (ER) and the chaperone, glucose-regulated protein 75 (Grp75), the associated protein Voltage Dependent Anion Channel (VDAC)1 and the Mitochondrial Calcium Uniporter (MCU), which together facilitate ER calcium transfer and uptake into the mitochondria. Endogenous Notch1 is detected in immune-complexes with Grp75 and VDAC1. Deficits in mitochondrial oxidative and survival in Notch1 deficient Tregs, were corrected by the expression of recombinant Notch1 intracellular domain, and in part by recombinant Grp75. Thus, the modulation of calcium dynamics and consequently mitochondrial metabolism underlies Treg survival in conditions of nutrient stress. This work positions a key role for Notch1 activity in these outcomes.
Introduction
Cell survival depends on the availability of nutrients in the immediate environment and this can be a particular challenge in the immune system, where the cells are mobile and must move between regions of plentiful nutrients and sites where these might be limited (1, 2). The differentiation and survival of T-cell subsets is exquisitely dependent on cytokines, which control nutrient uptake in these cells and are thought to regulate cellular responses to environmental stress (3–5). Hence, the T-cell lineage offers a rich system to interrogate molecular mechanisms that regulate well-documented differences in survival outcomes in T-cell subsets.
In earlier work, we showed that Notch1 activity in Foxp3+ Tregs in the mammalian immune system, protects mitochondria from damage and promotes survival in cytokine (nutrient)-deprived culture conditions (5). Recapitulating these observations in mammalian cell lines, ligand-activated Notch1 intracellular (NIC)1 domain activity when enforced from the cytoplasm, conferred protection from apoptotic stimuli, including those targeting mitochondrial integrity (6–8). Notch signaling is a conserved pathway, initiated by interactions with ligand, and culminating in the release of the signaling active intermediate – NIC1 - from its full-length membrane-tethered precursor (9–12). While Notch signaling predominantly activates transcription, there is increasing evidence of non-transcriptional or non-canonical outcomes of this pathway (13–17). In many contexts, this is linked to NIC1 activity from different subcellular locations (13, 15, 18, 19).
Calcium is a well-known second messenger implicated in diverse signaling processes (20–24). While mitochondrial health is critically controlled by calcium, mitochondria reciprocally regulate the intracellular distribution of calcium. Thus, apoptotic signaling frequently correlates with changes in the levels and distribution of cellular calcium pools (24–27). Mitochondria are dynamic organelles whose shape and function respond to different physiological conditions by fusion, fission or biogenesis (27–30). The chaperone glucose related protein 75(Grp75) and voltage dependent anion channel (VDAC)1 are conduits for mitochondrial uptake of calcium, released from the major store of cellular calcium, the endoplasmic reticulum (ER) (31–33). VDAC1 interacts with Inositol 1,4,5-trisphosphate receptor(IP3R)3 on the ER via Grp75, at sites where mitochondria and ER are in close proximity, which results in localized elevations in calcium, facilitating uptake by mitochondria (33, 34). Mitochondria play many roles in cellular calcium homeostasis, including, calcium sequestration, activation of calcium dependent dehydrogenases, or, the activation of apoptotic pathways, which are coordinated by mitochondria, to name a few (27, 35, 36). The basal entry of calcium into mitochondria is required for diverse metabolic processes (37, 38). Controlled calcium uptake in mitochondria increases ATP production by activating calcium dependent dehydrogenases including pyruvate dehydrogenase (PDH), α-ketoglutarate dehydrogenase (α-KGDH), and isocitrate dehydrogenase (IDH) (39, 40). Many apoptotic stimuli cause calcium release from the ER to activate apoptotic cascades (41). Rapid overloading of calcium in mitochondria from the cytoplasm facilitates the opening of permeability transition pore followed by a loss of mitochondrial transmembrane potential (MTP) and release of cytochrome c and other pro-apoptogenic intermediates, which are usually sequestered in mitochondria (27). Bcl2 family anti-apoptotic proteins reduce free calcium levels in the ER (42, 43). Conversely, Bcl2 may increase uptake of calcium in mitochondria and compromised mitochondrial membrane potential has been shown to abrogate Bcl2 activity (44, 45).
It is increasingly appreciated that metabolic reprogramming is key to the differentiation of T-cell subsets (46, 47). In mammals, the functional maturation of T-cells in response to antigen, is a defining event in the adaptive immune response (48). The differentiation of T-cell subsets, is linked to programs initiated during immune activation, which in turn, are dependent on mitochondrial activity (49). Natural Tregs – where we have demonstrated a role for Notch1 activity - depend on fatty acid oxidation for function, although glycolysis is important in the initial responses to antigen. Cross-talk with the Notch1 pathway has been demonstrated with metabolic mediators and pathways that play critical roles in specialized T-cell subsets, especially Tregs (50–52). Here we explore the role of Notch1 in the regulation of metabolic (mitochondrial) activity vis-à-vis organellar calcium homeostasis, and IL-2 independent Treg survival.
Materials And Methods
Mice
The Notch1lox/lox (Notch1+/+) and Cd4-Cre::Notch1lox/lox (Notch1-/-) strains were a gift from Freddy Radtke (École Polytechnique Federale de Lausanne (EPFL), Switzerland) (53). C57BL/6J was obtained from the Jackson Laboratory. Tregs were isolated from spleens of 8-12 weeks old mice. Two spleens were pooled for the isolation of 2 million Tregs. Breeding colonies were maintained in-house in controlled temperature and light environments, in high barrier conditions, and in controlled systems (individually ventilated cages). Colonies were routinely monitored for the full pathogen panel recommended by the Federation of Laboratory Animal Science Associations. All experimental protocols were approved by the Institutional Animal Ethics Committee (INS-IAE-2019/07(R1)) and complied with the norms of the Committee for the Purpose of Control and Supervision of Experiments on Animals, Government of India.
Cells
The HEK293T (HEK) cell line was from American Type Culture Collection (ATCC) (Manassas, VA, USA) and maintained in DMEM-CM containing Dulbecco’s Modified Eagle’s Medium (DMEM) (GIBCO, Life Technologies, Carlsbad, CA, USA) supplemented with 0.1% penicillin/streptomycin and 10% heat-inactivated fetal bovine serum (Scientific Hyclone TM, Waltham, MA, USA) at 37°C with 5% CO2. T cells were cultured in RPMI 1640 (GIBCO, Life Technologies, Carlsbad, CA, USA) supplemented with 0.1% penicillin/streptomycin with5% heat-inactivated fetal bovine serum (RPMI-complete medium) at 37°C with 5% CO2. Mycoplasma contamination in the cultures was routinely tested using the MycoAlertTM Mycoplasma Detection Kit (Lonza, Basel, Switzerland).
Chemical and Antibodies
Thapsigargin (TG, T9033), flurorcarbonyl cyanide phenylhydrazone (FCCP, C2920), oligomycin (75351), rotenone (R8875), antimycin A (A8674), MKT-077 (M5549), 2-deoxy glucose (D8375), and histopaque (10831) were purchased from Sigma-Aldrich (St. Louis, MO, USA). γ-Secretase Inhibitor X (GSI-X, 565771), Ru360 (557440), and puromycin (508838) were from Calbiochem-Merck Millipore (Darmstadt, Germany). Xestospongin C (1280) was purchased from Tocris (Abingdon, UK). Dharmafect-1 and siRNA to scrambled control (D-0018010), MCU (L-015519), VDAC1 (L-019764), Grp75 (L-004750), IP3R3 (L-006209) and MFN2 (L-012961) were from Dharmacon (Lafayette, CO, USA). Antibodies to PDH (C54G1, 3205), MCU (D2Z3B, 14997S), Vps34 (D9A5, 4263) were from Cell Signaling Technology (MA, USA). Antibodies to Grp75 (JG1, Ab2799), VDAC1 (20B12AF2, Ab14734), pPDH (EPR12200, Ab177461) and Notch1 (mN1A, 128076) were from Abcam (Cambridge, UK). Antibody to MFN2(XX-1) was from Santa Cruz (Texas, USA). Antibody to IP3R3 was from Merck Millipore (Darmstadt, Germany). Antibodies to Actin (ACTN05, MS-1295-P), Tubulin (MS-581-P0), Normal mouse IgG (NC-1255-P1), and Normal rabbit IgG (NC-100-P1) were from Neomarker (Fremont, CA, USA). Trizol (15596026) and SYBR™ Green Master Mix were from Thermo Scientific (Waltham, MA, USA). PrimeScript 1st strand cDNA Synthesis Kit (6110A) was purchased from Takara Bio (Shiga, Japan).
Plasmids
Human Bcl-xLRFP plasmid was a gift from Richard J. Youle (National Institutes of Health, Bethesda, MD). NFLGFP was a gift from Freddy Radtke (École Polytechnique Federale de Lausanne (EPFL), Switzerland). pBABE, pBABE-NIC-NLS and pBABE-NIC-NES were kind gifts from B.A. Osborne (University of Massachusetts/Amherst, MA, USA). D1ER and 2mtD3cpv probe were a kind gift from Roger Y Tsien (42, 54).
NIC1-GFP was prepared by sub-cloning NIC1 gifted by J. Aster (Harvard Medical School, Boston) into pEGFP-C1 (BD Clontech, CA, USA). NIC1-RFP has been described earlier (5). sJagged was obtained from Upstate Biotechnology (MA, USA). Human Grp75 Tagged ORF Clone was obtained from Origene (RG201397, MD, USA) and sub-cloned into pBABE vector. Following primers were used for sub-cloning:
NIC1-GFP EcoR1 Forward: 5’-ACTGAATTCTATGCGGCGGCAGCAT-3’
NIC1- GFP BamHI Reverse: 5’-AATGGATCCCTTGAAGGCCTCCGG-3’
Grp75 BamHI Forward: 5’-ATAGGATCCATGATAAGTGCCAGCCGA-3’
Grp75 Sal I Reverse: 5’-ATAGTCGACTTACTGTTTTTCCTCCTTTTGA-3’
Construct sequences were verified by automated Sanger sequencing conducted in-house.
Isolation of T-Cell Subsets
CD4+CD25+ Tregs and CD4+ naïve T-cells were isolated from murine spleens as previously described (5). For the isolation of ~2 million Tregs, single-cell suspensions from two spleens were generated by dissociating the organs to release cells in PBS, applying gentle but consistent pressure using the back of a syringe plunger. Cells were centrifuged and the red blood cells were lysed by gentle resuspension and vortexing the loosened cell pellet in 1 ml ACK lysis buffer (150 mM NH4Cl, 10 mM KHCO3, and 0.1 mM Na2EDTA) for 1 min. The ACK cell suspension was diluted with excess medium and centrifuged at (500g). The cell pellets was washed with excess medium twice to obtain RBC-free lymphocytes. CD4+CD25+ Tregs and CD4+ naïve T-cells were isolated from the total lymphocyte pool using the Dynabeads FlowComp Mouse CD4+CD25+ Treg cells Kit (11463D, Invitrogen) and MagniSort Mouse CD4 naïve T-cell enrichment Kit (8804-6824-74, Invitrogen), respectively, following manufacturer’s instructions. Tregs (CD4+CD25+) and CD4+naïve T-cells were activated with 20 μl of magnetic beads coated with antibodies to CD3 and CD28 for 40 h and used in experiments. Isolated CD4+CD25+ cells were routinely immuno-stained with antibody against Foxp3 and analyzed using Olympus IX70 wide-field fluorescence or Olympus FV3000 confocal microscope. On an average 85-90% or more CD4+CD25+ cells were Foxp3+ when tested by immune-staining.
Transfections
0.25x10⁶ HEK cells were seeded in tissue culture grade 35 mm dishes (Greiner Bio-one, Kremsmünster, Austria). Transfection with siRNA or plasmids was performed when cultures were 50-60% confluent (24 h post-plating). 100 nM siRNA or plasmids were transfected using Dharmafect and Lipofectamine-2000 or Fugene HD as per the manufacturer’s instructions when cultures were 50–60% confluent (24 h post-plating). Cells transfected with siRNA were incubated for 24–26 h and then harvested by trypsinization and re-plated for transfection with plasmids. Plasmids were transfected using Lipofectamine 2000 or Fugene HD at the following concentrations: NIC1-GFP (2 µg), NIC1-RFP (2 µg), pEGFP-N3 (1 µg), Bcl-xL RFP (1.5 µg), NIC1-NES GFP (2 µg), NIC1-NLS GFP (2 µg) NFL-GFP (2 µg), s-Jagged (2 µg), or 2mtD3cpv (1 µg), pCL-Eco (1.5 µg), pBABE-Grp75 (1.5 µg), pBABE-NIC1-NES (1.5 µg). Total DNA transfected in the different transfection groups was equalized with pcDNA3.
Retrovirus Transduction
Retrovirus transduction was performed as described (5). Briefly, retroviruses containing the plasmid of interest were packaged in HEK cells using the packaging vector pCL-Eco. HEK cells were co-transfected with pCL-Eco and the plasmid containing gene of interest using X-tremeGENE HP. Viral supernatants were harvested two days post-transfection and concentrated by centrifugation at 21000 g for 1.5 h at 4°C. Viral supernatants were stored at -80°C when not used immediately for a maximum of 14 days. Tregs were activated as described earlier for 24 h with anti-CD3 and CD28 bound magnetic beads in 24 well plates. For retroviral infection, 700 µl of culture medium from Tregs was replaced with an equal volume of concentrated virus in RPMI-CM containing 10 mM HEPES and 8 µg/ml sequabrene, and the plate was centrifuged at 600 g for 90 min at 25°C. Post centrifugation, 700 µl of medium was replaced with RPMI-CM supplemented with 1 µg/ml of IL-2 and cells continued in culture. After a further 24 h, beads were removed by magnetic separation and cells were cultured in RPMI-CM supplemented with IL-2 (1 µg/ml) for another 18–24 h. Cells were harvested and continued (0.5X10⁶/ml) in RPMI-CMcontaining IL-2 (1 µg/ml) and the antibiotic puromycin (1 µg/ml) for 48 h to enrich transfected cells. After 48 h, live cells were collected by centrifugation on histopaque (1.083 g/ml density) at 300 g for 20 min at 25°C and washed twice in RPMI-CM. Cells were cultured for another 24 h in RPMI-CM containing IL-2 (1 μg/ml) and IL-7 (2 ng/ml) and used in functional assays or for metabolic analysis.
Induction of Apoptosis and Assays for Cellular Damage
Activated Tregs were washed three times with PBS and 0.3x10⁶ cells/well were cultured in a 48 well plate for 24 h. Notch1-/- Tregs infected with pBABE, pBABE NIC-NES and pBABE Grp75 were analyzed as one unit, with data reported in separate figures as indicated in the legends to figures. Cells were harvested and stained with Hoechst 33342 (1 μg/ml), and samples were scored for nuclear damage using fluorescent microscope (Olympus BX-60). Samples were blinded for the experimenter and approximately 200 cells in 5 random fields were scored for apoptotic damage. 0.5x10⁶ activated Tregs were incubated with DiOC6 (40 nM) diluted in PBS for 10 min at 37°C protected from light. After 10 min, cells were given three washes with pre-warmed (37°C) PBS to remove excess dye and immediately analyzed using BD FACS Fortessa flow cytometer.
RT PCR Analysis
3x10⁶ Tregs cells were lysed in 1ml of TRIzol and RNA isolation was performed according to the manufacturer’s instructions. 1 µg RNA was used for cDNA synthesis using PrimeScript 1st strand cDNA Synthesis Kit (Takara Bio). cDNA was diluted in 1:5 ratio and real-time PCR was performed using Maxima™ SYBR Green qPCR Master Mix and Bio-Rad CFX96 Touch™ Real-Time PCR Detection System. Relative change in transcript levels was calculated using 2–ΔΔCt method using glyceraldehyde 3-phosphate dehydrogenase (GAPDH) or Actin as reference gene.
Primers used for RT PCR against Human genes: Forward (5’–3’); Reverse (5’–3’)
GAPDH: TGCACCACCAACTGCTTAGC; GGCATGGACTGTGGTCATGAG
MCU: ACCGGACGGTACACCAGAG; GATAGGCTTGAGTGTGAACTGAC
VDAC1: CTCCCACATACGCCGATCTT; GCCGTAGCCCTTGGTGAAG
Grp75: TGTGGCCTTTACAGCAGATG; ATCACCCGAAGCACATTCAG
IP3R3: CTGGTGTTCTTTGTCAGCGA; TTCTGCTCCCTCATCAGCTT
Primers used for RT PCR against Murine gene: Forward (5’–3’); Reverse (5’–3’)
Notch1: GGAAGCACCCTTTAGGTTGGA; AGTGGTCCAGGGTGTGAGTGT
Actin: TGGGTCAGAAGGACTCCTATG; CAGGCAGCTCATAGCTCTTCT
MCU: GAGCCGCATATTGCAGTACGGT; AAACACGCCGACTGAGTCAGAG
VDAC1: AGTGACCCAGAGCAACTTCGCA; CAGGCGAGATTGACAGCAGTCT
Grp75: GTTGGTATGCCAGCAAAACGGC; CAAGCATCACCATTGGAGGCAC
IP3R3: GCAACCACATCTGGACGCTCTT; AGAAGGCACTGATGGTGTCCAG
Passive Store Depletion (PSD) Assay
Measures of Ca2+ dynamics were all performed in Ca2+-free medium. HEK cells, pre-treated with the siRNA, were transfected with NIC1-RFP or control RFP using Fugene HD as described above. Cells expressing RFP or NIC1-RFP were loaded with 3.5 μM of Fluo4-AM or Indo-1-AM dye, 0.002% Pluronic F-127 in DMEM-CM for 20 min in humidified 5% CO2, 37 °C incubator in the dark. After incubation, cells were washed with PBS and imaged in calcium free media. Time lapse images of cells loaded with Fluo4-AM were acquired every 10 s for 6 min using 488 nm excitation and 505 nm emission on an Olympus IX70 wide field fluorescence microscope with 60X, NA 1.4 oil objective before and after addition of 2 µM TG. Time lapse images of cells loaded with Indo-1 dye were acquired every 10 s for 6 min using Epifluor optics (Nikon TE 2000 inverted wide field microscope) with 60X, NA 1.4 oil objective. Indo-1 was excited using 365/10 exciter and emission collected by D405/30 and D485/25. The images were analyzed and quantified for the intensities using Image J software.
Assessment of Free Calcium in ER and Mitochondria
Analysis of free calcium in ER and mitochondria were performed using FRET based D1ER and 2mtD3cpv probes, respectively. 0.2x10⁶ HEK cells were plated onto the cut dishes with microscopy grade coverslip. Next day, cells were transfected with 2mtD3cpv or D1ER with NIC1-RFP, Bcl-xL-RFP, or RFP using Fugene-6 HD. 36 h post transfection, the cells were imaged using Zeiss LSM 510 Meta, Plan apochromat 63X oil, NA 1.42 with FRET module. Probes were excited with 458 nm laser and the emission was collected by BP (470-500) for CFP and BP (510-550) for FRET. The images were captured in time-lapse mode for 3-4 min. YFP and CFP fluorescence were quantified after removing the background signal by the thresholding the image using Image J software.
Seahorse-Based Analysis
Oxygen consumption rate (OCR) and extracellular acidification rate (ECAR) were measured using Seahorse XFe24 bioanalyzer. Seahorse culture plate were coated with 1 mg/ml poly-D lysine in PBS for 30 min at room temperature and then washed twice with PBS. ~0.3x10⁶ activated Tregs or T-effectors were plated onto the poly-D lysine coated Seahorse culture plate in Seahorse RPMI XF media containing 2 mM L-glutamine, 10 mM sodium pyruvate and 10 mM glucose for OCR analysis or Seahorse RPMI XF media containing 2 mM L-glutamine for ECAR analysis. Cells were incubated for 45 min at 37°C in a humidified non-CO2 incubator before OCR and ECAR analysis. OCR and ECAR were measured at baseline and in response to the following inhibitors: 1.25 µM oligomycin, 1 µM FCCP, and 1 µM rotenone and antimycin A for OCR analysis and 10 mM glucose, 1.25 µM oligomycin, 50 mM 2-deoxyglucose for ECAR. Four wells in each plate containing Seahorse RPMI XF media were used as background. Notch1-/- Tregs infected with pBABE, pBABE NIC-NES and pBABE Grp75 were analyzed together, with data reported in separate figures as indicated in figure legends. Basal respiration = OCR before oligomycin addition– Last OCR after Rotenone + AntimycinA addition. Maximum respiration= Maximum OCR after FCCP addition – Last OCR after Rotenone + AntimycinA addition.
Immunofluorescence Analysis
Cells were plated on poly-D-lysine coated dishes (1 mg/ml poly-D-lysine in PBS coated for 15 min at room temperature) for 10 min and fixed with 2% paraformaldehyde (freshly reconstituted) for 20 min in the dark at room temperature. For Grp75 and Foxp3, cells were permeabilized using 0.2% Triton-X 100 and 0.2% NP-40, respectively, for 10 min at room temperature. Cells were incubated with Grp75 (1:100) antibody diluted in 5% BSA in PBS or with 5% BSA in PBS for secondary control and incubated overnight at 4°C. The next day, cells were washed two times with PBS and incubated with secondary fluorescence-conjugated antibody (1:500) for 1 h in the dark at room temperature. Cells were washed twice with PBS and stained with Hoechst 33342 (1 μg/ml) for 10 min and ten random fields were imaged using Olympus FV3000 as Z-stacks (1.0 µm, 3X zoom); Plan-Apochromat 63X NA 1.35 oil-immersion objective. Images were processed to remove background based on secondary controls.
Immunoprecipitation and Western Blotting
Activated 4x10⁶ Tregs cells cultured for 6 h without IL-2 in RPMI-CM, were lysed for 30 min at 4°C on a rotational cell mixer in RIPA buffer containing 1% NP-40, 5% glycerol, 50 mM Tris, 1 mM NaCl, and 1 mM EDTA and supplemented with aprotinin, leupeptin, and pepstatin (2 μg/ml each), 10 μM MG132, 1 mM PMSF, 1 mM NaF, and 1 mM Na3VO4. After lysis, lysates were centrifuged at 1500 g for 5 min to remove cell debris, and supernatants were incubated with antibody (6 μg) or IgG control (6 μg) for 16-18 h at 4°C on a rotational cell mixer. The Immune complexes were then incubated with Sepharose G/A plus bead slurry for 3 h at 4°C on a rotational cell mixer. Beads bound to complexes were washed three times by adding ice-cold PBS followed by centrifugation at 300 g for 2 min. Finally, beads were boiled in SDS lysis buffer containing protease inhibitors for 10 min and analyzed by western blot. 0.3 x 10⁶ Tregs or 0.1x10⁶ HEK cells were pelleted down by centrifugation at 1000 g for 5 min at room temperature and 25 µl of SDS lysis buffer (2% SDS, 10% glycerol, 0.002% bromophenol blue, 200 mM DTT and 50 mM Tris-Cl pH 6.8) containing a protease inhibitor cocktail - aprotinin, leupeptin and pepstatin (2 μg/ml each), 1 mM PMSF, 1 mM NaF, 1 mM Na3VO4 and 10 μM MG132 was added to the pellet. The tube was vortexed for 20-30 s and incubated at 100°C for 10 min. Cell lysates were immediately resolved by SDS-PAGE and transferred to nitrocellulose membrane (GE Healthcare, Chicago, USA) and blocked with 5% non-fat dried milk in Tris-buffered saline–Tween 20 (TBST), and incubated overnight at 4°C with primary antibodies at the following concentration: Grp75 (1:500), Notch1 (1:500), VDAC1 (1:500), Vps34 (1:500), MCU (1:500), pPDH (1:500), PDH (1:500), Actin (1:1000) and Tubulin (1:1000) diluted in 5% non fat dried milk in TBST. After incubation with primary antibodies, membranes were washed three times with TBST followed by incubation with horseradish peroxidase–conjugated secondary antibody (1:1000 dilutions) for 1 h at room temperature. After incubation with secondary antibody, membranes were washed three times with TBST. Membranes were developed using Super Signal West Dura substrate (Thermo Scientific), and images were acquired using iBright FL1000 Invitrogen. Densitometric analysis of western blots was performed using Image J software.
Statistical Analysis
Data are represented as mean ± standard deviation (Mean ± SD) derived for two or three independent experiments. Statistical significance was measured using unpaired student’s t-test and p-values ≤0.05, ≤0.01 and ≤0.001 were considered to be statistically significant. p-value >0.05 were considered non-significant (ns).
Ethical Approval
All experimental protocols involving mice were approved by the Institutional Animal Ethics Committee (INS-IAE-2019/07(R1)) and complied with the norms of the Committee for the Purpose of Control and Supervision of Experiments on Animals, Government of India.
Results
Notch1 Signaling Modulates Mitochondria Metabolism in Tregs
Tregs constitutively express the cytokine Interleukin-2 (IL-2) receptor, CD25, and the transcription factor Foxp3 (55, 56). We have shown that ligand-dependent Notch1 activity in activated Tregs, regulates their IL-2-independent survival (5). Thus, unlike cells isolated from Notch1lox/lox Cre-ve, mice, CD4+Foxp3+CD25+ cells isolated from mice with a targeted ablation of Notch1 (Cd4-Cre::Notch1lox/lox mice), in the mature T-cell compartment, will undergo apoptosis if cultured without cytokine (Figures 1A, B). However, the recovery of viable (Cre-ve) Notch1+/+ and (Cre+ve) Notch1-/- Tregs from activation protocol is comparable (Figure 1C), ruling out deficits in responses to T-cell receptor dependent activation. Nonetheless, small but consistent differences in mitochondrial transmembrane potential between activated Tregs of the two genotypes (Figure 1D), prompted an assessment of metabolic profiles of Tregs. Seahorse based analysis of (Cre-ve) Notch1+/+ and (Cre+ve) Notch1-/- Tregs revealed that as compared to (Cre-ve) Notch1+/+ cells, oxidative phosphorylation (Oxphos), was blunted in (Cre+ve) Notch1-/- Tregs (Figure 1E, red trace at baseline). Notch1-/- Tregs also had reduced respiratory reserve, indicated by the poor recovery following FCCP treatment (Figure 1E). Notably, glycolysis was comparable, with the Notch1-/- cells, presenting marginally elevated activity relative to Notch1+/+ cells (Figure 1F). On the other hand, when T-effector subsets, generated by activating CD4+ naïve T-cells in culture (Figure 1A), from the two genotypes, were compared, metabolic profiles of (Cre-ve) Notch1+/+ and (Cre+ve) Notch1-/- T-effectors were comparable (Figure 1G and Supplementary Figure S1). Thus, Notch1 regulation of mitochondrial metabolism is not a generalized feature of the T-cell lineage.
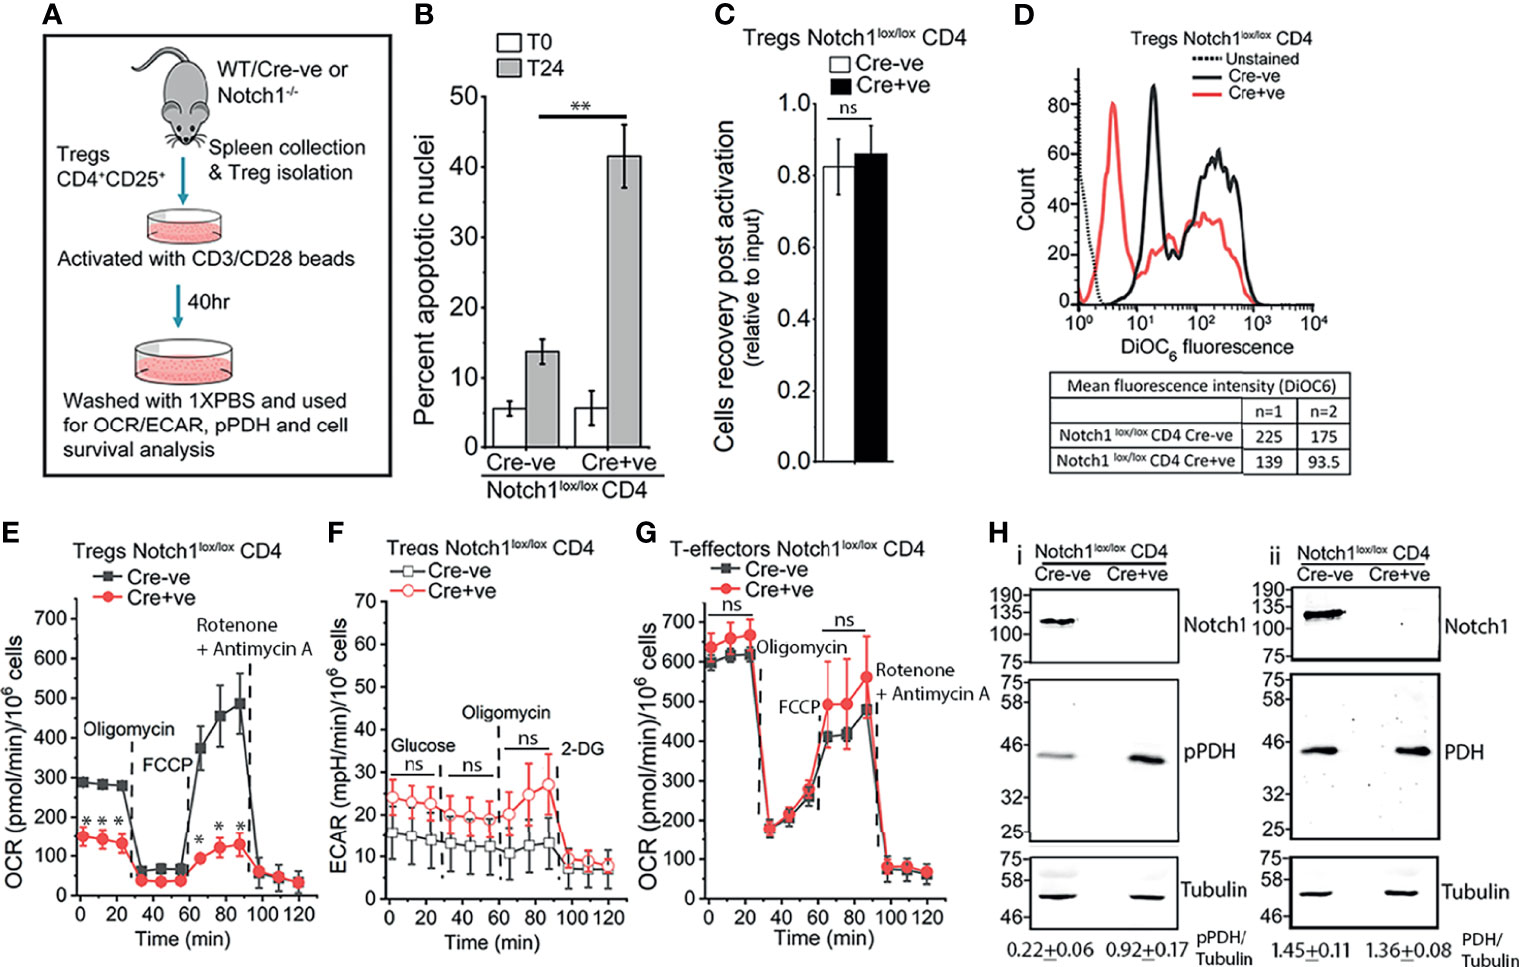
Figure 1 Notch1 signaling regulates mitochondrial metabolism in Tregs. (A) Experimental protocol for Tregs activation. (B) Percent apoptotic nuclei in activated Notch1+/+ (Cre-ve; Notch1lox/lox) and Notch1-/- (Cre+ve; Cd4-Cre::Notch1lox/lox) Tregs at onset (T0), and after 24 h culture (T24) in medium without IL-2. (C) Cell recoveries in the two genotypes at the end of the 40 h activation protocol. (D) Representative histogram overlay and mean fluorescent intensity (MFI) of DioC6 in freshly activated Notch1+/+ (black) and Notch1-/- (red) Tregs. The dotted line indicates unstained Tregs. (E) Oxygen consumption rate (OCR) in activated Notch1+/+ ( ) and Notch1-/- (
 ) Tregs at baseline and following sequential addition of 1.25 μM Oligomycin, 1 μM FCCP and 1 μM Rotenone + 1 μM Antimycin A. (F) Extracellular acidification rate (ECAR) in activated Notch1+/+ (
 ) and Notch1-/- (
 ) Tregs at baseline and in response to sequential treatment with 10 mM glucose, 1.25 μM oligomycin and 50 mM 2-deoxyglucose. (G) OCR measured in CD4+ naïve T-cells isolated from Notch1+/+ () or Notch1-/- () mice and activated as shown in A, in response to 1.25 μM Oligomycin, 1 μM FCCP and 1 μM Rotenone + 1 μM Antimycin A. (H) Representative immunoblots of whole cell lysates from activated Notch1+/+ and Notch1-/- Tregs. Lysates were divided into two and analyzed in parallel. Membranes were probed either for pPDH, Notch1, and Tubulin (H–I) or PDH, Notch1, and Tubulin (H-ii). The immunoblots are representative of three independent experiments. The densitometry analysis (Mean ± SD from three independent experiments) of pPDH and PDH relative to Tubulin are shown below the immunoblots. The same pool of activated Tregs was tested in (E, F). In (E–G), plots shown as mean ± SD of readings in triplicate wells and are representative of two separate experiments. * and ** denote significant differences with p-value ≤ 0.05 and ≤0.01 respectively, ns: not significant, examined using the unpaired student’s t-test.
Calcium regulation of mitochondrial metabolic activity is well established (40). Hence, we compared calcium-sensitive phosphorylation of the enzyme Pyruvate Dehydrogenase (PDH) in the two genotypes. Substantially higher levels of phosphorylated (p)PDH, were detected by western blot analysis of cell lysates in (Cre+ve) Notch1-/- Tregs (Figure 1Hi, lane 2) as compared to (Cre-ve) Notch1+/+ (Figure 1Hi, lane 1), which suggests reduced level of free calcium in mitochondria. Total PDH is comparable in the cells of the two genotypes (Figure 1Hii, row 2). In order to directly assess organelle calcium and explore underlying molecular interactions, we used the mammalian cell line HEK, in which Notch1 activated signaling has been previously characterized (6–8).
NIC1 Signaling Regulates ER Calcium`
The ER lumen is the major store of free calcium (57). The passive store depletion (PSD) assay (58) was deployed to assess the effects of Notch1 activity, if any, on the release of calcium into the cytoplasm in response to an ER destabilizing trigger. HEK cells expressing processed NIC1 or a control vector were loaded with the calcium sensitive dye Fluo-4, and assessed in the PSD assay, performed in calcium free media (Figure 2, Schematic-I). The addition of Thapsigargin (TG), the ER calcium re-uptake inhibitor, resulted in a rapid, characteristic rise of calcium (increase in fluorescence) in the cytoplasm of control (RFP expressing) cells (Figure 2A, black trace). The dissipation that follows, is a result of the release of calcium into the extracellular medium (59, 60). However, only a marginal increase in fluorescence - release of calcium from the ER store - was observed in cells expressing NIC1, following the addition of TG (Figure 2A, red trace). This can result from reduced calcium in the ER lumen or a deficit in the machinery by which calcium is released into the cytoplasm from the ER.
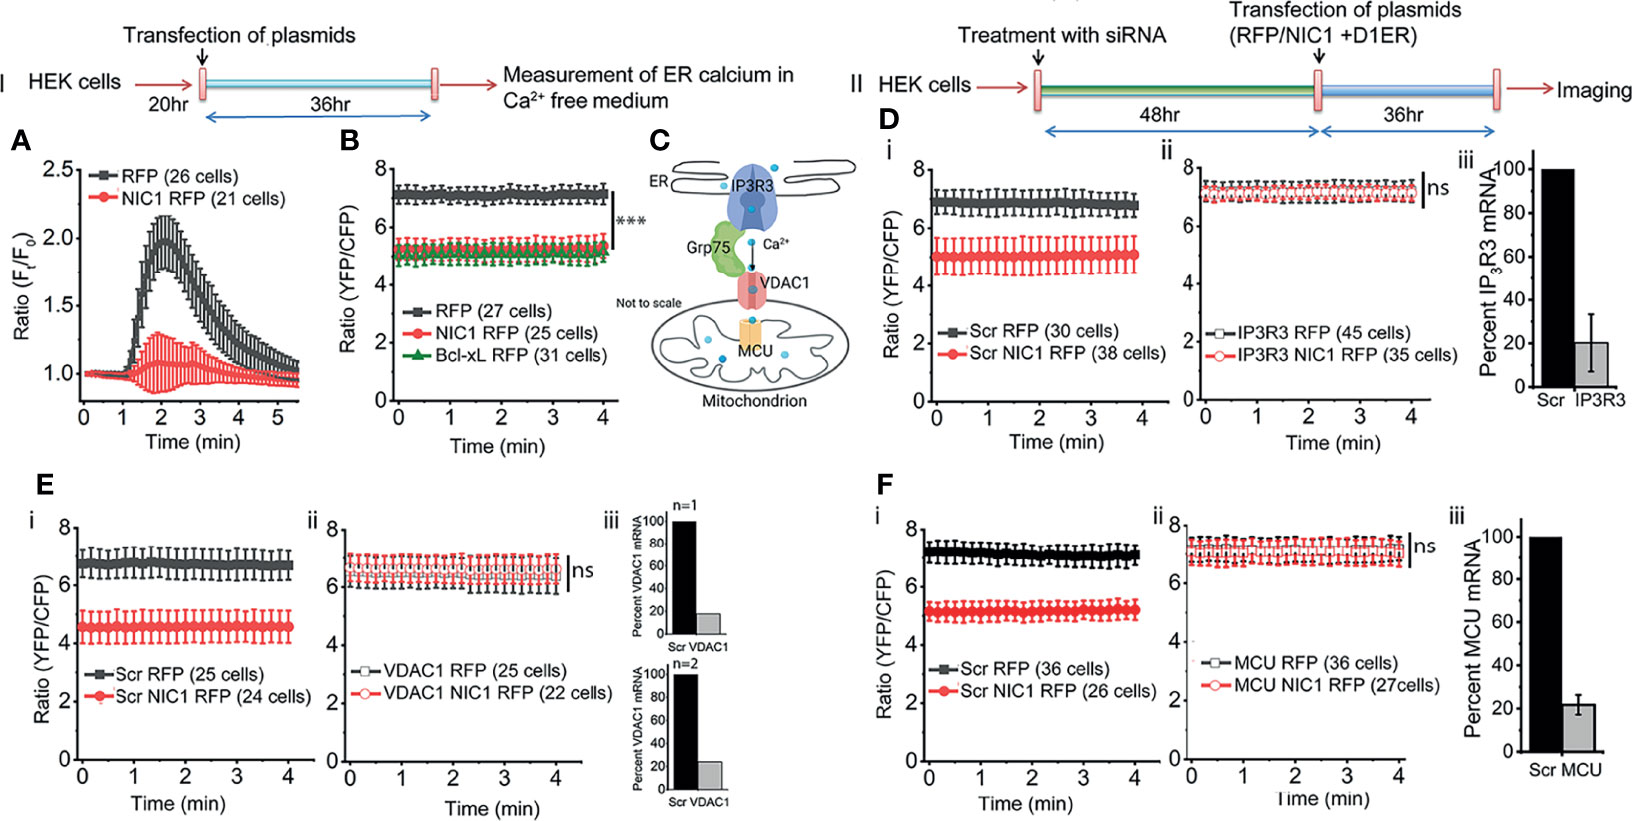
Figure 2 NIC1 signaling regulates ER calcium levels. Schematic (I) Timeline of experiments assessing changes in ER calcium levels. Schematic (II) Timeline of experiments, in cells treated with siRNA before assessing changes in ER calcium levels. (A) Fluo4 fluorescence in HEK cells expressing NIC1-RFP () or RFP (), at time-t (Ft) relative to onset (F0) measured in calcium free medium at baseline and in response to 2 μM TG. (B) YFP/CFP ratio in HEK cells co-transfected with D1ER and NIC1-RFP () or, Bcl-xL-RFP ( ) or, RFP () and cultured for 36 h before imaging. (C) Schematic (not to scale) depicting - IP3R3, Grp75, VDAC1 and MCU- in the context of ER and mitochondria. (D–F) Ratio of YFP/CFP fluorescence in HEK cells, imaged 36 h after co-transfection with D1ER and NIC1-RFP () or RFP (), in cells pre-treated with siRNA to IP3R3 (D-ii) or VDAC1 (E-ii) or MCU (F-ii) or scrambled control (D-F-i, NIC1-RFP () and RFP (). (D–F iii) Percent mRNA levels of the genes as shown in panels, in cells treated with siRNA to IP3R3 (D, N=3) or VDAC1 (E, N=2) or MCU (F, N=3) and scrambled control. Data plotted as mean ± SD of the indicated number of cells in 6-12 fields across three (A, D, F) or two (B, D) independent experiments. *** indicates significant difference at all time points with p-values ≤0.001 and ns: not significant, examined using unpaired student’s t-test.
Next, an assay that provides direct readout of levels of free calcium in the ER lumen was performed. This assay compared cells expressing the ER localized FRET-based calcium sensor, D1ER (42) co-transfected with NIC1-RFP or with RFP (Figure 2, Schematic-II). At steady state, i.e. in cells held in culture with no additional perturbation, D1ER fluorescence, indicative of free calcium levels, was lower (***p<0.001, student’s t-test) in cells expressing NIC1-RFP than in cells expressing RFP (Figure 2B, compare black vs red trace). We recapitulated published data (54, 61) of reduced ER calcium levels (D1ER-fluorescence), in cells expressing the anti-apoptotic protein Bcl-xL (Figure 2B, green trace) relative to the control group. This observation was consistent with the results of the PSD analysis and argued against a major defect in calcium release from the ER.
In the experiments that follow the involvement of molecular complexes that regulate inter-organelle movement of calcium were examined for the modulation, if any, on Notch1. The transfer of calcium between ER and mitochondria has been demonstrated in many cell types and molecules such as IP3R3 (calcium release from the ER), Grp75 and VDAC1, and MCU (mitochondrial uptake of calcium), are implicated in this transfer (Figure 2C). Changes if any, in levels of ER calcium were compared in cells transfected with NIC1 or a control vector (Figure 2Di), against the cellular background of RNAi mediated ablation of IP3R3 or VDAC1 or MCU, or the scrambled control. In summary, ablation of any one of these proteins, restored levels of ER calcium in NIC1 expressing cells, to levels of the control group (Figures 2Dii-Fii). Notably, there was no change in ER calcium in RFP expressing cells (control) treated with different siRNA (Figures 2D–F). The requirement of these molecules was also confirmed using the PSD assay in cells expressing NIC1 or the control vector (Supplementary Figure S2A–C). Collectively, these experiments indicated that NIC1 modulates intracellular calcium dynamics and this is dependent on molecules controlling calcium release from the ER store (IP3R3) and uptake by mitochondria (VDAC1 and MCU). Next, the status of free calcium in mitochondria was assessed.
NIC1 Signaling Maintains Mitochondrial Calcium Levels
To assess calcium levels in mitochondria the FRET-based calcium sensor, 2mtD3cpv, which localizes to mitochondria under the control of an addressing tag, was used (54). The sensor was co-transfected in cells with NIC1 or RFP (control vector) and FRET measurements were performed (Figure 3, Schematic I). The unexpected observation in these experiments was that unlike the observations in the ER, mitochondrial calcium levels were comparable in control (RFP) or NIC1-RFP expressing cells (Figures 3Ai–Di). A control assay to show that the probe can detect changes in calcium levels was also performed and confirmed its function (Supplementary Figure S3). However, the probe was not sensitive to small changes in calcium levels, such as those triggered by the addition of TG to cells (data not shown). Nonetheless, changes in mitochondrial free calcium were readily apparent in NIC1 expressing cells, following the RNAi-mediated ablation of VDAC1, or MCU or IP3R3. The ablation of any one of these proteins, resulted in a drop in the levels of mitochondrial free calcium (Figures 3Aii–Cii) in cells co-expressing NIC1, indicating that Notch1 can modulate mitochondrial calcium dynamics. We next tested the effect of ablating Mitofusin (MFN)2, which regulates mitochondrial homeostasis (62), and modulates NIC1-mediated anti-apoptotic activity (7). Following the ablation of MFN2 mitochondrial calcium levels remained comparable in cells expressing NIC1or the control vector (Figure 3D). Together, these results are consistent with a role for Notch1 in modulating mitochondrial calcium uptake, via molecular complexes that bridge ER and mitochondria. Thus, calcium released from the ER is taken up by mitochondria (24, 38, 63–65), with uptake of calcium inhibited if proteins such as VDAC1 and MCU are depleted. Therefore, blocking mitochondrial uptake of calcium from the cytoplasm would lower mitochondrial calcium levels, as observed in the NIC1 expressing cells in the experiments.
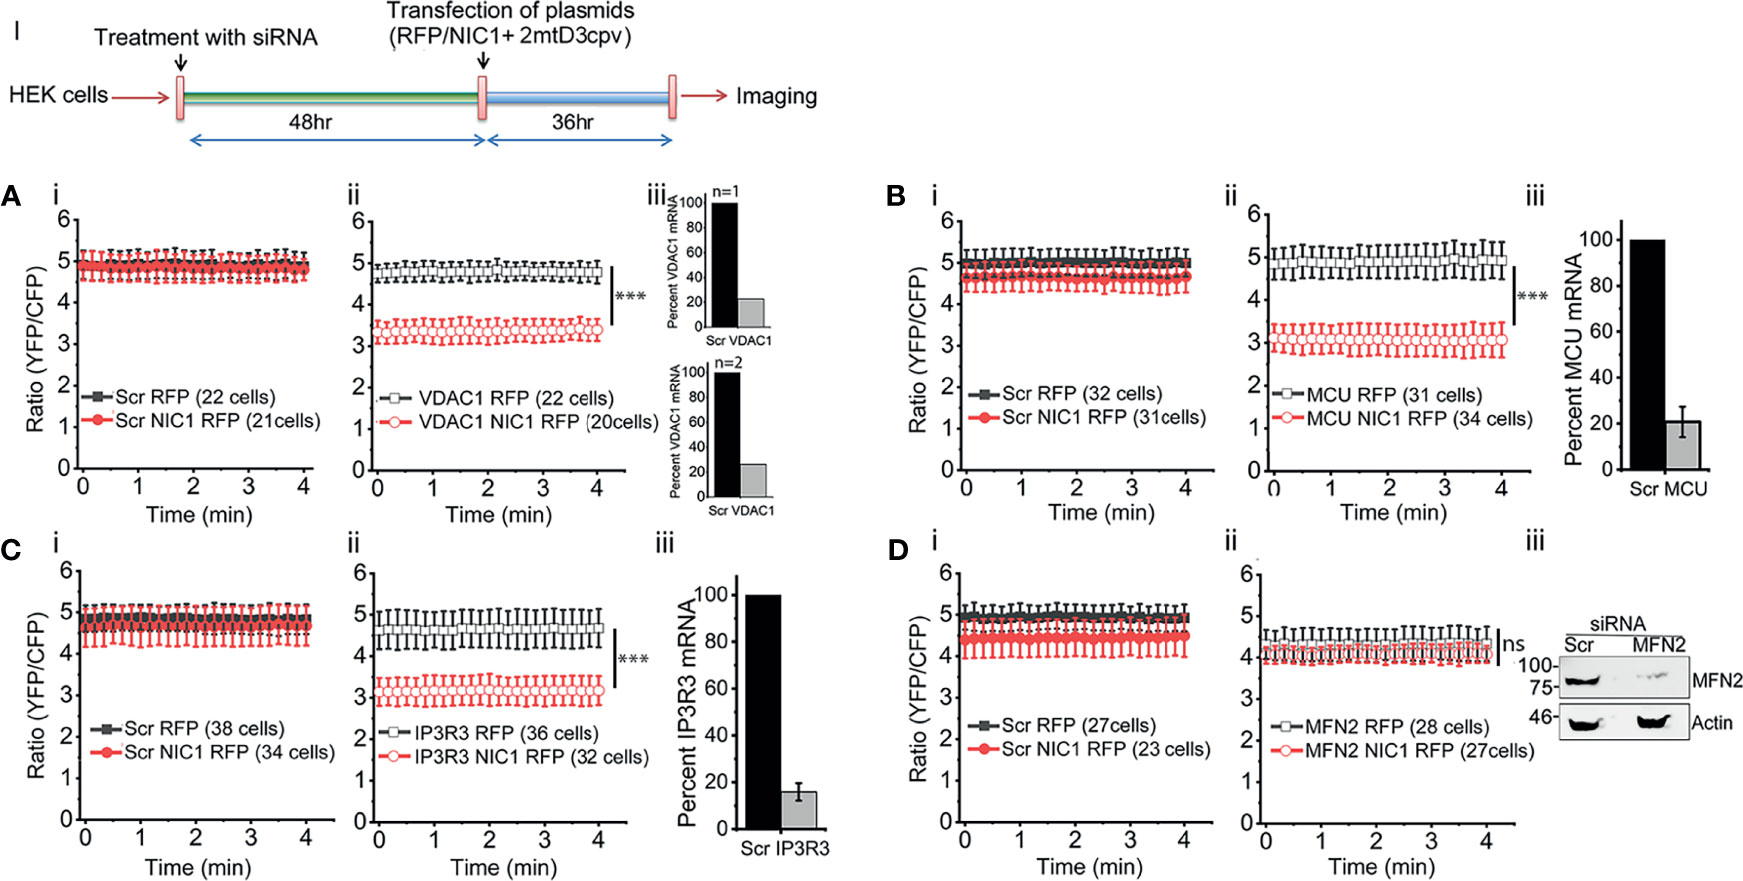
Figure 3 NIC1 signaling maintains mitochondrial calcium levels. Schematic (I) Timeline of experiments, for the assessment of mitochondrial calcium levels. (A–D) Ratio of YFP/CFP fluorescence in HEK cells, imaged 36 h after co-transfection with 2mtD3cpv and NIC1-RFP () or RFP () in cells pre-treated with siRNA to VDAC1 (A-ii) or MCU (B-ii), IP3R3 (C-ii) or MFN2 (D-ii) or scrambled control (A-D-i, NIC1-RFP () and RFP (). (A-C iii) Percent mRNA of the genes as shown in panels, in cells treated with siRNA to VDAC1 (A, N=2) or MCU (B, N=3) or IP3R3 (C, N=3) and scrambled control. (D-iii) Representative immunoblot of whole cell lysates from cells treated with siRNA to MFN2 or scrambled control probed for MFN2 and Actin. Data plotted as mean ± SD of the indicated number of cells in 6-12 fields across two (A, D) or three (B, C) experiments. *** indicates significant difference at any time point with p ≤ 0.001 and ns: not significant, examined using the unpaired student’s t-test.
Ligand-Dependent, Non-Nuclear NIC1 Signaling Regulates Calcium Levels
Notch1-mediated anti-apoptotic activity, albeit executed from the cytoplasm, requires ligand-mediated processing (5–8). To assess if this was also true for the regulation of calcium dynamics, we expressed NIC1, tagged to addressing constructs that spatially restrict the protein to the cytoplasm (NIC1 tagged to Nuclear Export Sequence, NIC1-NES) or restricting it to the nucleus (NIC1 tagged to Nuclear Localization Sequence, NIC1-NLS). NIC1_NES or NIC1_NLS were expressed in HEK cells and assessed in the PSD assay. Cells expressing NIC1-NES (Figure 4A, blue trace) overlapped the patterns of cells expressing NIC1 (Figure 4A, red trace), with little or no signals of cytoplasmic calcium following exposure to TG. On the other hand, in cells expressing NIC1-NLS, the release of calcium was comparable to cells that expressed GFP alone (Figure 4B, blue trace), indicating that enforced nuclear localization restricted this aspect of NIC1 activity. NIC1-NLS activity is confirmed in assays of transcription (66). To test ligand-dependence of Notch1 activity the following was done. HEK cells expressing the full-length form of the Notch1 receptor (NFL) and those co-expressed with a soluble form of extracellular domain of Jagged (sJagged), which functions as a dominant negative and blocks the processing and cleavage of Notch1 were tested (6). In cells expressing NFL, fluorescence is blunted in response to TG (Figure 4C, red trace) as seen with cells expressing NIC1 (Figure 4A). However, in cells expressing tagged and NFL, the profile of calcium release and its dissipation were comparable to cells expressing GFP (Figure 4C), indicating that Notch1 processing to NIC1 was required for this function. Together, the experiments show that NIC1 activity from the cytoplasm modulates calcium homeostasis.
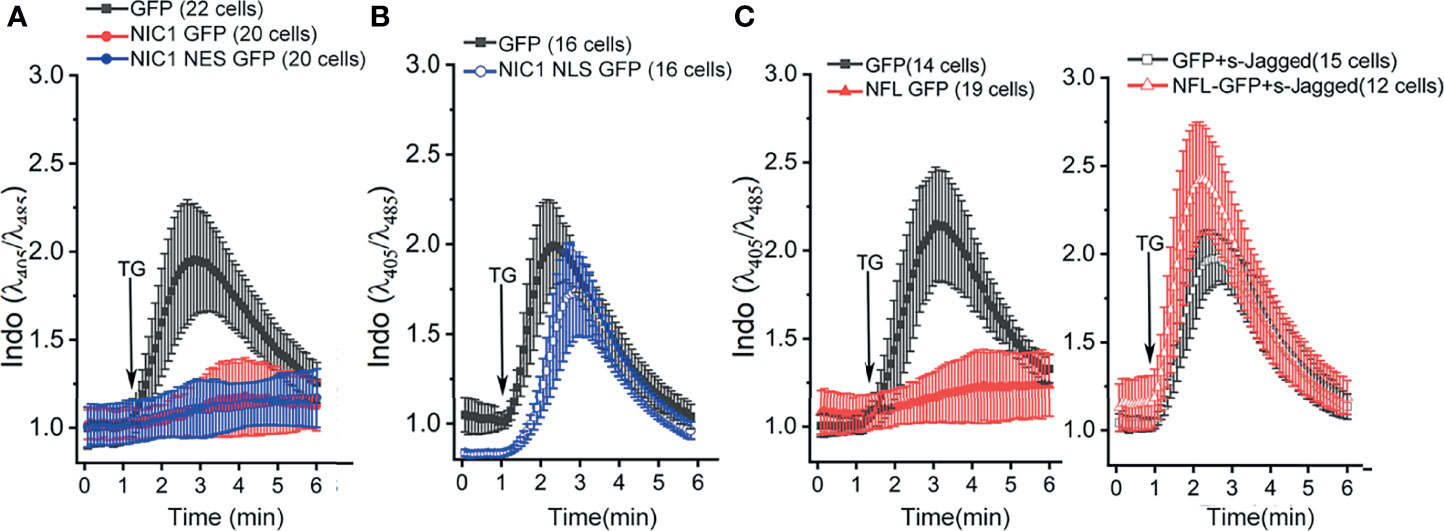
Figure 4 Ligand-dependent, non-nuclear NIC1 signaling regulates ER calcium levels. (A, B) Ratio of intracellular Indo-1 dye fluorescence at 405 nm and 485 nm at baseline and in response to 2 µM TG in HEK cells measured in calcium-free medium, and imaged 36 h post-transfection with GFP (), NIC1 GFP () or NIC1-NES GFP ( ) (A) or NIC1-NLS GFP (
 ) (B). (C) Ratio of intracellular Indo-1 dye fluorescence at 405 nm and 485 nm wavelength at baseline and in response to 2 µM TG addition in HEK cells measured in calcium-free medium, and imaged 36 h post-transfection with plasmids encoding for GFP (), NFL GFP (
 ), GFP and sJagged () or NFL GFP and sJagged (
 ). Data plotted as mean ± SD of the total number of cells indicated in parentheses, from three (A) and two (B, C) experiments.
NIC1-NES-Mediated Treg Survival Is Dependent on Calcium Signaling
With these leads from analysis in the HEK cell line, we next assessed Notch1-mediated Treg survival for dependency on molecules regulating inter-organelle calcium transfer. As shown in Figure 5A, Notch1-dependent wildtype (WT) Tregs survival (in cells cultured without IL-2), was compromised by the inhibition of IP3R3 (Xestospongin C), or, Grp75 (MKT-077) or MCU (Ru-360). The inhibitors were without effect on Tregs viability, when cultured in the presence of IL-2 (Supplementary Figure S4). The inhibitors were also tested in Cre+ve Notch1-/- Tregs transduced with NIC1-NES (Figure 5B) or Bcl-xL (Figure 5C), since both confer IL-2-independent survival in these cells. The protective effect of NIC1-NES in Notch1-/- Tregs was attenuated by the inhibitors, and was comparable to cells transduced with the control vector pBABE (Figure 5B). In cells expressing Bcl-xL, the inhibitors were without effect (Figure 5C), ruling out generalized toxicity of these chemicals and indicating specific regulation of Notch1 mediated survival.
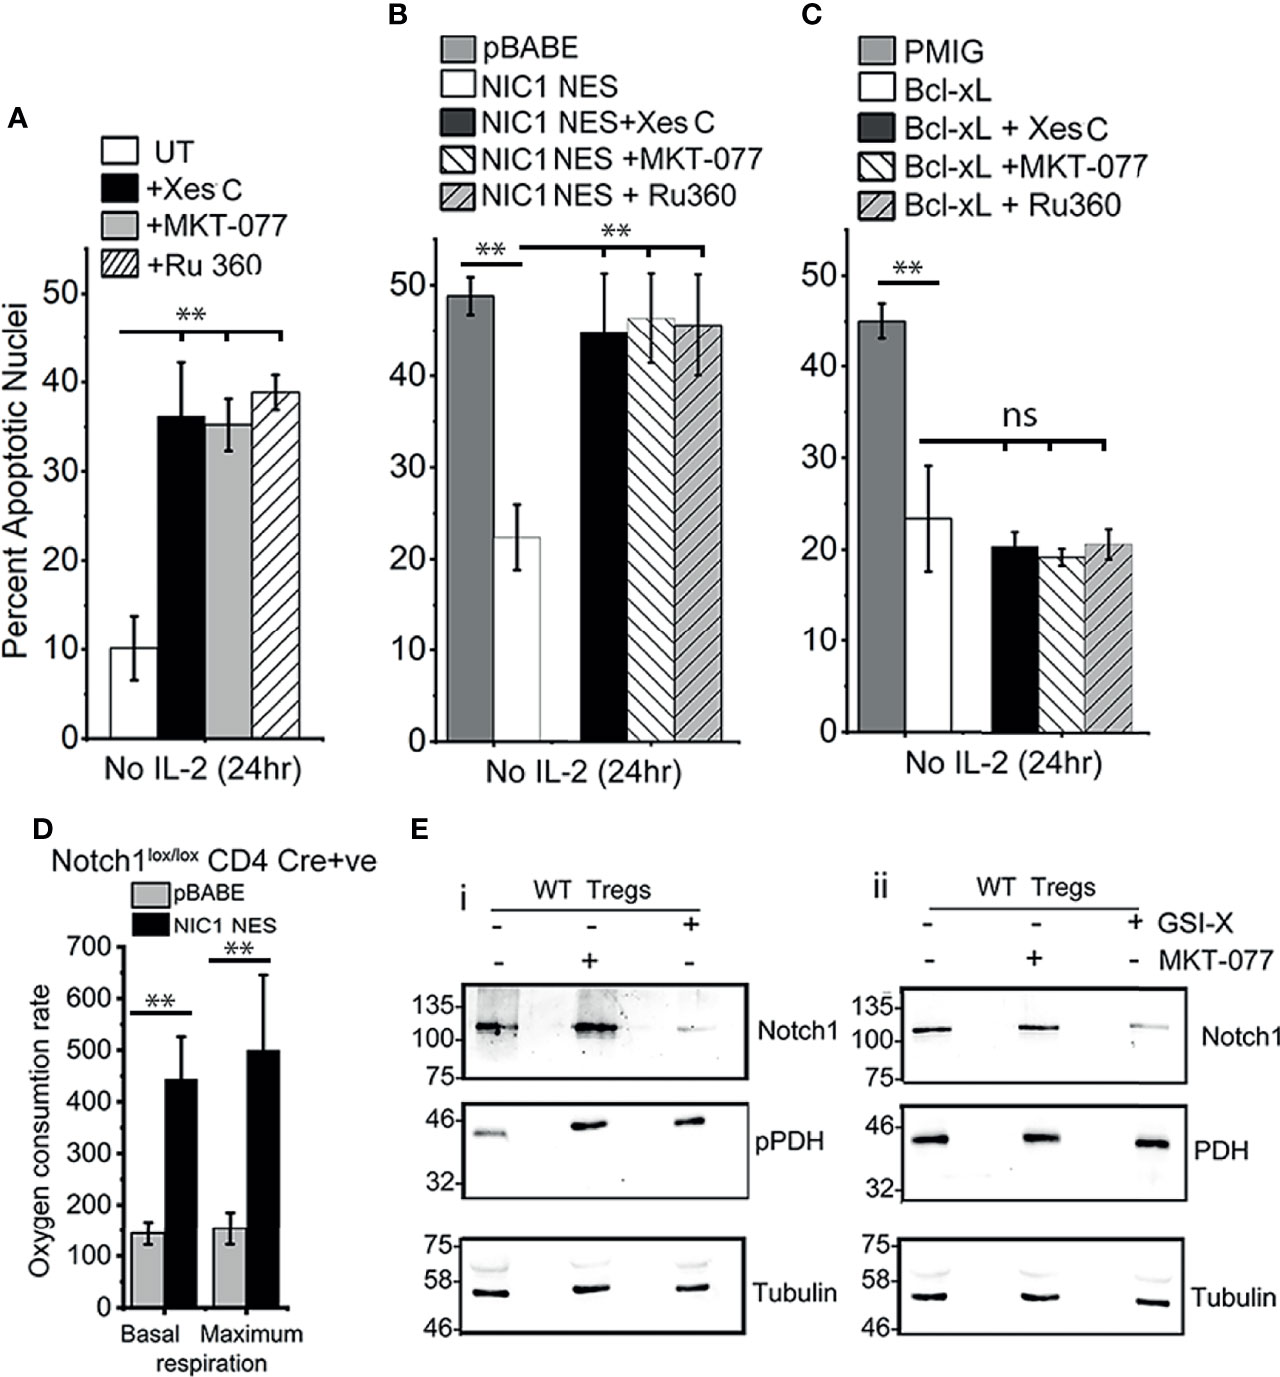
Figure 5 NIC1-mediated Treg survival requires IP3Rs, Grp75 and MCU. (A) Percent apoptotic nuclei in activated WT Tregs cultured without IL-2 for 24 h with vehicle control (UT) or, 5 μM Xestospongin C or, 10 μM MKT-077 or, 10 μM Ru360. (B, C) Percent apoptotic nuclei in Notch1-/- Tregs transduced with pBABE or NIC1-NES (B) or pMIG or Bcl-xL(C), and cultured without IL-2 for 24 h with vehicle control, or 5 μM Xestospongin C or, 10 μM MKT-077 or, 10 μM Ru360. (D) Basal and maximum OCR, computed as described in methods, in Notch1-/- Tregs transduced with pBABE or NIC1-NES. (E) Immunoblot of whole cell lysates prepared from activated WT Tregs cells cultured with or without 10 μM GSI-X or 10 μM MKT-077 for 8 h and the samples run in duplicate. Membrane was probed either for (p)PDH, Notch1 and Tubulin (E-i) or PDH, Notch1 and Tubulin (E-ii). The immunoblot is representative of two independent experiments. Data are mean ± SD of three independent experiments (A–C) and readings in 4 wells from two independent experiments (D). ** indicates significant difference with p-value ≤0.01 and ns, not significant, examined using unpaired student’s t-test.
Seahorse-based analysis of NIC-NES expressing (Cre+ve) Notch1-/- Tregs, showed a restoration of mitochondrial oxphos function (Figure 5D), which was comparable to (Cre-ve) Notch1+/+ Tregs shown earlier in the study (Figure 1E). We next tested the effects of inhibiting NIC1 activity or that of Grp75 on calcium dependent phosphorylation of PDH. To this end, levels of phospho-PDH were compared in wildtype (WT) Tregs cultured as such, or in the presence of γ-Secretase Inhibitor (GSI) to block Notch1 processing or MKT-077. As shown, phosphorylation of PDH is elevated in cells treated with GSI-X or MKT-077 (Figure 5Ei, lanes 2 and lane 3), compared to vehicle control treated groups (Figure 5Ei, lane 1). Levels of the PDH enzyme remain unchanged (Figure 5Eii, row 2). Expectedly, treatment with GSI-X (and not MKT-077), resulted in a loss of processed Notch1 (Figure 5Ei, ii).
Notch1-Grp75 Interactions in Tregs
In further characterization, immunoblot analysis of Grp75, VDAC1, and MCU proteins in (Cre-ve), Notch1+/+ and (Cre+ve) Notch1-/- activated Tregs, revealed that the levels of Grp75 protein were substantially reduced in Notch1-/- Tregs (Figure 6A). Immunostaining for Grp75 in fixed cells confirmed the difference (Figure 6B). However, there was no change in Grp75 transcript levels in Cre+ve Notch1-/- cells relative to Cre-ve Notch1+/+ Tregs (Figure 6C). Further, we observed that the levels of Grp75 are restored in (Cre+ve) Notch1-/- cells expressing NIC-NES (Figure 6D), to levels close to Tregs expressing the full complement of Notch1, suggesting that the regulation is likely post-transcriptional.
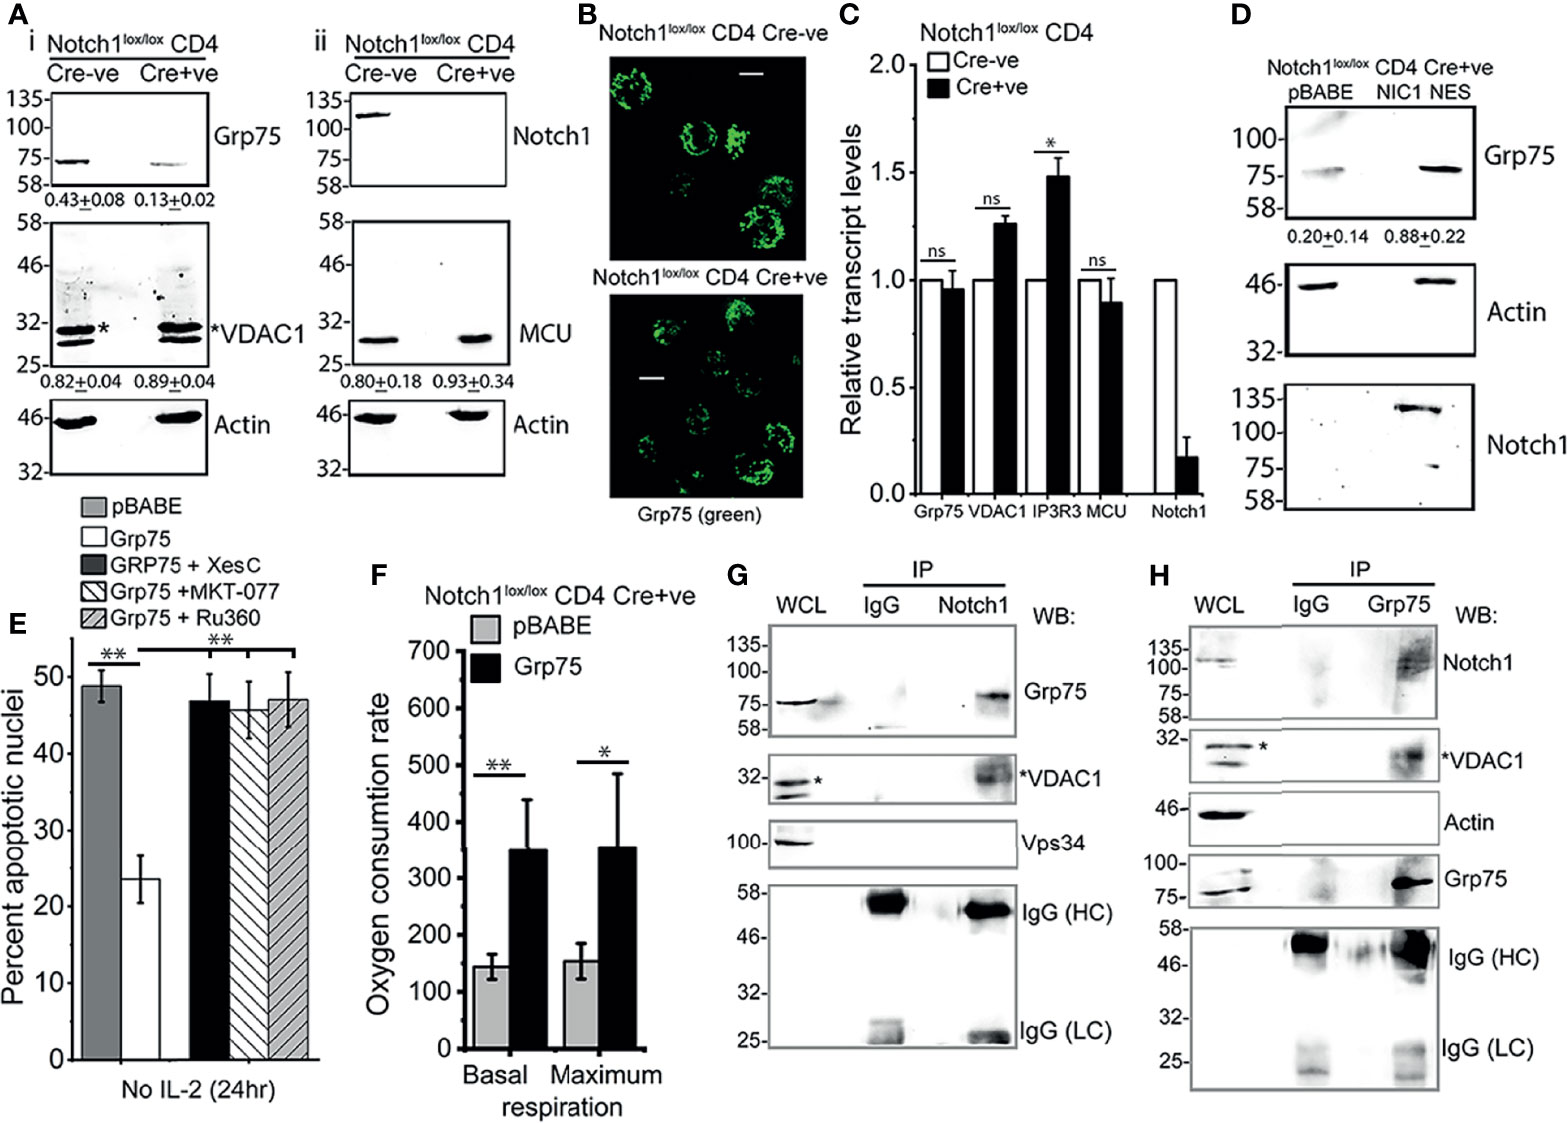
Figure 6 Notch1 activity regulates Grp75 protein levels. (A) Immunoblots of whole cell lysates prepared from activated Notch1+/+ (Cre-ve) and Notch1-/- (Cre+ve; Cd4-Cre::Notch1lox/lox) Tregs, run in duplicate. Membranes were sequentially probed for Grp75, VADC1 (*VDAC1 band), and Actin (A-i) or Notch1, MCU and Actin (A-ii). Mean ± SD values below are the densitometry analysis of Grp75, VDAC1 and MCU relative to Actin. (B) Representative Z-projected confocal images of Notch1+/+ and Notch1-/- Tregs immune-stained with an antibody to Grp75 (green). scale bar: 5 μm. Images are representative of 106 Notch1+/+ Tregs and 82 Notch1-/- Tregs. (C) Relative transcript levels of indicated genes in Notch1+/+ and Notch1-/- activated Tregs. (D) Immunoblots of cell lysates from Notch1-/-Tregs transduced with pBABE or NIC1-NES probed for Notch1, Grp75 and Actin. Mean ± SD values below are the densitometry analysis of Grp75 relative to Actin. (E) Percent apoptotic nuclei in Notch1-/- Tregs transduced with pBABE or Grp75, cultured without IL-2 for 24 h with 5μM Xestospongin C or, 10 μM MKT-077 or, 10 μM Ru360. (F) Basal and maximum OCR in Notch1-/- Tregs transduced with pBABE or Grp75. Control (pBABE) condition in panels E and F are common Figures 5B, D as these were tested in the same experiment, as described in methods. (G, H) Cell lysates of WT activated Tregs cultured for 6 h without IL-2 were subject to immunoprecipitation using an antibody to Notch1 (G) or Grp75 (H) or, IgG (Isotype control), and associated proteins analyzed by western blotting for Grp75, VDAC1 (*shows VDAC1), Notch1, Vps34, Actin and IgG (Isotype control). Immunoblots are representative of three independent experiments (A) or, two independent experiments (D, G, H). Data show the mean ± SD of three independent experiments (C, E) and readings in 4 wells from two independent experiments (F). * and ** indicates significant difference with p-value ≤0.05 and ≤0.01 respectively, and ns: not significant, examined using unpaired student’s t-test.
The overexpression of Grp75 by retroviral transfection in (Cre+ve) Notch1-/- cells restored IL-2-independent survival (Figure 6E), which was abrogated by chemical inhibition of IP3R3 or Grp75 or MCU (Figure 6E). In (Cre+ve) Notch1-/- Tregs, expressing Grp75, basal and maximum levels of mitochondrial respiration, assessed by Seahorse-based analysis, also showed improvement, albeit not to the levels of NIC-NES expressing cells tested in the same assay (Figure 6F). These data suggest a role for Grp75 as an intermediate in the Notch1 activated pathway in Tregs.
Hence, we next examined if these molecules were associated in immunecomplexes by immunoprecipitation of endogenous proteins in wildtype Tregs. An antibody to Notch1 but not control IgG, immunoprecipitated Grp75, and the associated protein VDAC1 (Figure 6G, lane 3 vs lane 2). These results were confirmed by reverse immunoprecipitation with an antibody to Grp75, and the detection of both Notch1 and VDAC1 in the associated complex (Figure 6H, lane 3). The specificity of these interactions was confirmed by the absence of proteins in the control IgG IP (Figures 6G, H, lane 2) as well as the exclusion of Vps34 or actin, from the Notch1 immunoprecipitated complex (Figures 6G, H). In related experiments, NIC1 did not immuneprecipitate IP3R3 in immunecomplexes that include Grp75 (Supplementary Figure S5). IP3R3 is a large molecular weight (~300kDa) protein and it was relatively difficult to detect by immunoblotting in Tregs. Hence, although not detected in immune-complexes in our experiments, this does not definitively rule out the dynamic participation of IP3R3 in immune-complexes formed by NIC1.
Discussion
This study builds on earlier observations of Notch1-mediated inhibition of apoptotic cascades coordinated by mitochondria (5–8) to show that Notch1 (NIC1) activity tunes calcium uptake in mitochondria, with consequences for metabolism and regulation of apoptosis in Tregs. Initial analysis in the mammalian cell line HEK showed that NIC1 activity regulated the distribution of cellular calcium as indicated by assays of calcium dynamics and direct measures of free calcium in the ER, a major store of cellular calcium. A siRNA based limited screen for molecular interactions underlying Notch-mediated outcomes revealed a dependence on IP3R3, VDAC1, Grp75, and MCU, which have well-described roles in the movement of calcium from the ER into mitochondria (31, 33, 38, 67). Building on these observations and using a combination of chemical inhibitors and functional assays in genetically ablated cells, we show that crosstalk between NIC1 and these molecules regulates mitochondrial metabolism and also confer IL-2 independent survival in Tregs (Figure 7).
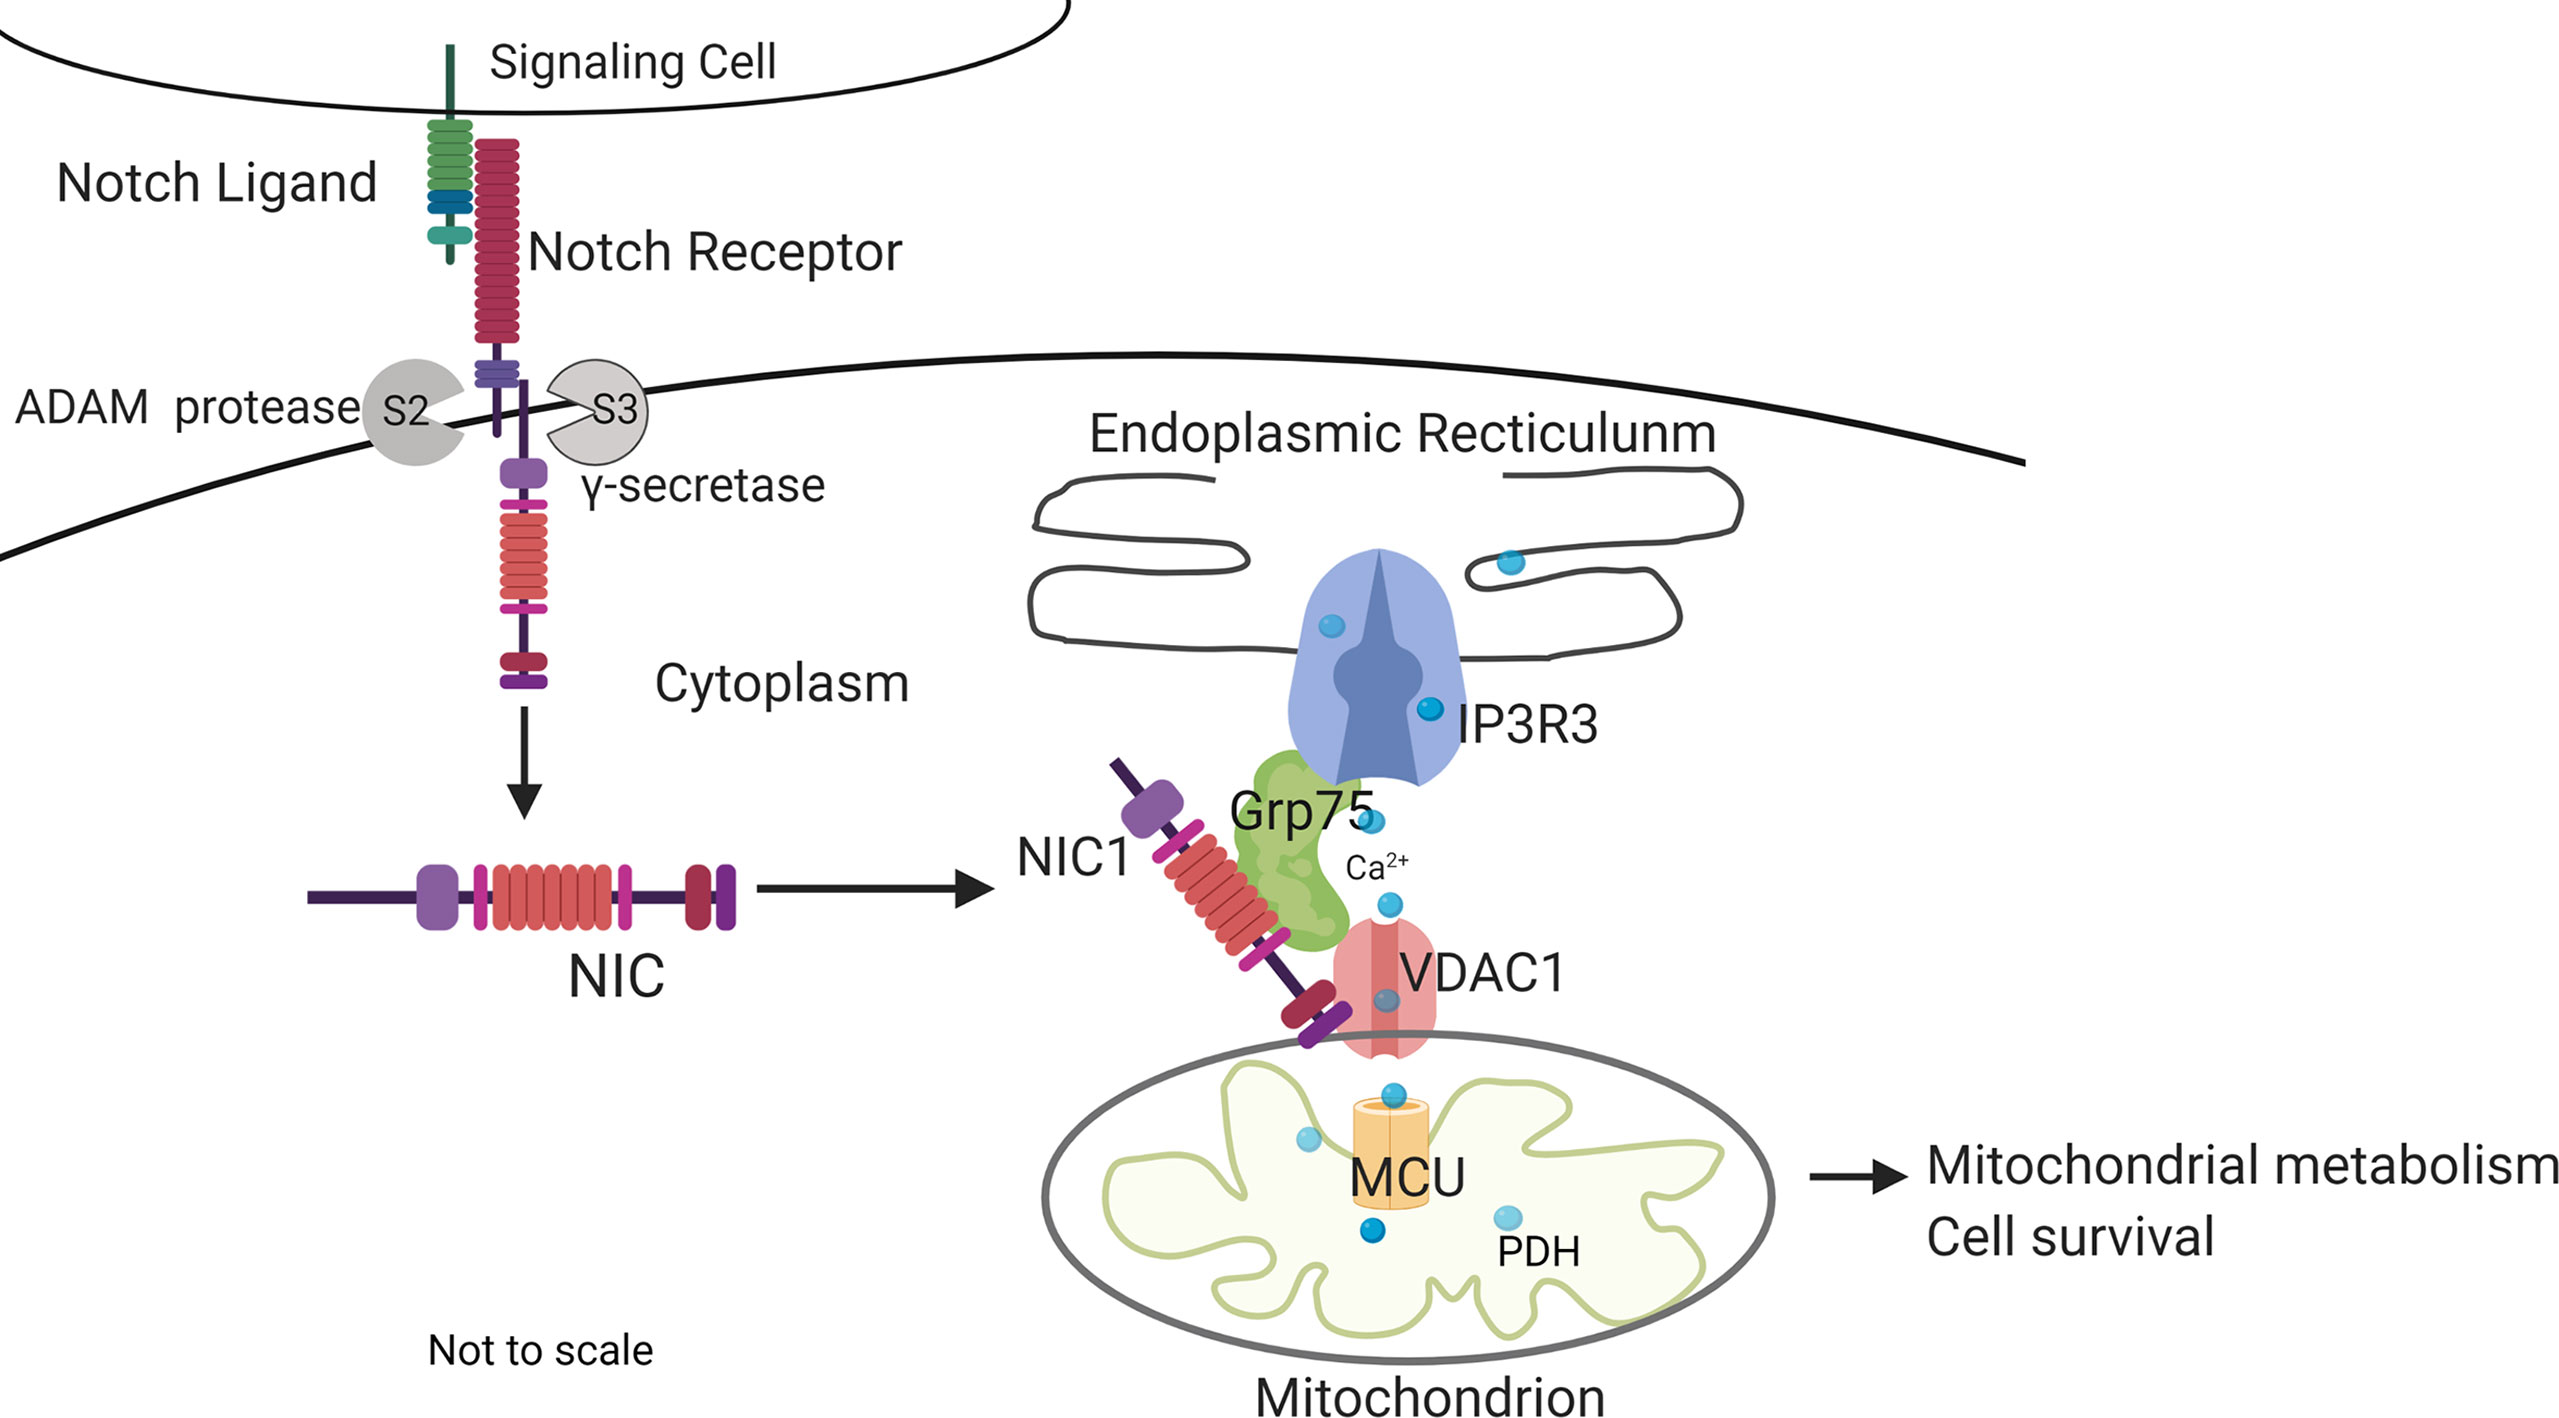
Figure 7 Summary of key outcomes. Non-nuclear localized NIC1 interacts with Grp75 and VDAC1 in a complex that modulates calcium homeostasis in mitochondria with consequences to cellular metabolism and survival. The schematic is not to scale.
We show that Notch1-/- Tregs are characterized by deficits in mitochondrial Oxphos activity and spare respiratory reserve and present evidence to suggest that these may be linked to Notch1 regulated Grp75 protein stability. Levels of Grp75 protein are restored in Notch1 null Tregs expressing NIC-NES, with immunoprecipitation analysis providing evidence of NIC in stable association with the Grp75-VDAC1 complex in Tregs. Consistently, enforced expression of Grp75 corrected, in part, deficits in mitochondrial metabolism and conferred near complete protection from apoptosis triggered by cytokine withdrawal in Notch1-/- Tregs. Further, anti-apoptotic outcomes of expressing NIC1-NES or Grp75 in Notch1-/- Tregs were dependent on IP3R3 and MCU activity, linked to the regulated uptake of calcium by mitochondria. While the 2mtD3cpv probe did not detect increased levels of free calcium in mitochondria, the NIC1 mediated calcium dependent phosphorylation of PDH and Oxphos, serve as indirect indicators of continuous uptake and utilization of calcium by mitochondria (40).
Grp75 and IP3R3 are amongst the several proteins identified as constituents of dynamic molecular complexes – referred to as Mitochondria associated membranes (MAM) – bridging the ER and mitochondria (33, 34, 68). A core function of MAM is to calibrate the transfer of calcium released from the ER and its uptake into mitochondria (33, 63, 69). Perturbations of MAM are reported to reduce mitochondrial calcium uptake and increase cytosolic calcium (69, 70). The over-expression of Grp75 has also been shown to increase MAM formation and reduce resting ER calcium levels (33). In this context, a possibility arising from our studies that remain to be addressed is that Notch1 activity modulates MAM-mediated contacts. While initial efforts have not revealed measurable differences resulting from NIC1 activity in the cell line system, efforts to make reliable measurements in Tregs, which have a crowded mitochondrial organization are ongoing.
While reduced Oxphos has been shown to suppress activation of Bcl-2 family pro-apoptotic proteins Bax and Bak (71–73), the anti-apoptotic proteins Bcl-xL and Bcl2 are also reported to stimulate Oxphos and promote cell survival (74–79). Further, other evidence in the literature indicate that Oxphos promotes cellular adaptation and survival to several stresses including hypoxia, low glucose, and proteotoxic stress (80–83). An essential role for Oxphos in Treg survival in different physiological contexts including the tumor microenvironment has also been reported (84–88).
Cell survival in complex and changing environments associated with inflammation is an important component determining immune cell function. Hence, dependency on cytokine cues alone, especially for survival, may well become bottlenecks for effective function of the T-cell lineage, wherein cell-autonomous decisions of cell death and survival control immune homeostasis (89–91). Metabolic reprogramming is increasingly appreciated as a key determinant in cell fate transitions (92–96). Unsurprisingly, NIC1 activity in Tregs is revealed by IL-2 withdrawal, mimicking nutrient deprivation cues (5). Although we did not directly assess the role of ligands here, the expression of Notch ligands in activated Tregs has been reported in earlier work from our laboratory and others (5, 97). Further, ablation of the ligand Delta-like 1 is implicated in Notch1 mediated survival of activated Tregs in IL-2 depleted medium (5). We posit that while IL-2 is critical for Treg development, ligand-dependent Notch1 activity is a key adaptive response for stressors encountered in the micro-environments Tregs function in. Dependence on ligand remains an important regulatory step controlling pathway activation in these cells (5). However, Notch1 activity in Tregs may be critical in specific contexts and non-essential in others (98).
In summary, we demonstrate that cross-talk between Notch1 and components regulating cellular calcium homeostasis are important for survival and mitochondrial function in Tregs. Notch1 is implicated in instructive fate choices, including commitment to the T-cell lineage, as well as the regulation of mature T-cell function (12, 99–103). Intracellular calcium signaling is a key factor in cell signaling and physiology, controlling outcomes as diverse as proliferation, differentiation and apoptosis. Likewise, Notch signaling is a key regulator of cell fate decisions in metazoans and we speculate that the consequences to mitochondrial metabolism reported here, may be more widely prevalent and tune cell-fate decisions governed by the Notch receptor in other cell types.
Data Availability Statement
The raw data supporting the conclusions of this article will be made available by the authors, without undue reservation.
Ethics Statement
The animal study was reviewed and approved by Institutional Animal Ethics Committee [INS-IAE-2019/07(R1)] and Committee for the Purpose of Control and Supervision of Experiments on Animals, Government of India.
Author Contributions
AS, NS, and SL: Conceptualization and writing. NS and SL: Experiment design, execution, analysis. PK: execution of experiments. NS: Assembly of Figures. All authors contributed to the article and approved the submitted version.
Funding
This work was supported by extramural funding from the Department of Biotechnology DBT(BT/PR13446/COE/34/30/2015 and in part BT/PR13890/BRB/10/788/2010), as well as core support from the DBT-Institute for Stem Cell Science and Regenerative Medicine (inStem), Bellary Road, Bengaluru, India to AS.
Conflict of Interest
The authors declare that the research was conducted in the absence of any commercial or financial relationships that could be construed as a potential conflict of interest.
Publisher’s Note
All claims expressed in this article are solely those of the authors and do not necessarily represent those of their affiliated organizations, or those of the publisher, the editors and the reviewers. Any product that may be evaluated in this article, or claim that may be made by its manufacturer, is not guaranteed or endorsed by the publisher.
Acknowledgments
We acknowledge the Animal Care and Resource Centre (funded in part by the National Mouse Research Resource (NaMoR) Grant BT/PR5981/MED/31/181/2012;2013-2016 from the Department of Biotechnology, Ministry of Science & Technology, Govt. of India) and the Central Imaging and Flowcytometry Facility (CIFF), at the Bangalore Life Science Cluster (BLiSC), Bengaluru. Sunil Laxman (inStem) and MK Mathew (NCBS) are acknowledged for their critical inputs on the work. We gratefully acknowledge the gift of the Notch1lox/lox and Cd4-Cre::Notch1lox/lox mice from Freddy Radtke, EPFL, Switzerland; D1ER and 2mtD3cpv plasmids from R.Y. Tsien and pBABE, pBABE-NIC-NLS, and pBABE-NIC-NES plasmids from Barbara A Osborne, Amherst USA. Schematics are created with Biorender.com.
Supplementary Material
The Supplementary Material for this article can be found online at: https://www.frontiersin.org/articles/10.3389/fimmu.2022.832159/full#supplementary-material
Abbreviations
Bcl-xL, B-cell lymphoma extra-large; Foxp3, Fork head box P3; Grp75, Glucose-regulated protein 75; Hes5, hairy and enhancer of split-5; IL-2, Interleukin-2; IP3R3, Inositol 1,4,5-trisphosphate receptor, type 3; MCU, Mitochondrial calcium uniporter; NIC1, Notch1 intracellular domain; PDH, Pyruvate dehydrogenase; pPDH, Phosphorylated pyruvate dehydrogenase; RBP-jk, Recombination signal – binding protein-Jκ; Tregs, Regulatory T cells; TG, Thapsigargin; VDAC1, Voltage-dependent anion-selective channel 1.
References
1. Kedia-Mehta N, Finlay DK. Competition for Nutrients and its Role in Controlling Immune Responses. Nat Commun (2019) 10:2123. doi: 10.1038/s41467-019-10015-4
2. Alwarawrah Y, Kiernan K, MacIver NJ. Changes in Nutritional Status Impact Immune Cell Metabolism and Function. Front Immunol (2018) 9:1055. doi: 10.3389/fimmu.2018.01055
3. Purushothaman D, Sarin A. Cytokine-Dependent Regulation of NADPH Oxidase Activity and the Consequences for Activated T Cell Homeostasis. J Exp Med (2009) 206:1515–23. doi: 10.1084/jem.20082851
4. Yamane H, Paul WE. Cytokines of the γ(C) Family Control CD4+ T Cell Differentiation and Function. Nat Immunol (2012) 11:1037–44. doi: 10.1038/ni.2431
5. Perumalsamy LR, Marcel N, Kulkarni S, Radtke F, Sarin A. Distinct Spatial and Molecular Features of Notch Pathway Assembly in Regulatory T Cells. Sci Signal (2012) 5:ra53. doi: 10.1126/scisignal.2002859
6. Perumalsamy LR, Nagala M, Banerjee P, Sarin A. A Hierarchical Cascade Activated by Non-Canonical Notch Signaling and the mTOR–Rictor Complex Regulates Neglect-Induced Death in Mammalian Cells. Cell Death Differ (2009) 16:879–89. doi: 10.1038/cdd.2009.20
7. Perumalsamy LR, Nagala M, Sarin A. Notch-Activated Signaling Cascade Interacts With Mitochondrial Remodeling Proteins to Regulate Cell Survival. Proc Natl Acad Sci (2010) 107:6882–87. doi: 10.1073/pnas.0910060107
8. Marcel N, Perumalsamy LR, Shukla SK, Sarin A. The Lysine Deacetylase Sirtuin 1 Modulates the Localization and Function of the Notch1 Receptor in Regulatory T Cells. Sci Signal (2017) 10:eaah4679. doi: 10.1126/scisignal.aah4679
9. Shimizu K, Chiba S, Kumano K, Hosoya N, Takahashi T, Kanda Y, et al. Mouse Jagged1 Physically Interacts With Notch2 and Other Notch Receptors. J Biol Chem (1999) 274:32961–69. doi: 10.1074/jbc.274.46.32961
10. Jarriault S, Brou C, Logeat F, Schroeter EH, Kopan R, Israel A. Signalling Downstream of Activated Mammalian Notch. Nature (1995) 377:355–58. doi: 10.1038/377355a0
11. Lecourtois M, Schweisguth F. Role of Suppressor of Hairless in the Delta-Activated Notch Signaling Pathway. Perspect Dev Neurobiol (1997) 4:305–11.
12. Kopan R, Ilagan MXG. The Canonical Notch Signaling Pathway: Unfolding the Activation Mechanism. Cell (2009) 137:216–33. doi: 10.1016/j.cell.2009.03.045
13. Bush G, diSibio G, Miyamoto A, Denault J-B, Leduc R, Weinmaster G. Ligand-Induced Signaling in the Absence of Furin Processing of Notch1. Dev Biol (2001) 229:494–502. doi: 10.1006/dbio.2000.9992
14. Saini N, Sarin A. Nucleolar Localization of the Notch4 Intracellular Domain Underpins its Regulation of the Cellular Response to Genotoxic Stressors. Cell Death Discov (2020) 6:7. doi: 10.1038/s41420-020-0242-y
15. Vermezovic J, Adamowicz M, Santarpia L, Rustighi A, Forcato M, Lucano C, et al. Notch is a Direct Negative Regulator of the DNA-Damage Response. Nat Struct Mol Biol (2015) 22:417–24. doi: 10.1038/nsmb.3013
16. Bi P, Yue F, Sato Y, Wirbisky S, Liu W, Shan T, et al. Stage-Specific Effects of Notch Activation During Skeletal Myogenesis. Elife (2016) 5:e17355. doi: 10.7554/eLife.17355
17. Hayashi Y, Nishimune H, Hozumi K, Saga Y, Harada A, Yuzaki M, et al. A Novel Non-Canonical Notch Signaling Regulates Expression of Synaptic Vesicle Proteins in Excitatory Neurons. Sci Rep (2016) 6:23969. doi: 10.1038/srep23969
18. Hossain F, Sorrentino C, Ucar DA, Peng Y, Matossian M, Wyczechowska D, et al. Notch Signaling Regulates Mitochondrial Metabolism and NF-κb Activity in Triple-Negative Breast Cancer Cells via Ikkα-Dependent Non-Canonical Pathways. Front Oncol (2018) 8:575. doi: 10.3389/fonc.2018.00575
19. Mukherjee T, Kim WS, Mandal L, Banerjee U. Interaction Between Notch and Hif-α in Development and Survival of Drosophila Blood Cells. Science (2011) 332:1210–13. doi: 10.1126/science.1199643
20. Berridge MJ. The Inositol Trisphosphate/Calcium Signaling Pathway in Health and Disease. Physiol Rev (2016) 96:1261–96. doi: 10.1152/physrev.00006.2016
21. Gudermann T, Bader M. Receptors G. Proteins, and Integration of Calcium Signalling. J Mol Med (2015) 93:937–40. doi: 10.1007/s00109-015-1330-y
22. Bootman MD, Berridge MJ, Roderick HL. Calcium Signalling: More Messengers, More Channels, More Complexity. CurrBiol (2002) 12:R563–75. doi: 10.1016/S0960-9822(02)01055-2
23. Berridge MJ, Lipp P, Bootman MD. The Versatility and Universality of Calcium Signalling. Nat Rev Mol Cell Biol (2000) 1:11–21. doi: 10.1038/35036035
24. Pinton P, Giorgi C, Siviero R, Zecchini E, Rizzuto R. Calcium and Apoptosis: ER-Mitochondria Ca2+ Transfer in the Control of Apoptosis. Oncogene (2008) 27:6407–18. doi: 10.1038/onc.2008.308
25. Boehning D, Patterson RL, Sedaghat L, Glebova NO, Kurosaki T, Snyder SH. Cytochrome C Binds to Inositol (1,4,5) Trisphosphate Receptors, Amplifying Calcium-Dependent Apoptosis. Nat Cell Biol (2003) 5:1051–61. doi: 10.1038/ncb1063
26. Nutt LK, Chandra J, Pataer A, Fang B, Roth JA, Swisher SG, et al. Bax-Mediated Ca2+ Mobilization Promotes Cytochrome C Release During Apoptosis. J Biol Chem (2002) 277:20301–08. doi: 10.1074/jbc.M201604200
27. Orrenius S, Zhivotovsky B, Nicotera P. Regulation of Cell Death: The Calcium–Apoptosis Link. Nat Rev Mol Cell Biol (2003) 4:552–65. doi: 10.1038/nrm1150
28. Westermann B. Bioenergetic Role of Mitochondrial Fusion and Fission. Biochim Biophys Acta - Bioenerg (2012) 1817:1833–88. doi: 10.1016/j.bbabio.2012.02.033
29. Rambold AS, Kostelecky B, Elia N, Lippincott-Schwartz J. Tubular Network Formation Protects Mitochondria From Autophagosomal Degradation During Nutrient Starvation. Proc Natl Acad Sci (2011) 108:10190–95. doi: 10.1073/pnas.1107402108
30. Jendrach M, Mai S, Pohl S, Vöth M, Bereiter-Hahn J. Short- and Long-Term Alterations of Mitochondrial Morphology, Dynamics and mtDNA After Transient Oxidative Stress. Mitochondrion (2008) 8:293–304. doi: 10.1016/j.mito.2008.06.001
31. Rapizzi E, Pinton P, Szabadkai G, Wieckowski MR, Vandecasteele G, Baird G, et al. Recombinant Expression of the Voltage-Dependent Anion Channel Enhances the Transfer of Ca2+ Microdomains to Mitochondria. J Cell Biol (2002) 159:613–24. doi: 10.1083/jcb.200205091
32. Rosencrans WM, Rajendran M, Bezrukov SM, Rostovtseva TK. VDAC Regulation of Mitochondrial Calcium Flux: From Channel Biophysics to Disease. Cell Calcium (2021) 94:102356. doi: 10.1016/j.ceca.2021.102356
33. Szabadkai G, Bianchi K, Vaírnai P, De Stefani D, Wieckowski MR, Cavagna D, et al. Chaperone-Mediated Coupling of Endoplasmic Reticulum and Mitochondrial Ca2+ Channels. J Cell Biol (2006) 175:901–11. doi: 10.1083/jcb.200608073
34. Liu Y, Ma X, Fujioka H, Liu J, Chen S, Zhu X. DJ-1 Regulates the Integrity and Function of ER-Mitochondria Association Through Interaction With IP3R3-Grp75-Vdac1. Proc Natl Acad Sci (2019) 116:25322–28. doi: 10.1073/pnas.1906565116
35. Medler K, Gleason EL. Mitochondrial Ca2+ Buffering Regulates Synaptic Transmission Between Retinal Amacrine Cells. J Neurophysiol (2002) 87:1426–39. doi: 10.1152/jn.00627.2001
36. Griffiths EJ, Rutter GA. Mitochondrial Calcium as a Key Regulator of Mitochondrial ATP Production in Mammalian Cells. BiochimBiophys Acta - Bioenerg (2009) 1787:1324–33. doi: 10.1016/j.bbabio.2009.01.019
37. Gellerich FN, Gizatullina Z, Trumbeckaite S, Nguyen HP, Pallas T, Arandarcikaite O, et al. The Regulation of OXPHOS by Extramitochondrial Calcium. BiochimBiophys Acta - Bioenerg (2010) 1797:1018–27. doi: 10.1016/j.bbabio.2010.02.005
38. Cárdenas C, Miller RA, Smith I, Bui T, Molgó J, Müller M, et al. Essential Regulation of Cell Bioenergetics by Constitutive InsP3 Receptor Ca2+ Transfer to Mitochondria. Cell (2010) 142:270–83. doi: 10.1016/j.cell.2010.06.007
39. Williams GSB, Boyman L, Lederer WJ. Mitochondrial Calcium and the Regulation of Metabolism in the Heart. J Mol Cell Cardiol (2015) 78:35–45. doi: 10.1016/j.yjmcc.2014.10.019
40. Denton RM. Regulation of Mitochondrial Dehydrogenases by Calcium Ions. Biochim Biophys Acta - Bioenerg (2009) 1787:1309–16. doi: 10.1016/j.bbabio.2009.01.005
41. Mattson MP, Chan SL. Calcium Orchestrates Apoptosis. Nat Cell Biol (2003) 5:1041–43. doi: 10.1038/ncb1203-1041
42. Palmer AE, Jin C, Reed JC, Tsien RY. Bcl-2-Mediated Alterations in Endoplasmic Reticulum Ca2+ Analyzed With an Improved Genetically Encoded Fluorescent Sensor. Proc Natl Acad Sci (2004) 101:17404–49. doi: 10.1073/pnas.0408030101
43. White C, Li C, Yang J, Petrenko NB, Madesh M, Thompson CB, et al. The Endoplasmic Reticulum Gateway to Apoptosis by Bcl-XL Modulation of the InsP3R. Nat Cell Biol (2005) 7:1021–28. doi: 10.1038/ncb1302
44. Zhu L, Ling S, Yu X-D, Venkatesh LK, Subramanian T, Chinnadurai G, et al. Modulation of Mitochondrial Ca2+ Homeostasis by Bcl-2. J Biol Chem (1999) 274:33267–73. doi: 10.1074/jbc.274.47.33267
45. Nilsen J, Brinton RD. Mechanism of Estrogen-Mediated Neuroprotection: Regulation of Mitochondrial Calcium and Bcl-2 Expression. Proc Natl Acad Sci (2003) 100:2842–47. doi: 10.1073/pnas.0438041100
46. Buck MD, O’Sullivan D, Pearce EL. T Cell Metabolism Drives Immunity. J Exp Med (2015) 212:1345–60. doi: 10.1084/jem.20151159
47. MacIver NJ, Michalek RD, Rathmell JC. Metabolic Regulation of T Lymphocytes. Annu Rev Immunol (2013) 31:259–83. doi: 10.1146/annurev-immunol-032712-095956
48. Smith-Garvin JE, Koretzky GA, Jordan MS. T Cell Activation. Annu Rev Immunol (2009) 27:591–619. doi: 10.1146/annurev.immunol.021908.132706
49. Dimeloe S, Burgener A, Grählert J, Hess C. T-Cell Metabolism Governing Activation, Proliferation and Differentiation; a Modular View. Immunology (2017) 150:35–44. doi: 10.1111/imm.12655
50. Puleston DJ, Zhang H, Powell TJ, Lipina E, Sims S, Panse I, et al. Autophagy is a Critical Regulator of Memory CD8+ T Cell Formation. Elife (2014) 3:e03706. doi: 10.7554/eLife.03706
51. Sun I-H, Oh M-H, Zhao L, Patel CH, Arwood ML, Xu W, et al. mTOR Complex 1 Signaling Regulates the Generation and Function of Central and Effector Foxp3 + Regulatory T Cells. J Immunol (2018) 201:481–92. doi: 10.4049/jimmunol.1701477
52. Mocholi E, Dowling SD, Botbol Y, Gruber RC, Ray AK, Vastert S, et al. Autophagy Is a Tolerance-Avoidance Mechanism That Modulates TCR-Mediated Signaling and Cell Metabolism to Prevent Induction of T Cell Anergy. Cell Rep (2018) 24:1136–50. doi: 10.1016/j.celrep.2018.06.065
53. Wolfer A, Bakker T, Wilson A, Nicolas M, Ioannidis V, Littman DR, et al. Inactivation of Notch1 in Immature Thymocytes Does Not Perturb CD4 or CD8 T Cell Development. Nat Immunol (2001) 2:235–41. doi: 10.1038/85294
54. Palmer AE, Giacomello M, Kortemme T, Hires SA, Lev-Ram V, Baker D, et al. Ca2+ Indicators Based on Computationally Redesigned Calmodulin-Peptide Pairs. Chem Biol (2006) 13:521–30. doi: 10.1016/j.chembiol.2006.03.007
55. Hori S, Nomura T, Sakaguchi S. Control of Regulatory T Cell Development by the Transcription Factor Foxp3. Science (2003) 299:1057–61. doi: 10.1126/science.1079490
56. Sakaguchi S, Sakaguchi N, Asano M, Itoh M, Toda M. Immunologic Self-Tolerance Maintained by Activated T Cells Expressing IL-2 Receptor Alpha-Chains (CD25). Breakdown of a Single Mechanism of Self-Tolerance Causes Various Autoimmune Diseases. J Immunol (1995) 155:1151–64.
57. Koch GLE. The Endoplasmic Reticulum and Calcium Storage. BioEssays (1990) 12:527–31. doi: 10.1002/bies.950121105
58. Thastrup O, Cullen PJ, Drobak BK, Hanley MR, Dawson AP. Thapsigargin, a Tumor Promoter, Discharges Intracellular Ca2+ Stores by Specific Inhibition of the Endoplasmic Reticulum Ca2 (+)-ATPase. Proc Natl Acad Sci (1990) 87:2466–70. doi: 10.1073/pnas.87.7.2466
59. Carafoli E. Calcium Pumps: Structural Basis for and Mechanism of Calcium Transmembrane Transport. Curr Opin Chem Biol (2000) 4:152–61. doi: 10.1016/S1367-5931(99)00069-1
60. Brini M, Carafoli E. The Plasma Membrane Ca2+ ATPase and the Plasma Membrane Sodium Calcium Exchanger Cooperate in the Regulation of Cell Calcium. Cold Spring Harb Perspect Biol (2011) 3:a004168. doi: 10.1101/cshperspect.a004168
61. Xu C, Xu W, Palmer AE, Reed JC. BI-1 Regulates Endoplasmic Reticulum Ca2+ Homeostasis Downstream of Bcl-2 Family Proteins. J Biol Chem (2008) 283:11477–84. doi: 10.1074/jbc.M708385200
62. Chen H, Detmer SA, Ewald AJ, Griffin EE, Fraser SE, Chan DC. Mitofusins Mfn1 and Mfn2 Coordinately Regulate Mitochondrial Fusion and are Essential for Embryonic Development. J Cell Biol (2003) 160:189–200. doi: 10.1083/jcb.200211046
63. Csordás G, Várnai P, Golenár T, Roy S, Purkins G, Schneider TG, et al. Imaging Interorganelle Contacts and Local Calcium Dynamics at the ER-Mitochondrial Interface. Mol Cell (2010) 39:121–32. doi: 10.1016/j.molcel.2010.06.029
64. Lee KS, Huh S, Lee S, Wu Z, Kim AK, Kang HY, et al. Altered ER-Mitochondria Contact Impacts Mitochondria Calcium Homeostasis and Contributes to Neurodegeneration In Vivo in Disease Models. Proc Natl Acad Sci (2018) 115:8844–53. doi: 10.1073/pnas.1721136115
65. Tiscione SA, Casas M, Horvath JD, Lam V, Hino K, Ory DS, et al. IP3R-Driven Increases in Mitochondrial Ca2+ Promote Neuronal Death in NPC Disease. Proc Natl Acad Sci (2021) 118:e2110629118. doi: 10.1073/pnas.2110629118
66. Chu J, Jeffries S, Norton JE, Capobianco AJ, Bresnick EH. Repression of Activator Protein-1-Mediated Transcriptional Activation by the Notch-1 Intracellular Domain. J Biol Chem (2002) 277:7587–97. doi: 10.1074/jbc.M111044200
67. Baughman JM, Perocchi F, Girgis HS, Plovanich M, Belcher-Timme CA, Sancak Y, et al. Integrative Genomics Identifies MCU as an Essential Component of the Mitochondrial Calcium Uniporter. Nature (2011) 476:341–45. doi: 10.1038/nature10234
68. Poston CN, Krishnan SC, Bazemore-Walker CR. In-Depth Proteomic Analysis of Mammalian Mitochondria-Associated Membranes (MAM). J Proteomics (2013) 79:219–30. doi: 10.1016/j.jprot.2012.12.018
69. De Vos KJ, Mórotz GM, Stoica R, Tudor EL, Lau KF, Ackerley S, et al. VAPB Interacts With the Mitochondrial Protein PTPIP51 to Regulate Calcium Homeostasis. Hum Mol Genet (2012) 21:1299–311. doi: 10.1093/hmg/ddr559
70. Gomez-Suaga P, Paillusson S, Stoica R, Noble W, Hanger DP, Miller CCJ. The ER-Mitochondria Tethering Complex VAPB-PTPIP51 Regulates Autophagy. Curr Biol (2017) 27:371–85. doi: 10.1016/j.cub.2016.12.038
71. Harris MH, Vander Heiden MG, Kron SJ, Thompson CB. Role of Oxidative Phosphorylation in Bax Toxicity. Mol Cell Biol (2000) 20:3590–96. doi: 10.1128/MCB.20.10.3590-3596.2000
72. Tomiyama A, Serizawa S, Tachibana K, Sakurada K, Samejima H, Kuchino Y, et al. Critical Role for Mitochondrial Oxidative Phosphorylation in the Activation of Tumor Suppressors Bax and Bak. J Natl Cancer Inst (2006) 98:1462–73. doi: 10.1093/jnci/djj395
73. Yadav N, Kumar S, Marlowe T, Chaudhary AK, Kumar R, Wang J, et al. Oxidative Phosphorylation-Dependent Regulation of Cancer Cell Apoptosis in Response to Anticancer Agents. Cell Death Dis (2015) 6:e1969. doi: 10.1038/cddis.2015.305
74. Vander Heiden MG, Chandel NS, Schumacker PT, Thompson CB. Bcl-xL Prevents Cell Death Following Growth Factor Withdrawal by Facilitating Mitochondrial ATP/ADP Exchange. Mol Cell (1999) 3:159–67. doi: 10.1016/s1097-2765(00)80307-x
75. Vander Heiden MG, Chandel NS, Williamson EK, Schumacker PT, Thompson CB. Bcl-xL Regulates the Membrane Potential and Volume Homeostasis of Mitochondria. Cell (1997) 91:627–37. doi: 10.1016/s0092-8674(00)80450-x
76. Manfredi G, Kwong JQ, Oca-Cossio JA, Woischnik M, Gajewski CD, Martushova K, et al. BCL-2 Improves Oxidative Phosphorylation and Modulates Adenine Nucleotide Translocation in Mitochondria of Cells Harboring Mutant mtDNA. J Biol Chem (2003) 278:5639–45. doi: 10.1074/jbc.M203080200
77. Chen YB, Aon MA, Hsu YT, Soane L, Teng X, McCaffery JM, et al. Bcl-xL Regulates Mitochondrial Energetics by Stabilizing the Inner Membrane Potential. J Cell Biol (2011) 195:263–76. doi: 10.1083/jcb.201108059
78. Pfleger J, He M, Abdellatif M. Mitochondrial Complex II is a Source of the Reserve Respiratory Capacity That is Regulated by Metabolic Sensors and Promotes Cell Survival. Cell Death Dis (2015) 6:e1835. doi: 10.1038/cddis.2015.202
79. Lucantoni F, Düssmann H, Llorente-Folch I, Prehn JHM. BCL2 and BCL(X)L Selective Inhibitors Decrease Mitochondrial ATP Production in Breast Cancer Cells and are Synthetically Lethal When Combined With 2-Deoxy-D-Glucose. Oncotarget (2018) 9:26046–63. doi: 10.18632/oncotarget.25433
80. Yi CH, Pan H, Seebacher J, Jang IH, Hyberts SG, Heffron GJ, et al. Metabolic Regulation of Protein N-Alpha-Acetylation by Bcl-xL Promotes Cell Survival. Cell (2011) 146:607–20. doi: 10.1016/j.cell.2011.06.050
81. Nickens KP, Wikstrom JD, Shirihai OS, Patierno SR, Ceryak S. A Bioenergetic Profile of Non-Transformed Fibroblasts Uncovers a Link Between Death-Resistance and Enhanced Spare Respiratory Capacity. Mitochondrion (2013) 13:662–67. doi: 10.1016/j.mito.2013.09.005
82. Tsvetkov P, Detappe A, Cai K, Keys HR, Brune Z, Ying W, et al. Mitochondrial Metabolism Promotes Adaptation to Proteotoxic Stress. Nat Chem Biol (2019) 15:681–89. doi: 10.1038/s41589-019-0291-9
83. Birsoy K, Possemato R, Lorbeer FK, Bayraktar EC, Thiru P, Yucel B, et al. Metabolic Determinants of Cancer Cell Sensitivity to Glucose Limitation and Biguanides. Nature (2014) 508:108–12. doi: 10.1038/nature13110
84. Howie D, Cobbold SP, Adams E, Ten Bokum A, Necula AS, Zhang W, et al. Foxp3 Drives Oxidative Phosphorylation and Protection From Lipotoxicity. JCI Insight (2017) 2:e89160. doi: 10.1172/jci.insight.8916
85. Angelin A, Gil-de-Gómez L, Dahiya S, Jiao J, Guo L, Levine MH, et al. Foxp3 Reprograms T Cell Metabolism to Function in Low-Glucose, High-Lactate Environments. Cell Metab (2017) 25:1282–93. doi: 10.1016/j.cmet.2016.12.018
86. Miska J, Lee-Chang C, Rashidi A, Muroski ME, Chang AL, Lopez-Rosas A, et al. HIF-1α Is a Metabolic Switch Between Glycolytic-Driven Migration and Oxidative Phosphorylation-Driven Immunosuppression of Tregs in Glioblastoma. Cell Rep (2019) 27:226–37. doi: 10.1016/j.celrep.2019.03.029
87. Fu Z, Ye J, Dean JW, Bostick JW, Weinberg SE, Xiong L, et al. Requirement of Mitochondrial Transcription Factor A in Tissue-Resident Regulatory T Cell Maintenance and Function. Cell Rep (2019) 28:159–71. doi: 10.1016/j.celrep.2019.06.024
88. Field CS, Baixauli F, Kyle RL, Puleston DJ, Cameron AM, Sanin DE, et al. Mitochondrial Integrity Regulated by Lipid Metabolism Is a Cell-Intrinsic Checkpoint for Treg Suppressive Function. Cell Metab (2020) 31:422–37. doi: 10.1016/j.cmet.2019.11.021
89. Dooms H, Kahn E, Knoechel B, Abbas AK. IL-2 Induces a Competitive Survival Advantage in T Lymphocytes. J Immunol (2004) 172:5973–79. doi: 10.4049/jimmunol.172.10.5973
90. Pandiyan P, Zheng L, Ishihara S, Reed J, Lenardo MJ. CD4+CD25+Foxp3+ Regulatory T Cells Induce Cytokine Deprivation- Mediated Apoptosis of Effector CD4+ T Cells. Nat Immunol (2007) 8:1353–62. doi: 10.1038/ni1536
91. Riou C, Yassine-Diab B, Van grevenynghe J, Somogyi R, Greller LD, Gagnon D, et al. Convergence of TCR and Cytokine Signaling Leads to FOXO3a Phosphorylation and Drives the Survival of CD4+ Central Memory T Cells. J Exp Med (2007) 204:79–91. doi: 10.1084/jem.20061681
92. Michalek RD, Gerriets VA, Jacobs SR, Macintyre AN, MacIver NJ, Mason EF, et al. Cutting Edge: Distinct Glycolytic and Lipid Oxidative Metabolic Programs Are Essential for Effector and Regulatory CD4+ T Cell Subsets. J Immunol (2011) 186:3299–303. doi: 10.4049/jimmunol.1003613
93. Tan H, Yang K, Li Y, Shaw TI, Wang Y, Blanco DB, et al. Integrative Proteomics and Phosphoproteomics Profiling Reveals Dynamic Signaling Networks and Bioenergetics Pathways Underlying T Cell Activation. Immunity (2017) 46:488–503. doi: 10.1016/j.immuni.2017.02.010
94. Van den Bossche J, Baardman J, Otto NA, van der Velden S, Neele AE, van den Berg SM, et al. Mitochondrial Dysfunction Prevents Repolarization of Inflammatory Macrophages. Cell Rep (2016) 17:684–96. doi: 10.1016/j.celrep.2016.09.008
95. Waters LR, Ahsan FM, Wolf DM, Shirihai O, Teitell MA. Initial B Cell Activation Induces Metabolic Reprogramming and Mitochondrial Remodeling. iScience (2018) 5:99–109. doi: 10.1016/j.isci.2018.07.005
96. Zhou X, Tang J, Cao H, Fan H, Li B. Tissue Resident Regulatory T Cells: Novel Therapeutic Targets for Human Disease. Cell Mol Immunol (2015) 12:543–52. doi: 10.1038/cmi.2015.23
97. Asano N, Watanabe T, Kitani A, Fuss IJ, Strober W. Notch1 Signaling and Regulatory T Cell Function. J Immunol (2008) 180:2796–804. doi: 10.4049/jimmunol.180.5.2796
98. Maekawa Y, Ishifune C, Tsukumo S, Hozumi K, Yagita H, Yasutomo K. Notch Controls the Survival of Memory CD4+ T Cells by Regulating Glucose Uptake. Nat Med (2015) 21:55–61. doi: 10.1038/nm.3758
99. Fowlkes BJ, Robey EA. A Reassessment of the Effect of Activated Notch1 on CD4 and CD8 T Cell Development. J Immunol (2002) 169:1817–21. doi: 10.4049/jimmunol.169.4.1817
100. Dua B, Upadhyay R, Natrajan M, Arora M, Kithiganahalli Narayanaswamy B, Joshi B. Notch Signaling Induces Lymphoproliferation, T Helper Cell Activation and Th1/Th2 Differentiation in Leprosy. Immunol Lett (2019) 207:6–16. doi: 10.1016/j.imlet.2019.01.003
101. Amsen D, Antov A, Jankovic D, Sher A, Radtke F, Souabni A, et al. Direct Regulation of Gata3 Expression Determines the T Helper Differentiation Potential of Notch. Immunity (2007) 27:89–99. doi: 10.1016/j.immuni.2007.05.021
102. Umar D, Das A, Gupta S, Chattopadhyay S, Sarkar D, Mirji G, et al. Febrile Temperature Change Modulates CD4 T Cell Differentiation via a TRPV Channel-Regulated Notch-Dependent Pathway. Proc Natl Acad Sci (2020) 117:22357–66. doi: 10.1073/pnas.1922683117
Keywords: NOTCH1, calcium, apoptosis, mitochondria, oxphos, Grp75, Tregs, mammalian cells
Citation: Saini N, Lakshminarayanan S, Kundu P and Sarin A (2022) Notch1 Modulation of Cellular Calcium Regulates Mitochondrial Metabolism and Anti-Apoptotic Activity in T-Regulatory Cells. Front. Immunol. 13:832159. doi: 10.3389/fimmu.2022.832159
Received: 09 December 2021; Accepted: 21 January 2022;
Published: 10 February 2022.
Edited by:
Loretta Tuosto, Sapienza University of Rome, ItalyReviewed by:
Sonal Srikanth, University of California, Los Angeles, United StatesJonathan Soboloff, Temple University, United States
Copyright © 2022 Saini, Lakshminarayanan, Kundu and Sarin. This is an open-access article distributed under the terms of the Creative Commons Attribution License (CC BY). The use, distribution or reproduction in other forums is permitted, provided the original author(s) and the copyright owner(s) are credited and that the original publication in this journal is cited, in accordance with accepted academic practice. No use, distribution or reproduction is permitted which does not comply with these terms.
*Correspondence: Apurva Sarin, sarina@instem.res.in