


Abstract
Altered DNA methylation contributes to tumorigenesis by affecting gene expression in a heritable fashion. Phenobarbital (PB) is a nongenotoxic rodent carcinogen which induces global hypomethylation and regions of hypermethylation in mouse liver. Liver tumor–sensitive (B6C3F1) and –resistant (C57BL/6) male mice were administered 0.05% (wt/wt) PB in drinking water for 2 or 4 weeks, and a 2-week recovery was included following each dosing period. DNA was isolated from liver (target) and kidney (nontarget) tissues. The methylation status of GC-rich regions of DNA was assessed via methylation-sensitive restriction digestion, arbitrarily primedpolymerase chain reaction, and capillary electrophoretic separation of products. PB-induced regions of altered methylation (RAMs) which carry forward from an early to a later time point are more likely to be mechanistically relevant as compared to those that do not. Twelve of 69 RAMs (17%) present in B6C3F1 liver at 2 weeks were also seen at 4 weeks, while only 1 of the 123 RAMs (< 1%) present in C57BL/6 liver was seen at 4 weeks. In the B6C3F1 mice, 57 unique (as compared to the C57BL/6) regions of altered hepatic methylation (RAMs), predominantly hypomethylation, were observed at 2 weeks, increasing to 86 at 4 weeks. Changes in methylation were largely reversible. Altered methylation in liver was highly dissimilar to that of kidney. Following 4 weeks PB, bisulfite sequencing revealed hypomethylation of Ha-ras in B6C3F1, but not C57BL/6, which correlated with increased gene expression. These data indicate that (1) progressive, nonrandom changes in methylation provide an epigenetic mechanism underlying the ability of PB to cause mouse liver tumorigenesis and (2) susceptibility to tumorigenesis is related inversely to the capacity to maintain normal patterns of methylation.
Phenobarbital (PB) is a rodent liver carcinogen which lacks the ability to damage DNA in a direct fashion (Whysner et al., 1996, 1998). Therefore, it is considered to be a nongenotoxic compound. PB is frequently used as a model compound in carcinogenesis studies. Susceptibility to liver cancer varies widely with genetic background in mice. B6C3F1 mice are particularly sensitive to the formation of liver tumors. They are the first-generation product of mating relatively resistant female C57BL/6 mice with highly susceptible male C3H/He mice. Spontaneous rates of liver tumor formation are high in the sensitive B6C3F1 mice (29%) as compared to the resistant C57BL/6 mice (0%), and administration of PB (0.05% wt/wt in drinking water) results in a 100% hepatic tumor incidence in B6C3F1 mice, while the incidence in the C57BL/6 strain is 0% (Becker, 1982). Additionally, N-nitrosodiethylamine (DEN), a classic genotoxic carcinogen, is far more potent with regard to producing liver tumors in B6C3F1 as compared to C57BL/6 mice (Buchmann et al., 1991; Drinkwater and Ginsler, 1986). Interestingly, the activation of the Ha-ras proto-oncogene via a point mutation in codon 61 occurs at a different frequency in spontaneous, DEN-induced, and PB-induced B6C3F1 liver tumors. The incidence is approximately 50–60% in spontaneous tumors (Fox et al., 1990; Stowers et al., 1988) and 30–35% in DEN-induced tumors (Buchmann et al., 1991; Stowers et al., 1988), while it is only 7% in the PB-induced tumors (Fox et al., 1990). This indicates that the mechanism by which PB causes these tumors might be somewhat different than that of DEN and is not simply a “magnification” of what occurs spontaneously.
Operationally, carcinogenesis can be described experimentally as having three defined stages: initiation, promotion, and progression (Dragan et al., 1993). Cells possessing heritable changes in the genome, acquired during initiation, are selected for and proliferate, given an appropriate promoting stimulus, and eventually are able to progress to frank carcinomas. Exceedingly aberrant subclone populations arise with the progressive accumulation of either mutations or, importantly, epigenetic changes. Specifically, DNA methylation is an epigenetic modification which, when altered, can affect the normal expression of genes in a heritable fashion (Goodman and Watson, 2002). Therefore, altered patterns of methylation are thought to play a causative role in all stages of tumorigenesis, and this is not incompatible with a role for mutations, too (Goodman and Watson, 2002).
Increased DNA methylation (hypermethylation) may silence the expression of tumor suppressor genes (Goodman and Watson, 2002; Jones and Baylin, 2002), while decreased methylation (hypomethylation) may facilitate the expression of oncogenes (Costello and Plass, 2001; Goodman and Watson, 2002). While most attention was previously focused on hypermethylation, the contribution of hypomethylation is gaining more interest. Retrotransposable elements, e.g., Long Interspersed Elements 1 (LINE-1) elements, are normally kept in a highly methylated state in order to keep them transcriptionally silenced. Hypomethylation may lead to their expression resulting in genomic instability which could play a role in tumorigenesis (Carnell and Goodman, 2003). Mice with decreased DNA methyltransferase 1 (Dnmt1) expression exhibit genome-wide DNA hypomethylation, chromosomal instability, and activation of oncogenes. Additionally, they develop aggressive T-cell lymphomas (Gaudet et al., 2003). Fibroblasts, derived from embryonic stem (ES) cells, which were transiently demethylated in order to cause loss of imprinting, were tumorigenic when placed into immunosuppressed mice (Holm et al., 2005). Furthermore, chimeric mice derived from the ES cells, which lacked imprinting, developed tumors in multiple tissues, which arose from the ES cells (Holm et al., 2005). Actually, there are multiple roles for altered DNA methylation in carcinogenesis, and this likely involves a combination of selected hypo- and hypermethylations of key genes (Counts and Goodman, 1995).
A global decrease in hepatic DNA methylation, which occurs simultaneously with hypermethylation of GC-rich regions, is more pronounced in the liver tumor–prone B6C3F1 mouse as compared to the resistant C57BL/6 mice treated with PB (Counts et al., 1996; Watson and Goodman, 2002). Thus, it has been hypothesized that sensitivity to tumorigenesis may be related inversely to the capacity to maintain normal patterns of DNA methylation (Counts et al., 1996; Goodman and Watson, 2002; Watson and Goodman, 2002).
Altered patterns of DNA methylation in GC-rich regions of DNA were measured in response to a tumor-promoting dose of PB in target (i.e., liver) and nontarget (i.e., kidney) tissues. Reversibility, a hallmark of tumor promotion, was assessed for the observed changes in liver. The methylation status of the promoter regions of Ha-ras and LINE-1 elements were measured and correlated to changes in gene expression. Relatively resistant C57BL/6 mice are used as a “control” in comparison to the tumor-prone B6C3F1 mice in testing the hypothesis that progressive, nonrandom changes in methylation underlie susceptibility to tumorigenesis.
MATERIALS AND METHODS
Animals
Male B6C3F1 (C57BL/6 × C3H/He) and C57BL/6 mice (ages 29–32 days) were obtained from Charles River Laboratories (Wilmington, MA). Animals were allowed to acclimate for 7 days prior to being randomly assigned to treatment groups. B6C3F1 mice were housed five per cage and C57BL/6 mice were housed individually, in a temperature-controlled environment and given food and water ad libitum. Care was given in accordance with the All Use and Animal Care Guidelines of the Michigan State University. Mice, six to seven animals per group, were administered PB at a concentration of 0.05% (wt/wt) in the drinking water for 2 or 4 weeks. Recovery groups were given control water for 2 weeks subsequent to dosing. In this manner, reversibility of alterations in methylation induced by PB can be assessed. Mice were euthanized by CO2 asphyxiation, and the livers and kidneys were snap frozen at −80°C.
DNA and RNA isolation.
In order to isolate DNA, 1 ml of TRIzol Reagent (Invitrogen, Carlsbad, CA) per 100 mg frozen sample was added to a dounce homogenizer. Frozen liver or kidney tissue was added to the TRIzol Reagent and thoroughly homogenized. RNA and DNA were isolated according to the manufacturer's protocol.
Arbitrarily Primed Polymerase Chain Reaction and Capillary Electrophoresis
A comparison of data obtained from DNA isolated from control and treated tissue permits the simultaneous detection of treatment-related increased methylation (more methylation in a region that was methylated in control), decreased methylation (less methylation in a region that was methylated in control), and new methylations (methylation in regions that were not methylated in control). Therefore, the procedure we have developed provides an in-depth picture of treatment-related altered methylation (Bachman et al., in press).
Restriction Digests
DNA samples, of which duplicates are prepared, are subjected to double digests with restriction enzymes: (1) a methylation-insensitive enzyme and (2) a methylation-sensitive enzyme. RsaI and BfaI are the methylation-insensitive enzymes, which are used initially to cut DNA into fragments facilitating complete digestion by the second enzyme, a methylation-sensitive restriction enzyme. The methylation-sensitive enzymes used in this study were MspI, HpaII, and BssHII. Restriction digestion with RsaI/MspI and RsaI/HpaII was performed as described previously (Bachman et al., in press).
BssHII recognizes GCGCGC and cuts between the 5′ guanine and cytosine. These sequences are predominantly found within CpG islands, and therefore, cutting is less frequent (Shiraishi et al., 1995). Generally, BssHII restricts its target sequence only if all cytosines are unmethylated. Restriction digests contain 1 μg DNA and 5.0 units BfaI in 1X New England Biolabs Buffer 4. Samples are incubated for 1 h at 37°C before the addition of 2.5 units BssHII. Following the addition of BssHII, the incubation temperature is raised to 50°C. A second 2.5-unit aliquot of BssHII is added after an additional 2 h, and in order to ensure complete digestion, total incubation time is 18 h. The enzymes were inactivated by incubating at 80°C for 10 min. Samples were stored at 4°C until analyzed.
Arbitrarily Primed Polymerase Chain Reaction and Capillary Electrophoretic Separation of Products
Arbitrarily primed polymerase chain reaction (AP-PCR) is performed on restriction digests using a single arbitrary primer, 5′ AAC CCT CAC CCT AAC CCC GG 3′ (modified from Gonzalgo et al., 1997), fluorescently labeled at the 5′ end with HEX (purchased from Integrated DNA Technologies, Coralville, IA). This primer was designed to bind well to GC-rich regions, and the 5′ CCGG 3′ sequence at its 3′ end increases the probability of primer annealing to the MspI and HpaII restriction site, allowing for the detection of methylation at the site of primer annealing and between sites of primer annealing. The procedures for AP-PCR and capillary electrophoresis were performed as described previously (Bachman et al., in press).
Data Analysis
The results represented as size of PCR products, in base pairs (bp), and their corresponding peak areas are analyzed using the Excel program. A consensus average peak area for each PCR product reported in control and treated groups is prepared, and the consensus control and treated peak areas at a specific PCR product are compared. This permits us to detect treatment-related (1) hypomethylations, which include both 100% decreases and decreases which are statistically significant when compared to control, (2) hypermethylations, which are increases which are statistically significant when compared to control, and (3) new methylations, which are indicated by the formation of a PCR product following treatment which was not formed under control conditions. Significance is determined via a Student's t-test, p < 0.05. The detailed procedure for data analysis has been described previously (Bachman et al., in press).
Reversibility of Altered Methylation: Calculations
A detailed description of the approach taken to calculate reversibility of altered methylation is provided as Supplemental Data.
Assumptions
Analysis of the data includes the following assumptions: (1) each separate PCR product of a defined size represents a distinct region of the genome, (2) a region can include one or more recognition sequences for the specific methylation-sensitive restriction enzyme employed located between the annealing sites of the up- and downstream primers; thus, the amount of each PCR product formed can be viewed as representing an “average” of the methylation status of the particular recognition sequences located between the up- and downstream primers, and (3) changes in the amount of each PCR product represent the altered methylation status of a particular GC-rich region of DNA.
Common and Unique Regions of Altered Methylation
PCR products of identical size that occur in two treatment groups (e.g., 2 and 4 weeks 0.05% PB) were considered to be common regions of altered methylation (RAMs). The methylation changes associated with RAMs, in common between the two treatment groups are considered equivalent and persistent if the changes in methylation are in the same direction and the extents of change are statistically not different as determined by two-way ANOVA, p = 0.05. RAMs in common between the two treatment groups are considered unique RAMs if, (1) the changes in methylation are opposite in direction (i.e., a hypomethylation is elicited by one treatment and a new methylation is elicited in the same region by the comparison treatment) or (2) the changes in methylation are in the same direction but the extents of change are statistically different as determined by two-way ANOVA, p = 0.05. RAMs are deemed to be unique if they are only observed in a particular treatment group.
Evaluating Total RAMs when the Methylation-Sensitive Isoschizomers MspI and HpaII Are Employed
Although both HpaII and MspI restrict CCGG sites, HpaII identifies altered methylation at the internal cytosine, while MspI identifies altered methylation at the external cytosine. Therefore, the RsaI/MspI and RsaI/HpaII digests were considered separate experiments to determine regions of the genome which exhibit altered methylation in response to treatment. When we look at the total number of RAMs identified by HpaII and MspI, there is the unavoidable possibility that a slight amount of double counting might occur. This would be the case if methylation was altered at both the internal and external cytosine within CCGG sites of a particular genomic region. Therefore, we would be considering differences in methylation within a given region even if there were some “double counting” of RAMs.
Percent Dissimilarity Calculations
Control Versus Treatment
The dissimilarity between control patterns of methylation and altered patterns resulting from PB administration was calculated. The total number of PCR products reporting in control was added to the total number of unique PCR products (i.e., those PCR product sizes that were not formed under control conditions) reporting from treatment to get the total number of combined PCR products. This represents the total number of regions (PCR products) analyzed between the two groups. The total number of regions (PCR products) exhibiting a statistically significant change (hypomethylations, hypermethylations, and new methylations) divided by the total number of combined PCR products times 100 equals the percent dissimilarity from control.
PB-Treated B6C3F1 Versus PB-Treated C57BL/6
The dissimilarity between the extent of altered methylation due to PB in C57BL/6 in comparison to B6C3F1 at 2 and 4 weeks was calculated. Unique RAMs were identified for the B6C3F1 mouse. These include (1) RAMs in common with C57BL/6, but the methylation change is opposite in direction, (2) RAMs in common with C57BL/6, but the extent of change is statistically greater (two-way ANOVA, p < 0.05) in B6C3F1, and (3) RAMs which are only observed in the B6C3F1 mouse. The unique RAMs were divided by the total RAMs (i.e., all hypomethylations, hypermethylations, and new methylations in B6C3F1 mouse) and multiplied by 100 to get the percent dissimilarity. In addition, the dissimilarity between the extent of altered methylation due to PB in liver in comparison to kidney for B6C3F1 and C57BL/6 was calculated. Unique RAMs were identified for the liver. These include (1) RAMs in common with kidney, but the methylation change is opposite in direction, (2) RAMs in common with kidney, but the extent of change is statistically greater (two-way ANOVA, p < 0.05) in liver, and (3) RAMs which are only observed in the liver. The unique RAMs were divided by the total RAMs (i.e., all hypomethylations, hypermethylations, and new methylations in liver) and multiplied by 100 to get the percent dissimilarity.
Gene-Specific Methylation Analysis: Bisulfite Sequencing of 5′ Promoter Region of Ha-ras
Bisulfite Conversion and PCR Amplification
Bisulfite conversion of DNA effectively deaminates all unmethylated cytosines to uracil leaving methylated cytosines unaffected. Two micrograms of DNA was bisulfite converted using the EZ DNA Methylation Kit (Zymo Research, Orange, CA). PCR is performed with bisulfite-converted DNA, which allows for the replacement of uracil with thymine and 5-methylcytosine with cytosine. Consequently, only cytosines that were originally methylated remain in the DNA sequence. PCR is carried out using primers specific for bisulfite-converted DNA and containing no CpG sites. The two Ha-ras primers, 5′ GGT GGG TTA GAG TGT TTA AGA TTT G 3′ and 5′ CTC TTA CTC TAA AAA ACA TTT CCA C 3′ were used to amplify the −950 nt to −1232 nt (283 bp) region of the Ha-ras promoter relative to the transcriptional start site. Primers were designed based on sequence information obtained from Brown et al. (1988) and Neades et al. (1991). Each PCR reaction contained 0.5 μg bisulfite-converted DNA, 1X Failsafe Buffer G (Epicentre; Madison, WI), 0.3μM of each primer, 1.5 units Taq Polymerase (Invitrogen), and glass distilled water (GDW) to a final volume of 25 μl. Cycling conditions were as follows: 95°C for 3 min, 38 cycles of 95°C for 45 s, 58°C for 45 s, and 72°C for 1 min, followed by one time delay cycle of 72°C for 3 min and a 4°C soak. Amplification of the target region was verified by gel electrophoresis on a 3% agarose gel. Duplicate Ha-ras PCR reactions were combined and purified using the Qiagen Qiaquick PCR Purification Kit. Samples were quantified fluorometrically.
Sequencing
Automated sequencing of purified Ha-ras PCR products was carried out at the Genomics Technology Support Facility at Michigan State University using an ABI PRISM 3100 Genetic Analyzer. Two separate sequencing reactions are performed for each gene. Sequencing reactions are composed of 20 ng PCR product, 30 pmol of either the forward primer or reverse primer, and glass-distilled water to 12 μl.
Reverse Transcription of RNA
RNA samples were treated with DNaseI (Invitrogen) to purify the RNA from contaminating the DNA remaining after isolation. Each reaction contained 2 μg RNA, 1X DNaseI reaction buffer, 2 units DNaseI, and diethylpyrocarbonate (DEPC)-treated GDW to a final volume of 20 μl. Samples were incubated at room temperature for 15 min followed by addition of MgCl2 to a final concentration of 2.27mM. RNA was heated to 65°C for 10 min to inactivate the DNaseI enzyme. The TaqMan Reverse Transcription Kit (Applied Biosystems; Foster City, CA) was used to reverse transcribe the DNaseI-treated RNA. Each reverse transcription reaction contained, 1X reverse transcription reaction buffer, 5.5mM MgCl2, 200μM of each dNTP, 2.5μM random hexamer, 20 units RNase inhibitor, 62.5 units Multiscribe Reverse Transcriptase, and DEPC-treated GDW to a final volume of 50 μl. The reactions are incubated at 25°C for 10 min, 42°C for 1 h, and 95°C for 5 min. All samples were stored at 4°C until needed.
Expression of Ha-ras and LINE-1
Real-Time PCR: Primers
A custom TaqMan assay including primers (forward 5′ TGG TGG GCA ACA AGT GTG A 3′ and reverse 5′ GGC CTG CCG AGA CTC A 3′) and probe (5′ FAM CTG GCT GCT CGC ACT GT 3′) specific for exon 3 of the Ha-ras gene was purchased from Applied Biosystems. The assay was designed based on sequence information obtained from Brown et al. (1988) and Neades et al. (1991). A custom TaqMan assay including primers (forward: 5′ GGT CAA ATC TAA GTG GAT CAA GGA ACT 3′ and reverse: 5′ GCT TTT CCC CAC TTT CTC CTC TAT 3′) and probe (5′ FAM CAG AGA CAC TGA AAC TT 3′) specific for open reading frame 2 of the LINE-1 element (Accession M13002) was purchased from Applied Biosystems. In addition, an Applied Biosystems custom TaqMan assay including primers (forward: 5′ CTA CTA CCG ATT GGA TGG TTT AGT GA 3′ and reverse: 5′ GTC AAG TTC GAC CGT CTT CTC A 3′) and probe (FAM 5′ CCG TGG GCC GAC CC 3′) was used for the control gene, 18S rRNA (Accession X00686).
Real-Time PCR
Triplicate reactions for both the gene of interest (Ha-ras or LINE-1) and the control gene (18S) were prepared per sample. Standards were also prepared for 18S, Ha-ras, and LINE-1 and ranged from 5 × 101 copies/μl to 5 × 10⁷ copies/μl. Each Ha-ras or LINE reaction contained 1× Custom Assay Mix (Applied Biosystems), 1× TaqMan Universal PCR MasterMix, 8 μl cDNA, and GDW to a final volume of 25 μl. Each 18S reaction contained 1× Custom Assay Mix (Applied Biosystems), 1× TaqMan Universal PCR MasterMix, 2 μl 1:100 diluted cDNA, and GDW to a final volume of 25 μl. Reactions for each standard contained 1× Custom Assay Mix (Applied Biosystems), 1× TaqMan Universal PCR MasterMix, 2 μl standard, and GDW to a final volume of 25 μl. Cycling conditions were as follows: 50°C for 2 min, 95°C for 10 min, and 40 cycles of 95°C for 15 s and 60°C for 1 min. The absolute standard curve method for quantifying fold change over control was employed.
RESULTS
Genome-wide analysis of altered methylation in GC-rich regions in response to 2 or 4 weeks PB, 0.05% (wt/wt) in the diet, discerned numerous RAMs and established the occurrence of hypomethylations, hypermethylations, and new methylations in B6C3F1 and C57BL/6 mice. B6C3F1 mice exhibited 69 total RAMs, primarily hypomethylations, at 2 weeks (Table 1). With 4 weeks of treatment, hypomethylated, hypermethylated, and new RAMs in the B6C3F1 mice increased to 98, a 42% increase in total RAMs. In contrast, while a large numbers of RAMs (123 total) were observed in the liver of C57BL/6 mice at 2 weeks, the total decreased to 88, a 28% decrease, primarily due to a lower number of hypermethylations and new methylations at the later time point (Table 1).
Methylation-Sensitive Digestion with RsaI/MspI or RsaI/HpaII: Summary of GC-Rich RAMs in the Liver of B6C3F1 and C57BL/6 Mice in Response to 2 or 4 weeks 0.05% PB
Treatment | Digest | RAMs hypomethylationa | RAMs hypermethylationb | RAMs “new” methylationc | Total | |||||
|---|---|---|---|---|---|---|---|---|---|---|
| 2 Weeks 0.05% PB | ||||||||||
| B6C3F1 | HpaII | 20 | 1 | 6 | 27 | |||||
| MspI | 26 | 6 | 10 | 42 | ||||||
| Totald | 46 | 7 | 16 | 69 | ||||||
| C57BL/6 | HpaII | 19 | 6 | 17 | 42 | |||||
| MspI | 18 | 33 | 30 | 81 | ||||||
| Totald | 37 | 39 | 47 | 123 | ||||||
| 4 Weeks 0.05% PB | ||||||||||
| B6C3F1 | HpaII | 13 | 4 | 21 | 38 | |||||
| MspI | 46 | 7 | 7 | 60 | ||||||
| Totald | 59 | 11 | 28 | 98 | ||||||
| C57BL/6 | HpaII | 36 | 8 | 9 | 53 | |||||
| MspI | 35 | 0 | 0 | 35 | ||||||
| Totald | 71 | 8 | 9 | 88 | ||||||
Hypomethylated RAMs include both statistically significant (p < 0.05) decreases and 100% decreases.
Hypermethylated RAMs are only those increases which are statistically significant (p < 0.05).
New methylations indicate the formation of a PCR product following treatment due to a gain of methylation either at the site of primer annealing or between sites of primer annealing which was not present under control conditions.
Total RAMs including hypomethylations, hypermethylations, and new methylations for the combined digests are reported for each treatment.
Quantifying hypomethylated, hypermethylated, and newly methylated RAMs allows for the identification and comparison of patterns and trends of PB-induced altered methylation between the liver tumor–prone B6C3F1 mice and the relatively resistant C57BL/6 mice. Additionally, assessing the extent to which 2 or 4 weeks PB disrupted methylation patterns as compared to controls is important, too. An evaluation of percent dissimilarity provided an initial, overall assessment of PB's effects in B6C3F1 and C57BL/6 mice. Methylation patterns arising from 2 weeks PB were 45 and 67% dissimilar to methylation patterns of controls in B6C3F1 and C57BL/6 mice, respectively (Supplementary Data). At 4 weeks, dissimilarity increased to 61 and 79% (Supplementary Data).
Overall, dissimilarities revealed that PB-induced patterns of methylation in C57BL/6 deviated from controls slightly more than in B6C3F1, emphasizing the need for a more refined approach to identify, evaluate, and prioritize changes in methylation, which might mechanistically be important regarding promotion of tumorigenesis. An important feature of the promotion stage of tumorigenesis is the progressive accumulation of heritable alterations to the genome. Therefore, we evaluated the number of changes in methylation which “carry forward” over time during PB treatment. Carry forward RAMs, identified in the B6C3F1 and C57BL/6 mice, included all RAMs that were in common between the 2- and 4-week time points, which exhibited equivalent changes in methylation (Fig. 1A). RAMs identified only at 4 weeks plus those RAMs which were in common with those identified at 2 weeks but the methylation change was either (1) opposite in direction or (2) changing to a greater extent at 4 weeks were classified as unique RAMs (Fig. 1A). A total of 12 PB-induced RAMs (17% of the total RAMs observed at 2 weeks) including 9 hypomethylations, 1 hypermethylation, and 2 new methylations, carried forward from 2 to 4 weeks in B6C3F1 liver (Fig. 1B). Strikingly, only one hypomethylation out of 123 total RAMs (< 1%) in C57BL/6 liver was seen to carry forward to 4 weeks (Fig. 1B).
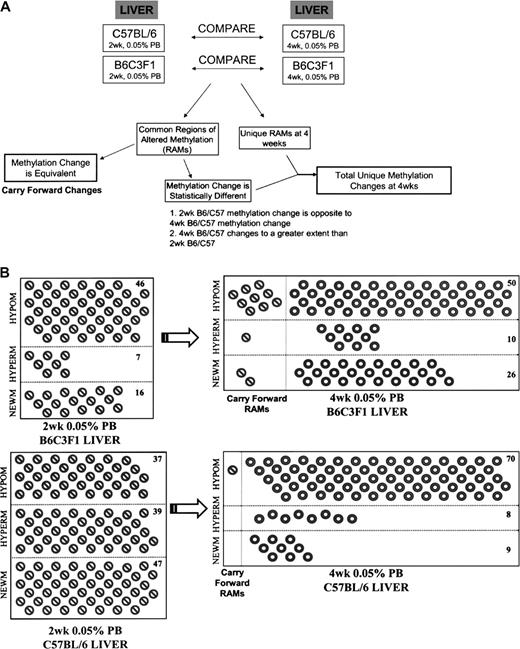
Progressive changes in methylation: changes which carry forward from 2 to 4 weeks in B6C3F1 and C57BL/6 mice. The flow chart illustrates the steps necessary to determine progressive changes in methylation. Separate comparisons between B6C3F1 and C57BL/6, 2, and 4 weeks RAMs were performed (A). RAMs induced by 2 weeks, 0.05% PB promotion are represented ( ) for B6C3F1 and C57BL/6 mice. RAMs induced by 2 weeks PB were compared to those resulting from 4 weeks PB in B6C3F1 and C57BL/6 mice. Common RAMs in which the magnitudes of change were equivalent (two-way ANOVA, p < 0.05) were considered carry forward changes. RAMs unique to 4 weeks, PB (
 ) included common RAMs in which the magnitudes of changes were different or the RAMs which were only observed with 4 weeks PB (B). Hypomethylations (HYPOM), hypermethylations (HYPERM), and new methylations (NEWM) are segregated. Total unique changes (minus carry forward changes) are tallied and reported for each category of methylation change.
Two- and 4-week periods of promotion with PB were followed by 2 weeks of recovery periods. Figure 2 illustrates that with 2 weeks PB exposure and 2 weeks recovery in B6C3F1 mouse liver, 100% (7/7) of the hypermethylations and 75% (12/16) of the new methylations reversed. In addition, a large number of hypermethylations (73%, 8/11) and new methylations (61%, 17/28), which included two of the persistent RAMs, were seen to reverse during the recovery period following 4 weeks of PB administration. Recovery was similar in C57BL/6 mice in that 31% (12/39) and 100% (8/8) of hypermethylations and 51% (24/47) and 89% (8/9) of new methylations reversed during the 2-week recovery following 2 and 4 weeks PB exposure, respectively. This illustrates that increases in methylation, which accumulate in response to the promoting stimuli, are largely reversible following a relatively brief period of promoter treatment. However, the reversibility of hypomethylated RAMs in both B6C3F1 and C57BL/6 mice was rather low and may indicate that 2 weeks is insufficient for “remethylation” of unmethylated cytosines (Fig. 3).
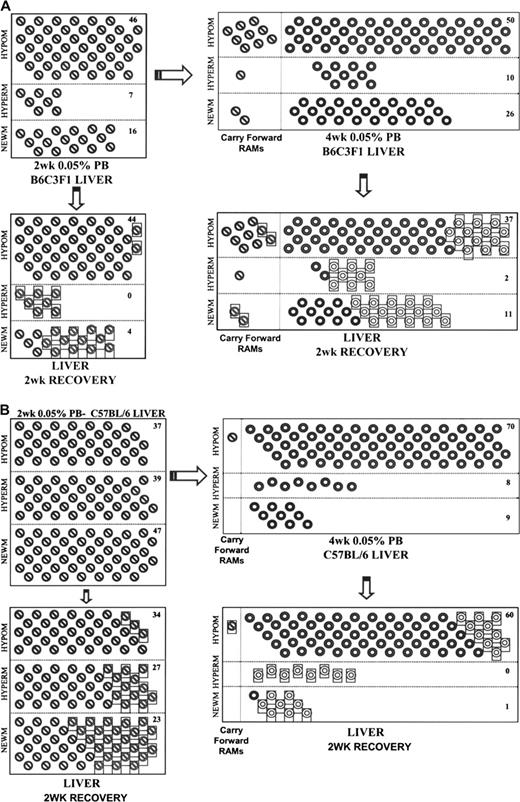
Progressive changes in methylation: reversibility of RAMs induced by PB. Hypomethylations (HYPOM), hypermethylations (HYPERM), and new methylations (NEWM) are represented for 2 weeks () and 4 weeks () 0.05% PB promotion. RAMs which carried forward from 2 to 4 weeks are also represented (). RAMs induced by 2 or 4 weeks PB which reversed during the 2-week recovery periods in B6C3F1 (A) and C57BL/6 (B) are boxed. Total unique changes (minus carry forward RAMs and RAMs which reversed) are tallied and reported for each category of methylation change.
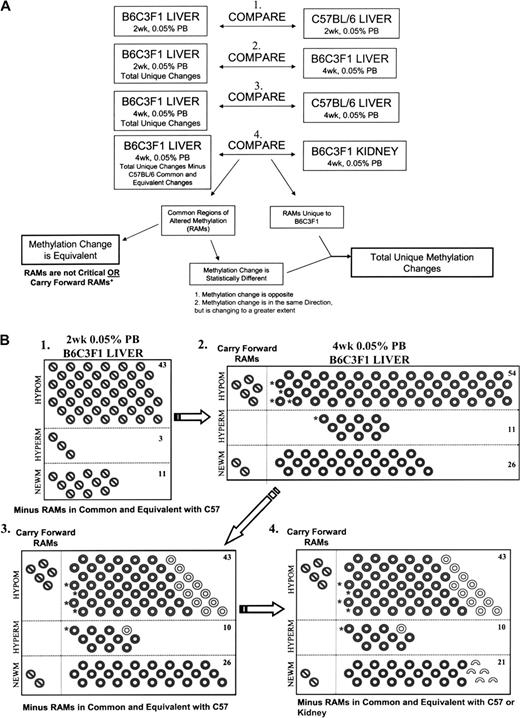
Identification of PB-induced unique and carry forward RAMs in B6C3F1 liver. The flow chart illustrates the four steps necessary in defining the unique and carry forward PB-induced RAMs in B6C3F1 liver. Four separate comparisons were performed (A). 1. B6C3F1 unique RAMs induced by 2 weeks 0.05% PB promotion are represented (). 2. B6C3F1 unique RAMs induced by 2 weeks PB were compared to total RAMs resulting from 4 weeks 0.05% PB. Common RAMs in which the magnitudes of change were equivalent (two-way ANOVA, p < 0.05) were considered carry forward changes. RAMs unique to 4 weeks 0.05% PB () included common RAMs in which the magnitudes of change were different or the RAMs were only observed with 4 weeks 0.05% PB. 3. B6C3F1 total RAMs were compared to C57BL/6 total RAMs. RAMs which are in common with C57BL/6 and exhibit equivalent changes in methylation are identified ( ). 4. B6C3F1 total RAMs minus C57BL/6 common and equivalent changes were compared to B6C3F1 RAMs in kidney. RAMs which are in common with C57BL/6 () and kidney (
 ) and exhibit equivalent changes in methylation are identified. Hypomethylations (HYPOM), hypermethylations (HYPERM), and new methylations (NEWM) are segregated. Total unique changes (minus carry forward changes and changes in common and equivalent with C57BL/6 or kidney) are tallied and reported for each category of methylation change. (+) RAMs are considered less critical if the RAMs are in common with C57BL/6 and the change in methylation is equivalent. Carry forward RAMs are only determined with comparison (2) in which 2 weeks B6C3F1 total unique RAMs are compared to 4 weeks B6C3F1 RAMs. (*) RAMs which are in common and equivalent in B6C3F1 and C57BL/6 at 2 weeks but only observed in B6C3F1 at 4 weeks.
In light of the extreme difference between B6C3F1 and C57BL/6 mice in terms of changes in methylation which carry forward over time, the prime focus of the investigation was on identifying specific differences as well as similarities in RAMs between the liver tumor–prone B6C3F1 and the relatively resistant C57BL/6 mice. We focused on ascertaining which PB-induced increases (i.e., hypermethylations and new methylations) or decreases (i.e., partial and complete hypomethylations) in methylation occurred in the same regions of the genome. For each specific region, changes in methylation identified in B6C3F1 and C57BL/6 hepatic DNA were compared and classified as (1) equivalent, (2) opposite in direction (e.g., hypomethylation in the B6C3F1 and hypermethylation in the C57BL/67), or (3) changing in the same direction, but to a greater extent in the B6C3F1. Additionally, those RAMs which were unique to the B6C3F1 mouse are emphasized. Initially, by using this information, we were able to calculate an overall dissimilarity between PB-induced patterns of altered methylation in B6C3F1 mice as compared to those in the C57BL/6 mice. With 2 and 4 weeks of PB exposure, the patterns of altered methylation in the livers of B6C3F1 mice were 81 and 85%, respectively, dissimilar to those in C57BL/6 (Supplementary Data).
By subtracting out the individual RAMs that were both in common and equivalent between B6C3F1 and C57BL/6 (i.e., the 19 and 15% similarities) at the 2- and 4-week time points, we were able to further prioritize which RAMs are most unique to the B6C3F1 mice and, therefore, likely to contribute to liver tumor formation (Fig. 3A). Figure 3B, comparison 1 represents the total unique RAMs (i.e., all RAMs that were in common and equivalent to C57BL/6 are not represented) in the B6C3F1 mice at 2 weeks. This pool of B6C3F1 total unique RAMs (i.e., total RAMs minus RAMs in common with C57BL/6) was compared to the total B6C3F1 RAMs identified at 4 weeks and established that 7 of the 57 unique RAMs observed at 2 weeks carried forward to 4 weeks (Fig. 3B, comparison 2.). Additionally, 54 hypomethylations, 11 hypermethylations, and 26 new methylations were all unique to the B6C3F1 mouse at 4 weeks, and this adds up to a total of 98 RAMs in B6C3F1 at the 4-week time point (Fig. 3B, comparison 2.). A comparison of 4 week PB-induced RAMs in B6C3F1 and C57BL/6 mice identified 12 common RAMs with equivalent changes in methylation (Fig. 3B, comparison 3.) These RAMs were subtracted from the total changes observed in the B6C3F1 mice at 4 weeks because they are considered less likely to contribute to tumor formation, and this results in a total of 86 RAMs in B6C3F1 at the 4-week time point. This includes five RAMs which were observed in both B6C3F1 and C57BL/6 mice at 2 weeks but only in the B6C3F1 at 4 weeks, (Fig. 3B, comparison 3). These 5 RAMs plus the 7 carry forward RAMs make up the 12 total carry forward RAMs initially identified for the B6C3F1 mice (Fig. 2A).
Methylation status of the DNA of kidneys of B6C3F1 and C57BL/6 mice allowed for a comparison between liver and kidney (a nontarget for PB-induced tumorigenesis) tissue. A substantial number of PB-induced RAMs were observed in kidney DNA. Changes in methylation were induced in B6C3F1 kidney at 4 weeks. However, in comparison to liver, they were fewer in number and, importantly, did not include hypomethylated RAMs, a distinct feature of PB-induced alterations in the liver (Table 2). Altered methylation in the kidney of C57BL/6 mice mirrored the pattern of altered methylation in the liver; however, the total number of RAMs was much lower in kidney (Table 2). It was instructive to determine the degree of similarity in altered patterns of methylation between the kidney and the liver of each of the different mice. In B6C3F1 mice, RAMs induced by PB in the liver were 94% dissimilar to those in kidney, whereas in C57BL/6 mice RAMs in the liver were 85% dissimilar to those in kidney (Supplementary Data).
Methylation-Sensitive Digestion with RsaI/MspI or RsaI/HpaII: Summary of GC-Rich RAMs in Liver and Kidney of B6C3F1 and C57BL/6 Mice in Response to Treatment with 0.05% PB for 4 Weeks
Treatment | Digest | RAMs hypomethylationa | RAMs hypermethylationb | RAMs new methylationc | Total |
|---|---|---|---|---|---|
| B6C3F1 | |||||
| Liver | HpaII | 13 | 4 | 21 | 38 |
| MspI | 46 | 7 | 7 | 60 | |
| Totald | 59 | 11 | 28 | 98 | |
| Kidney | HpaII | 0 | 8 | 33 | 41 |
| MspI | 0 | 2 | 23 | 25 | |
| Totald | 0 | 10 | 56 | 66 | |
| C57BL/6 | |||||
| Liver | HpaII | 36 | 8 | 9 | 53 |
| MspI | 35 | 0 | 0 | 35 | |
| Totald | 71 | 8 | 9 | 88 | |
| Kidney | HpaII | 4 | 0 | 1 | 5 |
| MspI | 18 | 2 | 2 | 22 | |
| Totald | 22 | 2 | 3 | 27 |
Hypomethylated RAMs include both statistically significant (p < 0.05) decreases and 100% decreases.
Hypermethylated RAMs are only those increases which are statistically significant (p < 0.05).
New methylations indicate the formation of a PCR product following treatment due to a gain of methylation either at the site of primer annealing or between sites of primer annealing which was not present under control conditions.
Total RAMs including hypomethylations, hypermethylations, and new methylations for the combined digests are reported for each treatment group.
In much the same way that C57BL/6 was used as a control for trying to discern critical RAMs in B6C3F1 liver, patterns of altered methylation in B6C3F1 kidney can be compared to B6C3F1 liver to further distinguish which changes in methylation are likely to be critical in B6C3F1 liver. This analysis identified five common RAMs with equivalent changes in methylation (Fig. 3B, comparison 4.) These RAMs were subtracted from the total unique changes because they are considered less likely to contribute to tumor formation. Therefore, of the 98 total RAMs detected in the liver of B6C3F1 mice at 4 weeks, 74 unique RAMs plus the 7 RAMs which carried forward from 2 to 4 weeks represent the PB-induced changes in methylation observed solely in B6C3F1 mouse liver.
Analysis of altered methylation was also assessed using the methylation-insensitive enzyme BfaI in conjunction with the methylation-sensitive enzyme BssHII. BfaI restricts CpG islands less than RsaI, and BssHII has a 6-base recognition sequence (Shiraishi et al., 1995) as compared to the 4-base recognition sequence of MspI and HpaII. Patterns of methylation detected at 2 and 4 weeks in B6C3F1 and C57BL/6 mice using BssHII were similar to those detected with MspI and HpaII. Few changes were observed at 2 weeks in both B6C3F1 and C57BL/6 mice (Table 3). At 4 weeks, B6 exhibited 25 total RAMs as compared to 12 RAMs in C57BL/6 mice (Table 3). This analysis served to reenforce the results obtained with RsaI/MspI and RsaI/HpaII digests.
Methylation-Sensitive Digestion with BfaI/BssHII: Summary of GC-Rich RAMs in the Liver of B6C3F1 and C57BL/6 Mice Following Treatment with PB for to 2 or 4 Weeks
Treatment | Digest | RAMs hypomethylationa | RAMs hypermethylationb | RAMs new methylationc | Total | |||||
|---|---|---|---|---|---|---|---|---|---|---|
| 2 Weeks 0.05% PB | ||||||||||
| B6C3F1 | BssHII | 2 | 1 | 11 | 14 | |||||
| C57BL/6 | BssHII | 14 | 1 | 0 | 15 | |||||
| 4 Weeks 0.05% PB | ||||||||||
| B6C3F1 | BssHII | 18 | 2 | 5 | 25 | |||||
| C57BL/6 | BssHII | 3 | 3 | 6 | 12 | |||||
Hypomethylated RAMs include both statistically significant (p < 0.05) decreases and 100% decreases.
Hypermethylated RAMs are only those increases which are statistically significant (p < 0.05).
New methylations indicate the formation of a PCR product following treatment due to a gain of methylation either at the site of primer annealing or between sites of primer annealing which was not present under control conditions.
GC-rich regions are associated with the promoter regions of genes, and altered methylation within these regions could affect gene expression. Therefore, the methylation status of a 5′ promoter region of Ha-ras oncogene was analyzed in addition to an upstream region of the LINE-1 element. The methylation status of a 283-bp region of the Ha-ras promoter, containing 22 CpG dinucleotides, which was 950 nt upstream of the transcriptional start site, was evaluated (Fig. 4A). Bisulfite sequencing revealed three methylated cytosines within the targeted region under control conditions in both the B6C3F1 and C57BL/6 mice. One additional cytosine was methylated in 50 and 67% of the control animals in B6C3F1 and C57BL/6 mice, respectively (Fig. 4B). With 2 weeks 0.05% PB, the methylation status of one cytosine at −1174 nt decreased only in the B6C3F1 mice. This site of altered methylation (−1174 nt) was seen to reverse following 2 weeks of recovery (Fig. 4B). Following 4 weeks of PB treatment, the B6C3F1 mice, but not C57BL/6 mice, also exhibited hypomethylation of the cytosine at position −1174. In addition, two of the six animals were hypomethylated at a second cytosine (–1204 nt; Fig. 4C). Following the 2-week recovery period, the cytosine at –1204 of all six animals, and three of the six at –1174 nt reversed to a methylated status (Fig. 4C). Bisulfite sequencing was also performed on a 5′ region of the LINE-1 element containing 11 CpG dinucleotides 975 nt upstream of the transcriptional start site. All 11 cytosines were methylated in control animals as well as in animals treated with 2 or 4 week 0.05% PB (data not shown).
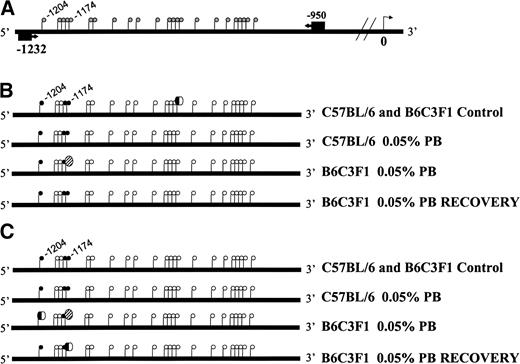
Methylation status of the promoter region of Ha-ras. A diagram of the Ha-ras promoter indicating location of PCR primers and CpG sites (gray lollipops) in relation to the transcriptional start site is presented (A). Bisulfite sequencing analysis within the region spanning 283 bp revealed that three cytosines are methylated (black lollipops) in both B6C3F1 and C57BL/6 control mice. In addition, the cytosine at position −1033 was methylated in 50 and 65% of B6C3F1 and C57BL/6 mice, respectively. This is represented by a half black and half white lollipop. PB-induced hypomethylation (striped lollipop) of the cytosine at −1174 nt was only seen the B6C3F1 mice at 2 weeks. This hypomethylated state reversed following 2 weeks of recovery (B). At 4 weeks, three cytosines were methylated in control animals. PB induced hypomethylation of the cytosine at position −1174 nt in B6C3F1 mice and hypomethylation of the cytosine at position −1204 nt in 30% of B6C3F1 mice. With 2 weeks of recovery, the methylation status of the cytosine at −1204 nt fully reversed, while reversal was only seen in 50% of the B6C3F1 mice at position −1174 nt (C). Black = methylated, white = unmethylated, striped = PB-induced hypomethylated in 100% of animals.
With evidence for hypomethylation within a limited region of the Ha-ras promoter only in the B6C3F1 mice at 2 and 4 weeks, the effect on gene expression levels was investigated. Fold change of Ha-ras expression over normalized control levels was measured. No change in gene expression was observed between the control and PB-treated animals at 2 weeks (data not shown). At 4 weeks, selective increases in expression were observed in response to PB (Fig. 5). Three animals exhibited a level of expression which exceeded the upper 95% confidence limit of the controls (Fig. 5). Following 2 weeks of recovery, four of the six animals expressed basal levels of Ha-ras expression (data not shown). In comparison, Ha-ras expression levels in C57BL/6 were unaffected by 2 or 4 weeks PB treatment (data not shown). The methylation status of cytosines within the targeted region of the LINE-1 promoter was unchanged by treatment with PB in both B6C3F1 and C57BL/6 mice. Consistent with this, the levels of expression of LINE-1 in control and treated animals at 2 and 4 weeks were comparable (data not shown).
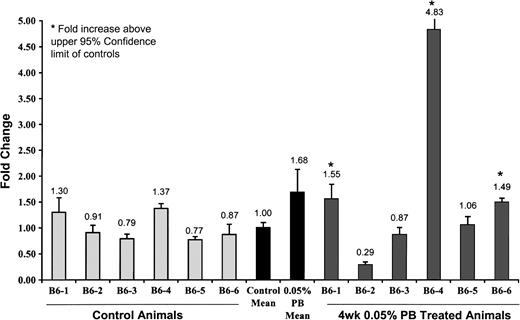
Expression of Ha-ras in B6C3F1 mice. PB-induced changes in the gene expression of Ha-ras at 4 weeks in B6C3F1 mice as detected by real-time PCR are expressed as fold change over control. Six control animals and six PB-treated animals were evaluated. Increases in Ha-ras expression which exceeded the upper bound of the 95% confidence interval of the control animals are noted with an asterisk (*).
DISCUSSION
The initiation stage of tumorigenesis involves an irreversible alteration of the genome via a mutation or possibly epigenetic event (Dragan et al., 1993; Goodman and Watson, 2002). The cells that acquire the first critical initiating event(s) could, theoretically, be derived from stem cells, early stem cell progenitor cells, or differentiated cells (Bjerkvig et al., 2005). These cells have a growth advantage over neighboring cells and may clonally expand during promotion; thus, tumorigenesis involves the progressive clonal expansion of cell populations, which accumulate heritable changes to their genomes, leading to them becoming increasingly abnormal (Nowell, 1976). The hepatocyte is a differentiated cell that remains capable of replication (Fausto, 1997). Mature mouse hepatocytes have the capacity to divide at least 12 times (Tateno and Yoshizato, 1996), and therefore, hepatocytes themselves can be the functional stem cells of the liver (Forbes et al., 2002). It follows that hepatocytes may also serve as the progenitor cells for liver tumors, and this is not incompatible with a role for stem cells, too. Thus, the evaluation of the methylation status of DNA isolated from whole liver, particularly with an emphasis on alterations that carry forward with time during tumor promotion, can provide insight regarding heritable epigenetic changes that contribute to hepatocarcinogenesis.
The actions of PB result in complex patterns of altered methylation in many if not all of the cells in the liver, with multiple unique changes produced in the hepatic DNA of liver tumor–prone B6C3F1 mice, as compared to the relatively resistant C57BL/6 mice. However, within individual hepatocytes, these changes are not simply random as demonstrated by the fact that PB-induced hypomethylation was detected within the promoter region of the Ha-ras oncogene, whereas the methylation status of LINE-1 elements, a very large portion of the genome (∼ 33%) was unaffected over the course of treatment with PB, indicating that normal patterns of methylation are maintained in a more stable fashion in some portions of the genome as compared to others.
Altered methylation of critical genes, e.g., those regulating cell proliferation, could facilitate their aberrant expression, providing the cells affected in this fashion with a growth advantage. Following 4 weeks of treatment, PB caused hypomethylation of Ha-ras in B6C3F1 mice (not C57BL/6), and increased expression of the oncogene was observed in 50% of these mice. Thus, PB-induced mouse liver tumorigenesis might involve activation of Ha-ras by an epigenetic mechanism, as opposed to mutation (Buchmann et al., 1991; Fox et al., 1990; Stowers et al., 1988).
The accumulation of aberrant RAMs, particularly those which progress during early times after the start of PB treatment, may be involved in initiation and/or promotion of tumorigenesis. Progressive accumulation of changed methylation during PB promotion was substantiated by the fact that 17% of the RAMs in B6C3F1 mice carried forward from 2 to 4 weeks. Strikingly, less than 1% of the C57BL/6 RAMs carried forward (Fig. 1B). These RAMs which carried forward likely represent the aforementioned critical epigenetic changes which contribute to the clonal proliferation of subsets of initiated cells. C57BL/6 PB-induced RAMs were used as the control comparison to PB-induced RAMs in B6C3F1 mice at 2 and 4 weeks. At 2 weeks, 12 RAMs were in common and equivalent between B6C3F1 and C57BL/6. By subtracting out these particular RAMs, 57 RAMs (43 hypomethylations, 3 hypermethylations, and 11 new methylations) were identified as unique to the B6C3F1 mice. The comparison at 4 weeks identified 86 RAMs (48 hypomethylations, 10 hypermethylations, and 28 new methylations) unique to B6C3F1 mouse liver. A comparison of the 86 unique RAMs in B6C3F1 liver to RAMs in the kidney further refined the number of unique RAMs to 81, in that only 5 new methylations were in common and equivalent to kidney. These 81 RAMs, specific to B6C3F1 mouse liver are likely critical to the development of tumors. In addition, they could be important in defining the inherent susceptibility of the B6C3F1 mice to liver tumorigenesis. The ability to associate each unique RAM with a specific gene will be key to addressing this issue and is presently being pursued.
During DNA replication stable patterns of methylation are mainly dependent on the maintenance methyltransferase, Dnmt1. However, methylation is also regulated by de novo methyltransferases (e.g., Dnmt3a and 3b), demethylases (Pradhan and Esteve, 2003), and the availability of both S-adenosyl methionine (SAM) and methyl groups (Ziesel, 1996). Altered patterns of methylation, specifically hypomethylation, may arise when the levels of Dnmt1 and/or SAM are low in replicating cells. Alternatively, aberrant activity of demethylases and de novo methylases could induce hypo- and hypermethylated states in quiescent cells. Thus, there are multiple potential points where PB could act to disrupt normal patterns of methylation.
Reversibility of changes in methylation in response to a 2- or 4-week exposure to PB was assessed following 2-week recovery periods. The large majority of hypermethylations and new methylations were reversible; however, very few hypomethylations reversed. De novo methylation of hypomethylated CCGG sites could restore the normal methylation pattern. However Dnmt3a and 3b prefer AT-rich flanking sequences surrounding the CpG dinucleotide (Handa and Jeltsch, 2005). Biologically, this difficulty in reversing hypomethylation could be necessary for the continued promotion of initiated cells. Global hypomethylation of CCGG sites induced by a methyl-deficient diet in rats was stable during reexposure to a methyl-adequate diet and correlated to the persistence of altered hepatic foci (Pogribny et al., 2005). In our model, progressive changes in methylation were only seen in the B6C3F1 mice; however, minimal reversibility of hypomethylated RAMs was a common feature of both the sensitive and resistant mice. This indicates that irreversible hypomethylation may be necessary but not sufficient for the continued expansion of clones of initiated cells in response to PB.
Genetic differences likely contribute to the observed divergence in the ability to maintain patterns of DNA methylation during promotion with PB. For instance, strain differences in the activity of one or more de novo methyltransferase enzymes could potentially account for the extreme difference between B6C3F1 and C57BL/6 mice at 2 and 4 weeks. B6C3F1 RAMs with increased methylation were few in number at 2 weeks (23 RAMs) but increased by 4 weeks (39 RAMs). This response was in direct opposition to C57BL/6 where high numbers were seen at 2 weeks (86 RAMs) and dramatically less at 4 weeks (17 RAMs). Therefore, the hepatocarcinogen sensitivity locus may functionally involve a compromised ability to maintain normal methylation patterns in liver tumor–prone mice, e.g., the B6C3F1 mouse.
Methylation-sensitive restriction digestion and AP-PCR combined with capillary electrophoretic detection of PCR products, as described here, are novel approaches to simultaneously measure increases, decreases, and new methylations in multiple GC-rich regions (frequently associated with gene promoters) throughout the genome. Basically, three complementary sets of analyses were performed: RsaI/HpaII, RsaI/MspI, and BfaI/BssHII. Overall, altered methylation at ∼ 7.45% of all CpG dinucleotides estimated for the mouse genome is detected by the 4-base cutter isoschizomers MspI and HpaII, which complement each other's sensitivity to inhibition by methylation within their common recognition sequence (Fazzari and Greally, 2004). Analysis of CpG islands is more directly targeted by using the BfaI/BssHII combination. The 6-base recognition site of BssHII is rare, as compared to the 4-base recognition site of MspI and HpaII and tightly associated with CpG islands (Shiraishi et al., 1995). Furthermore, concerning the nonmethylation-sensitive restriction enzymes employed, there are fewer restriction sites within CpG islands for BfaI as compared to RsaI (Shiraishi et al., 1995). With each analysis, an increase in the total number of RAMs from 2 to 4 weeks in B6C3F1 mouse was identified (Tables 1 and 3). In addition, fewer RAMs were observed in the C57BL/6 mice at 4 weeks. Therefore, these restriction enzyme combinations are complementary and reinforce the notion that our method is capable of providing insight regarding the methylation status of the genome.
The differential ability to maintain patterns of DNA methylation is hypothesized to contribute to the markedly different susceptibilities of B6C3F1 and C57BL/6 mice. As an extension of previous reports (Counts et al., 1996; Watson and Goodman, 2002), we have demonstrated that patterns of methylation are more susceptible to disruption in tumor-prone B6C3F1 mice. Importantly, a large proportion of the regions of altered methylation in B6C3F1 mouse liver carried forward in comparison to C57BL/6 mice. This is a highly significant observation and shows that B6C3F1 mice accumulate changes much quicker and earlier than C57BL/6, which is in direct agreement with their relative sensitivities to tumor formation. This is strong experimental evidence which indicates that the progressive accumulation of heritable changes is key to the promotion stage and to the facilitation of tumorigenesis. Gene-specific analysis in B6C3F1 mice revealed a nonrandom pattern of altered methylation in which Ha-ras hypomethylation correlated to selective increases in gene expression, and the highly methylated LINE-1 elements were unaffected by PB. Collectively, these data indicate that (1) progressive nonrandom changes in methylation provide an epigenetic mechanism underlying the ability of PB to cause mouse liver tumorigenesis; and (2) susceptibility to tumorigenesis is related inversely to the capacity to maintain normal patterns of methylation.
SUPPLEMENTAL DATA
Supplementary data contains a detailed description of the approach taken to calculate the reversibility of regions of altered methylation identified by the AP-PCR and capillary electrophoretic approach. Additionally, results relating to percent dissimilarity calculations are presented in Supplementary Data. Supplementary data are available online at Supplementary Data
A.N.B. was a predoctoral fellow supported by National Institutes of Health–National Institute of Environmental Health Sciences training grant No. T32-ES-07255. Research support, in the form of a gift, from the R.J. Reynolds Tobacco Company is acknowledged gratefully.
References
Bachman, A. N., Kamendulis, L. M., and Goodman, J. I. (
Becker, F. F. (
Bjerkvig, R., Tysnes, B. B., Aboody, D. S., Najbauer, J., and Terzis, A. J. A. (
Brown, K., Bailleul, B., Ramsden, M., Fee, F., Krumlauf, R., and Balmain, A. (
Buchmann, A., Bauer-Hofmann, R., Mahr, J., Drinkwater, N. R., Luz, A., and Schwarz, M. (
Carnell, A. N., and Goodman, J. I. (
Counts, J. L., and Goodman, J. I. (
Counts, J. L., Sarmiento, J. I., Harbison, M. L., Downing, J. C., McClain, R. M., and Goodman, J. I. (
Dragan, Y. P., Sargent, L., Xu, Y. D., Xu, Y. H., and Pitot, H. C. (
Drinkwater, N. R., and Ginsler, J. J. (
Fausto, N. (
Fazzari, M. J., and Greally, J. M. (
Forbes, S., Vig, P., Poulsom, R., Thomas, H., and Alison, M. (
Fox, T. R., Schumann, A. M., Watanabe, P. G., Yano, B. L., Maher, V. M., and McCormick, J. J. (
Gaudet, F., Hodgson, J. G., Eden, A., Jackson-Grusby, L., Dausman, J., Gray, J. W., Leonhardt, H., and Jaenisch, R. (
Gonzalgo, M. L., Liang, G., Spruck, C. H., III, Zingg, J.-M., Rideout, W. M., III, and Jones, P. A. (
Goodman, J. I., and Watson, R. E. (
Handa, V., and Jeltsch, A. (
Holm, T. M., Jackson-Grusby, L., Brambrink, T., Yamada, Y., Rideout, W. M., III, and Jaenisch, R. (
Jones, P. A., and Baylin, S. B. (
Neades, R., Betz, N. A., Sheng, X. Y., Pelling, J. C. (
Pogribny, I. P., Ross, S. A., Wise, C., Pogribna, M., Jones, E. A., Tryndyak, V. P., James, S. J., Dragan, Y. P., and Poirier, L. A. (
Pradhan, S., and Esteve, P.-O. (
Shiraishi, M., Lerman, L. S., and Sekiya, T. (
Stowers, S. J., Wiseman, R. W., Ward, J. M., Miller, E. C., Miller, J. A., Anderson, M. W., and Eva, A. (
Tateno, C., and Yoshizato, K. (
Watson, R. E., and Goodman, J. I. (
Whysner, J., Montandon, F., McClain, R. M., Downing, J., Verna, L. K., Steward, R. E., III, and Williams, G. M. (
Whysner, J., Ross, P. M., and Williams, G. M. (
Author notes
*Department of Pharmacology and Toxicology and †Department of Biochemistry and Molecular Biology, Michigan State University, East Lansing, Michigan 48824

Comments