


Abstract
Oxidative stress has pervasive effects on cells but how they respond transcriptionally upon the initial insult is incompletely understood. We developed a nuclear walk-on assay that semi-globally quantifies nascent transcripts in promoter-proximal paused RNA polymerase II (Pol II). Using this assay in conjunction with ChIP-Seq, in vitro transcription, and a chromatin retention assay, we show that within a minute, hydrogen peroxide causes accumulation of Pol II near promoters and enhancers that can best be explained by a rapid decrease in termination. Some of the accumulated polymerases slowly move or ‘creep’ downstream. This second effect is correlated with and probably results from loss of NELF association and function. Notably, both effects were independent of DNA damage and ADP-ribosylation. Our results demonstrate the unexpected speed at which a global transcriptional response can occur. The findings provide strong support for the residence time of paused Pol II elongation complexes being much shorter than estimated from previous studies.
INTRODUCTION
The regulation of gene expression centers on controlling transcription by Pol II. Immediately after initiation, Pol II enters an abortive mode of elongation characterized by the generation of short transcripts, pausing and termination (1). Promoter-proximal pausing requires both DRB sensitivity inducing factor (DSIF) and the negative elongation factor NELF (2), and occurs at essentially all transcribed promoters (3,4) and at many enhancers (5). Release into productive elongation requires phosphorylation of both DSIF and NELF by the positive transcription elongation factor b (P-TEFb) and the coordination of other elongation factors including the PAF1 and super elongation complexes (6). Phosphorylated DSIF remains associated with Pol II and subsequently acts as a positive elongation factor (7,8), while NELF dissociates from elongation complexes (9). Not all paused polymerases are destined for productive elongation and termination of these transcription complexes is poorly understood. Studies using triptolide, a covalent TFIIH subunit XPB inhibitor that blocks initiation, suggest that paused polymerases are relatively stable with half-lives ranging from 5 min to more than an hour (10–13). However, these conclusions are based on a shared assumption that inhibition of initiation by triptolide is more rapid than termination of paused Pol II.
During oxidative stress, cells respond to rising reactive oxygen species by changing their pattern of gene expression. Complex networks exist to sense and respond to varying concentrations of H2O2 and clearance in eukaryotes is dependent primarily on catalase with help from glutathione peroxidases and thioredoxin peroxidases (14). Although cell death is triggered at irrecoverable levels of oxidative stress (15), H2O2 at low concentrations is used as an intermediate in several cell-to-cell signaling pathways (16). In addition to modulating the levels and activities of transcription factors (17), H2O2 leads to altered post-translational modifications of affected proteins in as little as 10 min after treatment (18) and can directly oxidize sulfur-containing groups in cysteine (19) and methionine residues (20). Hydroxyl radicals from H2O2 can also attack both the deoxyribose backbone and bases of DNA and the resulting adducts are the most abundant form of DNA damage in cells (21). If not corrected by nucleotide excision repair (NER) machinery, oxidative lesions can lead to miscoding and DNA polymerase arrest during replication, or RNA polymerase arrest during transcription (22). In the event of DNA damage, cells rapidly downregulate new initiation and activate transcription-coupled repair pathways to rescue RNA polymerases that stall at lesions (22). Nuclear extracts harvested from HeLa S3 cells treated in media with 10 mM H2O2 for 15 min exhibited no in vitro initiation activity on undamaged template DNA, suggesting that the transcriptional machinery can be directly inhibited (23). However, treatment of fibroblasts for 15 min with only 0.25 mM H2O2 in media leads to the induction of about one hundred genes, many of which are involved in DNA repair and stress response (24). A recent study demonstrated that treatment of MRC5 fibroblast cells with 0.2 mM H2O2 induced genome-wide changes in Pol II ChIP-Seq occupancy after 30 min (25). The global changes observed in this study seem to be contrary to the prevailing model where moderate amounts of oxidative stress induce targeted and controlled changes in transcription (14,15).
Previous studies of oxidative stress used methods incapable of detecting rapid changes in transcription. Microarray and RNA-Seq experiments require time after treatment for changes in transcript levels to be detectable and selection for polyadenylated RNAs, if performed, prevent detection of incomplete or aborted transcripts. The most direct way of measuring transcription is by nuclear run-on, which detects only nascent transcripts associated with engaged polymerases within isolated nuclei (26–28). In this method, nascent transcripts can be labeled by extension with radioactive nucleotides or, in the case of GRO-Seq, bromouridine triphosphate, which enables subsequent purification and sequencing (4). Although these methods have successfully been used to characterize rapid responses to heat shock and other signaling events, their reliance on the extension of nascent transcripts has prevented detailed characterization of the promoter-proximal pause region. While this limitation can be overcome using terminating ribonucleotide analogs (29) or biotinylated NTPs as used in PRO-Seq (30,31), we opted instead to limit extension by using only radiolabeled CTP and quantitatively determine the sizes of short nascent transcripts in denaturing gels (32). In this study, we further developed this nuclear walk-on assay and used it to characterize the rapid and prolonged effects of H2O2 on Pol II transcription in cells.
MATERIALS AND METHODS
Cell lines and treatments
Adherent HeLa cells were grown to 80% confluence in T-flasks or six-well plates at 37°C and 5% CO2 in DMEM (Gibco 11965-092) supplemented with 10% FBS (Gibco 26140-079). Suspension HeLa cells were grown to 5 × 10⁵ cells/ml in spinner flasks at 37°C and 5% CO2 in SMEM (Gibco 11380-037) supplemented with 10% FBS and 2 mM l-glutamine (Gibco 25030-081). Human foreskin fibroblasts were isolated from de-identified discarded human foreskins. HFF were grown in T-flasks at 37°C and 5% in CO2 MEM (Gibco 11095-080) supplemented with 10% FBS and 1% penicillin–streptomycin (Gibco 15140-122). Exponential phase cells were grown to 80% confluence before splitting with new media. Stationary phase cells were kept at 100% confluence with weekly media changes. Cells were treated by removing media, mixing media with concentrated compound, and returning the media to the flask. For suspension cells, concentrated compound was mixed with fresh media and added directly to the spinner flask. The following compounds were dissolved in DMSO before use: flavopiridol (NIH AIDS Reagent Program 9925), PJ34 (Abcam ab120981), and triptolide (Sigma T3652). H2O2 (Fisher Scientific H325) was diluted in water immediately before use.
NELF-A knockdown
Adherent HeLa cells were transfected for 48 h with Lipofectamine RNAiMax (Thermo 13778-150) alone or in combination with 1.5 nM predesigned NELFA DsiRNA (Integrated DNA Technologies HSC.RNAI.N005663.12.1). Cells for nuclear walk-on and western blotting were transfected in parallel. For western blot validation, cells were lysed and sonicated in protein loading buffer (50 mM Tris pH 7.6, 20% Ficoll, 10% SDS and bromophenol blue) supplemented with 50 mM DTT. After heating to 95°C for 10 min, samples were resolved by SDS-PAGE. Transfer to nitrocellulose was accomplished using a discontinuous Tris-CAPS buffer system (0.5% SDS at cathode, 20% MeOH at anode) and a BioRad Trans-Blot SD semidry transfer apparatus. The membrane was then blocked for 30 min at RT in PBST (1× PBS containing 0.05% Tween20) with 10% milk, incubated for 1 h at RT in PBST with 2% milk and 1:500 goat anti-NELF-A (Santa Cruz Biotechnology sc-23599), and incubated for 1 h at RT in PBST with 2% milk and 1:10 000 donkey anti-goat HRP-conjugated antibody (Santa Cruz Biotechnology sc-2020). Blots were visualized with SuperSignal West Femto Maximum Sensitivity Substrate (Thermo 34094).
Cell viability assay
HeLa cells seeded in six-well plates were treated at 80% confluence with increasing concentrations of H2O2. Cells were monitored using phase-contrast microscopy and images were captured with a Samsung Galaxy Note 4.
Rapid nuclei isolation
All cell handling was performed on wet ice and all buffers were ice cold. After treatment of adherent cells, T-flasks were removed from the incubator and over 20 s, media was discarded; PBS was added, quickly mixed, and discarded; and lysis buffer (20 mM HEPES pH 7.6, 320 mM sucrose, 1% IGEPAL CA-630, 1 mM spermine, 1 mM spermidine, 1 mM EDTA, 1 mM DTT, 0.004 U/μl SUPERase-In [Ambion AM2696], 0.1% isopropanol-saturated PMSF and cOmplete EDTA-free protease inhibitor cocktail [Roche 11873580001]) was introduced. After a brief incubation on ice, lysis was confirmed by phase-contrast microscopy and lysates were scraped and transferred to tubes. Each lysate was carefully layered over a sucrose cushion (20 mM HEPES pH 7.6, 1 M sucrose, 1 mM spermine, 1 mM spermidine, 0.1 mM EDTA, 1 mM DTT, 0.004 U/μl SUPERase-In, 0.1% isopropanol-saturated PMSF and cOmplete EDTA-free protease inhibitor cocktail) and spun at 22500 × g for 5 min. Pelleted nuclei were carefully resuspended in 300 μl storage buffer (20 mM HEPES pH 7.6, 5 mM Mg(C2H3O2)2, 5 mM DTT and 25% glycerol) per T-75 flask, homogenized using a 1 ml Dounce with a tight pestle, aliquoted, and stored at –80°C. For PRO-Seq, 100 μl storage buffer was used per T-150 flask.
In a similar procedure, the nuclei used in Figure 2A and B were pelleted at 1200 × g for 5 min after lysis, resuspended in 1 ml lysis buffer (as above except with 10 mM Tris pH 7.6 and 0.5% Triton X-100 instead of HEPES and IGEPAL CA-630) and 2 ml sucrose cushion (as above except with 10 mM Tris pH 7.6 and 1.9 M sucrose instead of HEPES and 1 M sucrose), layered over a 1.9 M sucrose cushion, and spun at 30 000 × g for 45 min.
Nuclear walk-on
For each reaction, 1–3 × 10⁵ nuclei were diluted to achieve the following reaction conditions ±1.33 μg/ml α-amanitin (Sigma A2263): 20 mM HEPES pH 7.6, 0.5% sarkosyl, 5 mM Mg(C2H3O2)2, 5 mM DTT, 150 mM KC2H3O2, 0.25 U/μl SUPERase-In and 0.167 μM α-32P-CTP (PerkinElmer BLU008H001MC). Elongation was allowed to proceed for 3–8 min at 30°C and reactions were either stopped immediately by addition of EDTA to 15 mM, or (for Figure 2E and Supplementary Figure S3D) chased with 500 μM cold ATP, UTP, GTP and CTP for 10 min before stopping with addition of EDTA to 8 mM. Transcripts were isolated by Trizol LS (Ambion 10296028), precipitated with 95% ethanol and 500 mM NH4C2H3O2, and analyzed using 6% Urea-PAGE. Approximately 1 mm of the top of the gel was removed to exclude transcripts too large to migrate into the gel. Cold RNAs were visualized by ethidium bromide and, after gel drying, radiolabeled RNAs were visualized with a Fujifilm Typhoon FLA-7000 phosphorimager.
In Figure 2A and B, guanylylated (or capped) transcripts were isolated from total transcripts using an anti-2,2,7-trimethylguanosine antibody and recombinant RNMT as described in (32). Protein G Sepharose 4B Fast Flow beads (Sigma P3296) were washed with binding buffer (20 mM Tris pH 7.6, 50 mM KC2H3O2, 0.02% Tween20, 1 mM EDTA, and 0.02 U/μl SUPERase-In), blocked 10 min at RT with rotation in binding buffer supplemented with 0.5 μg/μl BSA (NEB B9000S), and incubated with 10 μg antibody per 10 μl 100% beads in binding buffer for 1 h at 4°C with rotation. Antibody-beads were washed once with RIPA buffer (20 mM Tris pH 7.6, 150 mM KC2H3O2, 1% Triton X-100, 0.2% sodium deoxycholate, 0.1% SDS and 1 mM EDTA), once with LiCl buffer (20 mM Tris pH 7.6, 400 mM LiCl, 0.02% Tween-20 and 1 mM EDTA), and three times with binding buffer. Trizol LS-isolated samples were resuspended in 20 mM Tris pH 7.6 buffer containing 0.5 U/μl SUPERase-In and divided equally. One half was immediately reisolated with water-saturated phenol (total RNA). The other half was incubated for 15 min at 37°C with an equal volume of 20 mM Tris pH 7.6, 10 mM Mg(C2H3O2)2, 200 μM SAM, 2 mM DTT, 0.2 mg/ml BSA and 50 ng/μl recombinant RNMT to methylate existing RNA caps. After methylation, 20% washed antibody-bead slurry (10 μg antibody and 10 μl 100% beads per reaction) was added to each sample and incubated for 2–4 h at RT with rotation. Samples were then washed three times with 100 μl washing buffer (binding buffer with 150 mM KC2H3O2 and 0.1% Tween-20). Bead-associated transcripts (capped RNA) were then reisolated with water-saturated phenol.
PRO-Seq
Each PRO-Seq used the equivalent of half a T-150 flask of adherent HeLa cells treated 1 h with either 0.1% DMSO or 1 μM flavopiridol before isolation as described above. The steps below were adapted from (31). 50 μl nuclei aliquots in storage buffer were heated to 37°C, and incubated for 5 min with 40 μl of a preheated reaction buffer containing 20 mM HEPES pH 7.6, 300 mM KC2H3O2, 5 mM Mg(C2H3O2)2, 5 mM DTT, 1% sarkosyl, 0.5 U/μl SUPERase-In and 0.33 μM α-32P-CTP. Radiolabeled CTP was used to mimic nuclear walk-on conditions and to enable optimization of the reactions below. After the CTP pulse, 2.5 μl each of 1 mM biotin-11-ATP (PerkinElmer NEL544), -UTP (NEL543), -GTP (NEL545) and -CTP (NEL542) were added for 10 min. RNA was isolated with Trizol LS, precipitated with 95% ethanol and 500 mM NH4C2H3O2, and washed with 70% ethanol. Pellets were resuspended in 20 μl H2O, incubated at 65°C for 2 min, snap-cooled on ice, and incubated for 30 min on ice with 5 μl 1 N NaOH. During the hydrolysis step, 300 μl (3 × 50 μl per library) Dynabeads M-280 Streptavidin beads (Invitrogen 11206D) were washed twice with 1 ml M-280 high salt wash (50 mM Tris pH 7.8, 2 M NaCl, 0.5% Triton X-100, and 1 mM EDTA) and resuspended with 300 μl M-280 high salt wash. Dynabeads were stored at 4°C with rotation until needed (no more than a few days). Hydrolysis was quenched with 25 μl 1 M Tris pH 7.8 and after buffer-exchange using P-30 columns (Bio-Rad 732.6223), eluates were incubated with 1 μl SUPERase-In and 50 μl washed Dynabeads for 15 min at RT with rotation. Beads were washed three times with 500 μl M-280 high salt wash and twice with 500 μl M-280 low salt wash (20 mM Tris pH 7.8, 150 mM NaCl, 0.1% Triton X-100, and 1 mM EDTA). Beads were then resuspended with Trizol LS and RNA was isolated. Pellets were resuspended in 8 μl 12.5 μM VRA3 RNA adapter (/5Phos/rGrArUrCrGrUrCrGrGrArCrUrGrUrArGrArArCrUrCrUrGrArArC/3InvdT/), incubated at 65°C for 2 min, snap-cooled on ice, and incubated for 4 h at 37°C with 12 μl 5/3X Rnl1 mix (1.67 U/μl T4 RNA Ligase 1 ssRNA [NEB M0204L], 5/3X ligase reaction buffer, 1.67 mM ATP, 20.8% PEG 8000, and 1.67 U/μl SUPERase-In). Ligated samples were then incubated with 30 μl H2O and 50 μl washed Dynabeads for 15 min at RT with rotation. Beads were washed three times with 500 μl M-280 high salt wash and twice with 500 μl M-280 low salt wash. Beads were then resuspended with Trizol LS and RNA was isolated. Pellets were resuspended in 10 μl H2O, incubated at 65°C for 2 min, snap-cooled on ice, and incubated for 1 h at 37°C with 10 μl 2X RppH mix (2 U/μl RppH [NEB M0356S], 2X ThermoPol buffer, and 1 U/μl SUPERase-In). Samples were then incubated for 1 h at 37°C with 80 μl 5/4X T4 PNK mix (0.625 U/μl T4 PNK [NEB M0201S], 5/4X T4 PNK buffer, 1.25 mM ATP, and 1.25 U/μl SUPERase-In). Reactions were stopped with Trizol LS and RNA was isolated. Pellets were resuspended in 8 μl 12.5 μM VRA5 RNA adapter (rCrCrUrUrGrGrCrArCrCrCrGrArGrArArUrUrCrCrA), incubated at 65°C for 2 min, snap-cooled on ice, and incubated for 4 h at 37°C with 12 μl 5/3X Rnl1 mix. Ligated samples were then incubated with 30 μl H2O and 50 μl washed Dynabeads for 15 min at RT with rotation. Beads were washed three times with 500 μl M-280 high salt wash and twice with 500 μl M-280 low salt wash. Beads were then resuspended with Trizol LS and RNA was isolated. Pellets were resuspended in 10 μl 2X RT primer mix (5 μM RP1 DNA primer [AATGATACGGCGACCACCGAGATCTACACGTTCAGAGTTCTACAGTCCGA] and 1 mM dNTP mix [NEB N0447L]), incubated at 65°C for 5 min, snap-cooled on ice, and incubated in a thermal cycler with 10 μl 2X SSIV reverse transcriptase mix (20 U/μl SuperScript IV [Invitrogen 18090050], 2X SSIV buffer, 10 mM DTT, and 2 U/μl SUPERase-In) for 15 min at 45°C, 40 min at 50°C, 10 min at 55°C, and 15 min at 70°C. Reverse transcribed samples were volume up to 26 μl with H2O and 2 μl was set aside and serial-diluted to test PCR conditions as described in (31). Final PCR reactions were 50 μl and contained the remaining sample, 0.05 U/μl Phusion High-Fidelity DNA Polymerase (NEB M0530L), 1X HF buffer, 1 M betaine (Sigma B0300), 2.5 μM dNTP mix, 0.25 μM RP1 DNA primer and 0.25 μM barcoded index primer (either RPI-6 [CAAGCAGAAGACGGCATACGAGATATTGGCGTGACTGGAGTTCCTTGGCACCCGAGAATTCCA] or RPI-12 [CAAGCAGAAGACGGCATACGAGATTACAAGGTGACTGGAGTTCCTTGGCACCCGAGAATTCCA]). These reactions were incubated in a thermal cycler with the following program: 2 min at 95°C; five cycles of 30 s at 95°C, 30 s at 56°C and 30 s at 72°C; six cycles of 30 s at 95°C, 30 s at 65°C and 30 s at 72°C; 10 min at 72°C; and hold at 4°C. Libraries were purified using a MinElute PCR Purification Kit (QIAGEN 28004), verified to be free of radiation, and size-selected for 140–400 bp using a BluePippin 2% Agarose Gel Cassette (Sage Science BDF2010). Sequencing was performed by the Iowa Institute of Human Genetics Genomics Division on an Illumina HiSeq 4000 using 150 bp paired-end reads.
ChIP-Seq
For the Pol II ChIP-Seq H2O2 time course in Figure 3, Supplementary Figures S4 and S5 (no H2O2, or 3, 10, 30, or 100 min H2O2), one T-150 flask (∼1.5 × 10⁷ cells) was used per ChIP. Adherent HeLa cells were grown at 37°C and 5% CO2 to 80% confluence in T150 flasks in 30 ml DMEM supplemented with 10% FBS. One hour before H2O2 treatment, 10 ml of media was removed, spiked as indicated with 1:1000 final volume of DMSO containing 1 mM of flavopiridol (1 μM final in 0.1% DMSO), and re-added to cells. 10.3 M H2O2 was diluted in water immediately before use and added to cells (0.3 mM final) for 3, 10, 30 and 100 min. All treatment times were staggered to ensure crosslinking of each sample was separated by 1 min. Cells were removed from the incubator and crosslinked promptly by adding 16% paraformaldehyde (Electron Microscopy Sciences 130218) to a final concentration of 1% in media. Crosslinking was allowed to proceed for 10 min before Tris pH 7.6 addition to 1.33 M. All solutions used for steps after crosslinking and before elution were ice cold and supplemented with cOmplete EDTA-free protease inhibitor cocktail, 0.1% isopropanol-saturated PMSF, and 1 mM DTT. Cells were pelleted at 1200 × g for 5 min at 4°C and rinsed twice with PBS. Decanted, rinsed pellets were stored at –80°C. Pellets were thawed in 1 ml 0.2% sarkosyl buffer (10 mM Tris pH 7.6, 100 mM NaCl, 1 mM EDTA and 0.2% sarkosyl), homogenized with 10 loose pestle strokes in a 1 ml Dounce, and sonicated in 14 ml polystyrene tubes on wet ice with a Fisher Model 550 Sonic Dismembrator for 15 cycles of 30 s at intensity 4, followed by 60 s off. After sonication, 100 μl 10% Triton X-100 was added and samples were pelleted at 16000 × g for 15 min at 4°C. Supernatants were stored at –80°C. For each ChIP, 100 μl M-280 Sheep anti-Rabbit IgG Dynabeads (Novex 11203D) were washed with 100 μl PBS, blocked in blocked in 100 μl PBS containing 1 mg/ml BSA for 1 h at 4°C with rotation, washed again with 100 μl PBS, and incubated with 10 μg Pol II antibody (Santa Cruz Biotechnology sc-899) for 2 h at 4°C with rotation. Antibody-beads were washed twice with 200 μl wash buffer A (20 mM Tris pH 7.6, 150 mM NaCl, 1 mM EDTA, 1% Triton X-100, 0.1% sodium deoxycholate and 0.1% SDS), then resuspended with sonicated supernatants and incubated overnight at 4°C with rotation. 1% of each sample was set aside for input sequencing. Samples were washed once with 200 μl wash buffer A, 200 μl wash buffer B (20 mM Tris pH 7.6, 500 mM NaCl, 1 mM EDTA, 1% Triton X-100, 0.1% sodium deoxycholate, and 0.1% SDS), and 200 μl wash buffer C (20 mM Tris pH 7.6, 250 mM LiCl, 1 mM EDTA, 0.5% IGEPAL CA-630, 0.5% sodium deoxycholate and 0.1% SDS), and twice with 200 μl rinse buffer (10 mM Tris pH 7.6, 50 mM NaCl, and 1 mM EDTA). Samples were incubated with 200 μl elution buffer (20 mM Tris pH 7.6, 1 mM EDTA, and 1% SDS) for 2 h at 65°C to reverse crosslinks. Eluates were treated with 2 μl RNase A (Thermo EN0531) for 30 min at 37°C, then 2 μl Proteinase K (Thermo EO0491) for 30 min at 50°C. DNA was isolated by MinElute PCR Purification Kit and libraries were prepared using a NEXTflex Rapid DNA-Seq Kit (Bioo Scientific 5144-04). Sequencing was performed by the Iowa Institute of Human Genetics Genomics Division on an Illumina HiSeq 2500 using 125 bp paired-end reads.
For the H3K4me1 and H3K4me3 ChIP-Seq experiments in Figure 3, ∼2.5 × 10⁷ suspension HeLa cells were used per ChIP. Cells were grown to 5 × 10⁵ cells/ml in spinner flasks at 37°C and 5% CO2 in SMEM supplemented with 2 mM l-glutamine and 10% FBS. Crosslinking was performed for 15 min as described above. Pellets were thawed in 1 ml 2% sarkosyl buffer (10 mM Tris pH 7.6, 100 mM NaCl, 1 mM EDTA and 2% sarkosyl), homogenized, and sonicated for 36 cycles as described above, except Triton X-100 was not added after sonication. Sonicated samples were precleared with 32.5 μl each of Protein A (Sigma P9424) and Protein G Sepharose 4B Fast Flow bead slurries (equilibrated in 2% sarkosyl buffer) for 2 h at 4°C with rotation. After settling, precleared sonicated samples were transferred to new tubes and incubated with 10 μg antibody (Abcam ab8580 or ab8895) overnight at 4°C with rotation. 1% of each precleared sample was set aside for input sequencing. In parallel, 32.5 μl per ChIP of both Protein A- and Protein G Sepharose 4B Fast Flow bead slurries were washed with 1 ml 2% sarkosyl buffer and blocked in 1 ml 2% sarkosyl buffer containing 1 mg/ml BSA overnight at 4°C with rotation. Blocked beads were washed with 1 ml 2% sarkosyl buffer and incubated with chromatin-antibody samples for 2 h at 4°C with rotation. Samples were settled and washed four times with 1 ml wash buffer (10 mM Tris pH 7.6, 150 mM NaCl, 1 mM EDTA, 1% Triton X-100, 0.1% sodium deoxycholate and 0.1% SDS) and two times with 1 ml rinse buffer. Samples were incubated in 100 μl elution buffer 1 (10 mM Tris pH 7.6, 1 mM EDTA and 1% SDS) for 10 min at 65°C, and 150 μl elution buffer 2 (10 mM Tris pH 7.6, 1 mM EDTA and 0.67% SDS) for 10 min at 65°C. Treatment of eluates, DNA isolation, library preparation, and sequencing were performed as described above.
For the Pol II and NELF ChIP-Seq experiments in Figures 3A, 4 and Supplementary Figure S5 (no or 35 min H2O2), ∼3 × 10⁷ suspension HeLa cells were used per ChIP. One hour before H2O2 treatment, 10 ml of media was removed, spiked with 1:1000 final volume of DMSO containing 1 mM of flavopiridol (1 μM final in 0.1% DMSO), and re-added to cells. For the Pol II, NELF and DSIF ChIP-Seq experiments in Figure 5, Supplementary Figures S5 and S6 (no or 10 min H2O2 ± PJ34), ∼4 × 10⁷ suspension HeLa cells were used per ChIP. One hour before H2O2 treatment, 10 ml of media was removed, spiked with 1:10000 final volume of DMSO containing 10 mM of flavopiridol (1 μM final in 0.01% DMSO), and re-added to cells. Twenty minutes before H2O2 treatment, 10 ml of media was removed, spiked with 1:2500 final volume of DMSO containing 50 mM PJ34 as indicated (20 μM final in 0.05% DMSO), and re-added to cells. For both experiments, crosslinking was performed for 10 min as described above. Pellets were thawed in 1 ml ChIP buffer (25 mM Tris pH 7.6, 150 mM NaCl, 1 mM EDTA, 1% Triton X-100 and 0.25% sodium deoxycholate), homogenized, and sonicated for 24 cycles as described above, except Triton X-100 was not added after sonication. Sonicated samples were incubated with 10 μg antibody (Santa Cruz Biotechnology sc-899, sc-23599 or sc-28678) overnight at 4°C with rotation. 1% of each sample was set aside for input sequencing. In parallel, 65 μl per ChIP Protein G Sepharose 4B Fast Flow bead slurry was washed twice in 10 ml ChIP buffer, and then blocked in 10 ml ChIP buffer containing 2% BSA powder (RPI A30075) overnight at 4°C with rotation. Blocked beads were washed twice with 10 ml ChIP buffer, settled, resuspended in 1 ml ChIP buffer, and incubated with chromatin-antibody samples for 2 h at 4°C with rotation. Samples were settled and washed three times with 10 ml ChIP buffer and once with 10 ml PBS. Samples were incubated in 100 μl elution buffer 1 for 10 min at 65°C, and 150 μl elution buffer 2 for 10 min at 65°C. Treatment of eluates, DNA isolation, library preparation and sequencing were performed as described above.
In vitro transcription
Preinitiation complexes were generated by incubating immobilized CMV-promoter template DNA (–800 bp to +508 bp) with 1 μl/rxn HeLa nuclear extract (33) in the presence of 20 mM HEPES pH 7.6, 60 mM KC2H3O2, 5 mM Mg(C2H3O2)2, 1 mM DTT and 0.5 U/μl SUPERase-In for 30 min. For Figure 6A, this 30 min incubation was performed with increasing concentrations of H2O2 (0.02–200 mM). For Figure 6C, 0.1, 1 or 10 μM triptolide was added 30, 10, 3 or 1 min before the pulse. For Figure 6D, this 30 min incubation was performed with 1 μM flavopiridol alone or in combination with 0.3 mM H2O2. Initiation was accomplished by pulsing for 30 s with 0.21 μM α-32P-CTP, and 500 μM ATP, UTP and GTP.
In Figure 5A, elongation complexes were stopped by addition of an EDTA-containing high salt wash (20 mM HEPES pH 7.6, 1.6 M KCl, 25 mM EDTA and 0.02% Tween20). Using a magnet to concentrate beads, complexes were washed twice in this buffer and twice with a low salt wash (20 mM HEPES pH 7.6, 60 mM KCl and 0.02% Tween20). Isolated complexes were then resuspended and aliquoted in a buffer containing 20 mM HEPES pH 7.6, 60 mM KC2H3O2, and 0.2 U/μl SUPERase-In. Addback mixtures containing 20 mM HEPES pH 7.6, 60 mM KC2H3O2, 0.2 mg/ml BSA, and as indicated, 0.3 pmol/rxn recombinant DSIF and 0.6 pmol/rxn affinity purified NELF were assembled and treated with 1 mM DTT or 0.1, 0.3 or 1 mM H2O2 for 10 min. In parallel, isolated elongation complexes were treated with 1 mM DTT or 0.1, 0.3 or 1 mM H2O2 for 9 min 30 s. After DTT or H2O2 treatment, addback mixtures were introduced to elongation complexes for 5 min. Elongation was then measured by a 5 min chase with 500 μM ATP, UTP, GTP and CTP and 5 mM Mg(C2H3O2)2. Transcripts were isolated with water-saturated phenol, precipitated with 95% ethanol and 500 mM NH4C2H3O2, and analyzed using 6% Urea–PAGE.
In Figure 6A and D, elongation complexes were chased immediately following the pulse for 3 or 10 min with 500 μM ATP, UTP, GTP and CTP. Reactions were stopped by addition of an EDTA-containing low salt wash (20 mM HEPES pH 7.6, 60 mM KC2H3O2, 20 mM EDTA, 0.2 mg/ml BSA and 0.02% Tween20) and, after concentration with a magnet, supernatants were carefully removed and saved. Both bead-bound and supernatant fractions were isolated with water-saturated phenol, precipitated with 95% ethanol and 500 mM NH4C2H3O2, and analyzed using 12% Urea–PAGE.
In vitro termination assay
Runoff bands (508 nt) and regions above and below labeled tRNAs (which were excluded) were quantified in MultiGauge. Counts from transcripts in bead-bound lanes and above 508 nt in supernatant lanes were scored as ‘not terminated.’ Non-runoff counts from remaining transcripts in supernatant lanes were scored as ‘terminated’. The percent of transcripts terminated (terminated/[terminated + not terminated]) was calculated from triplicate experiments and a paired, two-tailed distribution t-test was used to calculate P-values.
In vivo termination assay
After treatment of HeLa cells as indicated in the text, media was aspirated and cells were washed with ice cold PBS. Extraction buffer (20 mM HEPES pH 7.2, 0.5% IGEPAL CA-630, 1 mM EDTA, 300 mM NaCl, 1 mM DTT, 0.1% isopropanol-saturated PMSF and one cOmplete EDTA free tablet per 10 ml) was added and cells were scraped, transferred to a 1.5 ml tube and incubated on ice for 10 min with intermittent vortexing. After extraction, half of the material was collected for a total cell lysate fraction. The other half was spun at 8000 × g for 10 min at 4°C and both the nuclear pellet and the supernatant (cytosolic extract) were collected. Nuclei were resuspended in a volume of extraction buffer equivalent to the volume of the supernatant. All three samples were supplemented with SDS protein loading buffer. After heating to 95°C for 10 min, samples were resolved by SDS-PAGE on a 4–20% Tris–glycine gradient gel (Bio-Rad 456-8096). Transfer to nitrocellulose was accomplished using a discontinuous Tris-CAPS buffer system (0.625% SDS at cathode, 20% MeOH at anode) and an Owl HEP-1 semidry transfer apparatus. The membrane was washed in H2O and stained for 5 min with Ponceau S (0.1% w/v in 1% acetic acid v/v). The membrane was then washed in H2O to reveal Ponceau S stained bands and imaged under white light using an Epi Chemi II Darkroom equipped with a CCD (UVP). Ponceau S staining was removed through successive washing of the membrane in PBST. The membrane was then blocked for 30 min at RT in PBST with 10% milk. Afterwards, the blot was incubated for 1 h in PBST with 2% milk and a 1:1000 dilution of mouse anti-POLR2A F-12 (Santa Cruz Biotechnology sc-55492), washed three times in PBST, and then incubated for 1 h at RT in PBST with 2% milk and a 1:40000 dilution of rabbit anti-mouse HRP-conjugated antibody (Sigma A9044). Blots were visualized with SuperSignal West Femto Maximum Sensitivity Substrate in an Epi Chemi II darkroom. Densitometry analysis of blots was performed using ImageJ (34). Five independent experiments were performed and the levels of Pol II were quantified with appropriate background subtraction for each region of the gel. Signals for the nuclear and cytosolic Pol II were summed for the total (T) and percentages were calculated for nuclear (N) and cytosolic (C) fractions (100*N/T or 100*C/T). Standard errors of the mean were calculated and paired, two-tailed t-tests were performed.
Nuclear walk-on profile analysis
Radiolabeled RNAs were visualized using a Fujifilm Typhoon FLA-7000 phosphorimager and aligned profiles of lanes were obtained using Fujifilm MultiGauge software and exported to Microsoft Excel 2016. Cold RNAs were visualized using ethidium bromide and snRNA band intensities were quantified using ImageJ. The average of at least two bands was used to generate lane correction constants, which were then used to correct the radiolabeled lane profiles generated in MultiGauge. Corrected α-amanitin lane profiles were subtracted from total RNA lane profiles to generate Pol II-specific nascent transcript profiles. Finally, a ±10 data point rolling average was used to smooth curves (gel profiles contain about 1500 data points and a window of ±10 data points is ∼3 nt wide near the promoter-proximal pause peak).
An average curve with standard error in Figure 1 and Supplementary Figure S1 was generated from a nuclear walk-on performed in triplicate. Following analysis of individual replicates as described above, y-values were normalized within individual replicates by integrating the Mock curve in the pause region, and dividing all y-values by (area under Mock curve)/(number of data points used to calculate area). Next, the x-axes were normalized to the smallest dataset to compare across gels as follows. The pixel (x-value) corresponding to the α-amanitin peak at ∼50 nt in each replicate was chosen as the landmark for normalization. The x-values of each experiment were divided by the ratio of this peak to the peak location in the smallest dataset. Finally, y-values were interpolated for integer x-values in order to average the y-values across all three replicates. Average curves were graphed in Excel 2016 with error bars created by calculating standard error of the mean for each averaged data point.
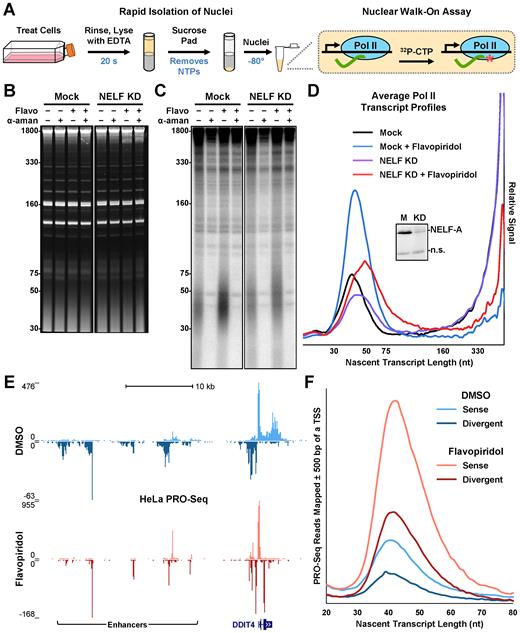
The nuclear walk-on assay quantitatively and precisely measures engaged Pol II. (A) Steps in the nuclear walk-on assay are illustrated. (B) Adherent HeLa cells were transfected 48 h before isolation of nuclei with 1.5 nM NELF-A siRNA (NELF KD) or lipid reagent only (Mock). Cells were also treated 1 h before isolation with 0.1% DMSO or 1 μM flavopiridol (Flavo). Nuclear walk-ons were performed using a 6 min α-32P-CTP pulse in the absence or presence of 2 μg/ml α-amanitin (α-aman). After 6% Urea-PAGE, ethidium bromide was used to visualize nuclear RNAs. A representative gel from nuclear walk-ons performed in triplicate is shown here. (C) Phosphorimage to visualize radiolabeled nascent transcripts from B. (D) Average amanitin-sensitive Pol II nascent transcript profiles from triplicate nuclear walk-ons as represented in B and C. For each replicate, signals from each lane in the phosphorimage were normalized using quantifications of cold nuclear RNAs in the ethidium bromide stain. Then, α-amanitin-insensitive signals were subtracted from total signals. Triplicate profiles (see Supplementary Figure S1) were then averaged as described in the Materials and Methods. Inset: western blot of NELF-A; a nonspecific band (n.s.) indicates even loading. (E) PRO-Seq paired-end reads over the DDIT4 gene and upstream enhancer regions. Adherent HeLa cells were treated 1 h with either 0.1% DMSO or 1 μM flavopiridol. (F) Plot of sense or divergent PRO-Seq fragments lengths near Pol II promoters.
Fold-change of paused Pol II following flavopiridol treatment in Figure 1 and Supplementary Figure S1 was calculated in triplicate by integrating the pause region in the Mock + flavopiridol curves and dividing by the area under the Mock curves from the same region. Standard error of the mean was calculated for the average fold-change across triplicates and a paired two-tailed t-test was conducted to determine significance.
Genomic alignment and track generation
Raw paired sequences were aligned to the UCSC hg19 assembly using nvBowtie (- -overlap - -no-mixed) and a NVIDIA Tesla K40c. For PRO-Seq, reads were trimmed before alignment using trim_galore (- -small_rna - -paired - -retain_unpaired). Samtools was then used to (i) sort resulting BAM files and (ii) count mapped reads in each sample (view -q 1). Bedgraphs were generated using bedtools genomecov (-bg -pc). These bedgraphs were then corrected using either coverage over the 45S ribosomal gene (NT_167214.1 bases 105424–118780) (PRO-Seq), or the average mapped reads per sample within a given lane of sequencing (ChIP-Seq). Finally, various kentUtils were used to generate bigwigs for hosting and visualization of ChIP-Seq pileup data on the UCSC Genome Browser (35).
Metagene analyses and heatmaps
The hg19 EPDnew promoter database (36) was filtered to eliminate duplicate TSS and entries with a neighboring TSS within 1 kb (leaving 17592 TSS). For PRO-Seq, fragment lengths were recorded if their 5′ ends were within 500 bp of these TSS. Fragments were further sorted by their relative orientation (sense or divergent) to these TSS. For ChIP-Seq, metagene analyses were performed ±10 kb around these TSS using deepTools computeMatrix (reference-point - -referencePoint=TSS - -upstream=1500 - -downstream=1500 - -binSize=1 - -sortRegions=no - -missingDataAsZero), the ENCODE DAC hg19 consensus blacklist, and depth-corrected bigWigs from above as input. Metagene profiles were exported as tab-delineated files using deepTools plotProfile and plotted in Microsoft Excel. To enable comparisons of factor distributions independently from occupancy levels in Figures 4B, D, 5C and Supplementary Figure S6B, metagenes were calculated over a 20 kb window (- -upstream=10000 - -downstream=10000 - -binSize=10), the lowest point ± 10 kb around promoters was subtracted from all points, and the area under each curve was normalized to 1.
Metagene profiles around enhancers were generated using the following method. First, peaks were identified within the NELF Flavopiridol ChIP-Seq presented in Figure 4 using macs2 callpeak - -call-summits (n = 14 339). Next, narrow peak regions were filtered to eliminate duplicates (n = 9632) and neighbors within 1 kb (n = 8088). NELF peaks were then filtered to eliminate entries within 1 kb of RefSeq TSS (n = 1181). Metagene analyses were then performed ± 1.5 kb around these NELF-enriched regions as above (- -reference-point=center - -upstream=1500 - -downstream=1500 - -binSize=1) except the resulting entries were sorted by the difference of H3K4me3 from H3K4me1 ChIP-Seq signals, which was generated using deepTools function bigwigCompare (- -ratio=subtract - -binSize=1). Areas around the top 1000 H3K4me1-enriched NELF peaks were then plotted in Microsoft Excel.
Heatmaps were generated using deepTools function plotHeatmap using data processed using computeMatrix as above, except with the following settings (- -upstream=1000 - -downstream=1000 - -binSize=1). Difference tracks were generated from depth-corrected bigwigs using bigwigCompare.
RESULTS
A semi-global method to quantitatively assess Pol II promoter-proximal pausing
We modified a standard nuclear run-on assay to more accurately quantify nascent transcripts associated with promoter-proximal paused polymerases in cells. To minimize unwanted and potentially aberrant elongation during isolation steps, adherent cells are lysed in an EDTA-containing buffer within 20 s of removal from the 37°C incubator (Figure 1A). EDTA is maintained as nuclei are centrifuged through a sucrose pad, which eliminates remaining endogenous nucleotides and loosely bound factors. To obtain a precise extension of nascent transcripts, nuclei are incubated with 167 nM α-32P-CTP in the presence of 0.5% Sarkosyl to eliminate effects of factors and histones. This allows extension of about a quarter of the nascent transcripts (those with C as the next base) by one nucleotide (walk-on) and provides a representative global signal. Usually, duplicate reactions are performed in the presence or absence of the Pol II inhibitor α-amanitin and ethidium bromide staining of endogenous RNAs is used to normalize loading. Radiolabeled nascent transcripts are quantified by phosphorimaging and Pol II-specific profiles are generated by the difference between the profiles from lanes without and with α-amanitin. The relative signals in the Pol II profiles are quantitatively comparable (both transcript length and amount) when the results are derived from a single gel. Throughout the results, curves in a single plot will always be comparable and figure legends will specifically indicate when signals across plots can be compared. Gel images are also provided for later experiments in a supplemental appendix.
To determine if the nuclear walk-on method accurately reports on promoter-proximal pausing, assays were performed using HeLa cell nuclei isolated from control cells or cells subjected to siRNA knockdown of NELF-A. Knockdown of NELF subunits have been previously reported to modestly decrease Pol II pausing and promoter occupancy (37,38). During the final hour before harvest, cells were also treated with DMSO or flavopiridol, a potent P-TEFb inhibitor known to inhibit productive elongation and increase promoter-proximal Pol II (3,32,39). The ethidium bromide stained gel and phosphoimage from a representative assay are displayed in Figure 1B and C, and the average profile analysis of three replicates are in Figure 1D. The Pol II transcript profile from control cells revealed nascent transcripts consistent with promoter-proximal pausing between 30 and 75 nt as well as a population of long transcripts indicative of productive elongation (Figure 1D, black). Flavopiridol treatment caused the promoter-proximal population to increase 2.08 ± 0.07-fold (p = 0.0047) and shift slightly downstream (blue). As expected, inhibition of P-TEFb also greatly reduced the amount of labeled transcripts longer than 160 nt. NELF knockdown (Figure 1D, inset) in combination with DMSO (purple) or flavopiridol (red) treatments did not drastically alter the amounts of promoter-proximal signal when compared with mock controls, but transcripts in the promoter-proximal region were longer after NELF knockdown when compared to transcripts from reactions with normal levels of NELF. These patterns are consistent with the reduced concentration of NELF in cells causing a defect in Pol II pausing as was found by Pol II ChIP-chip signals after NELF knockdown in Drosophila (38). Overall, these results were highly reproducible, as illustrated by plotting the standard error across the average signal from all three gels (Supplementary Figure S1), and demonstrate that nuclear walk-ons can be used to detect subtle changes in promoter-proximal Pol II. Notably, the effects of flavopiridol have been replicated in over twenty additional nuclear walk-on experiments.
Because PRO-Seq is the most informative method for analysis of nascent transcripts, we performed PRO-Seq using nuclei from control and flavopiridol-treated HeLa cells and compared the results to those obtained with the simple walk-on analyses of similar nuclei. Five minutes of labeling with 167 nM α-32P-CTP was followed by a 10 min incubation with all four biotin-11-NTPs at 25 μM. Isolated nascent transcripts were subjected to a PRO-Seq protocol (31) with modifications. The inclusion of labeled CTP enabled monitoring of samples during early library preparation steps. The use of paired-end sequencing resulted in complete 5′-to-3′ coverage of the short promoter-proximal RNAs. About 12 million reads from each dataset mapped to ribosomal DNA and 31.2 and 28.8 million reads mapped to hg19 for the control and flavopiridol datasets respectively. In agreement with the nuclear walk-on data, flavopiridol resulted in increases in PRO-Seq signals originating from promoters and enhancers genome-wide as exemplified by the region around the DDIT4 gene (Figure 1E). Both sense and divergent transcription was seen around the promoter and in the enhancers upstream. Flavopiridol treatment of cells lead to loss of productive elongation in the DDIT4 gene body, loss of long transcripts in both directions from enhancers and an increase in promoter- and enhancer-proximal pausing. Interestingly, flavopiridol also revealed a convergent promoter (40) in the body of DDIT4 that seems to be repressed under normal conditions. When the lengths of fragments whose 5′ ends mapped within 500 bp of an annotated Pol II TSS were plotted for both sense and divergent transcripts (Figure 1F), size distributions matched those obtained using the walk-on assay. This included both the increase in amount and the shift to slightly longer transcripts caused by treatment of cells with flavopiridol. We conclude that the data obtained by nuclear walk-on assays provide an accurate analysis of the length and abundance of RNAs in promoter-proximal Pol II elongation complexes.
The nuclear walk-on assay reveals both rapid and prolonged effects of H2O2 on pausing
Because H2O2 inhibited Pol II initiation and co-transcriptional capping in vitro (32), we used the nuclear walk-on assay to determine the effects of H2O2 on Pol II pausing in cells. Increasing concentrations of H2O2 were added to the media of adherent HeLa cells and after two days, 0.3 mM H2O2 was the highest concentration with no noticeable effects on cell morphology (Supplementary Figure S2). Cells were treated with 0.3 mM H2O2 for 2, 5, 10, 20 or 50 min and profiles were generated using signals from capped nascent transcripts, which are Pol II-specific (Figure 2A). Signals from capped Pol II transcripts over the pause region dramatically increased after just 2 min of H2O2 treatment. By 5 min, the engaged polymerases began to ‘creep,’ or slowly travel downstream, and this creeping was more prominent after 10 min. At 20 min, a partial restoration of normal signal over the pause region was observed and this appeared to be complete after 50 min. Throughout this time course, the amounts of capped transcripts remained proportional to total RNAs generated (see Gel Appendix), suggesting that capping was unaffected by treatment of cells with 0.3 mM H2O2. These results demonstrate that H2O2 induces two transcriptional effects: rapid accumulation of paused Pol II, and creeping of a fraction of these polymerases.
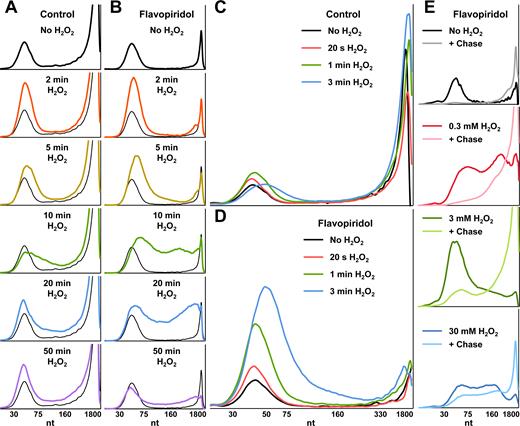
H2O2 causes rapid accumulation, then creeping of promoter-proximal Pol II. (A) Capped nascent Pol II transcript profiles from a nuclear walk-on using nuclei from adherent HeLa cells treated with 0.3 mM H2O2 for indicated times. No H2O2 control profiles are duplicated in all panels. Capped transcripts were selected by treating Trizol-isolated RNAs with recombinant RNMT and SAM, and then using an immobilized anti-2,2,7-trimethylguanosine antibody. All plots in A were from the same gel (see Gel Appendix) and have the same vertical scale (relative signal). (B) The experiment in A, except all cells were treated 1 h with 1 μM flavopiridol prior to H2O2. All plots in B were from the same gel and have the same vertical scale (relative signal), which is reduced to match the paused Pol II peak height in A. (C) Amanitin-sensitive Pol II nascent transcript profiles from a nuclear walk-on using nuclei from adherent HeLa cells treated 1 h with 0.1% DMSO. 0.3 mM H2O2 was added during the last 20 s, 1 min or 3 min of treatment as indicated (n = 2). (D) The experiment in C, except all cells were treated 1 h with 1 μM flavopiridol instead of DMSO alone. DMSO was 0.1% in all conditions. Figure 2C and D were from the same gel and have the same vertical scale (relative signal). (E) Amanitin-sensitive Pol II nascent transcript profiles from a nuclear walk-on using nuclei from adherent HeLa cells treated 1 h with 1 μM flavopiridol. 0.3, 3 or 30 mM H2O2 were added during the last 10 min of treatment as indicated. After a 5 min α-32P-CTP pulse, reactions were chased as indicated for 10 min with 500 μM cold ATP, UTP, GTP and CTP. All plots in Figure 2E were from the same gel and have the same vertical scale (relative signal).
Treating cells for 1 h with the P-TEFb inhibitor flavopiridol prior to addition of 0.3 mM H2O2 greatly accentuated the observation of Pol II creeping (Figure 2B). Although a similar increase in promoter-proximal Pol II signal was observed after 2 min of H2O2 in flavopiridol-treated cells, more polymerases remained near promoters after 5 min and stronger signals from creeping polymerases were detected after 5, 10 and 20 min. These results suggest that peroxide does not significantly influence the P-TEFb-dependent transition into productive elongation. In the absence of flavopiridol, this effect of H2O2 is only observed on the fraction of paused complexes that are not affected by P-TEFb. The effects of H2O2 were not cell type specific because paused Pol II accumulation and creeping were also observed in exponentially growing (Supplementary Figure S3A) and stationary phase (Supplementary Figure S3B) primary human foreskin fibroblasts. The magnitude of these effects could also be titrated by altering the H2O2 concentration used to treat HeLa cells (Supplementary Figure S3C). Both the increase and creeping of the paused polymerases could be explained by a defect in promoter-proximal termination.
To determine how rapid the global transcriptional response to H2O2 is, we exploited our nuclei isolation protocol's ability to quickly stop elongation with EDTA and treated cells with 0.3 mM H2O2 for extremely short time points. In cells exposed only to hydrogen peroxide, Pol II signals changed as early as 20 s after treatment and nascent transcripts associated with paused Pol II were slightly shorter (Figure 2C). Promoter-proximal Pol II began to accumulate after 1 min of H2O2 and many of these polymerases began to creep by 3 min. As seen in the previous experiment, flavopiridol treatment allowed the effects on pausing to be more clearly observed (Figure 2D). Increases in paused Pol II were 1.4-fold (± 0.2) after 20 s, 2.8-fold (± 0.04) after 1 min and 4.8-fold (± 0.8) after 3 min. These results demonstrate that H2O2 rapidly increases engaged promoter-proximal Pol II and creeping occurs after this accumulation.
We next sought to address whether or not these effects were due to DNA damage because lesions caused by reactive oxygen species are known to block Pol II elongation if left unrepaired (41). Using nuclei from HeLa cells treated with flavopiridol for 1 h and 0.3, 3 or 30 mM H2O2 for 10 min, we performed duplicate α-32P-CTP pulses and, reasoning that DNA damage would measurably hinder further elongation, chased half of the reactions with cold NTPs for 10 min. In the absence of H2O2, essentially all promoter-proximal Pol II moved significantly downstream when chased with high levels of NTPs (Figure 2E). Although more Pol II elongation was inhibited by higher doses of H2O2—fewer transcripts were extended by the chase after 30 mM H2O2 than 3 mM H2O2—similar amounts of chase-induced elongation were observed between the no H2O2 and 0.3 mM H2O2 experiments. Analysis of α-amanitin-insensitive transcripts from this experiment revealed that the lengths of Pol I and III nascent transcripts were unaffected by 0.3 mM H2O2 and were able to be chased into longer transcripts (Supplementary Figure S3D). Interestingly, H2O2 treatment led to a dramatic reduction (3 mM) or elimination (30 mM) of α-amanitin-insensitive transcripts. These results suggest that the pausing and elongation defects exhibited by cells treated with 0.3 mM H2O2 are unique to Pol II and are not the direct result of DNA damage.
Hydrogen peroxide alters Pol II occupancy at promoters and enhancers genome-wide
Although a previously published study showed that Pol II accumulated downstream of both sense and antisense promoters in MRC5 cells after 30 min of 0.2 mM H2O2, earlier time points were not performed (25). To evaluate the timing of H2O2-induced Pol II accumulation and creeping at individual promoters and enhancers, ChIP-Seq was performed using adherent HeLa cells left untreated or treated for 3, 10, 30 and 100 min with 0.3 mM H2O2. Because P-TEFb inhibition accentuated these effects by nuclear walk-on, this time course was also performed using cells pre-treated for 1 h with 1 μM flavopiridol. By crosslinking cells directly in media without first washing or pelleting cells, early time points could be obtained with confidence. To enable comparisons between samples obtained within an experiment using the same antibody, pileup densities were normalized using the average number of mapped sequence reads between matched samples. The expected pattern of Pol II occupancy was observed over the highly transcribed gene DDIT4 (Figure 3A) and other promoters and gene bodies in untreated cells using the UCSC Genome Browser (35). Slight increases in promoter-proximal Pol II occupancy and spreading in both directions were observed after 3 min of H2O2 treatment and these changes dissipated over the remaining time points. Consistent with previous ChIP-Seq results (3,39), inhibition of P-TEFb eliminated most Pol II over gene bodies and increased promoter-proximal signal about 2-fold. In the presence of flavopiridol, H2O2-induced Pol II accumulation and creeping were more evident at some genes and polymerases slowly spread in both sense and antisense directions from the DDIT4 promoter at 3, 10 and 30 min. These effects were also observed at enhancers upstream of DDIT4 (Figure 3A).
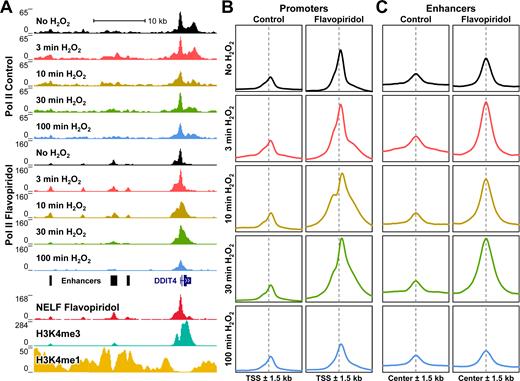
Effects of H2O2 occur genome-wide at promoters and enhancers. (A) ChIP-Seq reads over the DDIT4 gene and upstream enhancer regions. Pol II: adherent HeLa cells were left untreated (Control) or treated 1 h with 1 μM flavopiridol, and then with 0.3 mM H2O2 for indicated times. Pileup densities were depth-adjusted using the average number of mapped sequence reads in all 10 samples. NELF: suspension HeLa cells were treated 1 h with 1 μM flavopiridol. H3K4me3 and H3K4me1: untreated suspension HeLa cells. (B) Average Pol II ChIP-Seq occupancies ±1.5 kb around TSS within the EPDnew eukaryotic promoter database not within 1 kb of a neighboring TSS (n = 17592). The vertical axes represent depth-adjusted signal and all plots have the same vertical scale. (C) Average Pol II ChIP-Seq occupancies ±1.5 kb around a subset of enhancers, defined here as the center of non-TSS NELF peaks preferentially enriched for H3K4me1 over H3K4me3 (n = 1000). The vertical axes represent depth-adjusted signal and all plots have the same vertical scale.
Metagene profiles of Pol II occupancy around promoters were generated by summing the pre-normalized ChIP-Seq signals around most annotated transcription start sites (TSS) within the EPDnew eukaryotic promoter database (36). To prevent ambiguous and overlapping signals from nearby promoters, entries with a neighboring TSS within 1 kb were eliminated (leaving 17592 promoters). In control cells (not treated with flavopiridol), Pol II occupancy increased ∼1.8-fold after 3 min of H2O2 treatment and this increase was similar (1.9-fold) in flavopiridol-treated cells (Figure 3B). Notably, Pol II occupancy remained elevated for at least 30 min around promoter regions in flavopiridol-treated cells, further suggesting that P-TEFb normally acts to clear most of the Pol II accumulated after oxidative stress. Regardless of P-TEFb inhibition, populations of slowly elongating polymerases were observed after 3, 10 and 30 min, and by 100 min, Pol II occupancies returned to normal levels and distributions. Importantly, heatmaps containing the top 8000 promoters ranked by Pol II occupancy showed that these distribution changes occurred at nearly all transcribed genes (Supplementary Figure S4). We conclude that the H2O2-induced changes we observed by nuclear walk-on and metagene analyses must occur generally and not at a limited subset of promoters.
To generate a representative view of active enhancers that are marked by H3K4me1 (42), regions of NELF occupancy were filtered to eliminate entries with neighbors or RefSeq TSS within 1 kb (Figure 3A, enhancers). The remaining NELF-enriched regions were sorted by the difference between H3K4me1 and H3K4me3 ChIP-Seq occupancy in a 3 kb window and profiles were generated using the top 1000 H3K4me1-enriched sites. Like at promoters, H2O2 caused both a rapid increase in Pol II occupancy and spreading over time at enhancers (Figure 3C). Pol II occupancy at these sites was also sensitive to flavopiridol even though these sites generally lacked H3K4me3 enrichment and other signs of productive elongation. Overall, these results demonstrate that H2O2 has rapid and prolonged effects on global Pol II transcription and these changes occur broadly across the genome at both promoters and enhancers.
H2O2-induced loss of NELF at promoters correlates with Pol II creeping
Pol II ChIP-Seq was repeated using flavopiridol-treated suspension HeLa cells with or without 35 min of peroxide. Heatmaps of Pol II signal around the TSS of the 8000 most occupied genes showed that Pol II increased at essentially all genes. When these heatmaps were subtracted, the increases of Pol II signal after H2O2 treatment around the TSS were relatively uniform (Figure 4A). NELF ChIP-Seq was also performed in these cells and unlike Pol II, NELF occupancy decreased around most, but not all TSS, 35 min after peroxide treatment. Because NELF occupancy did not increase alongside Pol II, it is possible that a large portion of peroxide-sensitive elongation complexes lack NELF. To enable comparisons of the distributions between factors independently from their occupancy levels, a 20 kb window was used to background subtract and normalize areas under Pol II and NELF metagene profiles. As expected when P-TEFb was inhibited, Pol II and NELF had nearly identical distributions in the absence of H2O2 (Figure 4B, left). After 35 min of peroxide treatment however, only Pol II, and not NELF, was found downstream of the expected pause region (Figure 4B, right). This result was also borne out in NELF heatmaps (Figure 4A) and indicates that NELF is generally not associated with creeping elongation complexes.
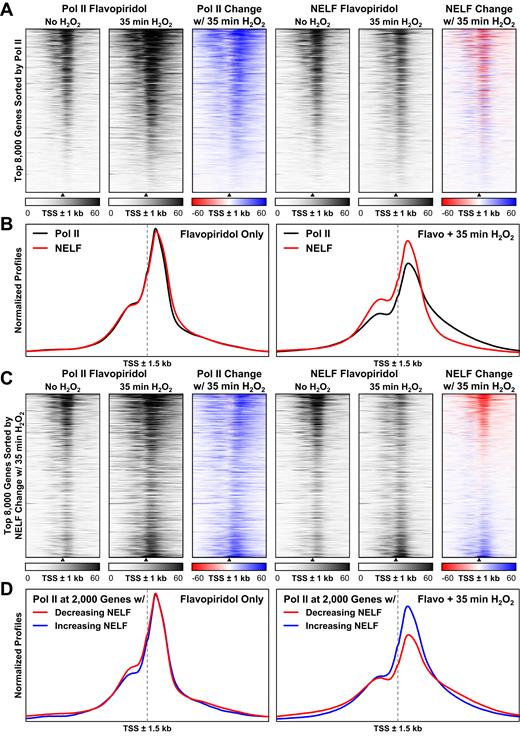
NELF is selectively lost from creeping elongation complexes genome-wide. (A) Pol II and NELF ChIP-Seq occupancies ±1 kb around the top 8000 EPDnew TSS with the highest median Pol II signal. Suspension HeLa cells were treated 1 h with 1 μM flavopiridol, and then 35 min with 0.3 mM H2O2 as indicated. Signals were depth-adjusted using the average number of mapped sequence reads in all four samples. The heatmaps were sorted by TSS with decreasing Pol II occupancy in the no H2O2 control. (B) Average normalized Pol II and NELF ChIP-Seq occupancies ±1.5 kb around 17592 EPDnew TSS. The vertical axes represent depth-adjusted signals that were background-subtracted and normalized using a window ±10 kb around genes. Both plots have the same vertical scale. (C) The heatmaps from A were sorted by the change in median NELF occupancy after 35 min 0.3 mM H2O2 treatment. (D) Average normalized Pol II ChIP-Seq occupancies ±1.5 kb around the 2000 EPDnew TSS with the largest decrease (red) or increase (blue) in median NELF occupancy after 35 min 0.3 mM H2O2 treatment. The vertical axes represent depth-adjusted signals that were background-subtracted and normalized using a window ±10 kb around genes. Both plots have the same vertical scale.
To look more closely at the non-uniform changes in NELF occupancy after peroxide treatment, the heatmaps in Figure 4A were instead sorted by the difference in NELF signals revealing populations of NELF-depleted (Figure 4C, top) and NELF-enriched (bottom) elongation complexes. Because of difficulties quantifying absolute changes in ChIP-Seq signals, the two populations are best considered in relative terms. While most genes with the largest decreases in NELF after 35 min of H2O2 are highly transcribed in untreated HeLa cells, a number of oxidative stress response genes also lost NELF including HIF1A and SOD2 (Supplemental Table). When comparing the distributions of Pol II on these two populations before and after H2O2, genes that lost the most NELF after 35 min had relatively less promoter-proximal Pol II and relatively more creeping (Figure 4D, right) despite having nearly identical Pol II distributions before treatment (left). An additional ChIP-Seq experiment showed that some NELF loss occurred on the same set of genes after 10 min of H2O2 and biases in Pol II spreading were detectable after 3 min (Supplementary Figure S5). These results indicate that NELF is selectively and progressively lost over time after exposure to peroxide and this loss likely causes Pol II creeping seen at longer time points.
We next asked whether or not H2O2 directly impaired the abilities of DSIF and NELF to slow Pol II elongation in a defined in vitro system (43). In these reactions, HeLa nuclear extract, an immobilized CMV-promoter template, and a 30 s pulse with limiting α-32P-CTP were used to generate early elongation complexes with short radiolabeled transcripts. After a high salt wash to remove associated factors, complexes were treated for 10 min with 1 mM DTT or increasing concentrations of H2O2. Addback mixtures containing buffer alone or DSIF and NELF were also treated with DTT or H2O2 prior to incubation with complexes for 5 min. These complexes were then chased with cold NTPs and their elongation rates were compared. In the absence of added factors, most high salt washed complexes generated transcripts longer than 150 nt in length (Figure 5A, lane 1) and increasing concentrations of H2O2 had little effect on elongation (lanes 2–4). Under reducing conditions, DSIF and NELF greatly decreased the elongation rate of washed complexes (lane 5) when compared to the mock addback control (lane 1) and this pausing activity was consistent with previously published results (32). The ability of DSIF and NELF to slow Pol II was partially inhibited at 0.3 mM H2O2 (lane 7) and strongly inhibited at 1 mM H2O2 (lane 8). These results indicate that pausing of high salt isolated elongation complexes by DSIF and NELF can be disrupted by hydrogen peroxide in vitro. It was also found by others that methionines in the Spt5 subunit of DSIF and the A, C/D and E subunits of NELF were oxidized by H2O2 treatment of cells (20).
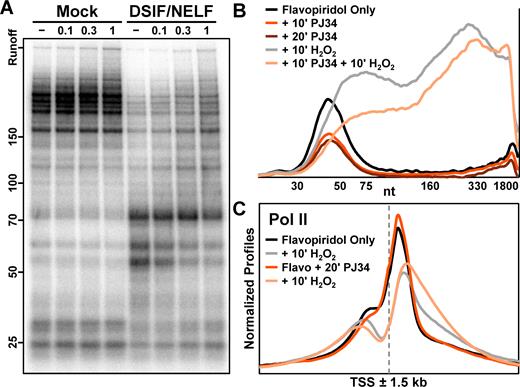
H2O2 directly inhibits pausing by DSIF and NELF. (A) Elongation complexes were generated by first preincubating HeLa nuclear extract and immobilized template DNA for 30 min, and then pulsing with limiting α-32P-CTP for 30 s. Complexes were isolated by high salt wash and incubated 10 min with 1 mM DTT or indicated concentrations of H2O2. Addback mixtures containing buffer alone (Mock, lanes 1–4) or also containing 0.3 pmol DSIF and 0.6 pmol NELF (lanes 5–8) were also incubated 10 min with 1 mM DTT or indicated concentrations of H2O2 prior to incubation with complexes for 5 min. Elongation rates were measured by chasing for 5 min with 500 μM cold ATP, UTP, GTP and CTP. 6% Urea–PAGE. (B) Amanitin-sensitive Pol II nascent transcript profiles from a nuclear walk-on using nuclei from adherent HeLa cells treated 50 min with 1 μM flavopiridol, then 10 min with 0.1% DMSO (flavopiridol only), 10 min with 50 μM PJ34, or 20 min with 50 μM PJ34. Cells were additionally treated 10 min with 0.3 mM H2O2 as indicated. DMSO was 0.2% in all conditions. The vertical axis represents relative signal from Pol II and all curves were from the same gel. (C) Average normalized Pol II ChIP-Seq occupancies ±1.5 kb around 17592 EPDnew TSS. Suspension HeLa cells were treated 40 min with 1 μM flavopiridol, then 20 min with either 0.05% DMSO (flavopiridol only) or 20 μM PJ34. Cells were additionally treated 10 min with 0.3 mM H2O2 as indicated. The vertical axis represents depth-adjusted signals that were background-subtracted and normalized using a window ±10 kb around genes.
Poly-ADP-ribosylation (PARylation), a post-translational modification triggered by DNA damage (44,45), occurs on histones (46) and proteins involved in both DNA repair and transcription (47) in response to hydrogen peroxide. PARP1, a DNA-dependent poly(ADP-ribosyl) transferase, has also been recently reported to PARylate and inhibit NELF (48). Because knockdown of PARP1 or inhibition with PJ34 led to a global increase in promoter-proximal Pol II by GRO-Seq and a decrease in reads downstream of active promoters (48), we hypothesized that PARylation of NELF could contribute to H2O2-induced Pol II creeping. We first performed nuclear walk-ons using cells treated with 1 μM flavopiridol for 50 min followed by 50 μM PJ34 for 10 or 20 min. Unexpectedly, PJ34 treatment decreased the amount of engaged promoter-proximal Pol II when compared with flavopiridol alone (Figure 5B) and strongly inhibited α-amanitin-resistant transcription (Supplementary Figure S6A). The reduction of paused Pol II could be an effect of combining flavopiridol and PJ34, which was not tested in Gibson et al. (48). When PJ34-treated cells were then exposed to 0.3 mM H2O2 for an additional 10 min, Pol II creeping was still observed and nascent transcripts were slightly longer when PARP1 was inhibited (Figure 5B). To validate the effects of PJ34 on H2O2-induced Pol II creeping, ChIP-Seq was performed on flavopiridol-treated cells with or without 20 μM PJ34 and normalized metagene profiles were generated as in Figure 4 to compare the relative distributions of factors. Although PJ34 had little effect on the position of Pol II in the absence of H2O2, PJ34 increased creeping up to 1 kb downstream of promoters genome-wide after 10 min of peroxide (Figure 5C). These effects were also seen in ChIP-Seq experiments for DSIF, which generally travels with elongating Pol II, but not NELF (Supplementary Figure S6B). Our results show that inhibition of PARP1 does not reduce the peroxide-induced defect in pausing. Overall, we conclude that loss of NELF during oxidative stress is directly caused by H2O2 and likely occurs independently from PARylation of NELF or other proteins.
H2O2-induced rapid accumulation of Pol II is likely due to loss of termination
Finally, we wanted to address the possible mechanisms for the H2O2-dependent increase in paused Pol II. Because a stress-induced rapid increase in initiation seemed unlikely, we hypothesized that a defect in termination could increase the residence time of paused Pol II. To assess its effects on initiation, we titrated H2O2 into extract-containing transcription reactions 30 min before the pulse and found that increasing concentrations (especially 2 mM or higher) reduced the production of radiolabeled transcripts in vitro (Figure 6A, pulse). When elongation complexes formed in the presence of increasing concentrations of H2O2 were also chased, no additional defects were observed aside from the dose-dependent decrease in signal (Figure 6A, pulse-chase). Consistent with previous findings (23,32), these results indicate that H2O2 does not stimulate initiation, but does inhibit initiation at higher concentrations.
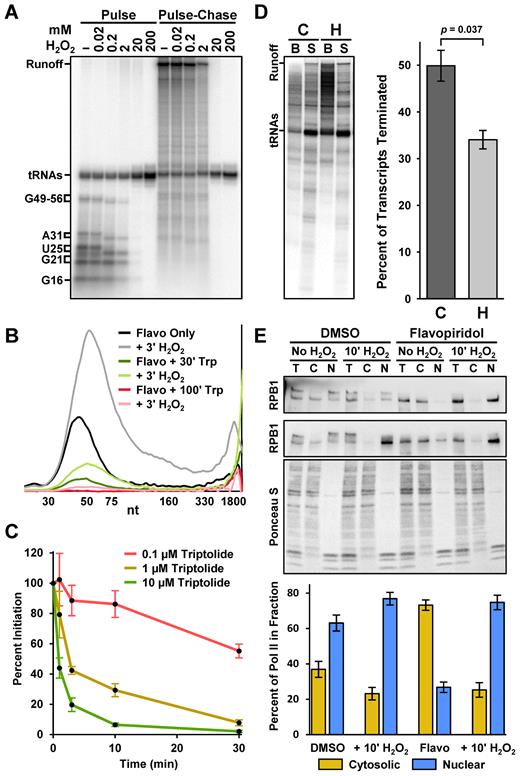
H2O2 inhibits Pol II termination in vitro and increases Pol II engagement in cells. (A) Preinitiation complexes were formed on immobilized template DNA in the presence of indicated concentrations of H2O2. Elongation complexes were pulsed 30 s with limiting α-32P-CTP and chased as indicated for 3 min with 500 μM cold ATP, UTP, GTP and CTP. Lengths of limiting-CTP transcripts are indicated; brackets indicate sizes of capped and uncapped transcripts. 6% Urea-PAGE. (B) Amanitin-sensitive Pol II nascent transcript profiles from a nuclear walk-on using nuclei from adherent HeLa cells treated 100 min with 1 μM flavopiridol, and then 3 min with 0.3 mM H2O2 as indicated. 500 nM triptolide was added either during the last 30 min of flavopiridol treatment, or during all 100 min of flavopiridol treatment. The vertical axis represents relative signal from Pol II and all curves were from the same gel. (C) 0.1, 1 or 10 μM triptolide was added to preinitiation complexes 30, 10, 3 or 1 min before a 30 s limiting α-32P-CTP pulse. Labeled non-tRNA transcripts were quantified, adjusted for loading using cold nuclear RNAs, and normalized to reactions lacking triptolide. Error bars represent S.E.M. from three replicates. (D) Preinitiation complexes were formed on immobilized template DNA in the presence of 1 μM flavopiridol alone (C; control) or in combination with 0.3 mM H2O2 (H). Elongation complexes were pulsed 30 s with limiting α-32P-CTP and chased 10 min with 500 μM cold ATP, UTP, GTP and CTP. Labeled transcripts from bead-bound (B) and supernatant (S) fractions were quantified to measure termination. Runoff transcripts (508 nt) were considered bound and tRNAs were excluded. Error bars represent S.E.M. and p-values are from 3 replicates (see Gel Appendix). 12% Urea–PAGE. (E) Top panel: western blot of RPB1 (sc-55492) and Ponceau S staining. Total (T) or cytosolic (C) and nuclear (N) fractions were obtained from adherent HeLa cells treated 1 h with 0.1% DMSO or 1 μM flavopiridol, and then 10 min with 0.3 mM H2O2 as indicated. Shown are two representative blots for RBP1. The bottom plot pairs with the Ponceau S staining. 4–20% SDS-PAGE. Bottom panel: plot of the percentage of RPB1 in the cytosolic (C/C+N) or nuclear (N/C+N) fractions from five replicates.
In an attempt to further rule out an induction of initiation, a nuclear walk-on was performed using adherent HeLa cells treated with both 1 μM flavopiridol and 0.5 μM triptolide, a covalent XPB helicase inhibitor that blocks initiation (49). Pol II engagement decreased after 30 min of triptolide and was nearly undetectable in the pause region after 100 min (Figure 6B). This rate of loss suggests that inhibition of initiation by triptolide is slow. A 3 min treatment of cells with H2O2 led to an increase in paused Pol II compared to the matching control regardless of the amount of triptolide. These results support the idea that the effects of H2O2 are not derived from an increase in the rate of initiation. To more directly measure the kinetics of inhibition of initiation by triptolide, we performed in vitro transcription reactions in which 0.1, 1 and 10 μM triptolide was added 30, 10, 3 or 1 min before the pulse. As expected for a covalent inhibitor, a concentration- and time-dependent inhibition of initiation was observed (Figure 6C). 0.1 μM triptolide exhibited only weak inhibition even after 30 min and significant amounts of initiation were observed after 10 min of treatment with 1 or 10 μM triptolide. Together, these results demonstrate that inhibition of initiation by triptolide is slow and concentration-dependent, but that as long as initiation is not completely inhibited, H2O2 can still cause a build-up of promoter-proximal paused Pol II due to inhibition of termination.
We also used in vitro transcription to directly measure H2O2-dependent changes in termination. Preinitiation complexes were formed on immobilized template DNA in the presence or absence of 0.3 mM H2O2. After a pulse-chase, bead-bound and supernatant fractions were separated and labeled transcripts in both were quantified. Transcripts associated with bead-bound elongation complexes or of sufficient length to be from polymerases that ran off the end of the template (508 nt) were scored as not terminated. Transcripts shorter than runoff in the supernatants were scored as terminated. Because tRNAs also incorporate α-32P-CTP in the presence of nuclear extract, they were excluded from these measurements. Signals from bound transcripts markedly increased after H2O2 and when quantified from triplicate experiments, this reduction in termination was significant (Figure 6D). This demonstrates that H2O2 inhibits termination of Pol II elongation complexes in vitro.
Reasoning that termination should correlate with the quantity of soluble Pol II extractable from nuclei, we conducted an in vivo termination assay. After treating HeLa cells with DMSO or flavopiridol for 1 h with or without 10 min of 0.3 mM H2O2, cells were lysed and soaked in an extraction buffer containing 300 mM NaCl for 10 min to remove soluble Pol II from the nucleus. Total, cytosolic, and nuclear extracts were then probed by western blot for Pol II and the intensity of Ponceau S was used as a loading control. In the absence of H2O2, more Pol II was observed in the cytosolic fraction after flavopiridol treatment (p = 0.0014) (Figure 6E). This was anticipated as flavopiridol inhibits productive elongation, a major source of engaged Pol II in the nucleus. Exposure to H2O2 for 10 min significantly reduced the amount of soluble Pol II detected in nuclei from both DMSO- (p = 0.0101) and flavopiridol-treated cells (p = 0.0005). The magnitude of these H2O2-dependent increases in nuclear retention with or without flavopiridol match the nuclear walk-on and ChIP-Seq results obtained after 10 min of H2O2. Given the consistency of these results, we conclude that H2O2 rapidly inhibits termination resulting in chromatin engagement of 75–80% of the Pol II in cells.
DISCUSSION
Our investigation uncovered two dramatic global effects of oxidative stress on the basic transcription machinery. First, a very rapid change in transcription results in a 3- to 5-fold increase in paused Pol II across the genome. Second, a fraction of these paused polymerases begin to creep into gene bodies after ∼10 min. If we model transcription elongation control as a series of inputs and outputs, the two effects of hydrogen peroxide become clearer (Figure 7). Normally, the amount of engaged promoter-proximal Pol II is a function of initiation as an input and both termination and productive elongation as outputs. Treatment of cells with 0.3 mM H2O2 causes the amount of paused Pol II to drastically increase in under a minute and this increase occurs regardless of whether or not productive elongation is blocked. The in vitro transcription results in Figure 6A and previous studies (23,32) demonstrate that H2O2 does not affect initiation at 0.3 mM and, as expected, inhibits initiation at higher concentrations. Therefore, a defect in termination is the most plausible explanation for the rapid increase in Pol II engagement. The second effect, slow creeping of Pol II into gene bodies, is likely due to the loss of NELF from a fraction of the stabilized elongation complexes. Our results show that the negative effects of NELF and DSIF on Pol II elongation are inhibited by H2O2 in vitro and decreases in NELF ChIP-Seq occupancy correlate with Pol II creeping. The creeping Pol II was present but less obvious in control cells due to the P-TEFb-mediated transition into productive elongation, which was unaffected by 0.3 mM H2O2. While the purpose of the transcriptional response to peroxide was not revealed by our studies, we speculate that stabilization of paused Pol II at promoters and enhancers could allow these sensitive regions to remain in an open configuration until the oxidative insult is neutralized. In this way, the pattern of gene expression could be ‘remembered’ to facilitate recovery, which takes about an hour as H2O2 is cleared from cells.
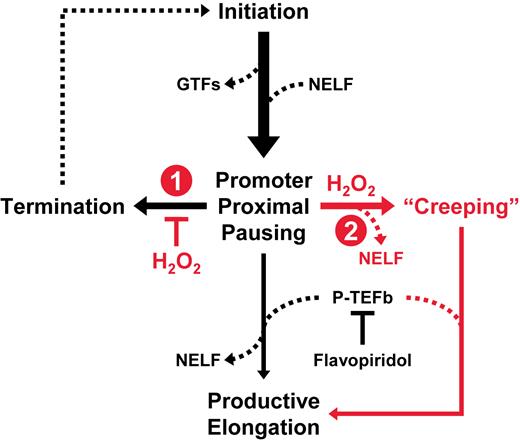
Mechanistic model of the rapid and global transcriptional response to H2O2. Illustrated are the key events Pol II transcription normally (black) or after exposure to oxidative stress (red). We propose that H2O2 (1) inhibits turnover of paused elongation complexes and (2) induces loss of NELF association and pausing activity.
Our model suggests that termination of paused Pol II may be quite rapid under normal conditions. In the presence of flavopiridol, the rates of initiation and termination must be equal to maintain a steady state level of paused Pol II. If we assume termination is rapidly and fully blocked by H2O2, increases in engaged Pol II signal must be from new initiation and if this rate is steady during the first minute of insult, we can infer the rate of termination. Notably, this turnover rate would be higher if termination is incompletely inhibited by H2O2. Because engaged promoter-proximal Pol II doubled in about 40 s after H2O2 exposure, we believe that most paused elongation complexes are replaced by new initiation in the same period of time. As only ∼1 in 90 polymerases makes it to productive elongation normally (50) and because we observed similar peroxide-induced increases in engaged Pol II with or without flavopiridol, we also suspect that P-TEFb has little influence on this turnover rate. Over time, the rate of initiation must also decline due to reduced levels of free Pol II, as most Pol II in the cells is engaged after 10 min of H2O2 (see Figure 6E). As peroxide is removed from the cell, termination is restored and new initiation can resume, resulting in normally-positioned paused Pol II reappearing 20–50 min after treatment.
There is a significant discrepancy between the turnover rates of paused Pol II derived from our results (under a minute) and those of four groups have used triptolide (49) to block initiation and follow the decay of paused Pol II (10–13). They calculated half-lives ranging from 5 min to more than an hour. However, as we demonstrated in Figure 6C, inhibition of initiation by triptolide is concentration- and time-dependent in vitro. In cells, the effect of triptolide is likely slower and more incomplete and this would lengthen the calculated half-lives. Using a 1 h treatment of human cells with 125 nM triptolide (which we predict would poorly inhibit initiation), Chen et al. concluded that the pause time was variable and that Pol II on many genes was completely stable. Jonkers et al. used 500 nM triptolide on mouse ES cells and concluded that the half-life of paused Pol II was variable with a mean of 6.9 min. Henriques et al. used 10 μM triptolide and found the rate at which tssRNA and Pol II ChIP signals in a Drosophila cell line disappeared from promoters depended on gene activity. Highly expressed genes had more rapid turnover (t1/2 of ∼5 min) than genes experiencing less productive elongation (t1/2 of >10 min). In a recent analysis of Drosophila cells treated with 500 μM triptolide, Shao and Zeitlinger (13) also found a broad range of half-lives across genes with most between 5 and 20 min, but with many much longer. In addition to issues with the rate of inhibition of XPB by triptolide, which has not been determined for Drosophila XPB, it was recently demonstrated that XPB is not required for initiation (51). We believe that previous estimates of the half-life of paused Pol II based on the effects of triptolide should be viewed with caution. That said, very recent findings utilizing single molecule footprinting in Drosophila cells treated for short times with 10 μM triptolide provided evidence of very short paused Pol II half-lives on nearly half of the genes studied (52). Also consistent with our findings, they found that paused Pol II was transiently engaged even in the presence of flavopiridol.
A reasonable reinterpretation of a study using fluorescently tagged Pol II and fluorescent recovery after photobleaching (FRAP) in live cells supports our model for rapid turnover of paused Pol II. Darzacq et al. found three sequential, kinetically-distinct states for Pol II on an integrated reporter gene (50). The first state was short-lived (6 s) and assigned to brief interactions of Pol II with the promoter. The second and most abundant state (39%) had an average residence time of 53 s. The final, longest-lived component (∼500 s) was sensitive to DRB, a P-TEFb inhibitor, and attributed to productive elongation. We hypothesize that the second component corresponds with promoter-proximal pausing. The FRAP-measured residence time of these paused polymerases (53 s) is in close agreement with our estimated time to replace all paused Pol II (∼40 s). Importantly, the residence time of this second component was not DRB-sensitive, which matches our observed Pol II accumulation rates after H2O2 with or without flavopiridol. If Pol II pausing represents a balance between rapid initiation, termination, and occasional entry into productive elongation, then the absolute position of paused Pol II at steady state will be affected by this balance. This would explain the small increase in length of promoter-proximal nascent transcripts after flavopiridol treatment seen here and in Drosophila cells (10).
Knockdown of factors involved in termination and productive elongation have been shown to cause Pol II creeping. TTF2 is a dsDNA translocase that plays a major role in termination of transcription during mitosis (53,54). The Bentley lab found that TTF2 occupancy peaked near transcription start sites and that lentivirus-driven knockdown of TTF2 shifted promoter-proximal Pol II downstream (55). Although we did not see a significant effect of knocking down TTF2 on paused Pol II (data not shown), HeLa cells have much more TTF2 than Pol II and only a small fraction is found in the nucleus during interphase transcription (53). Knockdown of PAF1 complex subunits also resulted in downstream shifts of promoter-proximal polymerases (56,57). This effect was P-TEFb-dependent (56) and occurred primarily at expressed genes where NELF would normally be removed by P-TEFb-mediated phosphorylation of DSIF and replacement with the PAF1 complex (58,59). Depletion of Integrator, another elongation factor complex (60), resulted in Pol II creeping at active enhancers (61). The cumulative effects of inhibiting termination, which prolongs Pol II engagement, and disrupting normal factor exchange could explain why creeping is so prevalent after treatment with H2O2.
The rapid nuclei isolation and nuclear walk-on techniques described here should prove useful in future studies aimed at examining promoter-proximal pausing by Pol II as well as accurately determining the position of Pol II within gene bodies. The gel assay provides only a semi-global average of paused Pol II but it is highly quantitative and allows comparison of pausing under 6–8 different cellular treatments in a single experiment. Because the rapid introduction of EDTA during the nuclear isolation (within 20 s) preserves the native occupancy of Pol II, this method enables the examination of rapid transcriptional events. Coupled with PRO-Seq, a highly accurate picture of where Pol II is found across the genome was obtained. This is especially true for Pol II that is moving at 4000 nt/min during productive elongation. Finally, in results not shown here, we have found that the nuclei will support initiation of transcription when incubated with nuclear extract, which should enable the use of these nuclei as native chromatin templates.
ACCESSION NUMBERS
Both raw data and derived browser tracks for all ChIP-Seq and PRO-Seq datasets can be obtained from GEO (GSE100742).
SUPPLEMENTARY DATA
Supplementary Data are available at NAR Online.
ACKNOWLEDGEMENTS
We thank the NVIDIA Corporation for donating a Tesla K40c graphics accelerator, and Donal Luse for critical reading of the manuscript.
FUNDING
National Institutes of Health (NIH) [R01-GM35500, R01-GM113935 to D.H.P.]; University of Iowa Presidential Graduate Fellowship (to K.A.N.); Department of Veterans Affairs Merit Award [1BX001107 to J.L.M.]. Funding for open access charge: NIH.
Conflict of interest statement. None declared.
REFERENCES
Author notes
These authors contributed equally to this work as first authors.

Comments