


Abstract
The spliceosome is the extremely complex macromolecular machine responsible for pre-mRNA splicing. It assembles from five U-rich small nuclear RNAs (snRNAs) and over 200 proteins in a highly dynamic fashion. One important challenge to studying the spliceosome is simply keeping track of all these proteins, a situation further complicated by the variety of names and identifiers that exist in the literature for them. To facilitate studies of the spliceosome and its components, we created a database of spliceosome-associated proteins and snRNAs, which is available at http://spliceosomedb.ucsc.edu and can be queried through a simple browser interface. In the database, we cataloged the various names, orthologs and gene identifiers of spliceosome proteins to navigate the complex nomenclature of spliceosome proteins. We also provide links to gene and protein records for the spliceosome components in other databases. To navigate spliceosome assembly dynamics, we created tools to compare the association of spliceosome proteins with complexes that form at specific stages of spliceosome assembly based on a compendium of mass spectrometry experiments that identified proteins in purified splicing complexes. Together, the information in the database provides an easy reference for spliceosome components and will support future modeling of spliceosome structure and dynamics.
INTRODUCTION
Pre-mRNA splicing is carried out by the spliceosome, which is one of the cell's most complex and dynamic molecular machineries (1). The spliceosome assembles on each intron to be spliced from over 200 individual components (2–4). Many of these components join the spliceosome in subcomplexes, the most well known of which are the U small nuclear ribonucleoproteins (snRNPs). U snRNPs contain structured U-rich small nuclear RNAs (snRNAs) along with seven shared and several unique proteins. Assembly of U snRNPs and other proteins into the spliceosome is modeled as an ordered evolution of intermediate splicing complexes originally designated as E (early), A (pre-spliceosome), B (fully assembled) and C (catalytic). However, as new conformations of the spliceosome have been identified, additional intermediate splicing complexes (e.g. Bact and B*) have been added to the assembly pathway (3,4). Likely, many more intermediate conformations of the spliceosome remain to be characterized.
The intermediate splicing complexes vary significantly in their composition, size and arrangement of components. Over the past 15 years, several research groups have used mass spectrometry peptide sequencing (MS/MS) to identify proteins that associate with different intermediate splicing complexes and subcomplexes (5–40). Each study generated lists of dozens to hundreds of proteins, and comparisons between the lists provide insight into how the spliceosome evolves between earlier and later assembly stages (2–4). For example, A complex contains U1 and U2 snRNPs and proteins involved in early recognition of the splice sites, whereas C complex contains U2, U5 and U6 snRNPs and proteins involved in promoting the second step of splicing chemistry. At different assembly stages, the spliceosomes’ composition can change by well over 50 proteins, which is certainly too many for a simple mental map of the complex. The MS studies covered splicing complexes from a wide variety of species including humans, yeasts, flies and parasites. In comparing spliceosome-associated proteins between organisms, we can begin to delineate a conserved core splicing machinery, as well as potentially interesting species-specific elaborations. However, given the large number of proteins associated with the different splicing intermediate complexes and their subcomplexes, these comparisons can be challenging.
Another difficulty with comparing lists of proteins from different MS experiment is different nomenclatures. For example, while genetic studies in Saccharomyces cerevisiae have been particularly important in characterizing proteins that function in splicing, only a subset of protein orthologs share the same name between yeast and humans. Furthermore, many proteins have commonly used historical names and/or multiple aliases that differ from the official gene names that have been designated by genome consortiums. One example is a subunit of the SF3a subcomplex of U2 snRNP, which was reported in different MS experiments as SAP 62, SF3a66, SF3A2 or Prp11. Another example is a Prp19 complex protein that has gone by a variety of names, including Syf1, XAB2, HCRN, Cwf3 and Ntc90. With this myriad of names, it is nearly impossible to make a straightforward comparison of the different MS analyses of splicing complexes reported in the literature.
We designed the Spliceosome Database (SpliceosomeDB) with these issues in mind. It provides a simple web interface to search for spliceosome genes/proteins based on several characteristics including name(s), complex designation, identification in particular MS experiments, source organism and conserved motif/domain signatures. For each gene/protein we provide links to other databases that have amassed a great deal of additional data including links to literature, post-translational modifications, etc. Orthologous genes in several model systems are also linked. Other key features include tools for users to compare composition of different intermediate splicing complexes across several species and to directly examine the lists of proteins identified in different MS experiments. The database is a ready resource for researchers looking for information on individual spliceosome components and provides a uniquely helpful view of the dynamic assembly process of the complex.
DATABASE FEATURES
Currently, there is no simple way to query comprehensive gene and protein databases [such as Entrez (41), Ensemble (42) or UniProt (43)] to identify proteins by their association with spliceosomes exclusively. This situation makes it impossible to easily identify spliceosome proteins with specific characteristics or by their association with specific intermediate complexes. For example, a search of the Entrez gene database with “spliceosome ‘C complex’ ” yields only three gene results and a search for “spliceosome ‘B complex’ ” returns no hits, even though there are nearly 100 individual protein components in these splicing complexes. Likewise, it is not feasible to query within the group of spliceosome proteins by parameters such as molecular weight range, sequence motifs, domains and/or availability of structural information.
We established a database platform that mitigates these problems by cataloging spliceosome-associated components along with a variety of features. We entered components into the database based on one of the three criteria: (i) previous experimental evidence for a role in spliceosome function, (ii) homology to a known splicing factor and/or (iii) MS/MS identification of the protein product in isolated splicing complexes. Over 3600 genes/proteins from several model species, along with a variety of key attributes, are currently recorded in the system. To allow free access from all over the world, we developed a series of web pages to query the database and return useful information. In most cases, this information can be downloaded for further off-line analysis. We envision that investigators in the pre-mRNA processing field, in particular, will utilize SpliceosomeDB for a variety of applications. In the following sections, we outline the functionalities of different database tools and their potential uses.
Searching for spliceosome components
From the ‘Component Search’ page of SpliceosomeDB, users can perform a quick general search of spliceosome components and their attributes or a more defined query of specific individual attributes (Figure 1A). Searchable attributes include protein and gene names and aliases, accession numbers in external databases, host organism, features of the gene’s protein product such as molecular weight and conserved motifs, association with a specific snRNP or intermediate splicing complex and membership of a general protein class or family. To designate intermediate splicing complexes, we use the common E, A, B, Bact, C complex nomenclature associated with spliceosomes that assemble in human extracts. The general ‘class/family’ heading groups proteins by molecular features (e.g. SM proteins, SR proteins), association with stable spliceosome subcomplexes like the snRNPs or PRP19 complex, or other common designations (e.g. hnRNP, second step factor).
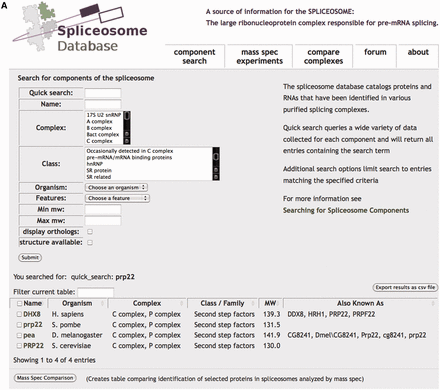
Spliceosome ‘Component Search’. (A) Quick Search queries all SpliceosomeDB data, whereas additional parameters can be used to limit results. The search results in a table showing matching components that can be further refined using the ‘Filter current table’ tool or sorted by columns. Gene/protein names are linked to a page displaying additional information about the gene/protein. Checkboxes can be used in conjunction with the ‘Mass Spec Comparison’ button to generate a table showing MS experiments in which the selected proteins were identified. (B) Portion of browser view displaying individual gene/protein information linked to additional sources of information. At the bottom of the page, MS experiments identifying the protein are listed along with the number of unique peptides by which the protein was identified.
Searches result in a list of genes that match the requested parameter, and if requested, their orthologs in several model organisms. To help inspect the list, we also display basic information for the genes, including host organism, complex association, molecular weight and aliases, any of which can be sorted or filtered. Importantly, gene lists can be exported to a spreadsheet file that includes many of the individual attributes recorded in the database.
Information for individual spliceosome genes/proteins
Each gene in a search results list is linked to a page that summarizes key attributes that fall under the headings of ‘Nomenclature’, ‘Other Resources’ and ‘Gene Product Info’ (Figure 1B). ‘Nomenclature’ includes an official gene symbol, other gene symbols, full protein name and other names, all of which have been obtained from a wide variety of sources. For ‘Other Resources’, we provide links to several external databases including the NCBI Entrez gene database (41), UniProt protein database (43), applicable model organism-specific databases like FlyBase (44) or SGD (45), BioGrid interaction database (46), the Protein Data Bank (47,48) and SpliProt3D database of human spliceosome protein structural models recently generated by the Bujnicki Laboratory (49). ‘Gene Product Info’ includes molecular weight, domains, motifs, association with different intermediate splicing complexes or snRNPs and general classification.
The page also displays a list of orthologous genes from a number of model systems. Because splicing is studied in several model organisms, it is often helpful to connect gene/protein orthologs, especially given the different naming systems employed. For most genes, we used the NCBI Homologene database (50) to identify orthologous genes. We also link orthologs to their corresponding gene page in our database and to the gene family entry in Homologene. Because Homologene does not fully cover all genes or organisms, we curated several database entries manually based on BLAST searches and extant literature.
Many pages for human genes also display a table of curated protein/protein interactions from the recent publication by the Stelzl group and recorded in SPPIR (Human Spliceosome Protein-Protein Interaction Resource) (51). The data from Hegele et al. (51) are derived from manual literature searches, directed yeast-two-hybrid analyses and co-precipitation experiments, and we provide links to the relevant data sources. There are other databases that provide interaction profiles for proteins, but we chose not to display these data because the interactions are not limited to spliceosome components and are not always well vetted. Often, many proteins not related to splicing appear in those lists, and although the interactions may indicate some functional linkage, they do not fully reflect what has been observed by biochemical purification and analysis of the core splicing machinery. As noted above, however, we do provide a link to BioGrid protein interaction database (46) for interested users.
Finally, each gene page displays a list of experiments in which the encoded protein (or ortholog) was identified, usually by MS, along with the number of peptides used to identify the protein in each experiment when reported. Each MS experiment is linked to its own page, which will be described in a following section.
Displaying and comparing spliceosomal complexes
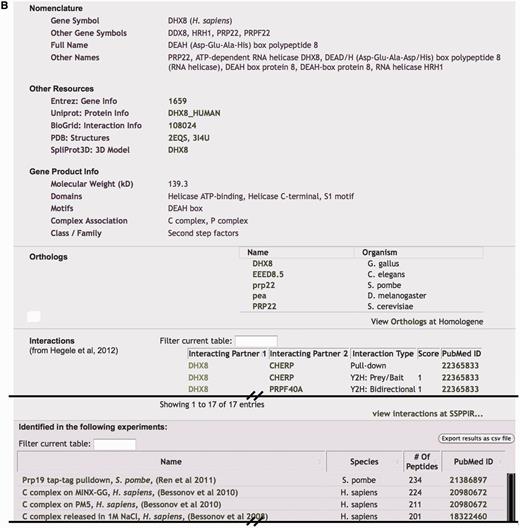
Because the spliceosome is a dynamic machine, it is important to understand its composition at the different stages of complex assembly. The point at which a component joins or leaves the spliceosome indicates a potential function in the complex. SpliceosomeDB makes it possible to quickly compare the components of different conformations of the spliceosome across several model species. From the ‘Compare Complexes’ page, comparisons can be made via curated component lists that we generated for different U snRNPs and spliceosome intermediate complexes. For these, we again use the complex nomenclature associated with spliceosomes that assemble in human extracts (i.e. E, A, B, Bact, B*, C). Users select two or more complexes and host organism, and the site will then generate a table where columns represent the selected complexes and rows display proteins present in those complexes, grouped by their general classification in the database (Figure 2). For comparisons between different organisms, orthologs are displayed in the same row. To designate proteins as belonging to a particular complex, we primarily drew from a recent publication by the Agafonov et al. (39). In that study a series of human splicing complexes were isolated under similar conditions. Associated proteins were separated by 2D electrophoresis and identified by MS/MS sequencing. The proteins were also quantified by direct staining in the gels. For each splicing complex designation, we include proteins that appear to be abundant as indicated by a high stain index. Because the association of proteins that have more dynamic interactions with the spliceosome is often not clearly stoichiometric, we also considered how consistently the proteins have been found in spliceosome complexes at a particular stage. One such example is the SF3B subcomplex, which appears less abundant in spliceosomes captured just prior and after first step chemistry (Bact and C complexes) but was detected nonetheless, and we therefore include its proteins as components of both of those complexes (13,19,21,39). For these general complex association lists, we did not include proteins that appear to associate with RNA in a splicing independent manner, such as many general RNA binding proteins.
Comparing the composition of spliceosome complexes. Portion of ‘Compare Complexes’ browser view displaying the components of selected complexes grouped by classification. Each component is linked to its individual information page.
MS analyses of spliceosome complexes
An ever-growing number of studies have reported MS/MS analyses of different spliceosome complexes and subunits (5–40). Indeed, these studies have gone far in helping to define the components of the spliceosome at different stages of assembly. In SpliceosomeDB, we recorded the results of over 135 individual MS experiments from 40 publications reporting analysis of endogenous splicing complexes isolated from cells or complexes assembled in vitro. The samples studied were derived from several different organisms, including human, chicken, fruit flies, yeasts and parasites. From this extensive effort by the wider splicing research community, a large portion of known splicing intermediate complexes and subunits are represented in the database. We expect that intermediates that have not yet been captured for detailed proteomic analysis will eventually succumb to analysis, and we will add those data as they are reported.
Through the ‘Mass Spec Experiments’ page users can find specific experiments that are identified by sample type, first author of the publication reporting the experiment or their lab head, year of publication and source organism (Figure 3A). For sample names, we use the reported assembly intermediate designation when applicable. Several samples represent less defined or mixed populations of spliceosomes, which we designated either as ‘mixed-spliceosomes’ or by the component target by which they were purified (i.e. ‘SMD3 pulldown’). A search from this page will produce a list of matching experiments that includes an internal SpliceosmeDB id number, basic information about the sample and associated publication, along with a PubMed link to the original publication. Each experiment is linked to its own page, which displays a list of genes encoding the proteins that were identified, each of which is then linked back to its individual gene information page and, when reported, the measure of confidence/quantification associated with that designation (Figure 3B). Typically, this measure is the number of unique peptides used to identify the protein, but may also refer to the total number of peptides sequenced from the protein or band intensity from gel staining analysis. For a subset of MS experiments, proteins were simply reported as present in a sample. In such cases, we use a filled box to denote the identification of the protein in the sample. To help parse the list, we also display some basic protein information including host organism, complex association, aliases and molecular weight. Again, as with most data returned by database searches, these results can be exported to a spreadsheet file.
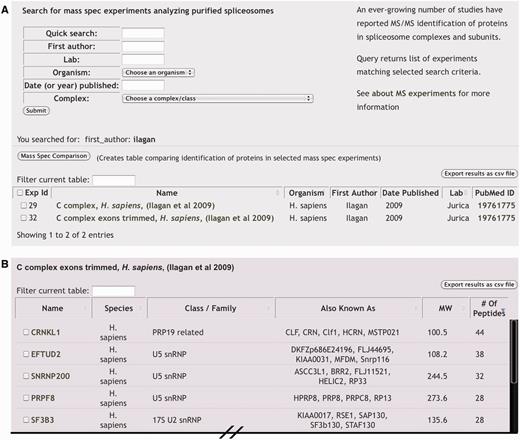
‘Mass Spec Experiments’ (A) MS experiments can be queried by a general ‘Quick Search’ or by specific attributes to return a list of matching experiments. Each experiment is linked to a page displaying the entire experimental results and to the PubMed entry of the corresponding publication. Checkboxes can be used in conjunction with the ‘Mass Spec Comparison’ button to generate a table comparing the results of the selected MS experiments. (B) Portion of browser view displaying an individual MS experiment result. Gene/protein names of identified proteins are linked to a page displaying additional information and the number of unique peptides by which proteins were identified is given.
Comparing MS experiment results
To allow users to compare results from several experiments, we created a ‘Mass Spec Comparison’ tool. Checkboxes are used to select a subset of genes or experiments returned from a search results returned by ‘Component Search’ or ‘Mass Spec Experiments’. The selected items are then returned in a new page as a exportable table of genes in rows versus MS experiments in columns (Figure 4). The number of identifying peptides listed (or filled box) designates that a gene’s protein product was identified in the experiment.
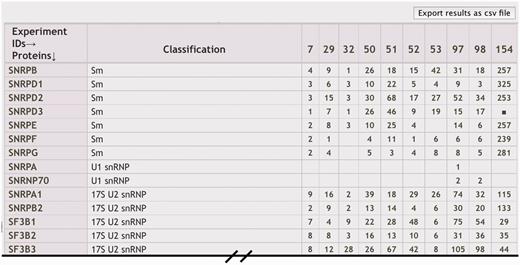
Comparison of MS experiment results. Generated with the ‘Mass Spec Comparison’ tool, columns in the comparison table display results of individual MS experiments, typically shown as the number of unique peptides used to identify the proteins represented in the different rows. Descriptions for each MS ‘Experiment ID’ are displayed in a legend and linked to individual experiment results.
Documentation, discussion forum and feedback
To help users with SpliceosomeDB, the ‘About’ page and associated links summarize features of the database components and available tools. Also in the different search forms, definitions and examples for many of the elements and fields appear when a cursor is held over them. A ‘comments/report a problem’ link is available for direct feedback, and we set up a forum for moderated discussion. We welcome any comments, questions and suggestions for new features. An active dialog with users will be important for us to identify and correct errors in the database and to keep information up to date.
DATABASE ARCHITECTURE AND WEB INTERFACE
SpliceosomeDB is backed by a MySQL relational database consisting of nine primary tables storing information for (i) individual genes/protein attributes, (ii) MS experiment details, (iii) MS results, (iv) designating protein orthologs, (v) spliceosome complexes, (vi) designating complex composition, (vii) protein classes, (viii) designating proteins to classes and (ix) taxonomy information for species represented in the database. The tables are linked as shown in Supplementary Figure S1. By leveraging relationships between tables, we have been able to cross-reference data in novel and informative ways. Data in Tables ii, iii and v–viii were entered manually. Most data in Tables i, iv and ix were downloaded from the NCBI Entrez Gene (41), UniProt (43) and NCBI Homologene (50) databases, with some attributes being manually curated.
Automatic maintenance and update is a key feature of the SpliceosomeDB. Scripts regularly populate information across database tables after the upload of new mass spectrometry experiments. Additionally, public database entries are checked for updates, with local copies stored as XML files in the event that the database schema changes, which seamlessly provides links to the previously mentioned resources. At this time, there are 3636 gene/protein entries from seven different organisms: Homo sapiens, Gallus gallus, Drosophila melanogaster, S. cerevisiae, Schizosaccharomyces pombe, Caenorhabditis elegans, Plasmodium falicparum, Leishmania major, and Trypanosoma brucei. We recorded results of 135 published MS analyses of various splicing related complexes and will add more as they are reported (5–40).
Web interface
A web interface for the database is located at http://spliceosomedb.ucsc.edu. The interface is built using the Django web framework with Apache serving pages. Django follows the Model, View, Template (MTV) framework of development. Data is stored in MySQL, defined by its representation (Model or schema), accessed by Python scripts called views (View) and rendered into HTML templates (Template) to be displayed through web browsers.
DISCUSSION
To aid studies of the spliceosome, which is one of the most complicated macromolecular machines in eukaryotic cells, we have established an important information source freely available to the public. Our goal was not to replicate the information already available in other databases for spliceosome components, but instead was to create a tool for navigating the complexities of spliceosome assembly dynamics and nomenclature with easy access to other information sources. To that end, SpliceosomeDB is organized from two primary perspectives: (i) information pertaining to specific spliceosome components and (ii) grouped results of mass spectrometry analysis of splicing-related samples. By allowing for cross-reference of information from these perspectives, SpliceosomeDB offers a unique and powerful tool for exploring spliceosome structure and dynamics.
Our lab has been using an in-house form of this database for several years to compare and interpret long lists of MS analyses of spliceosome complexes. From the first MS analysis of human C complex spliceosome, we identified many proteins with homologs in yeast for which genetic and biochemical studies established roles in spliceosome functions (11,18,19). However, many additional proteins with no clear ortholog in S. cerevisiae were also associated with human spliceosomes. Whether these proteins have a role in the spliceosome or were contaminants in our preparation was not known. By comparing results across several experimental systems, it was clear that a number of these proteins are consistently identified with splicing complexes and thereby have a higher likelihood of being bona fide splicing factors.
Comparisons of MS results have also been important for understanding the dynamics of spliceosome assembly and function. Differences in the composition of spliceosomes arrested at different stages of assembly likely reflect the joining and leaving of components to and from the complex, which may suggest when they function in the spliceosome. With SpliceosomeDB, other researchers are able to easily make such comparisons across a larger number of MS studies, with the ability to focus on genes of their particular interest.
One caveat of the MS data is that they are not strictly quantitative, which is to say that all proteins reported to associate with a given complex are not necessarily stoichiometric. Some clue to the relative abundance of a given protein in a complex can be derived by the number of unique peptides used to identify the protein, which a higher number indicating significant representation of the protein in the sample. However, peptide numbers also depend on protein size, with larger proteins yielding more peptides than smaller peptides. The total amount of samples analyzed and the sample complexity, also significantly affect the number of peptides sequenced for a given protein. Therefore, it is important to look at the MS data across an entire experiment to get a feel for the number of peptides that indicate likely stoichiometric presence of a protein. In that same vein, one cannot directly compare peptide numbers from different experiments, so again looking at data en masse is key to making judgments about the relative abundance of proteins. Fortunately, SpliceosomeDB makes it possible to display the entire data from MS experiments to provide this context.
Finally, SpliceosomeDB is useful as an organizational tool to keep track of the hundreds of spliceosome proteins and quickly find them by a number of key features. For example, we needed the list of spliceosome C complex components that are in a particular molecular weight range. Without the database, answering that question would have been very time-consuming, but with SpliceosomeDB, a straightforward query immediately returned the desired list. Furthermore, ready access to gene, protein and homolog information advances discussion with other researchers in, for example, recalling the name of a yeast homolog or association of a protein in at particular stage of spliceosome assembly. We expect that other scientists in the splicing community and beyond will also find the database useful in propagating their own studies and conversations.
Looking toward the future, we will continue to add MS data to SpliceosomeDB as they are published and plan to record additional attributes for MS experiments, such as the details of purification conditions used in isolating the samples analyzed. We welcome feedback and requests for additional features. For example, based on user input, we are currently gathering interaction data for yeast proteins including genetic interactions. SpliceosomeDB is, and will continue to be an important resource for researchers studying this complicated cellular machine.
FUNDING
Funding for open access charge: National Institutes of Health [5R01GM72649 to M.S.J.].
Conflict of interest statement. None declared.
ACKNOWLEDGEMENTS
We thank Roger Jungemann and Denise Playdle for aid in designing database architecture and graphics, and members of the Jurica lab for discussion and testing.

Comments