


Abstract
The enrichment of duplicate genes, and therefore paralogs (proteins coded by duplicate genes), in multicellular versus unicellular organisms enhances genomic functional innovation. This study quantitatively examined relationships among paralog enrichment, expression pattern diversification and multicellularity, aiming to better understand genomic basis of multicellularity. Paralog abundance in specific cells was compared with those in unicellular proteomes and the whole proteomes of multicellular organisms. The budding yeast, Saccharomyces cerevisiae and the nematode, Caenorhabditis elegans, for which the gene sets expressed in specific cells are available, were used as uni and multicellular models, respectively. Paralog count (K) distributions [P(k)] follow a power-law relationship [P(k) ∝ k−α] in the whole proteomes of both species and in specific C. elegans cells. The value of the constant α can be used as a gauge of paralog abundance; the higher the value, the lower the paralog abundance. The α-value is indeed lower in the whole proteome of C. elegans (1.74) than in S. cerevisiae (2.34), quantifying the enrichment of paralogs in multicellular species. We also found that the power-law relationship applies to the proteomes of specific C. elegans cells. Strikingly, values of α in specific cells are higher and comparable to that in S. cerevisiae. Thus, paralog abundance in specific cells is lower and comparable to that in unicellular species. Furthermore, how much the expression level of a gene fluctuates across different C. elegans cells correlates positively with its paralog count, which is further confirmed by human gene-expression patterns across different tissues. Taken together, these results quantitatively and mechanistically establish enrichment of paralogs with diversifying expression patterns as genomic and evolutionary basis of multicellularity.
INTRODUCTION
Multicellularity is a fundamental phenomenon in basic biological and biomedical researches. Evolutionary and genomics analysis of this phenomenon must take into consideration protein paralogy, homologous proteins encoded in the same genome. Paralogs result from genomic duplication events, sometimes duplication of the whole genome. Duplicate genes subsequently accumulate additional mutations. The major evolutionary advantage is the potential for the duplicate genes to acquire new functionality through these mutations, even though the mutations also lead to loss of duplicate genes, sometimes resulting in the formation of pseudogenes (1–4). This genetic duplication and subsequent diversification process is a major driving force of genomic evolution. Consequently, paralogs are abundant in genomes.
Moreover, paralog abundance is greater in the genomes of multicellular species, as there is a positive correlation between paralog abundance and organism complexity (5). Paralogs are observed to be more abundant in eukaryotic than in prokaryotic genomes due to higher rates of gene duplication. They are further enriched in multicellular species due to higher retention rates of duplicate genes (5). Even though all the genes are encoded in the same genome in a multicellular organism, different sets of genes are expressed in different developmental stages and in different cell types. It is generally believed that diversification of tissue/cell distribution patterns of paralogous proteins is vital for evolutionary emergence and maintenance of multicellularity (6,7). However, a concise quantitative framework to describe, and to explain, the relationship between paralog enrichment and multicellularity remains yet to be developed.
The genome is, on the other hand, often referred to as the ‘book’ of life. One obvious reason is that it consists of simplistic strings created from a restricted alphabet (A, T, C and G), just as an English book is composed of linear strings of the 26-letter English alphabet. Perhaps not coincidentally, in early days of bioinformatics, linguistics analysis techniques, such as the ‘hidden Markov models’ (HMMs) modeling method, were integral to the development of biological sequence analysis approaches (8). And we use another parallel between genomic sequences and English language to help introduce an important concept for this study, power-law distribution. A well-known phenomenon in linguistics is the Zipf’s law, which states that the word count (K) distribution [P(K)] in English literature follows a power-law distribution [P(K) ∝ K−α]. The power-law distribution turned out to be common in biology as well. Examples include the distribution of connectivity in biochemical networks (9,10), protein domain counts as well as the number of times two domains co-occur in a protein (11,12). A comparative study of biological sequences and English literature found that protein domain counts in the yeast S. cerevisiae follows a similar power-law distribution as English word counts (13). Additionally, the power-law distribution was found, in 1998, to apply to paralog counts in bacterial and the yeast S. cerevisiae (14). We were interested in testing whether the power law applies to paralog counts in multicellular genomes as well, effectively treating paralogs as biological equivalent of multiple occurrence of a word in the literature. We were further interested in testing whether the power-law distribution provides a concise quantitative framework to quantify and explain paralog enrichment in multicellular species.
The nematode Caenorhabditis elegans and the yeast Saccharomyces cerevisiae proteomes have been sufficiently characterized so that it is now possible to get comprehensive lists of all of their protein coding sequences. Additionally, gene sets that are expressed in specific cells in C. elegans have been reported (15,16) and successfully used in biochemical network research (17), thus providing a model system to test differential expression patterns across different cell types as a genomic mechanism for enrichment of paralogs in multicellular species. Caenorhabditiselegans and S. cerevisiae were therefore chosen in this study as models for multi and unicellular species, respectively. All-against-all BLAST searches were performed for the proteomes of C. elegans and S. cerevisiae, respectively, to identify paralogous protein pairs in the respective proteomes. The paralog count (K) distribution [P(K)] was found to follow a power-law relationship [P(K) ∝ K−α]. The value of the exponent constant α was then used as a gauge of paralog abundance in subsequent analysis of the relationship among paralog enrichment, paralog expression pattern diversification and multicellularity.
MATERIALS AND METHODS
Proteome sequences
Proteome sequences for the yeast S. cerevisiae were downloaded from the S. cerevisiae Genome Database (SGD) (18,19). Open reading frames (ORF) annotated as dubious ORFs were eliminated from the dataset. Translated protein coding sequence data for C. elegans were retrieved from the WormBase database (20). Proteomic sequences include both confirmed and predicted ORFs. Human proteome sequences were downloaded from the NCBI RefSeq database (21).
List of specific C. elegans cells and retrieval of their gene-expression data
This study needed to use gene-expression data of homogeneous cell populations. We chose the gene-expression data from the Genome BC C. elegans Gene Expression Consortium (http://elegans.bcgsc.bc.ca/) in Canada (15). The data was generated with the serial analysis of gene-expression (SAGE) technique (22). The resource provides data for tissue and cell types as well as developmental stages. Data for different developmental stages was not used, because a development stage represents a mixture of multiple tissue and cell types. The goal of this study is to study genes expressed in specific cell types or highly homogeneous populations.
The C. elegans cells whose gene-expression datasets were retrieved for this study are listed in Table 1. A total of 12 gene-expression datasets were selected, representing cells of eight functional categories. With the exception of the gonad cells, the cells were isolated using the Fluorescence Activated Cell Sorting (FACS) technique.
Caenorhabditis elegans cells whose gene-expression datasets were used in this studya
| Cells | Functional category | Collection method | α-value | α-value, ASb not considered |
|---|---|---|---|---|
| Gonad | reproduction | dissection | 2.41 | 2.38 |
| AFD neurons | neuronal | FACS | 2.28 | 2.25 |
| ASER neurons | neuronal | FACS | 2.17 | 2.24 |
| Cilia | neuronal | FACS | 2.31 | 2.43 |
| Pan neurons | neuronal | FACS | 2.37 | 2.33 |
| Motor neurons | neuronal | FACS (punc4:GFP) | 2.18 | 2.24 |
| Hypodermal cells | hypodermis | FACS | 2.14 | 2.16 |
| Muscle cells | muscle | FACS | 2.43 | 2.55 |
| Pharyngeal marginal cells | connective | FACS | 2.23 | 2.22 |
| Pharyngeal gland cells | excretive | FACS | 2.2 | 2.33 |
| Pharynx | digestive | FACS | 2.15 | 2.19 |
| Gut | intestine | FACS | 2.39 | 2.38 |
aThey are used because gene-expression data has been released for them by the Genome BC C. elegans Gene Expression Consortium (http://elegans.bcgsc.bc.ca/).
bAlternative splicing.
BLAST-based paralog identification and visualization of power-law distributions
First, an all-against-all protein BLAST was performed for the S. cerevisiae proteome using an E-value threshold of 1E − 30. The stand-alone BLAST+ program was used (23). This stringent threshold matches only proteins with high alignment scores, ensuring that only well aligned sequences with extensive homology are counted as paralogs. After parsing this data, the number of paralogs, K, was calculated for each protein. Proteins are binned, with a bin size of 2, based on their paralog counts. The number of proteins in each bin [P(k)] was counted. A linear log–log plot {log[P(k)] versus log(k)} was created with this data to facilitate the visualization of the power-law distribution; a linear relationship is expected. Changing bin size did not disrupt linearity of the log–log relationships observed in this study. Next, the same procedure was performed for the whole C. elegans and human proteomes, respectively. For individual C. elegans cell types, the procedure was similar. But paralogs were counted using only the subset of genes expressed in the corresponding cell types. All data were processed using the Perl scripting language.
Quantification of gene expression-level fluctuation across different cell types
The CV value, calculated as above, was then used as a fluctuation score to quantify how much a gene’s expression level fluctuates.
RESULTS
The power-law relationship applies to paralog count distribution in both S. cerevisiae and C. elegans, and the value of α is a gauge of paralog abundance
The protein domain distribution in the yeast S. cerevisiae, as discussed earlier, has been reported to follow the power law (11–13). Paralogs usually share common domains, and paralog count distribution has been shown to follow power law (14). We therefore expected the power law applies to paralog count distribution computed using our approach as well. An all-against-all BLAST was performed for the S. cerevisiae proteome to identify paralog pairs (19 886 pairs identified). The paralog count of each protein, K, was then calculated. A log–log scatter plot of K versus the number of proteins with this many paralogs is shown in Figure 1. As expected, the data fit into a linear relationship with a slope value of 2.34. Thus, the paralog count distribution follows a power law, P(K) ∝ K−2.34.
![Paralog count distributions follow power law in the yeast S. cerevisiae and the nematode C. elegans. Paralog count for each sequence was calculated as the respective hit count in all-against-all BLAST of S. cerevisiae or C. elegans proteomes. The log[P(K)] − log(K) plots of the data, as well as the line and equation of linear regressions, are shown for both species. See ‘Materials and Methods’ section for detail. S. cerevisiae data points were shifted upward to overlap the leftmost data points of the two species, in order to better illustrate difference in the slopes (α-values). Inset. Log[P(K)] − log(K) plots of S. cerevisiae and C. elegans based on Ensembl paralog data. Pair-wise paralog relationships were downloaded from Ensembl, and paralog count for each gene was then calculated. S. cerevisiae data points were shifted upward to overlap the leftmost data points of the two species.](https://oup.silverchair-cdn.com/oup/backfile/Content_public/Journal/nar/40/16/10.1093/nar/gks464/2/m_gks464f1.jpeg?Expires=1716392436&Signature=ToikVrv7Zn09JK-rxQ~vlO~VuB33z1u84DtFbhwjLNNRDKPMvaWhLgWaBGo45XcRZfKnjYbSTqq1lyws1Jj9BWspwqi6-Ixc10ciwvpDA-3Cgh5FIrjM4hCVmH9TUFDJe7Uo-6rfFVdy6X0xhcHfpey2SSRPXSIrkbg8kjHzj1-Qg~d5gT3KwsBPOY9UqzdF1hQqAUWBotvegjjzcc0fROcZdiThTUZgH8TnFRoYnCMQqrz-A8q91Xqz2bqjYFjwtTneA7JVwZujn~QK9-EAwhcFtEAa~dbzin34SeV5efdcNFWFjJuUGacl9YsjvvrqHPC-FPcnAyaq9WAkQ0OBoA__&Key-Pair-Id=APKAIE5G5CRDK6RD3PGA)
Paralog count distributions follow power law in the yeast S. cerevisiae and the nematode C. elegans. Paralog count for each sequence was calculated as the respective hit count in all-against-all BLAST of S. cerevisiae or C. elegans proteomes. The log[P(K)] − log(K) plots of the data, as well as the line and equation of linear regressions, are shown for both species. See ‘Materials and Methods’ section for detail. S. cerevisiae data points were shifted upward to overlap the leftmost data points of the two species, in order to better illustrate difference in the slopes (α-values). Inset. Log[P(K)] − log(K) plots of S. cerevisiae and C. elegans based on Ensembl paralog data. Pair-wise paralog relationships were downloaded from Ensembl, and paralog count for each gene was then calculated. S. cerevisiae data points were shifted upward to overlap the leftmost data points of the two species.
We next tested whether the power law applies to paralog count distribution in C. elegans, and if this relation can be used to quantify paralog enrichment in C. elegans relative to S. cerevisiae. Therefore, an all-against-all BLAST was performed for the C. elegens proteome to identify paralog pairs (151 469 pairs identified), followed by calculation of paralog count for each protein. The log–log scatter plot is shown in Figure 1 together with that of S. cerevisiae. Once again, the data exhibited a linear relationship, but with a lower slope value of 1.78. Thus, although the paralog count distribution in C. elegans also obeys a power law, P(K) ∝ K−1.78, the value of α is lower than that observed in S. cerevisiae.
The proteome of C. elegans, as multicellular proteomes in general, contains proteins translated from alternatively spliced forms of mRNA from the same genes. However, we currently cannot claim to have a complete collection of all alternative-splicing events in C. elegans and other multicellular species yet. To investigate whether this incomplete coverage of alternative splicing has an effect on the power-law distribution, we excluded alternative spliced forms from our analysis, that is, only one splicing isoform, isoform a as annotated in wormbase, was included in this analysis. This has no effect on the distribution; the value of α became 1.74, remaining essentially the same (data not shown). We therefore concluded that the power-law distribution in C. elegans has a lower α-value than that in S. cerevisiae. This difference in α-value is further confirmed by analyzing independently identified paralog sets, those identified in the Ensembl database. We downloaded S. cerevisiae and C. elegans paralogs from Ensembl BioMart (http://www.ensembl.org/info/data/biomart.html) and created the log–log plots. As shown in Figure 1 inset, the C. elegans log–log plot has a lower slope, and thus a lower α-value, than the S. cerevisiae log–log plot.
The power-law relationship [P(K) ∝ K−α] means that, as paralog count K increases, the fraction of the proteome with K paralogs P(K) decreases dramatically. A lower value of α indicates that P(K) decreases at a slower pace as K increases, and therefore dictates higher paralog abundance. Furthermore, our result is consistent with the observation by Wuchty that the values of α in the power-law distributions of the number of times for two domains to co-occur within the same proteins is lower in multicellular proteomes than in unicellular proteomes (12). The value of α thus correctly gauges paralog enrichment in C. elegans relative to S. cerevisiae, and was used as a gauge of paralog abundance in the rest of this study.
The proteomes of individual cell types display paralog abundance, as measured by the value of α, comparable to that of the yeast S. cerevisiae
Members of a gene family often display complementary expression patterns. In other words, they often do not coexpress in the same cells. A specific cell type might express only a portion of a gene family, leading to lower paralog abundance in the cells relative to the whole proteome of a multicellular organism. We are therefore interested in whether this can be investigated in a quantitative manner. To achieve this task, we need gene-expression datasets for a spectrum of specific cell types, often termed gene-expression atlas. Fortunately, the sets of expressed genes have been published for a wide collection of C. elegans cells (15,16), providing an ideal system to accomplish this task. To our knowledge, this is the best dataset generated from specific cell types. Other datasets, such as the bovine gene-expression atlas (24), were always generated using whole tissues, which are mixture of many distinct cell types instead of homogeneous cell populations.
A total of 12 of the C. elegans gene-expression datasets, as discussed in ‘Materials and Methods’ section, were used in this study (Table 1). Many of them represent specific cell types. Additionally, C. elegans gonad and gut, even though whole organs, are comprised of highly homogeneous cells. All gonad cells originate from two cells, Z1 and Z4, in L1 larva stage; all gut cells are epithelial cells and derive from a single progenitor cell, such that the clonal proliferation of one cell constitutes the whole organ (25). Thus, the cells whose gene-expression datasets were used in this study represent either specific cell types or highly homogeneous cell populations. These cell populations will be referred to, for the sake of convenience, as cell types in the rest of this paper with one exception—the pharynx; the C. elegans pharynx is comprised of a number of different cell types. However, gene-expression datasets of two of them—the pharyngeal marginal and gland cells—were also used in this study (Table 1). Inclusion of the whole pharynx data, as discussed below, helped with interpretation of our analysis results.
It was expected that individual C. elegans cell types expressed only a portion of all members of a large paralog family; as discussed above, paralogs often display complementary expression patterns and do not coexpress in the same cell. Therefore, each individual proteomes of the 12 cell types should have lower paralog abundance. We tested whether this can be quantified by changes in the value of the power-law parameter α.
In order for us to use the value of α, the power law needs to apply to paralog count distribution in the proteomes of specific cell types. As shown in Figure 2A and B, this is true in C. elegans cilia and gut proteomes. The proteomes of all other cell types gave the same results (data not shown). Strikingly, the values of α are higher for all cell types (Table 1). They fall within a tight range and were comparable to that of the S. cerevisiae proteome (Figure 2C). This is true regardless of whether alternative splicing is considered in paralog count calculation.
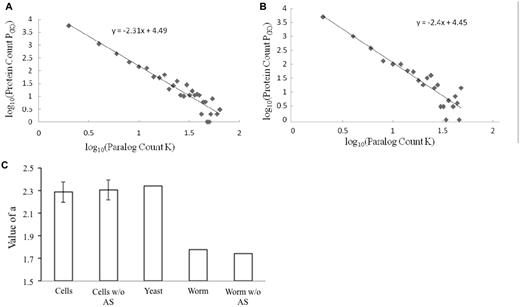
The proteomes of individual cell types display paralog abundance comparable to that of the yeast S. cerevisiae, as measured by the value of α. (A and B). The log–log plot of paralog count distributions in the proteomes of C. elegans cilia and gut, respectively, is shown. The lines and equations of the linear regressions are also shown in the graphs. (C) Comparison of the value of α of S. cerevisiae proteome and the average of those of the proteomes of specific C. elegans cell types. The bars are labeled as follows: ‘Cells’ denotes average α-values of the 12 C. elegans cell types; ‘Worm’ denotes α-value of C. elegans whole proteome; ‘w/o AS’ denotes α-values were calculated without consideration of alternative splicing; and ‘Yeast’ denotes α-value of S. cerevisiae proteome. The standard deviation of the α-values of the 12 C. elegans cell types was used as error bar.
The variation in values of α across different cell types awaits further investigation. One possibility is for it to be attributed to the fact that some cell types used in this study might be a mixture. This depends on how specific each promoter-GFP construct used in FACS technique is for the targeted cell types (15). The pharynx, as discussed above, consists of a number of different cell types. The value of α is therefore lower in the whole pharynx than those in the two specific cell types in pharynx—the pharyngeal marginal and the pharyngeal gland cells (Table 1). Another possibility is that it is due to intrinsic difference in the biology of different cell types. Hopefully, relevant single-cell transcriptom analysis dataset will become available soon for testing the two possibilities.
Diversification of paralog expression patterns
Compared with their counterparts in unicellular eukaryotic species, genes are often duplicated multiple times during multicellular genomic evolution. These duplicates, when retained, lead to expanded gene families. For example, most S. cerevisiae protein kinases have multiple paralogs in both plants and animals (26,27). On the other hand, paralog expression pattern diversification results in cell-specific expression patterns; the expression level fluctuates across different cell types. As discussed above, it also leads to lower paralog abundance in specific cell types.
We therefore examined potential relationships between C. elegans gene-expression level fluctuation and duplications of corresponding genes for orthologs to S. cerevisiae proteins. To get the gene duplication data, we downloaded the orthologous/paralogous groups between S. cerevisiae and C. elegans identified in the InParanoid database (28). We then eliminated C. elegans genes that were absent from the gene-expression dataset for the 12 cells summarized in Table 1. For each remaining gene, its expression levels in the 12 cell types were collected. CV, standard deviation normalized by mean expression level of the gene, was calculated. The CV value was used as the index to quantify how much the gene’s expression level fluctuates across the set of cell types (see ‘Materials and Methods’ section for detail). As shown in Figure 3A, the higher the paralog counts in the processed InParanoid orthologous/paralogous groups, the more the gene’s expression level fluctuates. If the proteins were not binned, calculated correlation coefficient between paralog counts and CV values was 0.2, with a P-value of 2.47E − 10. Genes with high paralog counts tend to be expressed in a cell-specific manner.

Relationship between gene duplication and expression level fluctuation in C. elegans (A) and human (B) Caenorhabditis elegans–S. cerevisiae and human–S. Cerevisiae orthologous/paralogous groups were downloaded from InParanoid database, and processed as described in text. Paralog count in each group, i.e. the number of C. elegans or human genes in the group, was used as a gauge of gene duplication activity during single to multicellular genomic evolution. Expression level fluctuation across the cells was quantified with the CV value as described in ‘Materials and Methods’ section. Average fluctuation of the genes in each bin was used to create the graph. Pearson correlation coefficient (r) between average paralog counts and average fluctuation scores in the bins are also shown in the graph. Without binning, the r-values for C. elegans and human are 0.2 (P-value 2.47E − 10) and 0.37 (P-value 1.9E − 93), respectively.
To test the generality of this phenomenon, we searched for relevant human gene-expression dataset. Fortunately, a gene-expression dataset across 10 human tissues were available (29). While not suitable for identification of proteomes of specific cell types, these tissue data met our goals of calculating expression level fluctuation. We downloaded the orthologous/paralogous groups between S. cerevisiae and human from the InParanoid database, and then eliminated genes that were absent from the human gene-expression data. For each remaining gene, CV (standard deviation normalized by mean expression level of the gene) was calculated as a measurement of how much its expression level fluctuates across the 10 human tissues. As shown in Figure 3B, the same trend was observed—the higher the paralog counts in the processed InParanoid orthologous/paralogous group, the more the gene’s expression level fluctuates. If the proteins were not binned, calculated correlation coefficient between paralog counts and CV values was 0.37, with a P-value of 1.9E − 93.
We also examined the pairs of paralogs with cell-specific expression patterns to see how much their expression patterns have diverged (Figure 4). Pearson’s correlation coefficient (r) is used to quantify the divergence; a high positive value of r indicates that the two expression patterns have not diverged yet; a value close to 0, or a negative value, indicates the two have completely diversified. We collected all C. elegans genes with a CV value (expression level fluctuation score) of 1.8 (∼85% quantile) or higher. Among these genes, we then calculated pairwise r-values for all pairs whose proteins belong to the same InParanoid orthologous/paralogous groups, i.e. paralog pairs. The result is shown in a scatter plot in Figure 4A. Their r-values are either close to 1 or close to 0, indicating the same or completely diversified expression patterns respectively. Figure 4A also shows the r-values of all gene pairs whose proteins have pair-wise BLAST E-values of 1E − 30 or better, regardless of whether they are included in the InParanoid orthologous/paralogous groups. The data consist of 172 gene pairs, and the pattern remains the same. The vast majority of them are clustered into two r-value ranges. One group (73 pairs) has values of r ranging from 0.88 to 1—their expression patterns have not diverged. The other group (92 pairs) has r-values ranging from −0.25 to 0.1. These genes display highly cell-specific expression patterns. The cell types where they are predominantly expressed, as these r-values indicate, no longer overlap between any paralog pair in this group—their expression patterns have completely diverged. Changing the CV value cutoffs to 80% or 90% quantiles did not change the patterns. Additionally, similar patterns were observed for human gene pairs whose proteins belong to the same InParanoid orthologous/paralogous groups, as well as for all human gene pairs whose proteins have a pair-wise BLAST E-values of 1E − 30 or better (Figure 4B). Therefore, the pattern observed in this study is likely common among multicellular species.
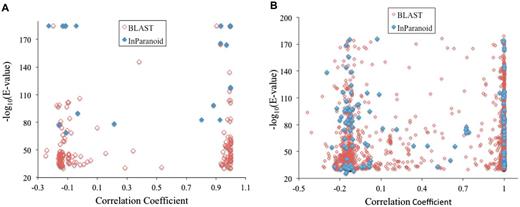
Correlation coefficient of expression patterns of paralog pairs in C. elegans (A) and in human (B). Paralog pairs were identified from InParanoid database (InParanoid), or as any protein pairs with a pair-wise BLAST E-value of 1E − 30 or better (BLAST). A vector containing gene-expression levels in the 12 C. elegans cell types, or in the 10 human tissues, was created for each protein. Pearson correlation coefficients between vector pairs were calculated and used to create the graph.
DISCUSSION
Genomic duplication and subsequent functional diversification of resultant paralogs are a major driving force of genomic evolution. Paralogs are more enriched in multicellular species and often display complementary expression patterns. This study built upon previous discoveries by other investigators (12,13), providing evidence that paralog count distribution in a genome exhibits a power-law relationship [P(K) ∝ K−α] and that the value of the parameter α can be used to gauge paralog abundance. The study examined the fluctuation of the value of α among proteomes of individual cell types and the whole proteomes of unicellular and multicellular species. A quantitative relationship among paralog enrichment, paralog expression pattern diversification and multicellularity was uncovered. To our knowledge, this represents the first quantitative theoretical insight into the role of paralog enrichment and expression pattern diversification in multicellularity, a fundamental phenomenon in biology.
Multicellularity imposes a greater burden on the genetic makeup of an organism: meeting the demand of a much wider spectrum of functionality across different developmental stages and differentiated cell types. This study provides direct and quantitative evidence that creating a larger paralog repository with diversified expression patterns is a major evolutionary mechanism to meet this enhanced demand. Even though paralog is more abundant in a multicellular proteome, the size of the paralog repository in a specific cell type is comparable to that in a unicellular proteome. Proteins of larger paralog families display higher fluctuation in their expression levels in the set of cell types examined in this study. Whether, and to what extent, different sets of paralog families are used in different developmental stages and differentiated cell types remains to be investigated.
While a powerful source of functional innovation in biological evolution, genomic duplication can also cause deleterious effects by breaking the balance between duplicated and non-duplicated genes. Essential cellular machineries require a stoichiometric balance among their components. For example, protein complex formation depends on a specific ratio among subunits of the complex (30). Moreover, core functions such as cell growth require a balance among the sets of involved biochemical pathways (31). This gene dosage evolutionary constraint is captured in the ‘gene balance hypothesis’ (30,32). Thus, whole-genome duplication is more tolerated than non-whole-genome duplication, since gene dosage balance is not broken (31). Paralogs in S. cerevisiae quickly diverge to circumvent this evolutionary constraint, in that their biochemical specificity (interaction partners) in the protein–protein interaction networks and their regulatory control change dramatically (31,33).
There is one additional layer of functional diversification in multicellular species, diversifying cell distribution patterns. The evolutionary pressure is to create complementary expression patterns among paralogous proteins. Many paralogous proteins do not coexist in the same cell. They can preserve their biochemical specificity, e.g. interacting with the same set of proteins, without breaking the gene dosage balance. The gene dosage constraint is thus lessened, explaining the higher retention rate of duplicate genes observed in multicellular genomes (5). Consequently, a larger repository of paralogs is maintained in multicellular species.

The model then predicts a power-law distribution, P(K) ∝ K−(1+b−a). The values of α for this distribution, ‘1 + b − a’, is therefore determined by gene duplication and loss rates; lower α-values dictates higher values for duplication rate constant, ‘a’, and thus evolution environments more accommodating to gene duplication events (11). Therefore, eukaryotic genomes have higher paralog abundance than bacteria genomes (14), as eukaryotic cellular environment is more permissive for gene duplication, allowing duplicate genes be partitioned to different cellular compartments to bypass the dosage evolutionary constraint. This also explains lower α-values and higher paralog abundance in multicellular species such as C. elegans, in which duplicate genes can potentially overcome the dosage evolutionary constraint through expression in different cell types. For genes expressed in the same cells, however, such evolutionary mechanism does not apply. Thus, α-values for specific cells are larger. Moreover, individual C. elegans cell types have similar architecture and operation, and hence similar cellular environment for genomic evolution as S. cerevisiae, a fruitful model organism for the study of multicellular species. Therefore, it is understandable that specific C. elegans cells have α-value comparable to that of S. cerevisiae.
How biochemical specificities of close paralogs diverge is an active research area. It is important for understanding the evolution of biochemical networks, as the networks emerge and grow through gene duplication (node addition) and subsequent divergence (rewiring) (35,36). It is also an important topic in biomedical research. Drugs often interact with close paralogs of intended target protein, causing adverse side effects. A general practice is to identify sequence segments that conserve among orthologs, but diverge among paralogs (37–39). The findings reported here can potentially benefit the studies of paralog diversification in multicellular proteomes. It is expected that paralogs with overlapping expression patterns tend to diverge in their biochemical specificities, whereas paralogs with complementary expression patterns conserve due to a lack of gene dosage evolutionary constraint. We are currently identifying sequence segments that conserve among paralogs with complementary expression patterns, but diverge among those with overlapping patterns.
Our results suggest that biochemical network analysis in multicelluar species is more challenging than current practice assumes. Most network models are generic—they are constructed without considering whether two proteins are expressed in the same cells. The cDNA expression libraries used in high-throughput protein–protein detection efforts, such as yeast two-hybrid, were constructed without discriminating whether two proteins are expressed together. However, diversification of expression patterns, as our study suggests, cannot be ignored. It is better to construct tissue/cell specific network models to guide basic biological and biomedical researches.
FUNDING
National Institute of Health (NIH) [1R01LM010212 to D.W.]; faculty startup fund to D.W. at University of Texas Health Science Center at San Antonio; University of South Florida faculty startup fund and a new investigator research grant (to D.W.). Funding for open access charge: NIH.
Conflict of interest statement. None declared.
ACKNOWLEDGEMENTS
Gene-expression data for C. elegans were obtained from the Genome BC C. elegans Gene Expression Consortium (http://elegans.bcgsc.bc.ca/) in Canada. The authors thank Dr Rickard Sandberg and Mr Daniel Ramskold for providing the human gene-expression dataset (29). The authors thank two anonymous reviewers for their efforts helping us improving the article.

Comments