


Abstract
Motivation: The result of a typical microarray experiment is a long list of genes with corresponding expression measurements. This list is only the starting point for a meaningful biological interpretation. Modern methods identify relevant biological processes or functions from gene expression data by scoring the statistical significance of predefined functional gene groups, e.g. based on Gene Ontology (GO). We develop methods that increase the explanatory power of this approach by integrating knowledge about relationships between the GO terms into the calculation of the statistical significance.
Results: We present two novel algorithms that improve GO group scoring using the underlying GO graph topology. The algorithms are evaluated on real and simulated gene expression data. We show that both methods eliminate local dependencies between GO terms and point to relevant areas in the GO graph that remain undetected with state-of-the-art algorithms for scoring functional terms. A simulation study demonstrates that the new methods exhibit a higher level of detecting relevant biological terms than competing methods.
Availability: topgo.bioinf.mpi-inf.mpg.de
Contact: alexa@mpi-sb.mpg.de
Supplementary Information: Supplementary data are available at Bioinformatics online.
1 INTRODUCTION
The result of a microarray experiment is a list of genes with corresponding expression profiles. Such a gene list is the starting point for an investigation of the biology manifested by the experimental data. Often, genes are ranked according to differential expression between disease groups or according to correlation of expression values with a phenotype measurement. The result of such an analysis is an ordered list of genes.
In many cases the list of differentially expressed genes is not sufficient for accurate inference of the underlying biology. Additional biological knowledge needs to be included to enhance the interpretation of such a list of genes. With the development of biological knowledge databases (Ashburmer et al., 2000), information for augmenting gene expression data is available. Biologically interesting sets of genes, for example genes that belong to a pathway or genes known to have the same biological function, can now be compiled. A popular choice for gene sets are genes collected under Gene Ontology (GO) terms, see GO Consortium (2004).
Methods for gene set enrichment analyze the positions of genes with a common function in an ordered list of genes. The biological function is expected to be more relevant if the gene set members are among the top-ranked genes in the ordered list obtained in the primary stage of the analysis. The top k genes from the ordered list are selected as interesting genes, and enrichment refers to over-representation of these genes in the group of gene set members. The amount of over-representation is assessed with a statistical score.
Methods that test for enrichment of GO terms have been proposed by Draghici et al. (2003), Zeenerg et al. (2003), Al-Shhrour et al. (2004) and Beissbarth and Speed (2004). A comparative study of commonly used tools for analyzing GO term enrichment was recently presented by Khatri and Draghici (2005). None of the methods compared in this study integrates the knowledge encapsulated in the hierarchical structure of the GO database. Recently Grossmann et al. (2006) discussed scoring enrichment of GO terms in a local sense. The over-representation of a GO term is quantified with respect to its direct less specific neighbors in the GO hierarchy. In the present article we propose algorithms that identify over-represented terms in a more global sense, integrating the whole GO topology in the score.
Several other methods integrating the hierarchical structure of the GO have related but different goals. Balasubramanian et al. (2004) test the association between multiple sources of functional genomics data. Each data source is represented by a single graph nodes representing genes and edges representing functional links. For a group of genes a graph based on GO is obtained by placing edges between all gene pairs that are annotated to GO terms with a small distance in GO graph topology. The proposed tests statistically compare the occurrence of edges observed in different graphs. Joslyn et al. (2004) define distances between nodes in the GO graph for ordering GO terms with respect to a group of genes. A GO term is considered more important if many genes in the group are annotated to GO terms close in graph topology. The resulting rank-ordered list of GO terms is then clustered in order to identify summarizing nodes for the characteristics of the gene group.
The complex structure of the GO introduces strong dependencies among the GO terms. Figure 1 depicts significantly enriched GO terms in a microarray study. The color of the GO terms represents the relative significance of the terms. The interpretation of such results is hampered by the implicit dependence between neighboring GO terms. Even when multiple testing correction procedures are applied the results are biased due to this correlation. The interpretation of the results can be improved if the correlation between the neighboring GO terms is integrated into the score.
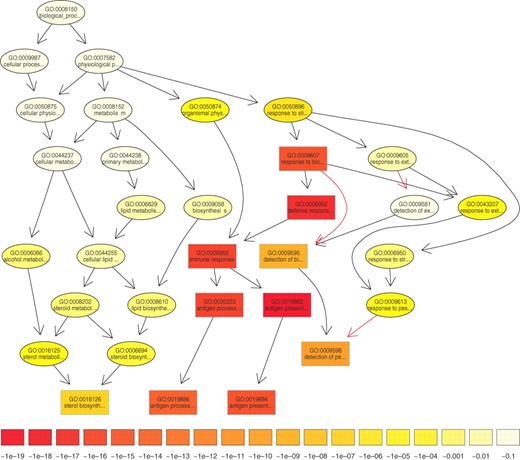
The subgraph induced by the 10 most significant GO terms identified by a current state-of-the-art method for scoring GO terms for enrichment. Boxes indicate the 10 most significant terms. Box color represents significance, ranging from dark red (most significant) to light yellow (least significant). The numbers in the legend represent the magnitude of the raw p-values associated with the respective color. Black arrows indicate is–a relationships and red arrows part–of relationships.
In this article we present two novel methods that improve the enrichment analysis of GO terms by integrating GO graph topology on a global scale. The first method, called elim, is intuitive and simple to interpret. It iteratively removes the genes mapped to significant GO terms from more general (higher level) GO terms. In the second method, called weight, genes annotated to a GO term receive weights based on the scores of neighboring GO terms.
When analyzing the GO graph structure, local dependencies between GO terms can be identified and removed. The algorithms are evaluated on two publicly available datasets. However, an evaluation on real datasets always yields results biased towards specifically designed algorithms. To avoid a subjective assessment of the quality of the enrichment methods, we introduce a novel evaluation scheme in which a predefined number of GO terms are artificially enriched and the performance of the methods is quantified with respect to the number of correctly identified enriched terms. The results from both real and simulated data show that the proposed algorithms perform better than current state-of-the-art methods.
2 METHODS
The GO provides an ontology that describes the roles of genes and gene products in various organisms. GO has a hierarchical structure that forms a directed acyclic graph (DAG). For such a graph we can use the notions of child and parent, where a child can have multiple parents. Every GO term is represented by a node in this graph. The nodes are annotated with a set of genes. For an inner node of the GO graph, the corresponding set of genes also comprises all genes annotated to all children of this node.
Various test statistics are used for scoring significance of GO terms. Standard implementations of GO testing compute the significance of a node independent of the significance of the neighboring nodes. Independently of the test statistic used, this standard scoring is referred as the classic method in this article. Two novel approaches as alternatives for this basic method are introduced further.
If a GO term contains the same genes as one of its children the classic method gives the same score to both terms. In such a case the child is biologically more interesting since its associated definition is more specific than the definition of its ancestors. Thus, a promising idea is to compute the significance of a node dependent on the significance of its children. The elim method directly implements this idea by removing all genes that are annotated to a significantly enriched node from all its ancestors. Removing genes from a GO term can be regarded as a weighting scheme where weights are restricted to be either 0 or 1. The weight algorithm generalizes this idea to weights in the interval [0,1]. In order to decide if a GO term u better represents the interesting genes than any other term from its neighborhood, the enrichment score of node u is compared with the scores of its children. Children with a better score than u better represent the interesting genes. The corresponding genes annotated to these children should contribute less to the score of any ancestor of node u. Thus, these genes are assigned small weights in all ancestors of node u. The children with a lower score than u should not be reported as significant. To achieve this, the genes annotated to these children receive small weights, and the score is recomputed based on the newly assigned weights.
Before describing the algorithms in more detail, we introduce some definitions and notations.
2.1 Definitions and notations
Let genes[u] denote the set of genes annotated to a GO term u. When the union of two or more sets of genes is computed, duplicates are removed. With we denote all genes that are not annotated to node u.
The edges of the GO graph are directed from parent to child. The level of a node u is defined as the length of the longest path from the root to node u. Note that there can be leaves at each level (except level 0) and that nodes at the same level never have an edge between them. For a set of nodes, upperInducedGraph() is defined to be the subgraph induced by all nodes reachable from if all edges in the graph are reversed.
Contingency table for the set of genes annotated to node u and the genes found significant in an expression study
| Sum | |||
|---|---|---|---|
| ∣sigGenes ∩ genes[u]∣ | ∣genes[u]∣ | ||
| Sum | ∣sigGenes∣ | ∣allGenes∣ |
| Sum | |||
|---|---|---|---|
| ∣sigGenes ∩ genes[u]∣ | ∣genes[u]∣ | ||
| Sum | ∣sigGenes∣ | ∣allGenes∣ |
Testing the association between the characteristics and for the contingency table (Table 1) corresponds to Fisher's exact test, see Lehmann (1986). The p-value returned by this test is the probability of observing at least the same amount of enrichment when significant genes are randomly selected out of all genes. Thus, a very small p-value gives strong evidence for an association between and .
2.2 First approach: eliminating genes
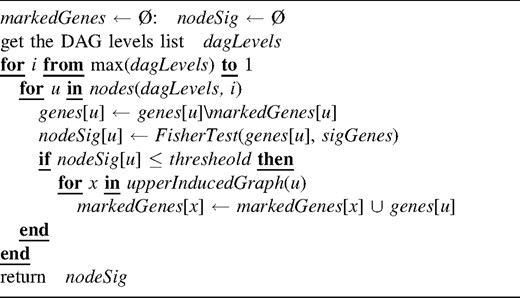
The elim method investigates the nodes in the GO graph bottom-up. It starts processing the nodes from the highest (bottommost) level and then iteratively moves to nodes from a lower level. Since nodes from the same level share no edge, they can be investigated independently. The bottom-up strategy assures that for a currently investigated node all children have been scored.
When a node u is processed, the genes that have been marked as removed in a previous step are removed from the set genes[u]. The score for the resulting group of genes is the p-value returned by Fisher's exact test, and node u is marked as significant if the p-value is smaller than a previously defined threshold. Typically this threshold is set to be 0.01 divided by the number of nodes in the GO graph with at least one annotated gene. This corresponds to a Bonferroni adjustment of the p-values. If node u is found significant then all genes mapped to it are marked as removed in all nodes of upperInducedGraph(u), that is in all ancestors of node u.
The algorithm finishes when all nodes have been processed. The elim method is summarized in Algorithm 1.
2.3 Second approach: weighting genes
The purpose of the bottom-up strategy implemented in the elim algorithm is to identify the most specific nodes with minimum required significance. A node is considered to be significant if its p-value is below a given threshold. More significant nodes on higher levels in the graph thus can be missed because of the gene removal process.
An alternative is implemented in the weight method. Here, significance scores of connected nodes (a parent and its child) are compared in order to detect the locally most significant terms in the GO graph. This is achieved by down-weighting genes in less significant neighbors. We first describe how weights are assigned to genes and how the significance score of a group of genes with corresponding weights is computed.
In the same way, all other quantities in Table 1 are computed. The cardinality function ∣∣ for a set S is always replaced by the function ⌈weight[i]⌉. The idea behind using a weighted contingency table is to first decorrelate the GO terms and then to test for enrichment in the transformed set of genes.
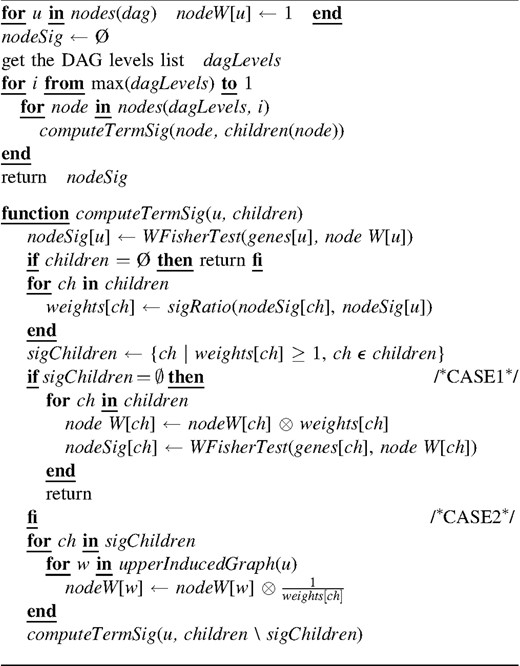
In the weight method the nodes are processed bottom-up level by level as in the elim method. However, for each node a vector of gene weights is memorized and updated during the process. Initially, all weights for the genes annotated to a node are set to 1. Let u be the currently processed node in the bottom-up process. The main principle is to reinforce differences in significance between u and its neighbors. If u is more significant, genes contained in the children are down-weighted, yielding a decreased significance of the children. If at least one child is more significant than u, the genes common to the child and u are down-weighted in node u and its ancestors, further decreasing the significance of node u.
The function computeTermSig(u, children) is the core of the weight algorithm. It recursively eliminates children of u that are more significant than u. Each time this function is called, the score of u is recomputed using the updated genes weights. Based on the new score, in turn, the weights for all children are recomputed using the sigRatio() function.
More precisely, if in the iterative process node u has a lower p-value than its children and thus can be regarded as a better candidate, for each child the old weights (assigned in some previous step) are multiplied with the weights given by the sigRatio() function. After updating the scores for all children the processing of node u finishes.
The alternative is that at least one child has a better score than node u. All genes annotated to each of these more relevant children are down-weighted in the ancestors of node u, including u itself. Again, gene weights are multiplied with a factor obtained with the sigRatio() function. By calling computeTermSig() for node u and all its less significant children, the score for u then is recomputed based on the new weights. Owing to the modified weights for node u, the scores of current children can now become more significant than the updated score of u. Thus the process is iterated until all remaining children have lower scores than u. Then the algorithm moves to the next node.
The full details of the algorithm weight are shown in Algorithm 2.
2.4 Combining algorithms
3 RESULTS
We evaluated the GO scoring algorithms classic, elim and weight on two real gene expression datasets (Chiaretti et al., 2004; Cario et al., 2005) and on simulated data. Both real datasets were collected in order to distinguish subgroups of Leukemia patients. However, the discrimination criterion is quite different. In the first case, patients are split into B-cell and T-cell type leukemias and in the second case into children with or without minimal residual disease (MRD) after therapy.
The algorithms were implemented in the R programming language (Author Webpage). The results were obtained using R version 2.2 and the libraries provided by the Bioconductor project (Author Webpage), version 1.7.
3.1 Comparison of algorithms on Leukemia dataset I
All methods were run on an Acute Lymphoblastic Leukemia (ALL) dataset (Chiaretti et al., 2004) that was extensively studied in the literature on microarray analysis. The dataset is available in R as a Bioconductor package.
The dataset consists of 128 microarrays from different patients with ALL. The HGU95aV2 Affymetrix chip was used for the experiments. The annotation was performed using GO's biological process (BP) ontology. From a total of 12 625 genes found on the chip, 9231 genes are annotated to at least one GO term from the BP ontology. This list of genes induces a GO graph with 2677 nodes. The root of this graph contains all 9231 genes. All leaves are GO terms that have at least one gene annotated.
It is known that ALL cells are delivered from either B-cell or T-cell precursors. To determine the differentially expressed genes the patients are split according to the type and stage of the disease. There are 95 patients with B-cell ALL and 33 patients with T-cell ALL in the study. A two-sided t-test was applied to these groups and the raw p-values were adjusted using the false discovery rate method from Benjamini and Yekutieli (2001). This process resulted in 515 differentially expressed genes for a level α = 0.01 test.
The results are presented in Table 2. The p-values reported for all algorithms are adjusted p-values using the false discovery rate procedure from Benjamini and Yekutieli 2001. The results are quite different for the compared algorithms. Some GO terms that are found significant by the classic method are completely discarded by other methods. For example, GO:0030333 is reported as non-significant by method elim, but it is significant for all other methods. The list of GO terms that are discarded by the more sophisticated methods includes very general terms like response to biotic stimulus or defense response. The GO term GO:0009596 that is reported significant by all methods is a leaf in the GO graph. In the reported list of GO terms it contains the smallest number of annotated genes, namely 13 genes. The fact that the GO terms identified as significant terms in this study have considerably large numbers of annotated genes gives additional confidence in the relevance of the results.
Statistics for significant GO terms for the ALL dataset (Chiaretti et al., 2004).
| GO ID | Term | Observed | Expected | Annotated | p-values | |||||
|---|---|---|---|---|---|---|---|---|---|---|
| classic | elim | weight.log | weight.ratio | all.M | ||||||
| 1 | GO:0019882 | antigen presentation | 22 | 2.287 | 41 | 1.6e−17 | 0.2821 | 1.6e−17 | 1.6e−17 | 1.8e−13 |
| 2 | GO:0006952 | defense response | 107 | 47.143 | 845 | 8.3e−17 | 0.0065 | 1.4e−09 | 1.1e−06 | 5.4e−09 |
| 3 | GO:0030333 | antigen processing | 20 | 2.12 | 38 | 7.8e−16 | 1.0000 | 7.8e−16 | 7.8e−16 | 4.7e−12 |
| 4 | GO:0006955 | immune response | 98 | 43.293 | 776 | 2.7e−15 | 5.9e−06 | 3.0e−05 | 0.024 | 3.3e−07 |
| 5 | GO:0019884 | antigen presentation, exogenou… | 14 | 1.004 | 18 | 5.9e−15 | 5.9e−15 | 2.2e−10 | 0.054 | 1.4e−10 |
| 6 | GO:0009607 | response to biotic stimulus | 112 | 53.949 | 967 | 9.5e−15 | 0.6873 | 1.0e−05 | 0.404 | 1.3e−05 |
| 7 | GO:0019886 | antigen processing, exogenous … | 14 | 1.116 | 20 | 6.8e−14 | 6.8e−14 | 1.5e−11 | 0.054 | 2.5e−10 |
| 8 | GO:0009596 | detection of pest, pathogen or… | 9 | 0.725 | 13 | 2.9e−09 | 2.9e−09 | 2.9e−09 | 2.9e−09 | 2.9e−09 |
| 9 | GO:0009595 | detection of biotic stimulus | 9 | 0.893 | 16 | 3.9e−08 | 1.0000 | 1.0e−05 | 0.107 | 0.00046 |
| 10 | GO:0016126 | sterol biosynthesis | 9 | 1.395 | 25 | 4.5e−06 | 0.0015 | 4.5e−06 | 4.5e−06 | 1.9e−05 |
The column Expected represents the expected number of interesting genes mapped to the GO term if the interesting genes were randomly distributed over all GO terms.
An analysis of rank correlations between the most significant GO terms shows large differences between the different scoring algorithms. The largest correlation of 0.46 can be observed between the elim method and the weight.ratio method, see the Supplementary Material, Section 1.
Another insightful way of looking at the results of the analysis is to investigate how the significant GO terms are distributed over the GO graph. For each algorithm the subgraph induced by the most significant GO terms is plotted. In the plots, the significant nodes are represented as boxes. The plotted graph is the upperInducedGraph() generated by these significant nodes. To better emphasize the differences to the classic method (Fig. 1), nodes that are significant for the classic method but not for the presented method are plotted as circles.
In Figure 2 (left graph) the subgraph induced by the top five GO terms for the elim method is shown. Nodes close to the root of the graph that were reported as significant by the classic method are now completely discarded, e.g. the ancestors of node GO:0006955. These nodes represent very general GO terms like response to biotic stimulus or defense response and, in most cases, these nodes are not interesting for the biological interpretation. The same behavior is observed in the case of the weight.ratio method, see Figure 2 (right graph). Compared with elim the significance of the nodes is reduced, especially in the upper levels of the graph.
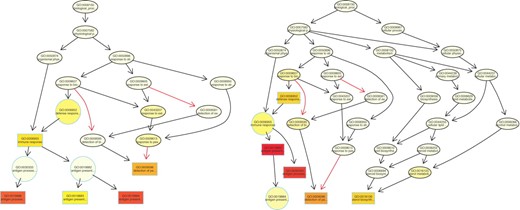
The subgraph induced by the five most significant GO terms found by the elim method (left graph) and by the weight.ratio method (right graph). For a detailed description of the figures see the legend of Figure 1.
3.2 Comparison of algorithms on Leukemia dataset II
In a second study we analyzed the cDNA dataset published by Cario et al. (2005) with expression measurements of 51 patients with childhood ALL. The patients in this study appear to be biologically and phenotypically homogeneous and are treated with the same therapy. However, they split into two groups of 30 patients without detectable minimal residual disease (MRD-SR) and 21 patients with high MRD load (MRD-HR).
The data were imported and processed in R. All probes on the array with more than missing values for the 51 samples were removed from the analysis. The expression values of multiple probes with the same LocusLink identifier coding for one respective gene were averaged. This preprocessing resulted in 13 236 genes. Only 6853 of theses genes are annotated to at least one GO term from the BP ontology. The induced GO graph contains 2733 nodes. Compared with the first Leukemia study discussed above the genes are annotated to more specific GO terms and they are more widely spread across the hierarchy. Applying a two-sided t-test to the groups defined by patients with MRD-SR and MRD-HR respectively, a total of 682 genes were detected as differentially expressed. p-values were adjusted with the FDR procedure (Benjamini and Yekutieli, 2001).
The induced GO subgraph plots for all methods and a results table in the form of Table 2 are available in the Supplementary Material. A comparison of the results for the two studies shows important differences but also remarkable similarities. Although both studies are related, they address different biological problems and the data are obtained with different experimental technologies. The GO term immune response is found significant for the first dataset but not for the second and cell adhesion is specific only to the second dataset. Further interesting GO terms for the second study are peripheral nervous system development and activation of MAPK activity. These processes should be investigated for obtaining more knowledge on MRD.
On the other hand, in both studies the GO terms GO:0019884 and GO:0019886 consistently are among the most significant terms for all algorithms, thus underlining the general importance of antigen presentation and antigen processing for ALL, Table 2. Similar concordances between the two Leukemia datasets are described in the results section of the article of Cario et al. (2005).
It is common to both studies that very general GO terms are discarded by the more sophisticated algorithms, in the second study specifically the originally high-scoring terms organogenesis and development.
3.3 Comparison of algorithms on simulated data
In order to objectively compare the quality of different GO scoring methods we need to know the true relevant GO terms. On real datasets like the ones introduced above the true significant GO terms are not known. To address this issue the algorithms were also tested on simulated data. In our simulation setup the significant GO terms are known and the performance of an algorithm is measured w.r.t. the number of correctly identified GO terms. To mimic the real data as best possible the GO biological process ontology was chosen as the underlying graph. The complete list of genes contains all 9231 probes on the HGU95aV2 chip that can be annotated to this graph. The resulting graph contains 2677 nodes.
In the first step, a set of truly enriched nodes is determined. These nodes represent the relevant biological functions and are denoted as enriched nodes. We select the enriched nodes randomly from all nodes whose number of annotated genes lies in a fixed pre-specified interval. Such a constraint is imposed in order to overcome two problems. Nodes with too few annotated genes are too specific and cannot synthesize the underlying biology, and nodes with too many annotated genes are too general and close to the root of the graph.
In the second step, given the enriched nodes, the list of interesting genes is obtained by combining all genes annotated to these nodes to a single set. To better model reality, some noise is introduced in the list of interesting genes. A fraction of the interesting genes is randomly selected and replaced with other genes.
In the first simulation study 50 enriched nodes are selected, each having between 10 and 50 annotated genes. The noise introduced in the list of interesting genes is set to 10%, and results of 100 simulated datasets are averaged. Table 3 shows that all new methods perform better than the classic method. The weight methods always outperform the classic method by a considerable amount. For small values of k the elim method is the best, outperforming the classic method by a factor of 3. From the top 25 nodes selected by elim an average of 17 nodes are enriched nodes, compared with an average of only 5.5 enriched nodes for the classic method. Combining the p-values of all methods also helps, providing robust results.
Average numbers of correctly identified enriched nodes over 100 simulation runs with 50 true enriched nodes, 10% noise level and 10 – 50 genes annotated to the enriched nodes, for different values of k
| k | class | weight.log | weight.ratio | elim | all.M |
|---|---|---|---|---|---|
| 25 | 5.5 | 13 | 14.2 | 16.9 | 15.4 |
| 50 | 14.5 | 25.5 | 28 | 27 | 28.5 |
| 75 | 22.5 | 36 | 38 | 31 | 38 |
| 100 | 31 | 42 | 39.5 | 33.5 | 43 |
| k | class | weight.log | weight.ratio | elim | all.M |
|---|---|---|---|---|---|
| 25 | 5.5 | 13 | 14.2 | 16.9 | 15.4 |
| 50 | 14.5 | 25.5 | 28 | 27 | 28.5 |
| 75 | 22.5 | 36 | 38 | 31 | 38 |
| 100 | 31 | 42 | 39.5 | 33.5 | 43 |
For real datasets the list of interesting genes contains much more noise than 10%. In a second simulation study with more stringent conditions we selected 50 enriched nodes from all nodes with 10–1000 annotated genes, and the noise level was set to 40%. With these parameters recovering the enriched nodes is much more difficult. As in the previous simulation study, the methods weight and elim clearly outperform the method classic, see the Supplementary Material, Table 5.
The score considers the first k nodes together with all children and parents of these nodes. For only parents and not children are included. Analogously, we define and that also include nodes with a distance of two levels from the first k nodes.
We compute such scores based on the observation that some methods, in particular the elim method, often yield more specific significant GO terms. If for a method ℳ, the difference is large, then many true enriched nodes are among the parents of the detected nodes.
Figure 3 shows plots of scorek as a function of k. In Figure 3a and 3b and are plotted for the simulation study with 10% noise. In Figure 3c is plotted for the simulation with 40% noise. Adding parents leads to no improvement for the classic method, but to a 15–20% improvement for the elim method. The best performing methods are weight.ratio and the combination of all methods all.M for and elim for the .
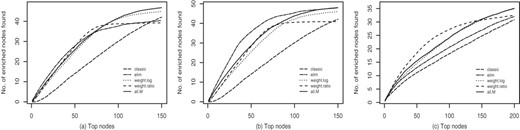
Comparison of the quality of different GO scoring algorithms in a simulation study. Each curve represents the average of the numbers of preselected GO terms, over 100 simulation runs, that are among the top k GO terms according to the different algorithms. The proposed methods clearly outperform the method classic. In (a) and (b) and are plotted, respectively, with 10% noise introduced in the list of interesting genes, in (c) is plotted, with 40% noise.
The results obtained with the elim method show that including the children of the top scoring nodes gives no significant improvement (40 versus 41 enriched nodes for k = 50, see Supplementary Material, Table 4, for a detailed results table). Including only parents improves the results for the elim method. These observations show that for elim the true enriched nodes are among the top scoring nodes and their parents. Thus elim successfully identifies the areas in the graph with the enriched nodes, but sometimes fails to precisely point to the correct nodes.
3.4 Robustness of algorithms
The analysis of high throughput microarray experiments adopted in this article is sometimes referred to as two-stage analysis. In the first step genes receive scores, e.g. quantifying the correlation of a phenotype with the gene expression values. Based on the distribution of the scores a threshold is chosen and genes with a score above the threshold are called differentially expressed genes. In the second step, the enrichment of a set of genes is tested based on test statistics that depend on the list of differentially expressed genes.
It is believed that in many real-life cases the list of differentially expressed genes contains only a small fraction of truly differentially expressed genes. Thus, the result of the enrichment analysis can be hampered by the choice of the threshold. One method addressing this problems has been introduced in Subramanian et al. (2005).
To evaluate the influence of the threshold, all methods were run with different threshold values for the leukemia dataset discussed in Section 3.1. The results summarized in Figure 4 demonstrate the stability of the methods. Modifying the threshold value, and thus considering more or fewer differentially expressed genes, does not significantly change the order of the most significant GO terms. For the elim method adding more genes to the list of differentially expressed genes does not affect the top five GO terms. The weight method is the best in preserving the ordering; only few swaps between the GO terms are observed.
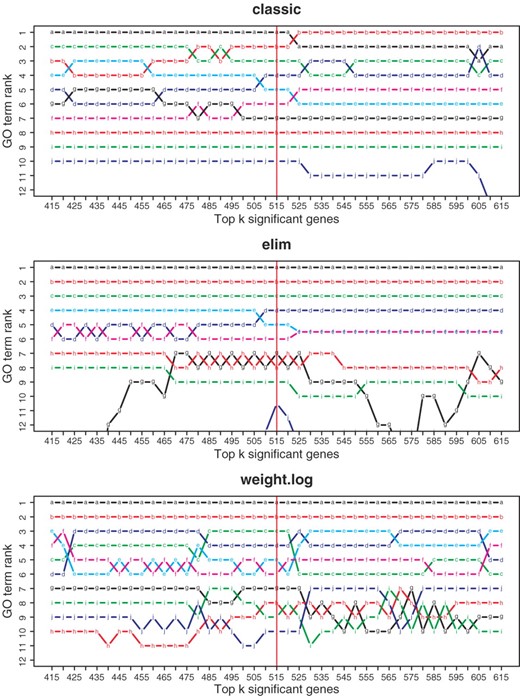
Analysis of the influence of the threshold on the ranking of GO terms. Including all genes with FDR-adjusted p-value p ≤ 0.01 yields k = 515 differentially expressed genes. Changing the threshold according to an increase or decrease of numbers of genes in steps of size 10 the ranks of the originally 10 top-ranking GO terms are shown. A colored line describes the rank of a fixed GO term for different thresholds.
4 CONCLUSIONS
We addressed the problem of finding enriched functional groups of genes based on gene expression data. We proposed two novel heuristics for integrating the DAG structure of the GO in testing for group enrichment. The key idea is to compute the significance of a GO term based on its neighborhood. The experimental results show that the introduced methods improve over existing methods.
There is no clear measure to tell which method performs better on a real dataset. The evaluation is performed by the researcher and thus is inherently subjective. To eliminate this subjectivity, we evaluate the methods on simulated data.
With the classical approach in which each node is scored independently only few true significant nodes remain undiscovered. However, the dependencies between top scoring nodes yield a high false-positive rate. The simulation results show that the weight algorithm manages to reduce the false-positive rate, while not missing many true enriched nodes. The elim method further reduces the false-positive rate, but with a higher risk of discarding relevant nodes. For finding the important areas in the graph, the elim method is to be preferred, given its simplicity.
Other test statistics for assessing GO term significance than Fisher’s exact test can be used, e.g. a hypergeometric, binomial or χ2-test. In particular, test statistics that do not rely on a fixed list of genes, such as the normalized Kolmogorov–Smirnov test introduced in Subramanian et al. (2005), can be implemented in the method elim. In this article we restricted ourselves to a single test statistic in order to better emphasize the differences between the different algorithms.
In conclusion we showed that integrating the dependency structure between nodes is enhancing the inference. Moreover, combining the results of multiple methods even further improves the result of the analysis.
Financial support was provided by BMBF grant No. 01GR0453 [AA, JR] and by the IMPRS [AA]. This work has been performed in the context of the BioSapiens Network of Excellence (EU contract no. LSHG-CT-2003-503265).
Conflict of Interest: none declared.
REFERENCES
Author notes
Associate Editor: Martin Bishop

