

Abstract
An important technological revolution is underway in the field of neuroscience as we begin the 21st century. The combination of optical methods with genetically encoded photosensitive tools (optogenetics) offers the opportunity to quickly modulate and monitor a large number of neuronal events and the ability to recreate the physiological, spatial, and temporal patterns of brain activity. The use of light instead of electrical stimulation is less invasive, and permits superior spatial and temporal specificity and flexibility. This ongoing revolution has motivated the development of new optical methods for light stimulation. They can be grouped in two main categories: scanning and parallel photostimulation techniques, each with its advantages and limitations. In scanning approaches, a small light spot is displaced in targeted regions of interest (ROIs), using galvanometric mirrors or acousto-optic deflectors, whereas in parallel approaches, the light beam can be spatially shaped to simultaneously cover all ROIs by modulating either the light intensity or the phase of the illumination beam. With amplitude modulation, light patterns are created by selectively blocking light rays that illuminate regions of no interest, while with phase modulation, the wavefront of the light beam is locally modified so that light rays are directed onto the target, thus allowing for higher intensity efficiency. In this review, we will describe the principle of each of these photostimulation techniques and review the use of these approaches in optogenetics experiments by presenting their advantages and drawbacks. Finally, we will review the challenges that need to be faced when photostimulation methods are combined with two-photon imaging approaches to reach an all-optical brain control through optogenetics and functional reporters (Ca2+ and voltage indicators).
Export citation and abstract BibTeX RIS

Original content from this work may be used under the terms of the Creative Commons Attribution 3.0 licence. Any further distribution of this work must maintain attribution to the author(s) and the title of the work, journal citation and DOI.
Acronyms
| 1PE | single-photon excitation |
| 2D | two-dimensional |
| 2PE | two-photon excitation |
| 2PLSM | two-photon laser-scanning microscopy |
| 3D | three-dimensional |
| AOD | acousto-optic deflector |
| AP | action potential |
| BFP | back focal plane |
| CCD | charge-coupled device |
| CGH | computer generated holography |
| ChR2 | channelrhodopsin-2 |
| CPI | common path interferometry |
| DMD | digital micromirror device |
| DPG | dual prism grating |
| EGFP | enhanced green fluorescent protein |
| FFP | front focal plane |
| FOE | field of excitation |
| FOV | field of view |
| FWHM | full width at half maximum |
| GECI | genetically encoded calcium indicator |
| GM | galvanometric mirror |
| GPC | generalized phase contrast |
| GS | Gerchberg–Saxton |
| GVD | group velocity dispersion |
| IR | infrared |
| LC | liquid crystal |
| LED | light-emitting diode |
| M | magnification |
| NA | numerical aperture |
| OGB1 | Oregon green bapta 1 |
| PCF | phase contrast filter |
| PSF | point spread function |
| ROI | region of interest |
| RS | resonant scanner |
| sCMOS | scientific complementary metal oxide semiconductor |
| SLM | spatial light modulator |
| SNR | signal-to-noise ratio |
| TF | temporal focusing |
| UV | ultraviolet |
| VSD | voltage-sensitive dye |
1. Introduction
1.1. Optogenetics and wavefront shaping: the ideal approach
A current fundamental goal in neuroscience is to determine how neuronal circuit activity is causally related to behavior and pathological states. In order to elucidate this link, it is necessary to establish specific experimental strategies enabling the simultaneous monitoring and perturbation of neuronal activity during behavior [1]. This demands appropriate toolkits including sensors and actuators to detect and trigger the activity of neurons, either individually or in groups, in behaving animals [2]. For a long time, electrophysiology has been the only approach to stimulate or record neuronal activity, by probing the brain with electrodes. Critically, electrode-based approaches are very limited when it comes to cell-type specific targeting or recognition and are intrinsically invasive [3]. The advent of optogenetics provides a new package of tools for neurobiologists to monitor and activate neurons [4–6]. Light-emitting sensors (calcium- or voltage-sensitive dyes (VSDs) [7–9]) and light-triggering actuators (opsins [10]) can be genetically encoded in neurons, enabling optical recordings (via functional imaging) and perturbations (via photostimulation or photoinhibition) of neuronal activity [2, 11].
Optogenetics has exerted a dramatic influence on the role and perspectives of applied optics in neuroscience. In particular, the possibility to photostimulate opsin-expressing neurons is driving the development of a series of different illumination strategies for actively generating neuronal events and perturbing neural signaling.
Typical realizations of neuronal photostimulation have been obtained by illuminating genetically designated opsin-expressing neurons, with visible light (single-photon excitation, 1PE) delivered in a basic wide-field configuration provided by extended illumination sources (figure 1(a)) [12–19] or fiber-based systems [20–23]. Exhaustive reviews of the results obtained with wide-field optogenetics have already been written [6, 24, 25]. Some of the major outcomes include mapping neuronal circuits associated with specific behaviors [20, 26–31], exploring respiration regulation [32–34], analyzing local circuits activity [23, 35–37], probing neuronal circuits involved in pathological [38–40] and therapeutic [41] conditions, restoring partial retinal functioning after photoreceptor loss [42–44], and studying the correlation of activated cells to BOLD fMRI signals [45].
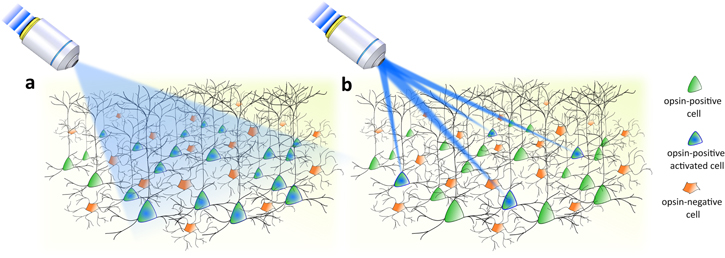
Figure 1. Optical approaches for optogenetic stimulation. (a) Cell-type genetically targeted investigations enabled by all opsin-expressing neuron activation via wide-field illumination. (b) Targeted investigations enabled by selective activation of a specific pool of neurons via light-targeting strategies.
Download figure:
Standard image High-resolution imageIn these studies, cellular specificity relied exclusively on genetic targeting strategies that enabled the expression of opsin in specific cellular types. However, this approach offers a limited understanding of brain function, since neurons belonging to the same cell class and brain region may present diverse response patterns [1, 46, 47]. In order to address questions concerning the fine-scale organization of the brain, such as how many neurons need to be recruited to trigger a certain behavior and whether certain nodes in neural circuits dominate others, the spatial range of light-based investigation needs to be scaled-down from genetically identified neuronal groups to individual neurons. To achieve this, the optogenetic toolkit has been enriched with a variety of light-targeting strategies [48, 49] permitting us to arbitrarily control the spatial distribution of light into the sample and selectively pinpoint defined subsets of neurons within the same genetically identified population (or eventually subcellular compartments, such as single dendritic branches or spines [50]) (figure 1(b)).
There are multiple challenges for this new class of optical approaches. First, neurons need to be accessible by light and strategies to overcome tissue scattering have to be implemented. Second, light-triggering time scales and spatial ranges for neuronal stimulation need to possess enough accuracy and flexibility to mimic the ensemble of activity patterns that neural networks naturally undergo. Third, the optical techniques need to be adapted to the photo-physical characteristics of the light-gated molecules. For example, as opsins generally present low channel conductance (≈40 fs) [51] and relatively long excited-state lifetime (millisecond range), photostimulation strategies need to optimize the illumination of the neuron such that the spatiotemporal integration of the single-channel photocurrents is effective for triggering action potentials (especially under two-photon excitation (2PE) regime).
Two classes of light-targeting strategies have emerged in the last few years for single-cell photostimulation, commonly identified as serial-scanned and parallel-patterned light-targeting methods. In the first case, the light is focused in a micron-scale Gaussian spot and rapidly steered over the sample, enabling sequential stimulation of a series of targeted sites. In the second case, the light intensity and/or phase is spatially modulated in order to obtain arbitrarily-defined patterns of illumination over the sample enabling simultaneous multi-site stimulation. On the basis of these original configurations, light-targeting hybrid approaches have been elaborated where scan and parallel photostimulation concepts are combined.
In the following, we will describe these different light-targeting strategies, exploring their basic concepts, optical designs, and applications in optogenetics. Particular attention will be given to the implementations involving 2PE techniques [52, 53], which allow for high penetration depth and three-dimensional (3D) accessibility. Finally, we will detail the recent achievements of all-optical systems where light-targeting photostimulation and functional imaging readout are coupled.
2. Scanning approaches
2.1. Basic concepts
While wide-field illumination lacks the necessary spatial accuracy to selectively trigger individual neurons within a neural circuit, spatial specificity in photostimulation can be achieved by focusing the excitation beam on a small diffraction-limited spot. The extension of the diffraction-limited spot depends on the wavelength of the excitation light λ, the numerical aperture (NA) of the microscope objective, and the medium refractive index n (laterally, Δx ∼ λ/2NA; axially, Δz ∼ 2λn/NA2).
Photoactivation with a static diffraction-limited spot can be valuable, but it is mainly limited to a single target. To extend the spatial flexibility, the laser spot can be steered through the sample, in order to target a series of predefined regions of interest (ROIs) (figure 2(a)). In order to move the spot laterally across the excitation field, a scanner unit is used (figure 2(b)). Scanning the beam does not alter the spot size, and thus the type of scan unit does not influence the spatial resolution. Spatial localization accuracy and flexibility of scan-based photostimulation rely on the ability to deflect the illumination beam by a precise angle and to scan arbitrarily-defined trajectories over the sample. Both aspects depend on the physical characteristics of the scan unit and will be detailed in the following sections.
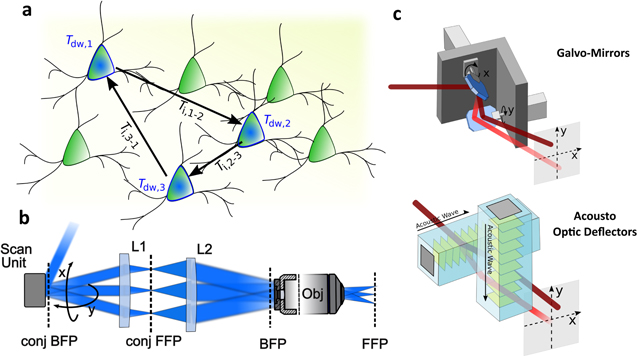
Figure 2. Scan-based light-targeting methods. (a) Schematic representation of the serial photostimulation of a series of neurons. Tdw indicates the photostimulation dwell time per neuron and Ti,n-m the inter-location time necessary to redirect the beam from the nth to the mth neuron. (b) Optical scheme of scan-based light-targeting techniques: a scan unit enables tilting the laser beam over a wide range of angles, in two different directions (x and y). This scan unit is imaged at the back focal plane (BFP) of a microscope objective through a magnifying telescope including a scan lens (L1) and a tube lens (L2). This arrangement enables a two-dimensional (2D) lateral displacement of the illumination spot in the objective front focal plane (FFP). (c) 2D scanning is enabled by deviating a laser beam through two oscillating galvanometric mirrors (top) or two consecutive acousto-optic deflectors (AODs) (bottom).
Download figure:
Standard image High-resolution imageAs for the temporal capabilities, it is important to consider that the overall temporal resolution T for N sequentially photostimulated targets, is given by

where Tdw indicates the illumination dwell time per location (the time needed to induce a neuronal response, which is related to the photoactive compound, incident power, illumination regime, sample characteristics, and type of readout), and Ti is the inter-location time (the time needed to reposition the beam over to the following target, which is limited by the scan-rate of the scan unit) (figure 2(a)). A series of optical strategies have been developed for minimizing Ti including random access microscopy [54], i.e. a discontinuous scanning mechanism realized with an acousto-optic deflectors (AOD) vector mode approach [55] and targeted path scanning [56], both implemented with galvanometric mirrors (GMs) by computing the fastest scanning pattern to visit an ensemble of user-defined ROIs.
In the following, we will briefly describe the implementation of scan-based systems and physical properties of GMs and AODs in the context of light-targeting optogenetics stimulation, highlighting their different capabilities in terms of spatial localization, temporal flexibility, excitation field, and 3D access.
2.2. Implementation of scan-based photostimulation methods
Laser-scanning optical systems generally consist of a simple optical architecture including a scanner unit, a telescope, and an objective lens (figure 2(b)). The scanner is imaged at the back focal plane (BFP) of the microscope objective through a magnifying telescope formed by a scan lens and a tube lens. The angular deflection of the beam at the back aperture plane is translated into a lateral displacement of the spot in the front focal plane, FFP (i.e. in the image plane). Generally, two perpendicular scanners are used to move the spot along the x and y directions. In principle, different scanning configurations either based on GMs or AODs (figure 2(c)) can be implemented as long as they provide the spatiotemporal performance and the optical efficiency necessary to generate a sufficient physiological response to photoactivation, which might vary depending on the photoactive compound and the illumination regime.
2.2.1. GMs
Standard galvanometer scanner units are formed by two mirrors, each mounted on a galvanometric actuator, which steer the laser beam along the two perpendicular directions, x and y (dual GM-based scanning system) (figure 2(c)). This technique has the advantage of simplicity as GM-based scanning systems are commercially available and can easily be adapted to standard imaging and electrophysiology setups. High optical efficiency is ensured as very little light is lost by mirror reflection. Mirrors are achromatic and can support high excitation power densities without damage. They are thus well adapted for ultrashort laser pulses at the high intensity used in 2PE. The inter-location time Ti is limited by the inertia associated to the movements of the mirrors: typically, one step over a distance of tens of micrometers takes ∼100 μs [57]. Positional noise (in the order of several tens of μrad) deteriorates the spatial precision of the scanning trajectory and should be taken into account [58]. Since the error increases at high scanning rates, this factor may limit the temporal flexibility of the system, when illuminating multiple positions sequentially [56].
The optical field of excitation (FOE) is given by  where fobj is the objective focal length, β is the maximal tilting angle of the GMs and M is the magnification of the telescope projecting the GMs at the back aperture of the objective. In typical conditions, the FOE may extend to several hundreds of micrometers. However, it is worth mentioning that the number of cells accessible within this FOE in an interval sufficiently small to be considered as 'simultaneous' on the neuronal scale (typically in the order of few milliseconds) is ultimately limited by the scanning rate, the distance between cells, and the required photoactivation dwell time.
GM scan-based schemes have been adopted for optogenetic investigations including 1PE photostimulation of channelrhodopsin-2 (ChR2) for mapping functional neuronal connectivity [59, 60] and 2PE photostimulation of ChR2 and C1V1 as detailed in the next section (section 2.3).
So far, 3D photostimulation in scan-based systems has not been performed. However, interesting solutions have been proposed for 3D imaging, including sinusoidal oscillations of a piezo-mounted objective [61], remote focusing for axial steering [62, 63], and coupling with a deformable mirror [64].
A faster alternative to standard GM units is represented by resonant GM scan systems. In resonant scanners (RS), a fast-axis mirror is driven to sinusoidally oscillate at its resonant oscillating frequency [65]. This enables scan vibration frequency in the range of 4–8 kHz, which can be further boosted up to nearly 15 kHz in bidirectional modality. Compared to linear GM where the oscillating angle follows a sawtooth curve over time and the pixel dwell time is constant along a scan, RS-mirror oscillation speed varies along the FOE following a sinusoidal waveform, thus slowing down at the edges with the potential problem of non-uniform illumination and bleaching. Most of the time, this effect is practically negligible and RSs have found wide applications for extended-field functional imaging under 2PE regime [66–68]. Although RSs feature line speed nearly one order of magnitude higher than standard GMs, the fixed line frequency reduces the overall optical flexibility of the system. No RS-based photostimulation schemes have been published to date.
2.2.2. AODs
As an alternative to GMs, AODs allow inertia-free scanning of the laser beam. In an AOD, an acoustic wave, usually in the radio frequencies, propagates through a crystal (e.g. TeO2) in the transverse direction, thus imprinting a phase grating on the crystal itself (figure 2(c)). The grating then diffracts the incident laser beam in multiple orders. For a particular incident angle (Bragg angle) of the incoming beam, most of the laser light is directed into the first order of diffraction. In this regime, the first-order diffraction angle (θ) can be tuned by changing the frequency of the acoustic wave (θ = λF/va, where λ is the wavelength of the incoming beam, F the acoustic frequency and va the acoustic velocity in the crystal medium). For 2D scanning systems, two perpendicularly oriented AODs can be used sequentially (figure 2(c)). This configuration allows for random access of the ROIs [54], i.e. non-sequential scanning, because the position of the laser spot is solely determined by the acousto-optic frequencies in the x and y AODs. Since no optical element needs to be moved during the AOD scan, the process is not limited by inertia.
Temporal resolution is primarily dictated by the commutation inter-location time (i.e. the time needed to change the deflection angle), which is the same for all positions inside the available excitation field and is equal to the time required by the acoustic wave to travel across the diameter of the AOD aperture (assuming that it is filled by the excitation beam). Typical values are of the order of 15 μs [69], shorter than the dwell time required for most photoactive compounds under 1PE. In some implementations, inter-location time is rather limited by the switching time of the radio-frequency driver, which controls the frequency and amplitude of the acoustic wave [70].
The FOE for an AOD-based scanner depends on the available range of acoustic frequencies (ΔF), which defines the maximum beam deflection angle (Δθ), and on the system magnification ( with M: magnification of the telescope imaging the AOD onto the BFP of the objective) [71].
A considerable effort has been devoted to adapt AOD scanning systems to 2PE [58, 72, 73]. The two main challenges in this case are the spatial and temporal dispersion that the laser beam undergoes when passing through the AOD crystals. The first is caused by chromatic (angular) dispersion of the ultrashort laser pulse by the AOD phase grating, while the second is due to group velocity dispersion (GVD) introduced by the AOD crystals [58]. These result in a decreased spatial resolution (spatial dispersion) and broadened excitation pulse duration (temporal dispersion), with corresponding loss of 2PE efficiency. Compensation strategies have been developed, including, for temporal dispersion, extending the laser pulse duration [73] or pre-chirping the laser pulse with a pair of prisms [58], and, for spatial dispersion, introducing a fixed grating [74] or an acousto-optic modulator [58] in the beam path to counteract the effect of the AODs.
Random scanning AOD systems have mostly been employed to perform multi-point calcium imaging in neurons [75–77], or (albeit less frequently) to perform photolysis of caged neurotransmitters [74, 78]. Applications in optogenetics include 1PE photoactivation of ChR2 and ChiEF (an improved ChR2 variant with a large plateau conductance and a fast closing rate [79]) in cell cultures, in mouse brain slices and in vivo in drosophila, with the goal of studying synaptic connectivity [80, 81]. Action potentials were generated in a neuron by defining a pattern of illumination points covering the soma and scanning the laser across those points in an ultrafast manner (10–50 μs/site). This resulted in a temporal resolution shorter than 10 ms (<1 ms in brain slices). In brain slices, lateral resolution of photoactivation was limited by scattering to about 10 μm. A similar system was developed to study dendritic integration by using 1PE of ChR2 at multiple points on the dendritic tree to mimic multiple synaptic inputs converging into the cell soma in physiological spatiotemporal patterns [82].
3D scanning with AOD-based systems can be performed using the same methods described in the case of GMs (i.e. coupled with axial movement of the objective or remote focusing) [83]. Alternatively, 3D random access scanning can be obtained by addressing the AODs with an acoustic wave of linearly varying frequency [75, 84, 85]. Compact 3D random access scanning systems have also been demonstrated, by making use of low-repetition rate lasers (80 kHz to 1 MHz) and synchronizing the acoustic wave addressed to the AODs with the laser pulses [86, 87]. Recently, 3D random access scanning systems based on AODs have been used to perform fast 3D calcium imaging in awake, behaving mice [88, 89]. However, no 3D scan AOD-based applications in optogenetic stimulation have been reported yet.
2.3. Scanning-based two-photon light-targeting optogenetics
Although 1PE-scan approaches represent an important component of light-targeting photostimulation strategies, they are limited by short penetration depth and poor 3D resolution. These limitations can be overcome by replacing visible light illumination with 2PE [52, 53].
The introduction of two-photon laser-scanning microscopy (2PLSM) a few decades ago fostered high-resolution structural and functional imaging in living brain tissues at unprecedented depth, marking a dramatic turning point in neuroscience microscopy [90, 91]. The advances brought by 2PLSM over 1PE techniques are mainly ascribed to two key factors: the nonlinearity of the 2P absorption process that prompts high-resolution 3D localization of fluorescence and the use of infrared (IR) light that reduces scattering and favors deep light penetration in tissues. It follows that the scan of a focused femtosecond-pulsed beam over the specimen permits in-depth 3D imaging in highly scattering media, enabling the visualization of the inner layers of the mammalian brain, previously unobservable in living animals [90, 91].
The idea of spurring a similar breakthrough in optogenetics by straightforwardly adopting a 2PE diffraction-limited spot to selectively pinpoint individual neurons deep in the brain has been initially sought, but it rapidly showed limitations due to the low conductance of channelorhodopsin channels. Indeed, the low single-channel current influx prevents the generation of action potentials by simply activating the few ChR2 molecules contained in a femtoliter 2PE volume. Moreover, compared to typical fluorescent molecules, ChR2 exhibits a relatively high 2P absorption cross-section (260 Goeppert–Mayer at 920 nm) [92] and a long activated state lifetime (nearly 10 ms) [10], which favors rapid ground-state depletion, thus making it impossible to attain suprathreshold membrane depolarization by simply increasing the illumination power [92].
To overcome these limitations, in 2009 Rickgauer and Tank refined the strategy for 2P photostimulation by pursuing a sequential whole-cell ChR2-channel recruitment through fast scanning of a low-NA Gaussian beam across the cell soma [92]. The key concept here is that if the total scanning time, Ts, is shorter than the decay time of the light-gated current, τoff, photocurrents serially evoked in different points on the cell surface sum together, eventually leading to spiking (figures 3(a)–(c)). For a specific opsin, the efficiency of the photostimulation process is thus a trade-off of a series of parameters controlling the scanning process including: Ts, which determines the summation rate of the photo-evoked current; the illumination extension on the cellular membrane, which determines the quantity of light-gated channels simultaneously activated in a single (x, y) location of the scan; the scan speed and the illumination power, which together determine the excitation rate per location.
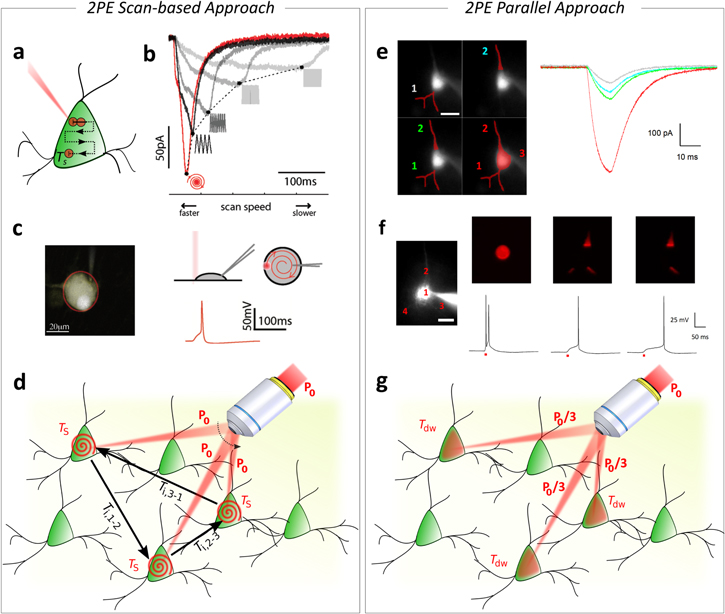
Figure 3. 2PE light-targeting methods. (a) Schematic representation of a 2PE illumination spot (red spot, diameter in the micron range) scanned across an opsin-expressing cell in a time Ts. (b) Scanning-based photocurrents summation effect. Reproduced from [92] with permission of PNAS. Photocurrents stimulated by scanning a 2PE Gaussian spot (NA = 0.2) across a cell using different scan speed. Raster scan times were varied by changing the number of lines in a fixed-area raster. Currents stimulated using spiral-scan trajectories are shown in red. Traces represent average response from three or more trials. (c) Generation of action potentials (APs) by 2PE scanning. Reproduced from [92] with permission of PNAS. (Left) 2PE fluorescence image of a patch-clamped neuron filled with Alexa 594 in culture. Red outline indicates the outer boundary used to designate a spiral-scan trajectory. (Right, top) Geometry of spiral-based scanning 2PE stimulation (shown in side view and from the top). (Right, bottom) Representative trace of action potential (AP) generation by illuminating the cell shown on the left with a 2PE spiral scan with Ts = 32 ms (NA = 0.3,  = 7.9 × 1054 ph2 cm−4 s2) (adapted from [92]). (d) Multi-cell targeting in scan-based approaches enabled by serially redirecting an illumination beam of power P0 on three different neurons with an inter-location time from the nth to the mth neuron Ti,m-n and a soma-targeted spiral scan time per cell Ts. (e) 2P photoactivation of neuronal compartments with patterned illumination. Reprinted by permission from Macmillan Publishers Ltd: Nature Methods [50], Copyright (2010). (Left) Fluorescence image of a ChR2 positive neuron filled with Alexa 594 in a brain slice, with superimposed excitation patterns (red). (Right) Photo-evoked currents obtained by stimulating a basal dendrite (1, light gray), the apical dendrite (2, cyan), both apical and basal dendrites (1 + 2, green), and apical dendrite, basal dendrite and soma (1 + 2 + 3, red) (average on three trials in every case, λexc = 850 nm, 10 ms pulses, 0.25 mW μm−2). Scale bars: 10 μm. (f) (Left) Fluorescence image of a ChR2 positive neuron filled with Alexa 594 in a brain slice. (Right) Excitation patterns (top) and corresponding photo-evoked potentials (bottom): 15 μm spot on soma (position 1), apical and basal dendrites (positions 2, 3, and 4), apical and right basal dendrite only (positions 2 and 3) (three trials in every case, λexc = 920 nm, 10 ms pulses, 0.6 mW μm−2). Reprinted by permission from Macmillan Publishers Ltd: Nature Methods [50], Copyright (2010). (g) Multi-cell targeting in patterned approaches enabled by simultaneously redistributing an illumination beam of power P0 on three different neurons (P0/3 power per neuron) with Tdw dwell time.
Download figure:
Standard image High-resolution imageIt is important to note that, within this framework, the overall temporal resolution to sequentially photostimulate N cells previously expressed in equation (1), needs to be further developed as:

where the photoactivation dwell time per cell now depends on the cell scan parameters: the total scan length within the cell ls, and the scan speed vs (assumed as constant) (figure 3(d)). If cells are not activated using a continuous scan, but instead by serially photostimulating a discrete number n of illumination positions per cell [93], equation (2) can be further decomposed as ![$T=[n\cdot ({T}_{{\rm{i}}}^{C}+{T}_{{\rm{d}}{\rm{w}}}^{C})]\cdot N+{T}_{{\rm{i}}}\cdot [N-1],$](https://content.cld.iop.org/journals/2040-8986/19/11/113001/revision1/joptaa8299ieqn4.gif) where
where  indicates the dwell time per position and
  is the inter-position time within the cell [94].
Rickgauer and Tank demonstrated for the first time reliable induction of AP under 2P excitation in ChR2-expressing neuronal cultures, by continuously scanning along a spiral trajectory targeted on the cell body for Ts ≈ 30 ms, with a 2PE focal volume adjusted to match the cell size in the z-dimension (reducing the nominal objective NA from 0.8 to 0.3) and to simultaneously encompass enough light-gated channels from the top and bottom membrane of the cell [92].
A step forward for efficient photostimulation with scanning approaches was possible thanks to the engineering of the red-shifted C1V1 channelrhodopsin series (VChR/ChR2 chimeras) [38]. These actuators exhibit several folds slower turning-off time (nearly 60 ms [10]) and higher amplitude photocurrents compared to ChR2, thus appearing as a more valuable actuator for current integration in sequential photostimulation approaches. Raster scanning optogenetic activation with standard 2PLSM was demonstrated in brain slices expressing C1V1 in two works published simultaneously in 2012 [95, 96]. After discussing how the integration of C1V1 photocurrents depends on some 2PLSM imaging parameters (i.e. illumination point spread function (PSF) size, scan-line speed and scan-line number), the authors demonstrated the induction of APs by raster scanning the somatic region of a neuron (10 × 10 μm or 20 × 20 μm) with low-NA beam (NA 0.5), (figures 4(a) and (b)). They used similar illumination conditions (P = 20 mW, λ = 1040 nm, 140 fs pulses, 80 MHz [95] or P = 30 mW, λ = 1064 nm, 300 fs pulses, 80 MHz [96]), but slightly different pixel size and scan-line speed conditions (unidirectional scan, 50–80 μs/line, 15–25 lines/frame, total Ts ≈ 4–5 ms [95] and bidirectional scan, 2 ms/line, 32 lines/frame, Ts ≈ 70 ms [96]). Spikes could be evoked with lateral (Δwr) and axial (Δwz) spatial resolutions at full width at half maximum (FWHM) ranging from (Δwr ≈ 10 μm; Δwz ≈ 12 μm) in [95] to (Δwr ≈ 12 μm; Δwz ≈ 30 μm) in [96]. Notably, the spatial decay of voltage-clamp photocurrents showed FWHM beyond those intervals, ranging from (Δwr ≈ 15 μm; Δwz ≈ 25 μm) in [95] to (Δwr ≈ 50 μm; Δwz ≈ n.d.) in [96]. These results indicate that out-of-focus light can generate significant sub-threshold membrane depolarization even when the excitation spot is placed several microns away from the target cell.
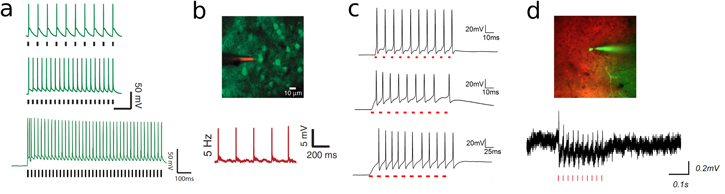
Figure 4. 2PE light-targeting control of spiking. (a) Representative traces of two-photon laser-scanning microscopy-driven spike generation under 1040 nm illumination in neurons expressing C1V1T/T-ts-EYFP in hippocampus and prefrontal cortical slices [20×/0.5-NA obj; dwell time per pixel: 3.2 μs; scan resolution: 0.6 μm per pixel; line scan speed: 0.19 μs−1; P = 20 mW] and (b) in layer (2/3) somatosensory neurons transduced with C1V1T-p2A-EYFP in vivo (same parameter as in (a)). Reprinted by permission from Macmillan Publishers Ltd: Nature Methods [95], Copyright (2012). (c) Representative traces of computer generated holography (CGH)-driven spike generation under 1030 nm illumination in layer 2/3 interneurons expressing rAAV8/Synapsin-Chronos-GFP [Tdw = 2 ms; f = 100 Hz; P = 0.12 mW μm−2] [125] (top); AAV8-Syn-CoChR-GFP-WPRE [Tdw = 3 ms; f = 100 Hz; P = 0.1 mW μm−2] [125] (middle) and AAV1-CamKII-ReaChR-p2a-YFP [Tdw = 10 ms; f = 40 Hz; P = 0.04 mW μm−2)] [126] (bottom) in visual cortex brain slices. (d) CGH-driven spike generation under 1030 nm illumination in CoChR-expressing neurons in layer 2/3 of visual cortex in vivo [Tdw = 3 ms, f = 40 Hz, P = 0.1 mW μm−2] (unpublished data, Emiliani group).
Download figure:
Standard image High-resolution image3. Parallel approaches
3.1. Basic concepts
As an alternative to serial photostimulation approaches, parallel light-targeting strategies can be used. Parallel (or scanless) illumination methods generate patterned photoactivation by tailoring the light along intensity motifs adapted to the morphology of the sample, including 3D distributions of multiple diffraction-limited spots or complex 3D extended patterns.
Extended spatial flexibility is thus enabled and different experimental requirements can be matched, for example targeting illumination to spines or dendritic branches. Importantly, in this case, light simultaneously reaches all the targets. High temporal flexibility is then permitted, as temporal resolution is unrelated to the number of targets or the kinetics of the opsin and only depends on the photoactivation dwell time needed to trigger an AP on a single cell  . Multi-target spatiotemporal flexibility of photostimulation, however, requires more powerful laser sources compared to scan-based strategies. Indeed, illuminating N neurons at once implicates that the laser source must supply a power equivalent to
  where Pth represents the illumination power threshold to elicit an AP or a detectable fluorescent functional response (via Ca- or VSDs) on a single cell. However, as we will detail in the following sections, the power levels commonly needed for patterned photostimulation are well within the range of commercially available high-power laser sources, ensuring that large numbers of cells can be synchronously addressed under 2PE regime. Nevertheless, attention should be paid to keep light-induced overall heating below damage threshold levels in multi-targeted photostimulation experiments.
Parallel light-targeting methods can be adapted for 1PE or 2PE regimes. In the latter case, higher penetration depth and better axial confinement can be reached. However, it is important to note that radial and axial extensions of an illumination pattern are proportionally related [97], so that when large illumination motifs are generated, the overall axial resolution can rapidly deteriorate even under 2PE regime. In order to maintain high axial confinement of the excitation independently on the lateral extension of the illumination pattern, the temporal focusing (TF) technique [98] can be combined with 2PE parallel methods.
Parallel techniques are practically realized by coupling the microscope objective with spatial light modulators (SLMs) acting either on the phase (phase modulation techniques) or on the intensity (intensity-modulation techniques) of the incident beam. In both cases, arbitrarily-defined intensity distribution of light can be obtained at the objective focal plane. In the following sections, we will discuss concepts, implementation, and optogenetic applications of phase-based and intensity-based parallel light-targeting techniques. Individual sections will be devoted to describe methods coupling TF with 2PE parallel photostimulation and their implementations for 3D light-targeting.
3.2. Implementation of parallel light-targeting methods
3.2.1. Intensity-modulation techniques
Using intensity-modulation techniques, illumination patterns are obtained by directly shaping the spatial intensity of light in a plane conjugated to the sample plane (figures 5(a) and (b)). To this end, two types of technologies have been exploited. First, micro-light-emitting diode (micro-LED) arrays can be imaged into the sample [99–101]: light shaping is obtained by independently turning on/off each emitter of the array (figure 5(b)). Alternatively, an amplitude SLM uniformly illuminated by an extended light source might be used [18, 102–116]. In this case, each pixel of the SLM independently modulates the local light intensity. Amplitude SLMs can be of two types: digital micromirror devices (DMDs) and liquid crystal (LC) SLMs (LC-SLMs). DMDs are the most commonly used [102–114]. DMD pixels are micro-mirrors that can switch between two angles (+12° and −12° compared to the DMD plane), reflecting light either toward the sample, or to a beam dump (figures 5(a) and (b)). Amplitude LC-SLMs use a very different technology: pixels are made of twisted nematic LCs, which rotate light polarization of an angle determined by a voltage applied to the LCs with transparent electrodes. Modulation of light polarization is then transformed into a modulation of light intensity using a polarizer, also included in the LC-SLM.

Figure 5. Parallel light-targeting methods. (a) Optical devices used to spatially modulate the illumination in parallel light-targeting optogenetics applications: micro-LED array, DMD, and LC-SLM. Light intensity can be directly shaped via micro-LED arrays (left) by independently turning on/off each emitter of the array or via DMD arrays (middle) by independently switching each micromirror between two angles that reflect light either towards the sample (ON actuators) or elsewhere (OFF actuators). Spatially controlled phase modulation of the illumination is provided via pixelated LC-SLMs (right) composed by pixels of twisted nematic LC molecules (in yellow) embedded between two transparent electrodes. Upon application of a voltage Vi on the ith pixel, LC molecules rotate resulting in a variation of the local refractive index and, thus, of the phase delay φi of the reflected light. (b) Patterned intensity-modulation setups. Illumination intensity patterns in the sample plane (objective FFP) are obtained by spatially shaping the intensity of the light by means of LEDs (top) or DMDs (bottom) placed in a conjugated plane (FFP*). The light distribution in FFP and FFP* only differ for a spatial scaling factor corresponding to the magnification of the optical system. (c) CGH setup. Illumination intensity patterns in FFP are obtained by modulating the phase of the illumination beam in the BFP of the objective by means of an LC-SLM placed in a conjugated plane (BFP*). Inset: CGH pattern generation process: a binary image is designated as the target illumination (here tailored after the shape of a neuron) (left); a phase-only modulation is calculated via Gerchberg–Saxton (GS) algorithms and addressed on the SLM in the form of a gray-scale image where each gray level is associated to a phase delay φi ranging from 0–2pi (middle); a speckled holographic-based intensity distribution is generated in FFP (here visualized by exciting a thin fluorescent layer under 2PE regime) (right). (d) Generalized phase contrast (GPC) setup. Illumination intensity patterns in the FFP are obtained by modulating the phase of the illumination beam by means of an LC-SLM placed in an FFP* and a phase contrast filter (PCF) placed in a BFP* plane. Low spatial frequency content, 'reference wave', and higher spatial frequency content 'signal wave' are highlighted in dark and light blue, respectively. Inset: GPC pattern generation process: a binary image is designated as the target illumination (left); a binary image matching the target image, but encoding for 0/π phase shifts is addressed on the SLM (middle); a uniform intensity distribution corresponding exactly to the phase pattern on the SLM is generated in FFP (right).
Download figure:
Standard image High-resolution imageDepending on the number of available pixels in the modulation device, different compromises can be obtained on lateral resolution and FOE. For SLM-based systems, which have a high number of pixels (from 1024 × 768 up to 2560 × 1600), the optimum resolution is achieved when the optical path is designed so that pixel size at the sample plane is of the same size or slightly smaller than the Airy disk; the lateral resolution is then limited by the NA of the microscope objective used to project the illumination pattern into the sample rather than the pixel size [103, 104]. The FOE is determined by the size of the SLM array at the sample plane. For example, using a DMD, Wang et al obtained a sub-micrometric lateral resolution with an excitation field of 0.87 × 0.65 mm2 [103]. For micro-LED arrays, which have a smaller number of pixels (e.g. 64 × 64) [100], the optical system is usually designed so that the pixel size at the sample plane is equal to the smallest ROI to target (e.g. a cell soma), i.e. generally larger than the Airy disk. The number of pixels sets the maximum number of distinct photostimulation points. For example, an excitation field of 0.3 × 0.3 mm2 was achieved with a 64 × 64 micro-LED array, with a resolution >3 μm [100]. In the same system, an excitation field of 3 × 3 mm2 with a resolution >30 μm was implemented, by changing the magnification of the telescope imaging the micro-LED array onto the sample [100]. Recently, micro-LEDs with 90 × 90 elements have been demonstrated [101], but the number of pixels is still orders of magnitude lower than for amplitude SLMs.
The axial resolution of intensity-modulation systems using incoherent light sources has, to our knowledge, not yet been fully characterized. However, because they make use of 1PE, they ultimately share the same limitations on axial resolution as other 1PE techniques. Nevertheless, single-cell photoactivation was demonstrated in simple organisms such as the C. elegans [104], or in the zebrafish spinal cord [106]. In the zebrafish olfactory bulb, the photoactivation axial resolution was about 10 μm [111].
When implementing intensity-modulation techniques with amplitude SLMs, several alternatives can be considered. First, DMDs can be purchased as developer kits from suppliers such as Wintech, Vialux, DLi Innovations or Marubun [108–111, 113]. In this case, the micromirror array is mounted on a circuit board including on-board memory that can store >10 000 images. Image storage on the circuit board allows updating of the displayed image at extremely fast frame rates; the maximum frame rate depends on the image size and can reach 22.7 kHz for XGA images (1024 × 768 pixels). Alternatively, turnkey DMD systems are now available as attachments for commercial microscopes, and represent the most straightforward solution for implementing intensity-modulation techniques [107]. Finally, a popular and cost-effective solution consists of adapting a commercial video-projector, which includes either a DMD [102, 105, 112] or three LC-SLMs [18, 115, 116] (for three colors). Protocols have been published to guide the user in this adaptation [115]. With this solution, however, the frame rate is often limited to about 60 Hz. When performing multicolor experiments, choosing a projector based on an LC display technology can be advantageous [18, 115, 116]. Indeed, such projectors include a broadband light source separated into three colors (blue, green, red) that can be simultaneously and independently modulated with one of the three LC-SLMs, before recombination into a single image. Using the DMD technology, multicolor experiments have been performed with setups including a single DMD used to alternatively modulate each color [103, 107–109, 117].
Intensity modulation has several advantages. First, as previously mentioned, optical setups are simple and cost-effective, and can be easily adapted to commercial microscopes. Second, since the SLM or LED matrix is imaged at the sample plane, the pattern addressed to the array is simply equal to the desired intensity distribution at the sample plane, with a spatial scaling factor equal to the magnification of the optical system (figure 5(b)). Third, a variety of light sources can be used: continuous lasers [108–111, 113], but also cost-effective incoherent sources such as LEDs [102, 103], or white lamps [104, 115–117]. Finally, even if this has been exploited in a few examples only [110, 111], another key advantage of intensity modulation is that illumination patterns can be switched at high speed (>10 kHz for DMDs and >1 kHz for micro-LED arrays [100]) allowing mimicking fast alternation of physiological patterns for neuronal activation (e.g. reproducing fast circuit dynamics).
Intensity-modulation techniques have been used to photoactivate optogenetic actuators in a number of biological systems and organisms: neurons in culture [99, 100, 103, 113, 114], mouse [100, 112] or rat [102] retina ex vivo, C. elegans [104, 108, 109, 115, 116], zebrafish [106, 107, 110, 111, 117], mouse olfactory bulb in vivo [105, 118]. Photoactivation has been performed at different spatial scales, from targeting subcellular regions of neurons in culture [100, 113, 114], to single cells in small organisms [104, 106], groups of cells [105, 107], or even full organisms [18].
The main drawback of intensity modulation is a poor efficiency when photoactivating sparsely distributed targets. In this case, in amplitude SLM-based approaches, most of the light incident on the SLM is rejected away from the sample (DMD) or absorbed by the polarizer (LC-SLM). Similarly, with micro-LED arrays, most of the individual emitters are turned off. Nevertheless, since optogenetic actuators have a very low activation threshold and light sources can be quite powerful, 1PE of optogenetic molecules has been successfully performed [100, 103–105, 107]. The low efficiency of intensity-modulation techniques has, however, prevented their use with 2PE. Therefore, for experiments requiring photoactivation at high precision deep in tissue, users should consider using 2PE techniques combined with rapid scanning and/or efficient phase modulation techniques, such as computer generated holography (CGH).
3.2.2. Phase modulation techniques
3.2.2.1. CGH
CGH is a wavefront modulation technique, which allows shaping the laser light into different profiles, including 3D distributions of diffraction-limited spots and arbitrary extended patterns. First applied in the field of optical tweezers [119, 120], CGH was adapted as a technique for photostimulation about ten years ago [121–126].
The basic concept consists of modulating the phase of the illumination beam at the BFP (i.e. the Fourier plane) of a microscope objective, to achieve intensity modulation in the FFP (i.e. at the sample plane) (figure 5(c)). Practically, phase modulation of the illumination beam is provided by pixelated LC-SLMs, where reorientation of the LC molecules of each pixel upon application of an electric field dynamically modulates the local refractive index. Phase modulation at the BFP is then obtained by coupling the LC-SLM plane and BFP through a telescope.
A central point of the technique is to find the correct phase modulation at the SLM in order to obtain the desired intensity pattern at the vicinity of the FFP of the objective. Following the laws of diffractive optics, the electric fields at the BFP and FFP are mathematically connected by Fourier transforms. Thus, given the electric field at the Fourier plane of the objective, we are able to predict the electric field generated in the FFP and vice versa. An exact solution for the Fourier transform of the complex electric field at the FFP would require both phase and amplitude modulations at the Fourier plane. Although independent amplitude and phase control can be implemented, this is not a good option for photoactivation, because of the power loss caused by amplitude modulation. Full control of the electric field can also be achieved with a single phase-modulation SLM (the beam being reflected twice on the SLM) [127], but this configuration may be incompatible with 2PE photoactivation, because it requires that the beam is focused on the SLM, which may reach its damage threshold.
Algorithms allowing beam shaping by phase-only modulation (with only one reflection at the SLM) have thus been considered. Various strategies have been developed, both in the case of a 3D distribution of spots or continuous patterns, which are detailed in [120, 123, 128]. In the case of a 3D distribution of spots, a simple algorithm is the so-called 'prisms and lenses' [129]. Its principle is easily understood in the case of a single holographic spot; a constant phase at the SLM generates a spot at the focal point of the objective, while a tilted phase (prism) at the SLM results in a lateral displacement of the spot and a parabolic phase (lens) results in an axial displacement. For multiple spots, the electric fields corresponding to each holographic spot are summed at the SLM plane, and the phase of the resulting electric field is sent to the SLM. For generating 2D continuous patterns, Gerchberg–Saxton (GS) iterative algorithms are usually used [130]. More precisely, in this case, the calculation can be performed by computing iterative Fourier transforms between the FFP and BFP, the free parameter being the phase at the FFP. The algorithm converges faster if an initial random phase is chosen for the pattern. However, choosing the phase at the sample plane as a free parameter has a significant drawback, as the electric fields at neighboring points have pseudo-random phases and then interfere either constructively or destructively, causing intensity inhomogeneities called speckle. The effect is more pronounced in 2PE CGH, because 2PE photoactivation is proportional to the square of the excitation intensity (intensity inhomogeneities are of the order of 20% and 50% for 1PE and 2PE, respectively [97, 121]). Speckle patterns can be a problem, for example, when stimulating a subcellular region such as a small dendritic segment. Several solutions have been proposed to reduce spatial inhomogeneities, mostly based on time averaging over multiple illumination patterns (at the expense of temporal precision). These patterns can be obtained by adding a rotating diffuser on the holographic beam [121], by rapidly switching between various holograms generated with different initial conditions [131], by cyclic shifting of a unique hologram [132], or by speckle-free phase-based algorithms [133].
CGH optical lateral resolution is related to the smallest obtainable light pattern, that is a diffraction-limited Gaussian spot with FWHM equal to Δx ≈ λ/2NAeff, with NAeff the effective NA (with NAeff < NA for an under-filled pupil). Spatial localization accuracy can be linked to the minimum illumination repositioning achievable by spatially modulating the phase of the incoming light beam. That has been quantified in holographic optical tweezers and is ultimately related to the number of pixels and gray levels of the SLM, reaching nanometer-range repositioning for typical SLM models [134]. The axial resolution of CGH diffraction-limited spots is  For CGH extended circular patterns, the axial resolution can be analytically calculated by modeling the beam at the FFP as a Gaussian envelope of radius
  given at 1/e2 of the maximum intensity, multiplied by a speckle pattern, as is described in [135]. By calculating the fluorescence intensity for 1PE and 2PE, we can derive the axial resolution, defined as twice the axial distance at which the intensity drops to 50% of the maximum (FWHM) [136]:

where  is the speckle size and
  The axial resolution is thus significantly better than that obtained with low-NA Gaussian beams when exciting the same excitation area. Indeed, for large illumination patterns
  the CGH axial resolution scales linearly with W, while for focused Gaussian beams (
 ) it is proportional to W2 [121].
The lateral and axial FOE are determined by the diffraction from a single pixel of the SLM, and are characterized by illumination intensity decreasing when moving away from the optical axis and the focal plane, respectively [123, 137]. The lateral extension of the FOE, FOEx, is related to the size of an SLM pixel at the BFP of the objective a, and to the focal length of the objective in air fobj:  [123, 137]. Underfilling the back aperture of the objective therefore gives a higher excitation field (smaller a) at the expense of a degraded lateral resolution (smaller NAeff). The axial excitation field, FOEz (for 3D spots), can be expressed as
  [123], where n is the refractive index of the immersion medium.
Because of the non-perfect nature of SLMs, care must be taken while implementing the technique. A fraction of light energy is not modulated by the SLM. This so-called 'zero-order' light is located at the center of the excitation field (on the optical axis) and has to be rejected. It can be blocked in a plane conjugated to the objective focal plane, or it can be axially displaced outside of the sample by illuminating the SLM with a slightly converging beam, while maintaining the target intensity at the desired axial position around the objective focal plane using a suitable hologram [124, 138]. Zero-order can be alternatively removed in 2PE by introducing controlled optical aberrations in the excitation beam that spread the zero-order spot over a large area (i.e. by placing a cylindrical lens in front of the SLM), thus decreasing the 2PE effect [139]. Those aberrations can then be pre-compensated by the LC-SLM for the modulated part of the beam [139]. In addition, cross-talk between nearby pixels of the SLM needs to be taken into account [140]. This effect results in filtering of the highest spatial frequencies of the displayed phase pattern. In order to compensate for this effect, it is possible to use algorithms that multiply the Fourier transform of displayed phase patterns by a 2D correction function, in order to enhance high spatial frequencies and partially balance for spatial filtering [140].
CGH under 1PE has found wide applications for neuronal uncaging [121, 124, 137, 141, 142] and recently for optogenetic stimulation [143, 144].
3.2.2.2. GPC
As mentioned above, CGH yields only an approximation of the desired intensity pattern in the focal plane of the objective due to the fact that it relies on phase-only modulation. This results in a speckled pattern, which lacks uniformity.
An alternative technique for projecting light patterns is common path interferometry (CPI) [145]. The Zernike phase contrast method [146] is certainly, at least in the fields of medicine and biology, the most widely used implementation of CPI. The idea behind Zernike phase contrast imaging is the approximation that the spatial phase distribution φ(x, y) is small, allowing then a first-order Taylor expansion : exp(iφ(x, y)) ≈ 1 + iφ(x, y). Within the framework of this « small-scale approximation », a single lens and simple spatial filtering can be used to separate the on-axis (reference wave) and off-axis (signal wave) light. Adding a π/2 phase shift between the two waves enhances the contrast.
The GPC technique [147, 148] builds on the same idea, but lifts the requirement of small-scale variation. A phase pattern, here created by an SLM, is generated in a plane conjugated to the objective FFP (figure 5(d)). A first lens allows for the separation of the incoming wave in the Fourier plane into two parts, one of low spatial frequency content (reference wave) and one higher spatial frequency content (signal wave). In the Fourier plane, a phase contrast filter (PCF) will selectively introduce a phase delay of π to the reference wave with respect to the signal wave. A second lens will then recombine the two waves, and the intensity of the interference pattern in the projection plane will correspond exactly to the phase pattern imposed on the SLM in the conjugate plane (figure 5(d)). This simple description of the principle of the GPC technique illustrates its key advantages over CGH. First, the desired intensity profile is directly transposed to the SLM, so no iterative algorithm is required to compute the phase pattern. Second, and more important, uniform continuous 2D patterns (without speckle) can be obtained.
As is the case for CGH, the lateral resolution attainable is limited by the NA of the microscope objective and is ≈λ/2NA. However, because the uniformity of the projected pattern is related to the uniformity of the phase of the electromagnetic wave in the projection plane, the axial resolution will be of the same order as the one obtained with a low-NA Gaussian beam, ∝D2/λ, where D is the lateral dimension of the pattern. This would seriously hinder the usefulness of the technique, but it has been successfully demonstrated that GPC can be combined with TF [50], thus enabling high axial confinement.
3.3. 2PE with patterned illumination
3.3.1. TF
The main limitation when illuminating the sample with large excitation areas is that the optical axial resolution is, in some cases, seriously compromised, hampering the possibility of achieving optogenetic neuronal control at cellular and subcellular resolution. A few years ago, it was demonstrated that the axial resolution for laterally extended patterns could be greatly enhanced by combining 2P-CGH and 2P-GPC with the technique of TF [50, 149].
TF was demonstrated for the first time in 2005 [98, 150] as a way of enhancing optical sectioning and reducing background excitation in wide-field 2PE microscopy. The 2PE fluorescence signal, S2PE, is proportional to the peak intensity:  where E is the pulse energy, Δt is the pulse duration, and A is the area of the excitation beam [52]. In conventional 2PE microscopy, optical sectioning is reached by modulating the size of the excitation beam along the axial direction, the beam reaching its smallest size at the focal plane of the objective and quickly extending beyond this plane. Increasing the beam's spot size degrades optical sectioning. In TF, the idea is to modulate the laser pulse duration during propagation; the light pulse is compressed as it propagates toward the focal plane, reaching its shortest value at the focal plane and stretching again as it propagates beyond. The peak intensity is decreased away from the focal plane. Therefore, out-of-focus 2P absorption, and thus 2P excitation, is less probable.
Experimental realization of TF may use a diffuser in the case of ultrashort pulses (∼20 fs) [98] or a diffraction grating [98, 150] for laser pulses  100 fs. The diffuser or grating is imaged onto the sample via a telescope formed by a regular lens and the objective (figure 6). The diffuser or grating disperses the frequencies comprising the spectrum of the femtosecond pulse towards different angular directions. A reflective grating has the advantage over the diffuser or a transmissive grating in that it can be designed to maximize the diffraction toward the microscope's optical axis when it is illuminated from an angle, further increasing the optical path difference between dispersed spectral components. These components are then collimated by the first lens and recombined at the focal plane of the objective. Rays corresponding to different spectral components propagate through the imaging system following different optical paths, eventually recombine in phase at the objective focal plane, thus recovering the original short pulse duration (figure 6(a)). In all other planes, the rays arrive with a relative phase offset, resulting in illumination of this plane for a longer duration (spectral dispersion) [49].
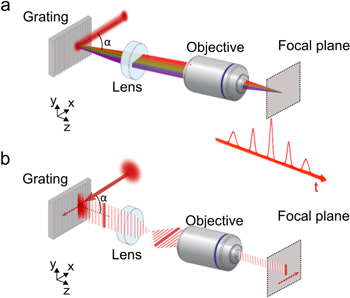
Figure 6. TF of ultrashort pulses. In the spectral representation (a) TF can be interpreted by the in-phase recombination at the objective focal plane of the spectral frequencies comprising the ultrashort pulses, after their dispersion on the diffraction grating. In the temporal representation (b) intersection of the beam plane with the grating plane at a certain moment in time corresponds to a line that scans the grating with a velocity of  where c is the speed of light. The sample is then line-scanned at a speed of
  where M is the telescope magnification. Reproduced from [149]. CC BY 3.0.
Download figure:
Standard image High-resolution imageAn equivalent interpretation is obtained by examining TF in the time domain. Considering a Gaussian beam illuminating the diffraction grating for wide-field TF, the intersection of the beam's plane with the plane of the grating at a given moment in time is a line. This line is reflected off the grating and imaged through the telescope at the focal plane of the objective (figure 6(b)). Similarly, at the next moment another line is reflected off the grating as the pulse propagates, and so on until the whole surface of the Gaussian beam scans the grating. Thus, the sample at the focal plane of the objective is continuously scanned by a line that moves at a velocity of  where
where  is the velocity at which the pulse scans the grating, c is the speed of light in vacuum, α is the illumination angle of the grating, and
  is the magnification of the telescope [98].
The axial resolution achieved for wide-field TF depends on the choice of several optical parameters, such as the grating groove density (or scattering angle of the diffuser), the illumination angle α, the magnification of the telescope, M, and the NA of the objective, as well as the pulse characteristics, such as the laser spectral bandwidth Δλ. More precisely, to achieve the optimal axial resolution in a TF system for a given pulse duration Δt and incidence angle α, the magnification should be such that, at any given time, the illuminated area at the grating (or diffuser) is imaged onto a diffraction-limited spot [98], i.e.:  When this condition is satisfied, the achieved axial resolution of the temporally focused beam is equivalent to the one of multiphoton line-scanning microscopy [98, 151].
Since its demonstration in 2005, TF has been used in combination with CGH for improving the axial confinement of 2P holographic spots [97], in sum frequency generation [152] and in lithographic microfabrication [153]. The first application of TF in biology appeared in 2010, when researchers used it with low-NA Gaussian spots [154] or with GPC-light patterning [50] for efficient 2P optogenetic activation. Since then, TF is gaining more and more place in the rig of optical microscopy and particularly in neuroscience studies. It has been used in combination with HiLo [155], and structured illumination microscopy for imaging [156, 157], with CGH [158] or low-NA Gaussian beam illumination [159–161] for fast calcium imaging of neuronal activity, as well as for tissue ablation [162]. Moreover, the increasing interest in using TF in biological applications involving light excitation in scattering tissue initiated extensive studies on the propagation of temporally focused beams through scattering media. Temporally focused wide-field excitation has proved to be more robust both to optical aberrations [163] and scattering [149, 164, 165] than non-temporally focused wide-field excitation. In the following sections, we will review in more detail applications of TF in 2P optogenetics.
3.3.2. 2PE optogenetics with parallel approaches
The first demonstration of 2P optogenetic activation using spatially shaped and axially confined patterns was reported by Papagiakoumou et al [50] (figures 3(e) and (f)). In this work, the combination of TF with GPC was used for efficient activation of ChR2-expressing neurons in layer V of the cortex in coronal mouse brain slices. Speckle-free-GPC patterns revealed unprecedented precision for selective excitation of subcellular processes, like basal and apical dendrites of pyramidal cells [50] and enabled the use of low-excitation light intensities (0.3–0.6 mW μm−2), thus avoiding out-of-focus excitation and preserving lateral and axial resolution (figures 3(e) and (f)).
A few years later, temporally focused CGH beams were used for photoactivation of C1V1-expressing neurons in brain slices, leading neurons to spike under short (1 ms) illumination time with low light intensity (0.5 mW μm−2) [149]. More recently, holographic photostimulation with pulses from an ytterbium chirped-pulse amplifier (20 μJ output pulse energy) was used for 2PE-CGH activation of a broad number of recently developed opsins [166, 167] including Chronos [125], CoChR [125] and ReaChR [126]. These last studies conducted on opsin-expressing cellular cultures and acute brain slices of mouse visual cortex, permitted us to refine 2PE scanless-based light-targeting methods on two key aspects: suitable range of excitation intensity and temporal control. Compared to conventional Ti:sapphire oscillators, low-repetition high-peak-power amplified lasers enabled a significant reduction of the average power needed to elicit an AP [126]. In terms of 2PE-CGH photostimultion temporal performances, in particular, two main features emerged. (i) Independently of the opsin kinetics, for adequate opsin expression and light-sensitiveness, it was possible to find appropriate conditions for reliable AP generation with millisecond temporal resolution and sub-millisecond temporal accuracy [125, 126]. (ii) For opsins exhibiting fast turn-off kinetics (τoff-Chronos ≈ 3.8 ms [125]), reliable sub-millisecond timed control of high-frequency (100 Hz) light-driven firing with no extra spikes and small plateau potential was enabled (jitter per AP incrementally varying from nearly 0.2–1 ms throughout ten consecutive spikes, 2–3 ms illumination duration, P ≈ 0.05 ÷ 0.17 mW μm−2) [125], (figures 4(c) and (d)). Importantly, the use of high-energy laser pulses of short illumination duration with relatively low average power enabled a prolonged series of photostimulation trains without affecting the cellular physiological conditions [125].
Finally, temporally focused light patterns can enable specific optogenetic activation in depth, thanks to the robustness to scattering of temporally focused beams [149, 164, 168]. Coupling GPC or CGH with TF allows preserving reasonably well both the lateral and axial resolutions in tissue, which was tested for penetration depths of at least 500 μm. Molecular layer interneurons expressing ChR2 could be activated in vitro with spots of 15 μm diameter to generate relatively large inward currents (in average ∼120 pA) when recorded in voltage-clamp mode (10 ms illumination duration, average depth of 201 ± 9 μm), with ChR2 activation spatially restricted to the pattern [164]. In a more recent experiment, the robustness to scattering of temporally focused holographic beams was also proved through the zebrafish brain (depth ∼500 μm) [168].
3.4. 3D accessibility of parallel approaches
3D scanning approaches based on 'smart' design of scanning trajectories [61], remote scanning of the excitation beam with AODs [75, 85, 169, 170], electrically [83] or ultrasound [171] tunable lenses, remote focusing systems [172], or spatiotemporal multiplexing methods (to simultaneously image several axially separated planes) [173, 174] have been successfully applied to 3D calcium imaging but not to 3D excitation of optogenetic actuators.
An elegant way to address several axial planes in a remote and scanless manner is the use of CGH. The ability of CGH to shape light in 3Ds has been well known since the early times of optical holography. The first synthetic 3D holograms were built in the late 1960s [175–177] using binary phase modulation. Since then, there has been important effort focused on the development of algorithms for 3D holographic projection [178, 179]. These new algorithms have enabled the projection of multiple 3D diffraction-limited spots in applications for optical tweezers [120, 180], or neuronal stimulation by photolysis of caged neurotransmitters [137, 181, 182]. Simultaneous optogenetic excitation of several neurons in 3D for studies concerning synchronous activity in a neural circuit would require simultaneous activation with extended patterns that cover entire cell bodies and can be projected in several axial planes. This is something that can be achieved with CGH [179], but was not explored for neuroscience or any other biological application until recently [168].
Different algorithms normally used in 2Ds have been generalized for optimizing holograms for multi-plane projection, such as direct binary search algorithms that calculate the reconstruction errors in each plane by altering the phase hologram, and iterative Fourier-transform algorithms that calculate the hologram by permanently changing between object plane and phase modulation plane via Fourier and inverse-Fourier transform [179], such as the GS algorithm presented earlier. In the latter case, multi-plane projection is realized by introducing two lenses for every plane into the iteration loop. One lens simulates the reconstruction at a different depth, while the second performs the out-of-plane reconstruction. The two lenses have equal focal lengths of opposite signs to cancel each other during iteration [179].
In the work by Hernandez et al a generalized version of the GS algorithm is used to project extended holographic spots in a volume of 240 × 240 × 260 μm3[168]. In addition, for precise axial shifts, spherical aberrations have been minimized by using a spherical phase for the description of the lenses in the GS algorithm instead of a parabolic approximation that is usually used. For spot quality improvement, diffraction-efficiency intensity variations on the spots have been compensated by weighting target intensity inputs to the multi-plane GS algorithm, with low-diffraction-efficiency regions appearing brighter over those closer to the center of the excitation field [168].
Interestingly, in the same article it was possible to combine the projection of 3D extended patterns with TF for better axial confinement and better preservation of the excitation patterns in scattering tissue. This combination was not straightforward as the TF effect takes place only at the plane that is conjugated to the grating, i.e. the nominal focal plane of the objective. Therefore, in order to project temporally focused patterns in different axial planes, this temporal focus plane needs to be shifted.
Since the first demonstration of TF, researchers showed that introducing GVD in TF systems axially displaces the temporal focus plane [183–185]. However, this approach cannot be combined with CGH, because GVD-induced axial displacement depends on the autocorrelation width of the pattern at the grating, which for holographic beams is small due to their speckled intensity profile [135]. To increase the GVD-induced axial shift, the holographic spot's autocorrelation width should be increased, for instance, by performing spatial filtering in the direction where spectral frequencies are dispersed by the grating. However, this affects the quality of the spot, degrades the axial resolution, and the achieved axial displacement is restricted to a few micrometers at the sample [135]. Greater scanning ranges could be obtained by combining 2D-CGH with the optical design proposed by Dana and Shoham for axial scanning of a temporally focused line [186]. The design proposed on-axis-light propagation by replacing the standard diffraction grating (used in a reflection geometry) with a custom dual-prism grating (DPG) (transmission geometry). Mechanical translation of the DPG then allowed axial displacement of the spatiotemporal focal plane. Still, for high-NA objectives (40x) the maximum displacement was about 30 μm and mechanical translation of the DPG limited the speed of displacement.
Another limitation of these approaches is that only a single spatiotemporal focus plane could be axially shifted. To project extended patterns on multiple planes with a good axial resolution at each plane, another solution was necessary. Hernandez et al proposed to independently control the lateral and axial position of the patterns using two SLMs in the optical system (figure 7), [168]. The first SLM is used to control the lateral distribution of light in the object space (similarly to regular CGH), while the second SLM, conjugated to the first SLM and placed after the diffraction grating for TF, applies a proper spherical phase profile (lens effect) for axial displacement of the pattern at a given plane. The system enabled either remote axial displacement of a single plane, in that case over a range of 300 μm at the sample (figure 7(b)), or independent pattern generation at several axial planes (figure 7(c)). For the latter, both SLMs are divided into n-independently addressed tiles, with n being the number of the axial planes onto which we want to project patterns [168].
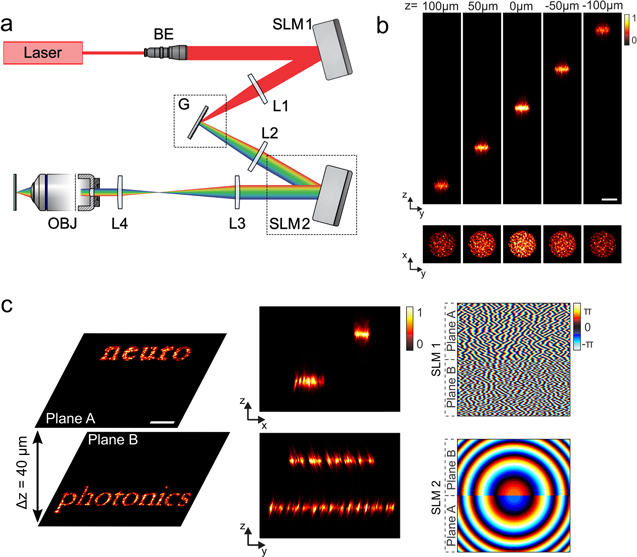
Figure 7. 3D-CGH-TF. (a) Scheme of the experimental setup for projecting 3D temporally focused arbitrary excitation patterns. The output laser beam is magnified using a beam expander (BE) and projected onto a first SLM (SLM1). SLM1 modulates the beam's phase so that light forms a user-defined intensity pattern on the diffraction grating (G) after passing through lens L1. The first diffraction order is collimated by lens L2 and directed onto a second SLM (SLM2). SLM2 imprints a lens-phase modulation that enables precise axial positioning of the spatiotemporal focal plane. The laser beam is then relayed and scaled by lenses L3 and L4 to the excitation objective (OBJ) pupil. (b) Axial displacement of a 20 μm-diameter temporally focused holographic spot. Top, orthogonal maximum fluorescence intensity projection of the spot, for axial displacements of 0, ±50, and ±100 μm from the focal plane. Bottom, corresponding x–y fluorescence intensity cross-sections. Scale bar, 20 μm. The color bar refers to normalized intensity. (c) (Left) Temporally focused excitation patterns representing the words 'neuro' and 'photonics' projected respectively onto plane A and plane B. (Middle) Orthogonal maximum 2P intensity projection along x (top) and y (bottom). (Right, top), tiled phase profiles addressed to SLM1 for encoding the words 'neuro' (plane A) and 'photonics' (plane B). (Right, bottom) Fresnel lens-phase profiles addressed to SLM2 to axially displace each holographic pattern generated by SLM1 on separated planes at +20 μm (plane A) and −20 μm (plane B). Reproduced from [168]. CC BY 3.0.
Download figure:
Standard image High-resolution imageIntroducing two SLMs in an optical system, obviously complicates the alignment and calibration of the setup for equal average intensity pattern projection. Moreover, tiling the SLMs sets a practical upper limit for the maximum number of planes that can be addressed [see [168] for a detailed characterization of the method]. However, the system can be simplified depending on the application. For instance, for experiments where remote axial displacement of a single plane is sufficient, the second SLM can be replaced by a tunable lens [83, 171].
Finally, this system can be easily coupled with an optical path for imaging, as it offers independent control of positioning the photoactivation planes from the imaging plane(s). This decoupling is a prerequisite for a lot of biological studies [94].
4. Intermediate combinations
In the previous sections, we described the different characteristics and limitations of sequential and parallel light-targeting photostimulation methods. To conjugate their benefits, hybrid strategies for light-targeting 2PE optogenetics investigations have been developed in recent years. In particular, scanning systems have been combined with TF in order to obtain fast and axially confined disk-shaped scanning illumination [154] and with CGH in order to implement 2PLSM multi-site photoactivation [96].
4.1. Low-NA beams and TF
As previously described, 2P photoactivation of ChR2 using low-NA spiral scanned beams was shown to be effective for the spatiotemporal integration of light-evoked current and suprathreshold membrane depolarization [92]. However, that came at the price of relatively long activation times, which ultimately limit the temporal resolution of 2P neuronal photostimulation to tens of milliseconds. The process could be speeded up by adopting narrower NAs producing wider illumination beam-waists to encompass a larger number of light-gated channels on the membrane. However, that would further increase the axial extension of the illumination pattern and degrade the overall 3D spatial resolution of 2P photostimulation.
In order to overcome this issue, Andrasfalvy et al proposed the adoption of a sequential-based photostimulation with temporally focused extended 2P low-NA Gaussian spots [154]. Since TF allows decoupling the axial and lateral extensions of the 2PE volume, a lateral widening of the photostimulation beam-waist could be achieved, while maintaining the excitation axial confinement. AP generation has been shown by illuminating ChR-expressing neuronal somata with a temporally focused 5 μm-diameter beam (λ = 880 nm, Pill = 460 mW at the sample, intensity axial profile FWHM ≈ 1.6 μm). The beam was either kept static (illumination time 1–2 ms) or randomly moved over multiple positions (illumination dwell time 0.1 ms; inter-pulse intervals 0.1 ms, five positions). The temporal resolution was significantly improved in this approach compared to previous low-NA beam-scanning photostimulation techniques. However, membrane depolarizations evoked by axially shifting the 5 μm spot over a thin dendrite dropped 50% at ≈40 μm from the focus. This is probably due to the high illumination power, that likely saturated ChR2 channels well beyond the TF excitation volume as measured by fluorescence imaging, and degraded the effective axial photostimulation resolution to nearly 80 μm.
4.2. Spiral scanning and CGH
As described previously, 2P scanning-based approaches demonstrated to be effective to elicit photocurrents and eventually spiking in combination with slow off-kinetics opsins [95, 96]. However, those solutions are strictly limited to single-cell activation, while synchronous multiple-cell activation remains out of reach for standard scanning-based photostimulation techniques. If multiple sites of a neural network need to be addressed, only stepwise activation of the network can be conducted, with obvious elongation of the overall temporal resolution and loss of temporal flexibility for neuronal network spike-timing studies. In an attempt to achieve parallelization of scan-based photostimulation, holographic-based 2PLSM multi-site illumination has been proposed. Multiple beamlets are generated via SLM-based phase modulation of the incoming laser and then coupled through GMs into a 2PLSM setup [96]. This solution enables simultaneous scanning of multiple individual beams across multiple targets in the sample. Notably, since CGH easily allows the generation of 3D diffraction-limited spots, this configuration permits simultaneous targeting of multiple sites located in different axial planes.
Paired patch-clamp recording in brain slices was used to show that synchronous light-evoked spiking was successfully generated by a dual laser beam targeted on two C1V1-expressing neurons located ≈50 μm apart radially, and ≈20 μm apart axially [96]. The same ability to stimulate spiking by photostimulation was shown by splitting the illumination beam up into 15 multi-beams, suggesting that photoactivation of several neurons can be achieved simultaneously [96].
5. In vivo photostimulation and functional imaging
Unraveling how behavior or pathology are causally related with neural activity patterns necessitates the ability to selectively perturb individual neurons, while monitoring the overall neural network activity in awake, behaving animals in vivo. To reach this goal, photostimulation has been coupled with either electrical recordings or functional imaging. In the first case, highly sophisticated optrodes have been developed to perform both photoactivation and electrical recordings using the same device, in freely behaving rodents. This research area is out of the scope of this review and has been discussed in detail elsewhere [187, 188]. In the second case, known as all-optical neuronal investigation [94], neural activity can be monitored by coupling light-sensitive actuators with fluorescent-based neuronal activity sensors such as genetically encoded calcium indicators (GECIs) [9] or VSDs [8]. This category of investigation poses unprecedented challenges and opens new perspectives for single-cell resolution light-targeting photostimulation and will be the argument of the following paragraphs.
5.1. Optogenetic photostimulation and calcium imaging
5.1.1. 1PE stimulation and calcium imaging in freely behaving animals
A big challenge when combining 1P photoactivation and calcium imaging is the spectral overlap between optogenetic actuators and GECIs [94]. The most widely used GECIs are the GCaMP family, whose latest version exhibits high sensitivity and brightness, and are able to report single APs [189]. GCaMP indicators share the same absorption spectrum as EGFP, with excitation wavelengths ranging from 430–510 nm. Optogenetic actuators, on the other hand, have wide action spectra, with long tails on the blue side wavelengths[10]. As a result, the combination of these actuators with GCaMP is problematic; even for the most red-shifted actuators, activation at 430–510 nm is >20% of peak activation [190]. To solve the problem of spectral overlap, a strategy is to use new red-shifted GECIs such as RCaMP2 [191], jRGECO1a, or jRCaMP1a/b [192], and to combine them with blue-shifted actuators such as ChR2. However, it has been demonstrated that RCaMP2 and jRGECO1a exhibit photoswitching when illuminated with blue light, causing a transient increase of red fluorescence that is not associated with an increase in calcium concentration [192]; jRCaMP1a/b, on the other hand, shows fast photobleaching [192]. Therefore, no ideal strategy exists today, and the successful combination of 1PE and calcium imaging in vivo has only been reported in a few articles. The first successful demonstration was performed in a simple system, the C. elegans [104]. Blue illumination was used both for the imaging of GCaMP3 and photoactivation of ChR2, where the excitation light density was kept very low for imaging (0.1 mW mm−2, 80 times lower than for photoactivation), in order to minimize the photoactivation of ChR2 with imaging light. Later on, Inoue et al performed a similar experiment using ChR2 and RCaMP2, also in the C. elegans [191]. Photoswitching of RCaMP2 under illumination with blue light was not reported in this experiment.
In rodents, simultaneous photoactivation and calcium imaging in vivo has been first achieved by combining 1PE of ChR2 and 2P laser-scanning imaging of Oregon Green BAPTA 1 (OGB1), in anesthetized mice [193]. OGB1 is a green organic dye, with an excitation spectrum largely overlapping the one of ChR2. To achieve successful combination of the two tools, the authors took advantage of the low efficiency of ChR2 activation under 2P laser-scanning stimulation [92]. Later, Szabo et al demonstrated simultaneous 1PE of ChR2 and 1PE calcium imaging of GCaMP5 with near-cellular precision in awake, freely behaving mice (figures 8(a)–(c)) [194]. Photoactivation patterns were generated with CGH [121], and transmitted to the mouse using a fiber bundle coupled to a micro-objective. Fluorescence imaging was based on intensity modulation of a laser beam with a DMD, which provided easy switching between epifluorescence, structured illumination, and scanless multi-point confocal microscopy. To minimize photoactivation of ChR2 with imaging light, imaging was performed in scanless confocal mode by illuminating only the soma(ta) of interest with extremely low light power (<6.10-3 μW/soma) and collecting fluorescence signals with a sensitive scientific complementary metal oxide semiconductor (sCMOS) camera. Recently, Kim et al demonstrated simultaneous photoactivation of bReaChES (a fast red-shifted ChR2) and GCaMP6 calcium imaging at low resolution, in the same brain region of a freely behaving mouse [195]. The setup made use of a single optical fiber to target the chosen region, but could be easily expanded to perform similar experiments in multiple regions simultaneously (as was demonstrated in the same paper for GCaMP6 imaging only).
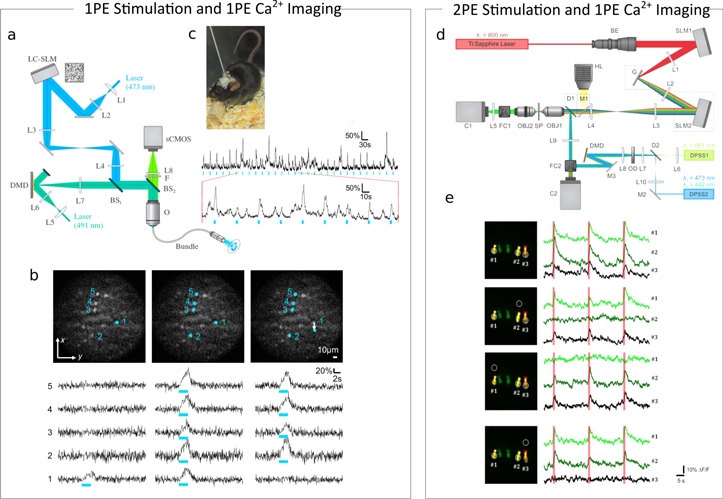
Download figure:
Standard image High-resolution image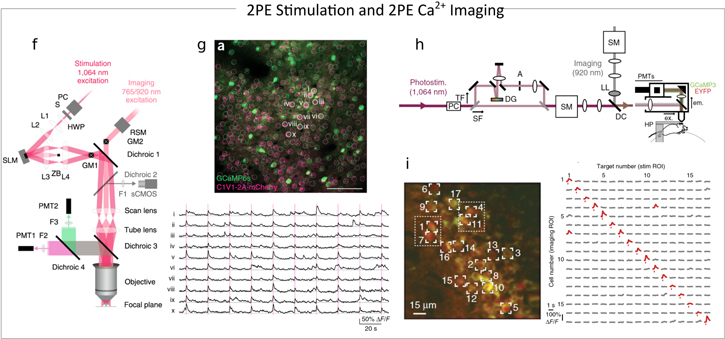
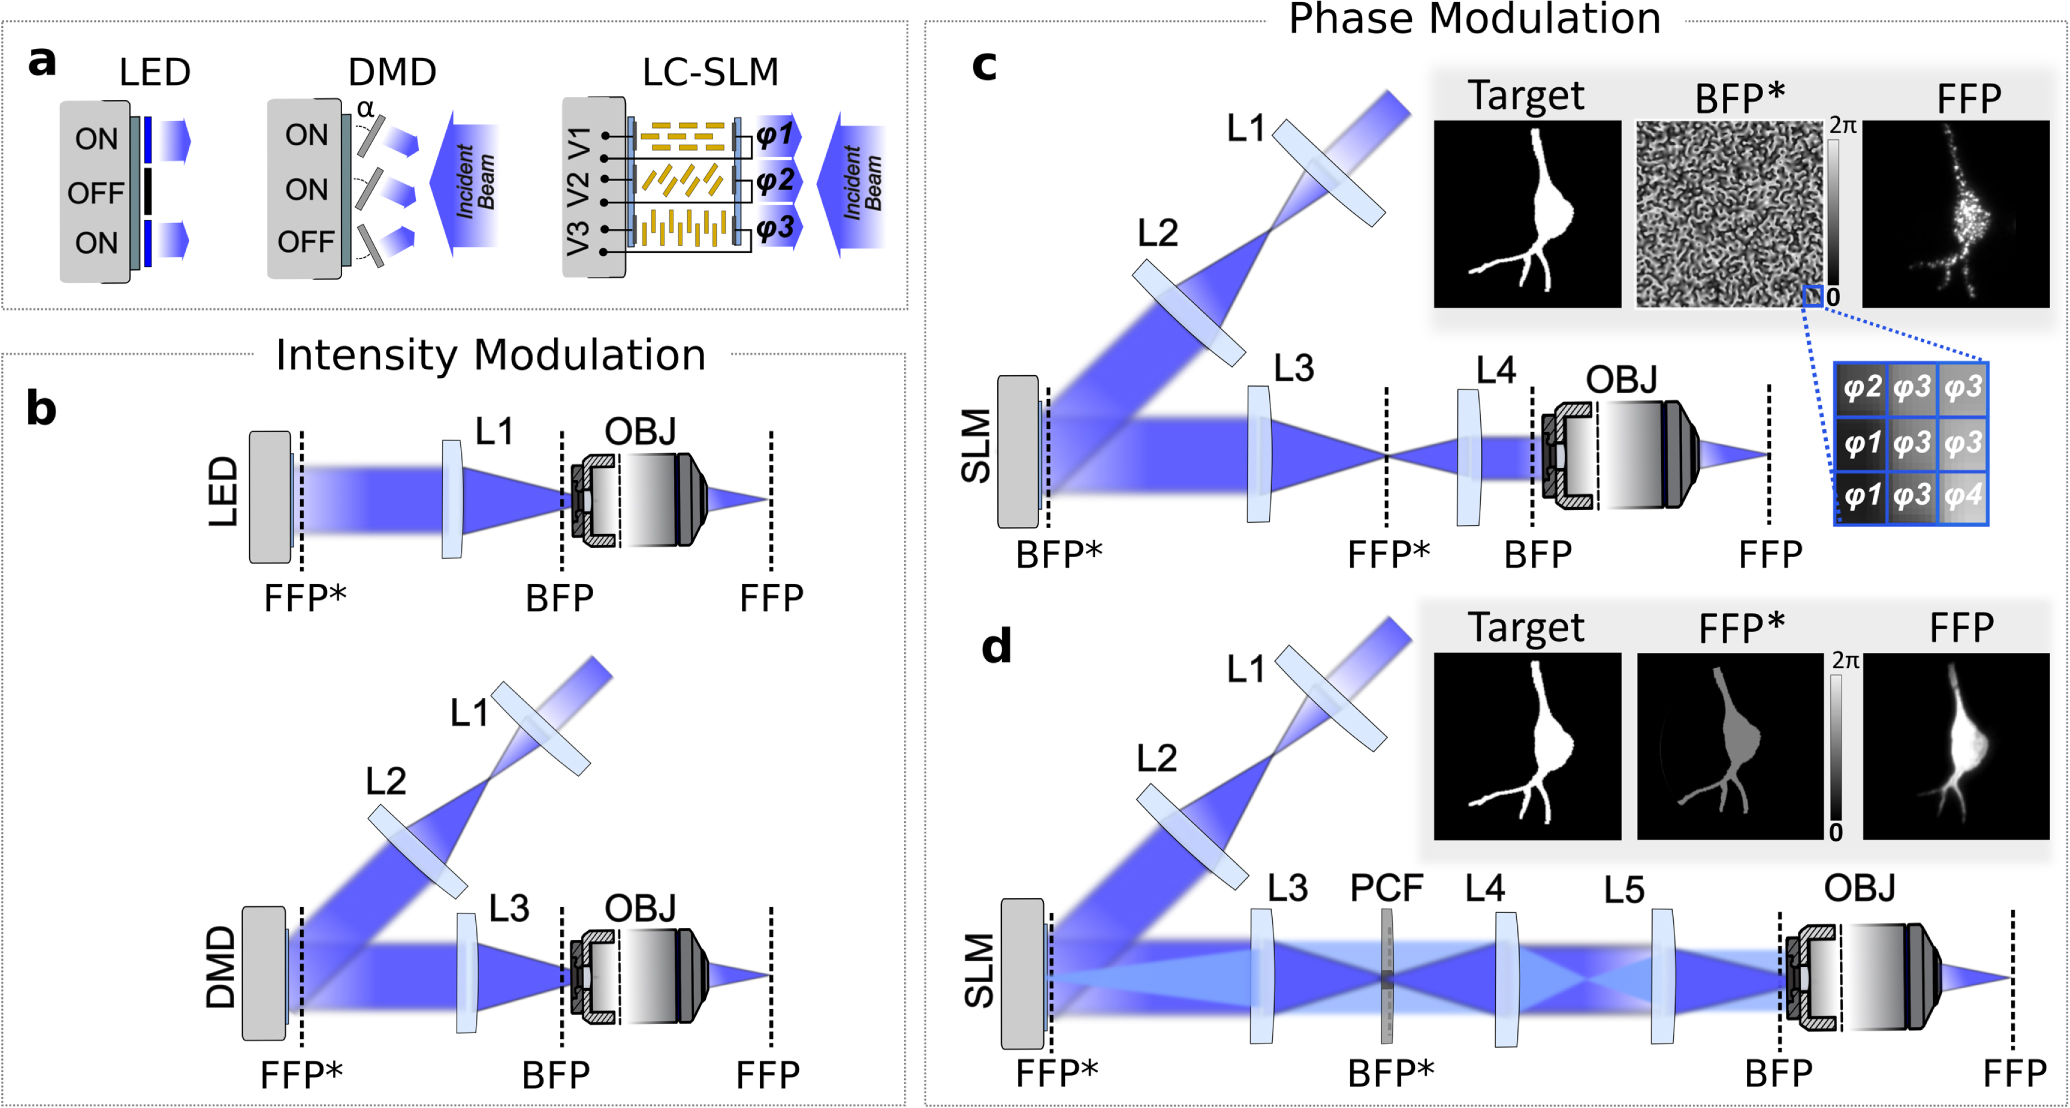
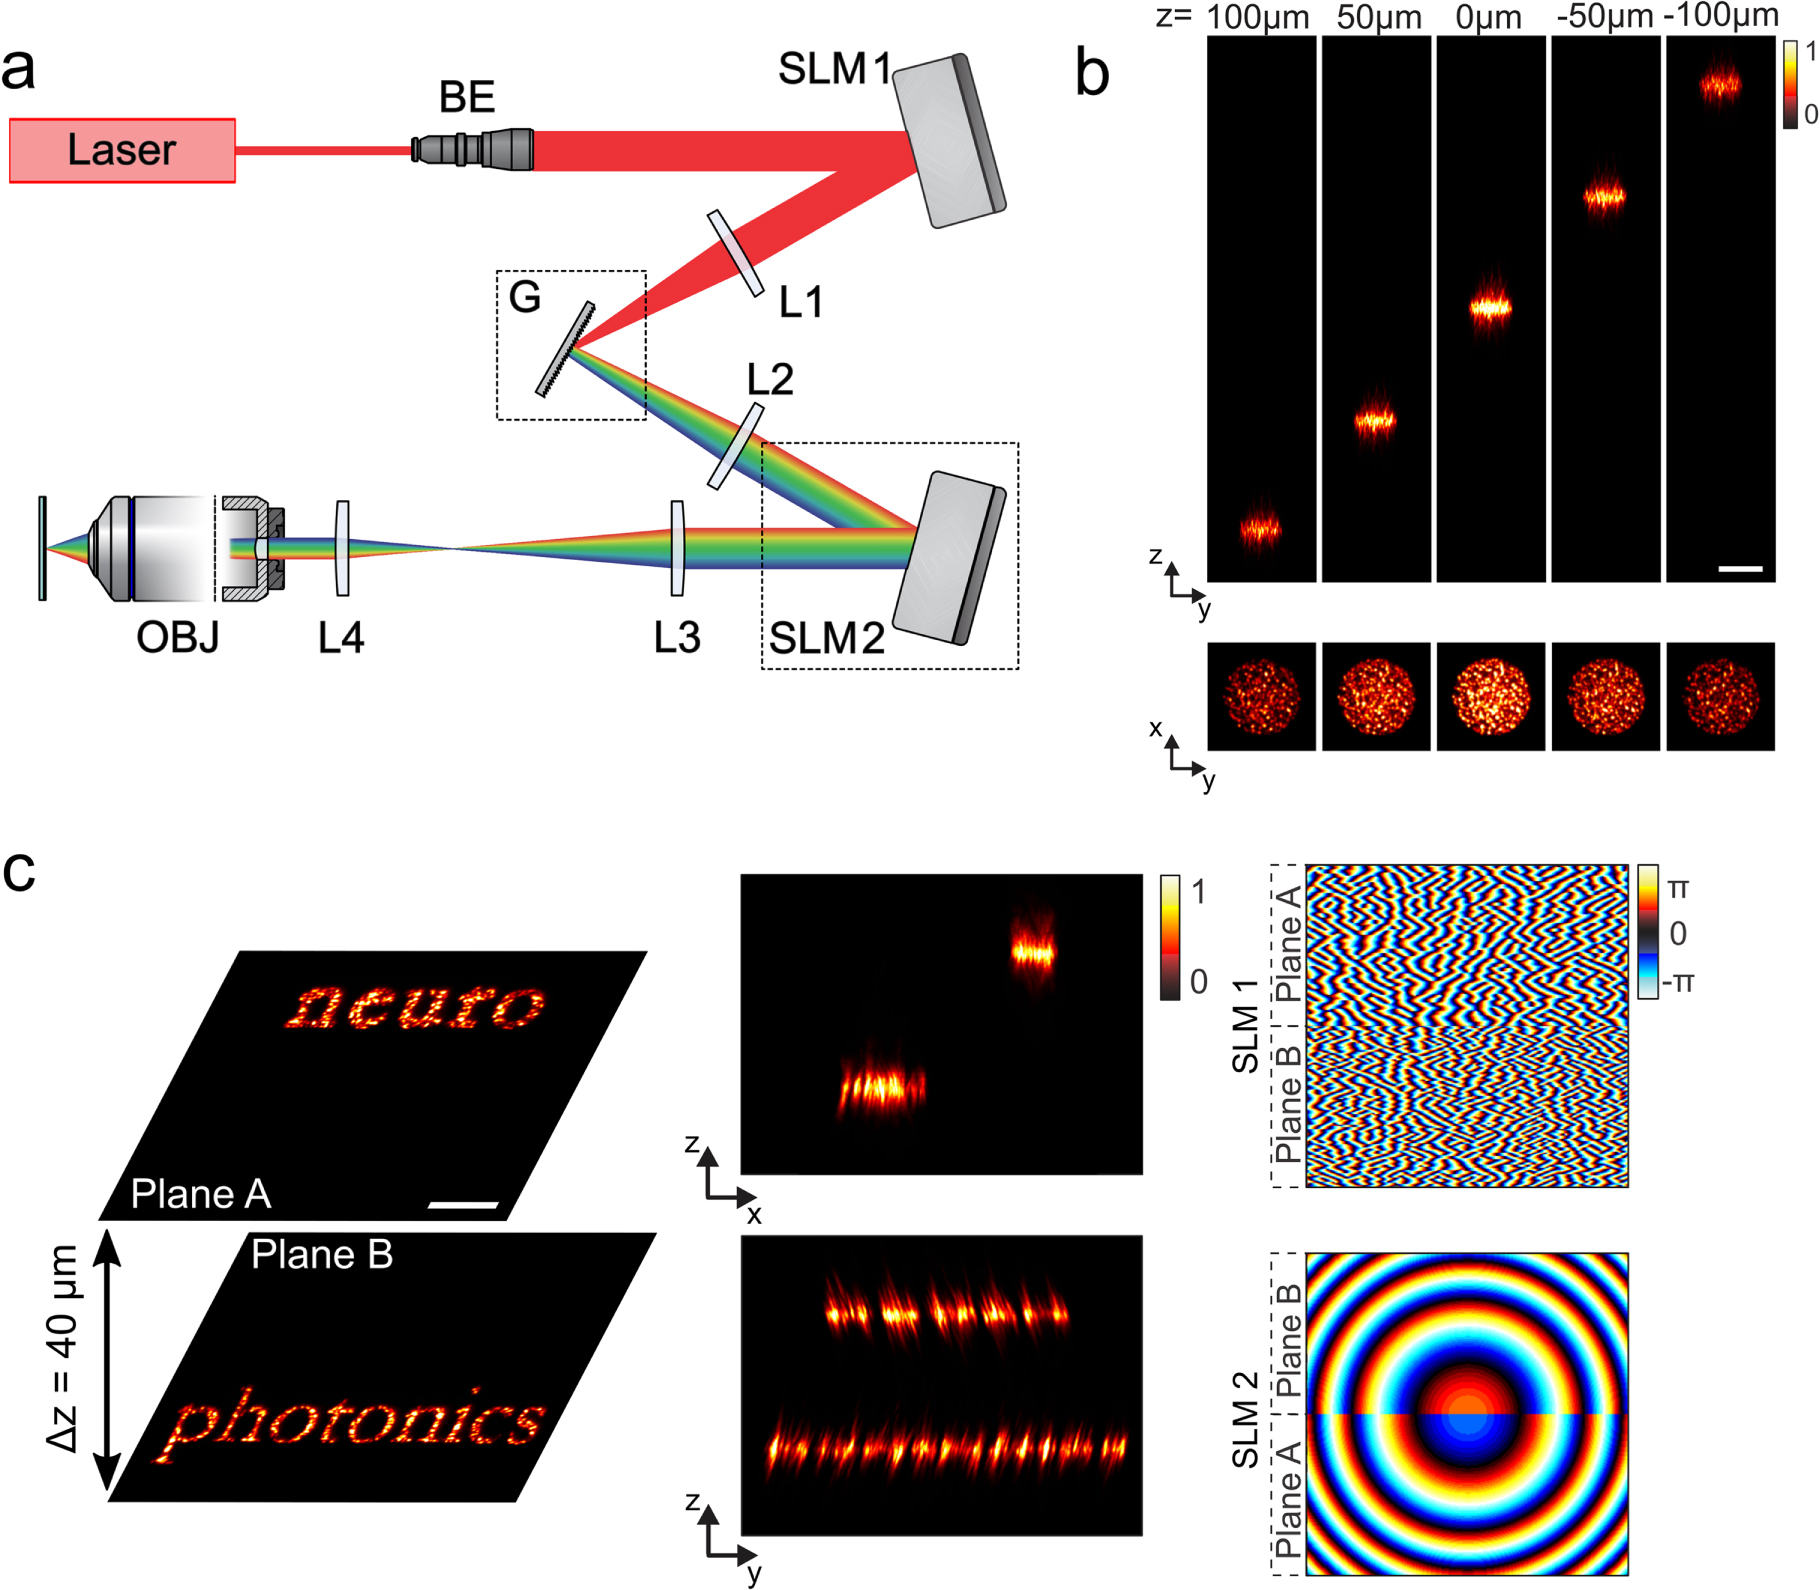
Figure 8. (a)–(c) 1PE photostimulation coupled with 1PE Ca2+ imaging. Reprinted from [194], Copyright (2014), with permission from Elsevier. (a) Scheme of a fiberscope setup combining CGH-based photostimulation (blue path) and DMD-based fluorescence imaging (dark and light green paths indicate the illumination and the detection path, respectively). MO, micro-objective; L, lens; BS, beamsplitter; O, objective; F, filter. (b) Simultaneous targeting of multiple cells co-expressing GCaMP5G and ChR2-tdTomato. (Top) Structured illumination images recorded in anesthetized mice co-expressing GCaMP5G and ChR2-tdTomato in molecular layer interneurons in the most dorsal lobe (IV/V) of the cerebellar vermis. Blue disks indicate the positions of the photoactivation spots. (Bottom) Corresponding ΔF/F traces recorded simultaneously in five cells, numbered 1–5. (Left) Only cell 1 was photostimulated. (Center) Five cells were photostimulated simultaneously. (Right) The photoactivation spot that targeted cell 1 was displaced 20 μm in the coronal plane, as indicated by the white arrow. Photoactivation protocol was a 9 Hz train of light pulses (24 pulses of 60 ms duration), 5 μm diameter CGH spot, P = 30 mW mm−2. (c) Photoactivation in freely behaving mice. (Left) Freely behaving mouse with the fiberscope probe fixed to its skull. (Right) The same photoactivation protocol as in (B) repeated every 30 s for 15 min in a behaving animal (p = 50 mW mm−2, Pimaging = 0.28 mW mm−2). The trace was low pass-filtered with a moving five-point average filter. (Bottom) Magnification of the top traces. (d), (e) 2PE photostimulation coupled with 1PE Ca2+ imaging. (d) 3D-CGH-TF setup described in figure 7 combined with two-color HiLo imaging and DMD multi-point imaging (blue and light green path); L, lens; D, dichroic; OD, oscillating diffuser; C, camera; FC, filter cube; M, mirror. Reproduced from [168]. CC BY 3.0. (e) Selective stimulation of ChR2-H134R-mCherry and GCaMP5G co-expressing cells of zebrafish transgenic line (Tg(pkd2l1:gal4; UAS:ChR2-H134R- mCherry; UAS:GCaMP5G)) by CGH spots of 10 μm diameter (0.61 mW μm−2 ) and corresponding ΔF/F traces (targeted cells are indicated in each image by numbered circles). Reproduced from [168]. CC BY 3.0. (f)–(i) 2PE photostimulation coupled with 2PE Ca2+ imaging. (f) Optical setup coupling holographic-based 2PE scan multi-site photostimulation (dark pink path) and 2PE raster scanning imaging (light pink path). GM: galvo-mirrors, PC, Pockels cell; S, shutter; HWP, half-wave plate; L, lenses; SLM, spatial light modulator; ZB, zero-order block; GM, galvanometers; RSM, resonant scanning module; F, filters; PMT photomultiplier tubes. Reprinted by permission from Macmillian Publishers Ltd: Nature Methods [93], Copyright (2015). (g) Simultaneous targeting of multiple cells. (Top) 2PE fluorescence image of neurons in layer 2/3 of somatosensory cortex co-expressing C1V1-2A-mCherry and GCaMP6s in an anesthetized mouse (scale bar, 100 μm); (bottom) ΔF/F calcium traces from ten photostimulated neurons (white circles in the top image). Reprinted by permission from Macmillian Publishers Ltd: Nature Methods [93], Copyright (2015). (h) Optical setup coupling photostimulation via spatially-focused (SF) low-NA raster scanned beams or temporally focused disk-shaped beams (purple path) with 2PE raster scanning imaging (gray path). PC, Pockels cell; DG, diffraction grating; A, aperture; SM, scanning mirrors; LL, liquid lens; DC, dichroic mirror. Reprinted by permission from Macmillian Publishers Ltd: Nature Neuroscience [196], Copyright (2014). (i) Serial targeting of multiple cells. (Left) 2PE fluorescence image of CA1 hippocampal neurons expressing GCaMP3 and C1V1(E122T/E162T)-2A-EYFP in an awake mouse; (right) matrix of Ca2+ transients from 17 cellular targets (numbered in the left image), with significant responses shown in red. Reprinted by permission from Macmillian Publishers Ltd: Nature Neuroscience [196], Copyright (2014).
Download figure:
Standard image High-resolution image
5.1.2. 2PE stimulation and 1PE calcium imaging in zebrafish larvae
2P optogenetic activation combined with 1P calcium imaging was recently used to demonstrate multi-cell activation in the spinal-cord neurons of zebrafish larvae (figures 8(d) and (e)). Temporally focused holographic illumination was used to photoactivate neurons expressing both ChR2 and GCaMP5G [168]. For imaging the fluorescence changes induced to GCaMP5 by neuronal activation and minimizing spurious activation by the imaging beam, a laser source emitting at 491 nm and patterned illumination with a DMD has been used. Despite sample heterogeneity (expression level for both the opsin and the calcium indicator varied significantly from cell to cell leading to distinct levels of fluorescence for the same imaging power), the system allowed us to selectively and simultaneously control and monitor the neural activity of multiple cells.
5.1.3. 2PE photostimulation and 2PE calcium imaging in head-restrained mice
The first demonstrations of 2P all-optical investigations have been conducted in awake mice co-expressing the slow-kinetics red-shifted opsin C1V1 and GCaMPs variants, either through C1V1/GCaMP6 viral co-injection [93] or C1V1 viral injection in GCaMP3 transgenic mice [196]. Imaging and photostimulation have been achieved using a standard Ti:sapphire laser source (at 920 nm) and a high-power ultrafast fiber laser source (1064 nm), respectively. High frame rate imaging (15–30 Hz) was performed with RSs.
More specifically, Packer et al applied a hybrid scanning holographic-based light-targeting approach where the photostimulation laser was split into several beams that synchronously scanned multiple somata with a spiral trajectory (see section 4.2 for details, and figures 8(f) and (g)) [93]. When coupled with functional imaging (30 Hz frame rate), this configuration enabled to reliably trigger calcium transients simultaneously in ten photostimulated neurons co-expressing C1V1/GCaMP6. These neurons were distributed in a region of ∼150 μm on a side in layer 2/3 of the somatosensory cortex [93].
Rickgauer et al performed all-optical in vivo investigations by adopting 2P soma-targeted photostimulation on C1V1-expressing neurons (figures 8(h) and (i)). They used either spatially focused low-NA raster scanned beams (∼0.3-NA, scan period ∼8–16 ms, scan area of 12–15 μm-diameter) or temporally focused disk-shaped beams with pulse widths shorter and intra-pulse intervals longer than C1V1 decay time (ellipsoidal disks wxy ∼ 10–15 μm, wz ∼ 6 μm; light-stimulus train of 3–10 pulses at 5–20 Hz with 16–50 ms per pulse; P < 100 mW) [196].
In both works, it was shown that spontaneous neuronal firing activity augments during illumination with the imaging laser beam, especially in neurons with high opsin expression. Imaging conditions for minimizing photostimulation were characterized and used (i.e. moderate power levels or large field of view (FOV)).
Recent investigations explored the possibility to perform repetitive 2P activation of neuronal populations via iterative photostimulation sessions where the full FOV (≅ 240 μm) comprising 60–100 neurons was scanned by a 1064 nm ion (diffraction-limited) spot (P ∼ 90 mW; NA 1.05) for 4–6 s at 4 Hz with 5–10 s intersession interval in the visual cortex of awake mice [197]. Remarkably, this repetitive photoactivation protocol was able to build neuronal ensembles (i.e. groups of coactive neurons) that thereafter reoccur spontaneously or can be recalled via single-cell photoactivation (with 2P single-cell soma-targeted spiral scan, see section 2.3) on consecutive days. These results can be interpreted as a confirmation of Hebbian plasticity [197].
5.2. Optogenetic photostimulation and voltage imaging
The combination of opsin photostimulation with membrane potential imaging is an obvious potential strategy to investigate neuronal activity both at cellular and network level. Voltage imaging has been successfully combined with simultaneous calcium imaging [198] or uncaging [199] by using dual excitation with green and ultraviolet (UV) light (green for voltage imaging and UV for calcium imaging or uncaging). However, the combination with ChR2 stimulation is less straightforward due to cross-talk between excitation spectra of VSDs and ChR2. Indeed, as reported in section 5.1.1, activation of ChR2 occurs essentially at all visible wavelengths <600 nm. Red-shifted voltage indicators are thus necessary. Historically, the first red-excitable VSDs were introduced in the late 1990s for in vivo applications where red light is necessary to excite the indicator outside the absorption band of hemoglobin, thus minimizing the artifacts due to pulsation and hemodynamic noise. These dyes were slow oxonols, designed to monitor population activity in the brain, but more recently faster indicators with similar spectral characteristics were developed [200, 201]. An important characteristic of VSDs is their water solubility. Typically, tissues such as brain slices can be stained extracellularly with dyes that are relatively poorly soluble in water, but indicators that are soluble in water at millimolar concentrations can be applied directly into neurons [202]. The advantage of this approach is that it allows measurements of membrane potential changes from small axons, dendrites, and dendritic spines [203]. Indicators that can dissolve in the intracellular solution and that are excitable with red light have been developed to load individual cells with a patch pipette [204, 205]. Thus, membrane potential changes can be optically measured in combination with ChR2 photostimulation from individually stained cells. In a recent pioneering study [206], ChR2 was expressed in GABAergic interneurons and individual CA1 hippocampal pyramidal neurons were filled with the voltage indicator Di-2-ANBDQPTEA. When ChR2 was photostimulated, inhibitory postsynaptic potentials could be optically recorded from the apical dendrites of the pyramidal neuron. This encouraging result indicated that combining membrane potential imaging with optogenetic stimulation is likely to become a standard approach in the near future.
5.3. Shaped illumination for functional fluorescence imaging (membrane potential and ion imaging)
In functional fluorescence imaging, the central problem is often to achieve a sufficient signal-to-noise ratio (S/N) to resolve the fractional change of fluorescence (ΔF/F0) produced by the voltage or the ion concentration change. Light measurement is associated with an intrinsic photon noise equal to the square root of the number of photons. Thus, in functional imaging, the square root of the number of photons must be significantly smaller than the fluorescent transient ΔF to measure. This goal must be achieved while maintaining the desired spatial and temporal resolution necessary to extract useful information from the measurement. This issue is particularly relevant in membrane potential imaging in the brain where a temporal resolution in the kHz range imposes light collection for a short time window in the order of 100 μs. Thus, for a submicron pixel, the intensity necessary to achieve adequate S/N must be particularly high and photodamage becomes a limiting factor. The straightforward way to maximize the S/N is to illuminate the whole field and to record fluorescence using a CCD or a sCMOS camera, where the readout-noise of the recording device is negligible with respect to the intrinsic photon noise [207]. In this way, information can be obtained at temporal resolution equivalent to the maximal frame rate from a maximal number of sites equivalent to the number of pixels. Using this approach, the theoretical ability to spatially resolve a structure is limited by diffraction to ≈λem/NA, where λem is the fluorescence emission wavelength. Using a lens with NA = 1.0, camera imaging permits us, in principle, to resolve structures of less than a micron. In practice, when imaging cells in embedded tissues, such as brain slices, light scattering from the tissue worsens this theoretical ability and signals cannot be resolved from most of the submicron structures such as axonal terminals or dendritic spines. In addition, background fluorescence from out-of-focus planes leads to an increase of photon noise. In other words, the diffraction limit becomes less relevant whereas photon noise and scattering become the two factors that limit spatial resolution. A way to rescue the submicron spatial resolution and increase the S/N is then to illuminate only the points of interest and to detect fluorescence only from these points, as in confocal microscopy [208]. In this way, the spurious scattered photons from the adjacent regions and the fluorescence photons from out-of-focus planes are strongly reduced. This is usually done sequentially, i.e. by using scanning microscopy, whereas with camera epifluorescence imaging light is collected by all pixels simultaneously and therefore the acquisition time and exposure time are equal. In scanning microscopy the acquisition time is proportional to the exposure time of single points and to the number of recording points. For similar acquisition times, a measurement performed by scanning N points will be done with N times fewer detected photons with respect to a measurement done with a camera. Thus, a scanning microscopy measurement from N points has S/N that is (N)½ smaller than a measurement performed with a camera at the same acquisition rate. In functional imaging applications, shaped illumination and camera imaging can potentially combine a better ability to record from small structures and a higher S/N. In recent studies, it has been shown that shaped illumination enhances the discrimination of adjacent neuronal structures in VSD imaging recordings [209, 210]. In particular, by shaping light using 1PE CGH to illuminate specific cellular substructures, it was possible to clearly discriminate the different kinetics of an AP on axons and dendrites [209] or to better isolate the signal on dendritic spines from the contamination of neighboring dendrites due to scattering [210].
Scanless functional imaging with an SLM-based patterned illumination has also been applied to monitor multi-site calcium activity [122, 141, 211–214]. In particular, 2P multi-point illumination enabled multi-cell high-frequency acquisition (up to 1 kHz), showing improvement in terms of fluorescence S/N for single AP detection and reduction of artifacts when combined with 1PE photostimulation [212]. The possibility of simultaneous multi-plane recording has been demonstrated when coupled with extended-depth-of-field strategies [213, 214].
In the future, patterned illumination approaches should prove particularly useful for measurements requiring very high acquisition rates, for instance recordings of axonal action potentials [215] or of Ca2+ currents using calcium imaging [216, 217], both requiring an acquisition frequency of 20 kHz.
6. Conclusions and perspectives
Light-targeting methods appear to be a key component of the ongoing optogenetic revolution. Either based on serial or parallel strategies, these methods fill a gap in genetically-based optogenetic procedures by providing the ability to manipulate the flow of excitation or inhibition in user-selected subsets of genetically identified cells. Particularly when combined with 2PE, light-targeting methods showed deep and 3D-controlled cellular access with nearly single-cell resolution, while maintaining high optical temporal control when parallel illumination strategies are adopted. Although further development is required, these exciting new methods, coupled to functional imaging in all-optical in vivo investigations, have the potential to greatly increase our ability to understand brain function. Table 1 presents an overview of the approaches presented in this review, highlighting the different optical properties.
Table 1. Optical properties of light-targeting photostimulation methods.
|

 radial and axial FWHM of the intensity profile;
  minimal radial FWHM of the intensity profile; NA, numerical aperture; n, refractive index; T, time to photoactivate N cells; Tdw, activation dwell-time; Ti, inter-location time; ls, scan length; νs, scan speed; λ, illumination wavelength; β, maximal GM angle; ΔF, νa frequency and velocity of the acoustic wave propagating in AOD;
  beam radius at 1/e2 of the maximum intensity;
  Rayleigh length;
  speckle size; fobj, fn, focal length of objective and nth lens of the optical system as it appears in figures 2 and 5; aSLM, SLM pixel size; DDMD, DMD display size.
aThe focal lengths indicated in the FOE equations for serially-scanned and parallel-pattern light-targeting techniques correspond to figures 2 and 5, respectively.
bIn presence of Temporal Focusing the axial intensity distribution can be approximated to
speckle size; fobj, fn, focal length of objective and nth lens of the optical system as it appears in figures 2 and 5; aSLM, SLM pixel size; DDMD, DMD display size.
aThe focal lengths indicated in the FOE equations for serially-scanned and parallel-pattern light-targeting techniques correspond to figures 2 and 5, respectively.
bIn presence of Temporal Focusing the axial intensity distribution can be approximated to  whose FWHM is equal to
  with
with  [238, 239] where k is the excitation wave vector and s and αΩ are the spot sizes at the back aperture of the objective in the direction orthogonal and parallel to the grating linear dispersion, respectively.
Spatiotemporal resolution of light-targeting methods still presents significant limitations. Although, 2PE techniques enabled light-evoked spiking at near-cellular resolution, sub-threshold cellular depolarizations often extend significantly beyond that range. The reason is mainly ascribed to the fact that opsin expression is not confined to the somatic compartment, but spreads all over the dendritic and axonal terminals. Therefore, light is able to drive cellular depolarization also when the illumination spots move away from somata. These limitations become particularly serious for multi-cell photostimulation, as multiple soma-targeted illuminations likely activate a consistent number of processes belonging to opsin-expressing neighboring cells. In order to overcome this issue, it is necessary to redesign the virus-targeting approach for confining the opsin in somatic regions only. In this sense, new viral targeting strategies relying on the exclusive localization of the Kv2.1 potassium channel in the neuronal soma and proximal dendrites [218] hold promise and soma-targeted light-elicited AP has been recently demonstrated [219, 220].
Other limitations of light-targeting techniques are related to their limited FOE. Optical designs for 2PE scanning microscopy have been highly improved in the past few years, yielding fast functional imaging over millimeter-range FOVs in rodents [221–223]. In principle, these techniques should also be appropriate for larger animal preparations than rodents. Nevertheless, light-targeting photostimulation FOE is limited to a few hundreds of microns. In order to fully exploit the potential of 2PE all-optical investigations, light-targeting FOE should be further expanded to ranges compatible with those reached by functional imaging. For scanning photostimulation approaches, works extending the imaging FOV in millimeter ranges proved that technically this is possible. However, as detailed in section 2.2.1, the number of cells accessible in 'quasi-simultaneous' time intervals will be limited as each position is visited sequentially by the laser beam. Extending the FOE of parallel approaches to reach millimeter range, potentially for large animal preparations, could benefit from custom-designed optics, as for imaging [221, 223]. For systems using TF as well, solutions concerning beam multiplexing after performing spectral dispersion for TF should be considered for giving access to 3Ds [168, 224].
Restrictions are also present in terms of maximal penetration depths. Although, 1PE fiber-based light-targeting photostimulation has been demonstrated [194], visible light offers limited 3D activation resolution. On the other hand, because of scattering, the current 2PE light-targeting implementations are limited to a few hundreds of microns. In order to extend 3D-controlled activation to deeper brain layers, light-targeting illumination could be provided by high-energy femtosecond-pulsed beams at low-repetition rates [225], whose efficacy for photostimulation has already been demonstrated with different opsins [125, 126]. Increasing penetration depth to millimeter range would require coupling 2PE light-targeting strategies with head-mounted optical fibers.
Finally, the use of light-based strategies for brain investigation requires a careful evaluation of the tissue heating effects related to the illumination power levels, which ultimately define the range of non-invasiveness of light-based neuronal stimulation approaches. Temperature is indeed a key environmental variable for living organisms. This has long been recognized and the first steps towards the quantitative analysis of temperature effects can be dated to the seminal paper of Pennes in which he introduced the so-called bio-heat equation integrating metabolism and blood flow as specific heat source and cooling terms [226] in the classical Fourier heat diffusion equation [227]. In neurosciences, the effect of temperature on neural or hemodynamic activity has been reported [228] and in particular in the case of electrical [229] or optical [6, 230] brain stimulation experiments. More specifically in the case of optogenetics, estimates of the temperature rise during experiments have been reported [6], but it is only very recently that the spatiotemporal evolution of the temperature in such experiments has been modeled [231, 232]. The definition of light-induced heat source must take into account the scattering of light by the brain tissue, usually characterized via Monte Carlo simulations [233]. Although an intensive study of thermal effects in the specific case of optogenetics still remains to be carried out, significant changes in firing rates have been reported for temperature rises of the order of 1 °C [231]. This increasing concern about temperature in optogenetics has also sparked new efforts in the instrument design of these experiments [234, 235], as well as the development of specific probes in order to monitor local temperature during the optical stimulation [236, 237].
Further effort needs to be put in optics in order to fully take advantage of the potential of the optogenetics era. Nonetheless, optical techniques have demonstrated a powerful evolution in recent years, approaching the ability to become routine tools for brain investigations in awake animals. All this suggests that new exciting achievements and results are expected in the near future.
Acknowledgments
We thank Dimitrii Tanese, Francesca Anselmi, and Vivien Szabo for critical readings and discussions, and Brandon M. Stell for proofreading of the paper. We also thank I-Wen Chen for the unpublished data presented in figure 4(d).
This work was supported by the 'Agence Nationale de la Recherche' (grants ANR-10-INBS-04-01, France-BioImaging Infrastructure network; ANR-11-LABX-0015, Labex Ion Channels Science and Therapeutics, ANR-14-CE17-0006, WavefrontImag; ANR-15-CE19-0001-01, 3DHoloPAc), the National Institutes of Health (NIH 1-U01-NS090501-01), and the Getty Lab.