

Abstract
Key observational indicators of climate change in the Arctic, most spanning a 47 year period (1971–2017) demonstrate fundamental changes among nine key elements of the Arctic system. We find that, coherent with increasing air temperature, there is an intensification of the hydrological cycle, evident from increases in humidity, precipitation, river discharge, glacier equilibrium line altitude and land ice wastage. Downward trends continue in sea ice thickness (and extent) and spring snow cover extent and duration, while near-surface permafrost continues to warm. Several of the climate indicators exhibit a significant statistical correlation with air temperature or precipitation, reinforcing the notion that increasing air temperatures and precipitation are drivers of major changes in various components of the Arctic system. To progress beyond a presentation of the Arctic physical climate changes, we find a correspondence between air temperature and biophysical indicators such as tundra biomass and identify numerous biophysical disruptions with cascading effects throughout the trophic levels. These include: increased delivery of organic matter and nutrients to Arctic near‐coastal zones; condensed flowering and pollination plant species periods; timing mismatch between plant flowering and pollinators; increased plant vulnerability to insect disturbance; increased shrub biomass; increased ignition of wildfires; increased growing season CO2 uptake, with counterbalancing increases in shoulder season and winter CO2 emissions; increased carbon cycling, regulated by local hydrology and permafrost thaw; conversion between terrestrial and aquatic ecosystems; and shifting animal distribution and demographics. The Arctic biophysical system is now clearly trending away from its 20th Century state and into an unprecedented state, with implications not only within but beyond the Arctic. The indicator time series of this study are freely downloadable at AMAP.no.
Export citation and abstract BibTeX RIS

Original content from this work may be used under the terms of the Creative Commons Attribution 3.0 licence. Any further distribution of this work must maintain attribution to the author(s) and the title of the work, journal citation and DOI.
1. Introduction
Rising concentrations of greenhouse gases are driving widespread changes in global physical climate and its ecosystems (IPCC 2014a, 2014b). This article assembles nine diverse observational records that serve as key indicators of Arctic climate and ecosystem status. This review of physical changes is accompanied by a discussion of links with the Arctic biological systems. We present and discuss each indicator in turn and where possible, we discuss ecosystem impacts. A statistical evaluation of correlations between the indicators and various time series of pan-Arctic, Arctic regional or hemispheric surface air temperatures (or precipitation) is made in effort to identify, quantify and further illuminate potential interactions. Key findings are listed in the conclusion section, including a commentary on observational gaps with recommendations for future work.
2. Key indicators
While 'indicator' has been defined in various ways in the literature, this study will follow the definition of Kenney et al (2016) by regarding indicators as 'reference tools that can be used to regularly update status, rates of change, or trends of a phenomenon using measured data, modeled data or an index'. We apply the notion of indicators to capture the state of the Arctic environment through observational data series that span various components of the Arctic system. Figure 1 illustrates nine key Arctic indicators, updated and expanded from the AMAP 2017 assessment. Each indicator is discussed in the following subsections and where considered appropriate, their inter-relations are further examined.
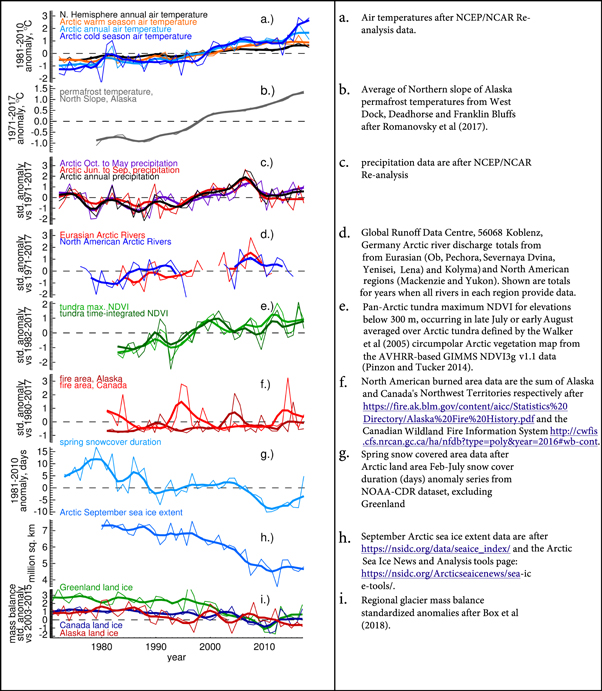
Figure 1. (Left) Arctic climate observational indicator records. Multi-year running averages are illustrated using Gaussian smoothing lines, (right) data sources are described.
Download figure:
Standard image High-resolution image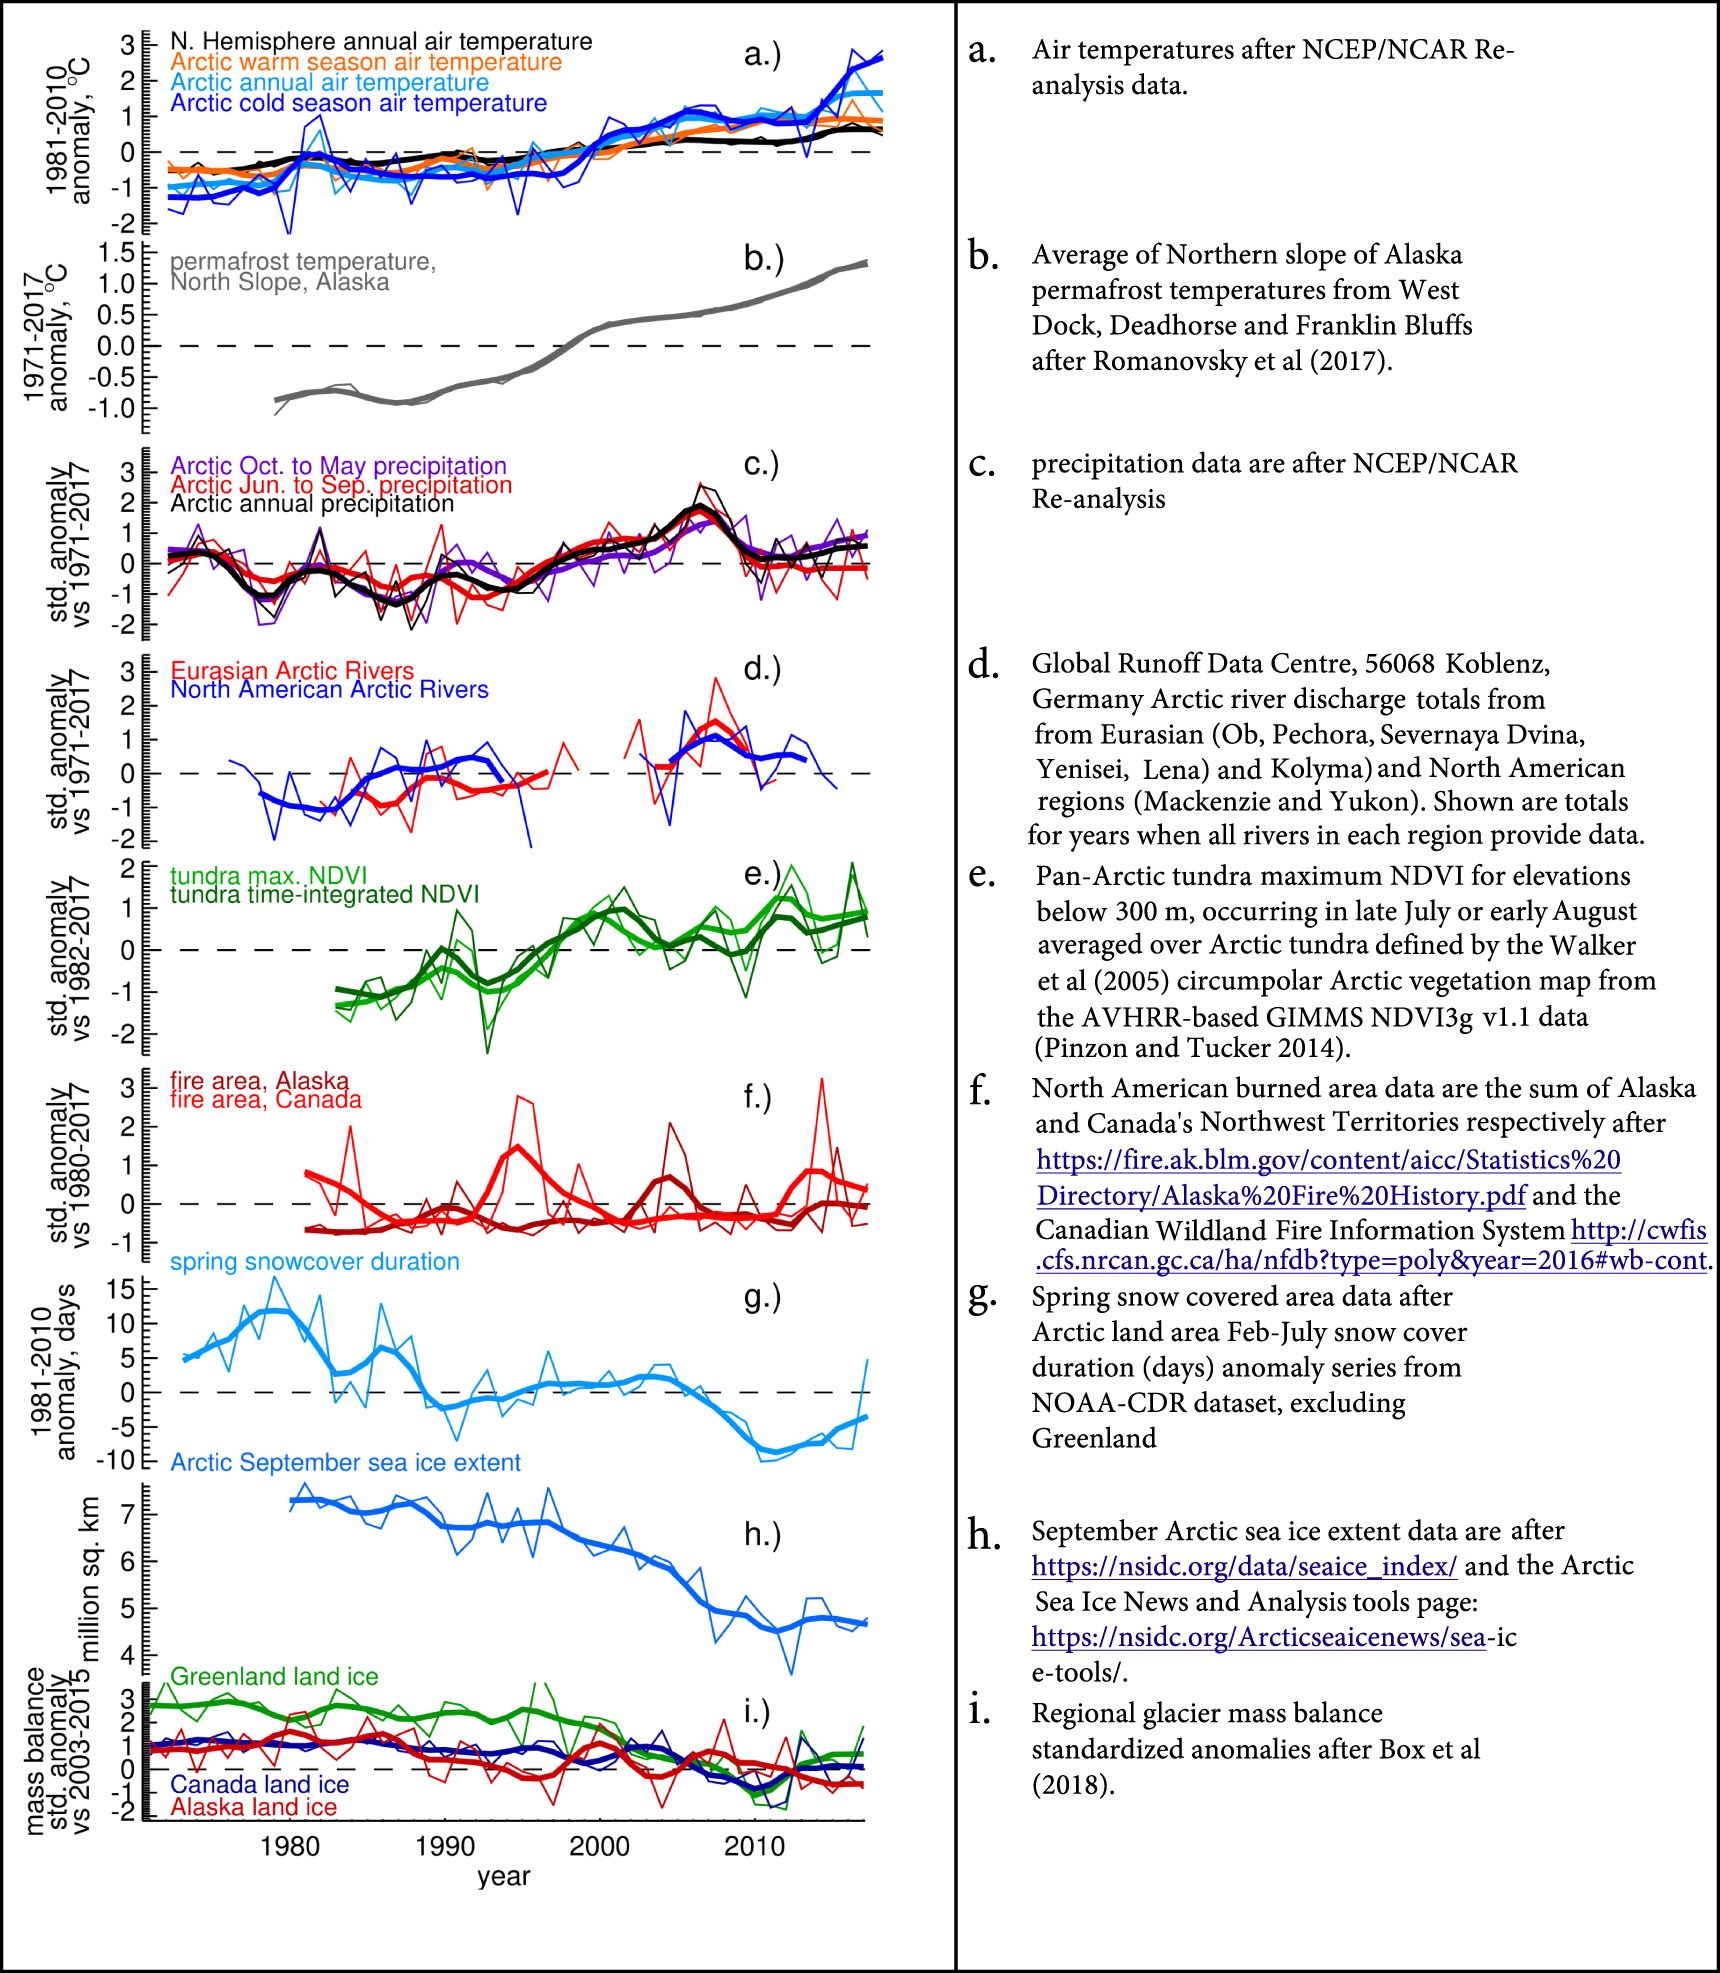
3. Methodology
3.1. Period of analysis
While homogeneous datasets for some variables predate 1971, such datasets for other indicator variables (e.g. sea ice, permafrost temperature, wildfire area) are not available until the 1970s. The 1971–2017 period used in this synthesis spans the decades prior to and during the Arctic's systemwide changes starting in the mid-1980s (Overland et al 2004) and unprecedented extremes that have occurred since the mid-1990s (e.g. Overland et al 2018).
3.2. Temperature and precipitation data
Here, near surface air temperature data time series are taken from the NCEP/NCAR Re-analysis (updated from Kalnay et al 1996). Justification for the use of these data are prompt updates and consistent performance versus other reanalysis products (Overland and Wang 2016). The data are not separated between land and ocean because our aim is to include changes both over the land and above the ocean for an integrated 'indicator', which is associated with other indicators we are studying in this study (e.g. sea ice (ocean), permafrost (land), snow cover (land)). Our coverage is pan-Arctic, regional and Northern Hemispheric. Nevertheless, the relative contribution of the land versus ocean stations to e.g. air temperature, is not the same, and this sampling bias is a possible source of uncertainty.
3.3. Seasonal and regional variable definitions
We define temperature and precipitation variables for both seasonal or annual and pan-Arctic or regional areal averages. By 'warm season' we refer to the June through September period that often includes above freezing air and surface temperatures. By 'cold season' we refer to the October through May period that is characterized by below-freezing temperatures over much of the Arctic. 'Arctic' here refers to the area north of 60 degrees latitude. The Northern Hemisphere is abbreviated as 'N. Hem.' For example, when referring to Arctic air temperature we use the following variable: TArctic warm season. Regional polygons cover land ice areas and hence we refer to e.g. TN. Hem. Warm Season. For a snow cover statistical evaluation, we choose the May to June (MJ) period since parts of the Arctic can be snow free by June.
3.4. Regression methodology, definition of trend units
Potential relationships to air temperatures are quantified by regressions between Northern Hemisphere (or Arctic) seasonal or annual temperatures and other climate parameters against the assembled collection of Arctic climate indicators for the 1971–2017 period. The regressions that reveal signals of interconnection with high confidence (1 − p > 0.9) in correlations (R) are emphasized using bold text in table 1.
Table 1. Linear trends and temporally detrended correlation of figure 1 Arctic climate indicators versus air temperature from NCEP/NCAR re-analysis.
| Indicator | Units | Trend per decade | Change during period | 1 − p | Versus variable | Corr. coef. | 1 − p | Earliest year | Latest year |
|---|---|---|---|---|---|---|---|---|---|
| TArctic Annual | °C | 0.6 | 2.7 | >0.999 | TN. Hem. Annual | 0.660 | >0.999 | 1971* | 2017 |
| TArctic Warm Season | °C | 0.4 | 1.8 | >0.999 | TN. Hem. Warm Season | 0.295 | 0.950 | 1971* | 2017 |
| TArctic Cold Season | °C | 0.7 | 3.1 | >0.999 | TN. Hem. Cold Season | 0.660 | >0.999 | 1971* | 2017 |
| PArctic Annual | % | 1.3 | 6.2 | >0.999 | TArctic Annual | 0.503 | 0.998 | 1971* | 2017 |
| TN. Hem. Annual | 0.303 | 0.948 | 1971* | 2017 | |||||
| PArctic Cold Season | % | 1.4 | 6.8 | 0.994 | TArctic Cold Season | 0.447 | 0.996 | 1971* | 2017 |
| TN. Hem. Cold Season | 0.447 | 0.996 | 1971* | 2017 | |||||
| PArctic Warm Season | % | 1.0 | 4.7 | 0.935 | TArctic Warm Season | 0.061 | 0.314 | 1971* | 2017 |
| TN. Hem. Warm Season | 0.061 | 0.314 | 1971* | 2017 | |||||
| Ob river annual | % | −0.6 | −2.6 | 0.255 | TArctic Annual | −0.024 | 0.122 | 1971* | 2015 |
| TN. Hem. Annual | 0.162 | 0.695 | 1971* | 2015 | |||||
| Pechora River annual | % | 1.7 | 5.8 | 0.564 | TArctic Annual | 0.191 | 0.704 | 1981 | 2014 |
| TN. Hem. Annual | 0.271 | 0.864 | 1981 | 2014 | |||||
| Severnaya Dvina River | % | 5.9 | 25.9 | 0.956 | TArctic Annual | 0.035 | 0.175 | 1971* | 2014 |
| TN. Hem. Annual | −0.036 | 0.180 | 1971* | 2014 | |||||
| Yenisei River | % | 1.6 | 7.0 | 0.844 | TArctic Annual | 0.065 | 0.326 | 1971* | 2015 |
| TN. Hem. Annual | 0.035 | 0.179 | 1971* | 2015 | |||||
| Lena River | % | 3.3 | 13.6 | 0.945 | TArctic Annual | 0.114 | 0.514 | 1971* | 2011 |
| TN. Hem. Annual | 0.074 | 0.348 | 1971* | 2011 | |||||
| Kolyma River | % | 7.4 | 33.3 | 0.987 | TArctic Annual | −0.001 | 0.004 | 1971* | 2015 |
| TN. Hem. Annual | −0.133 | 0.604 | 1971* | 2015 | |||||
| Yukon River | % | 3.1 | 13.0 | 0.989 | TArctic Annual | 0.090 | 0.394 | 1975 | 2016 |
| TN. Hem. Annual | 0.048 | 0.213 | 1975 | 2016 | |||||
| Mackenzie River | % | 1.1 | 4.8 | 0.575 | TArctic Annual | −0.019 | 0.093 | 1973 | 2015 |
| TN. Hem. Annual | −0.135 | 0.601 | 1973 | 2015 | |||||
| Eurasian Arctic rivers composite | km3 y−1 | 18.7 | 56.1 | 0.996 | TArctic Annual | 0.152 | 0.555 | 1981 | 2011 |
| TN. Hem. Annual | 0.075 | 0.294 | 1981 | 2011 | |||||
| North American Arctic rivers composite | km3 y−1 | 5.9 | 23.6 | 0.972 | TArctic Annual | −0.266 | 0.862 | 1975 | 2015 |
| TN. Hem. Annual | −0.048 | 0.213 | 1975 | 2015 | |||||
| Tundra Max NDVI | st. dev. | 0.1 | 0.05 | >0.999 | TArctic Warm Season | 0.406 | 0.982 | 1982 | 2017 |
| Tundra time-integrated NDVI | st. dev. | 0.1 | 0.23 | 0.999 | TArctic Warm Season | 0.555 | 0.999 | 1982 | 2017 |
| Alaska burned area | 1e6 Ha | 0.1 | 0.5 | 0.863 | TArctic Warm Season | −0.054 | 0.251 | 1980 | 2017 |
| Canada burned area | 1e6 Ha | −0.0 | −0.0 | 0.077 | TArctic Warm Season | 0.010 | 0.044 | 1980 | 2017 |
| September Arctic Sea Ice extent | 1e6 sq. km | −0.8 | −3.3 | >0.999 | TArctic Warm Season | −0.623 | >0.999 | 1979 | 2017 |
| Spring Snow Covered Area | days | −3.4 | −15.5 | >0.999 | TArctic MJ | −0.464 | 0.998 | 1972 | 2017 |
| Greenland Mass Balance | st. dev. | −0.7 | −3.2 | >0.999 | TArctic Warm Season | −0.472 | 0.999 | 1971* | 2017 |
| Canada Mass Balance | st. dev. | −0.3 | −1.5 | >0.999 | TArctic Warm Season | −0.332 | 0.974 | 1971* | 2017 |
| Alaska Mass Balance | st. dev. | −0.3 | −1.6 | 0.999 | TArctic Warm Season | 0.115 | 0.551 | 1971* | 2017 |
| Scandinavia Mass Balance | st. dev. | −0.2 | −0.8 | 0.937 | TArctic Warm Season | −0.184 | 0.776 | 1971* | 2017 |
| Svalbard Mass Balance | st. dev. | −0.2 | −0.7 | 0.879 | TArctic Warm Season | −0.339 | 0.977 | 1971* | 2017 |
Note. Bold values highlight high confidence (1 − p > 0.9) correlations. An asterix beside the year indicates data that begin before then but are not analyzed here.
When assessing confidence in regressions between two time series, e.g. air temperature and precipitation, one year lagged temporal correlations (rlag1) are evaluated to control for serial autocorrelation, in which we compute effective degrees of freedom not as n_timeseries_years-2 but as (neffective):

The lowest neffective is then used to determine the p-value of the correlation. The effect of controlling for serial autocorrelation is to give more realistic (lower) 'confidence' (1 − p) values.
While a correlation is indicative of a possible relationship, it does not distinguish the contributions of the trends and the interannual variations superimposed on the trend. Physically meaningful relationships should be manifested in interannual variations as well as in corresponding trends. Since trends are apparent in figure 1, we focus our correlation analysis on the interannual timescale. To do so, we temporally detrend the data prior to computing cross-correlations. Further, here, we make no lagged correlation analysis.
Our use of the term 'change' refers to the magnitude of linear trends assessed by standard least squares regression (Chatterjee and Hadi 2006), that is, the regression slope multiplied by the duration of data in years.
3.5. Smoothing of series
To illustrate longer-term variations than that of single years and recognizing that some temporal autocorrelation can occur, figure 1 presents normal distribution weighted running average values, i.e. smoothing. The chosen envelope is ±5 years and the Gaussian width has 1.5 standard deviations per 11-year sample. Within 4 years of the time series beginning or end, the tail on the Gaussian sample is truncated by one in each year toward the end of the series until the sample size is 6 years. While we present smoothed data, in all cases, all presented statistics are computed only from the unsmoothed raw data. In order to detrend the data, we subtract the linear trend resulting from temporal regression.
4. Arctic climate indicators
4.1. Air temperature
Arctic air temperature change (ΔT) from 1971 to 2017 measured by the regression slope (multiplied by 47 years) indicate warming by: 2.7 °C at the annual scale (ΔTArctic Annual); 3.1 °C in the cold season (October–May) (ΔTArctic Cold Season) and 1.8 °C in the warm season (June–September) (ΔTArctic Warm Season) (table 1, figure 1(a)). A number of processes contribute to amplified Arctic temperature variations as compared to global temperatures (Pithan and Mauritsen 2014). As a metric of Arctic Amplification (AA), comparing the change in Arctic temperatures with those from the Northern Hemisphere, we find AAAnnual = ΔTArctic Annual/ΔTN. Hem. Annual = 2.4, AACold Season = ΔTArctic Cold Season/ΔTN. Hem. Cold Season = 2.8, and AAWarm Season = ΔTArctic Warm Season/ΔTN. Hem. Warm Season = 1.7. Thus, similar to the observed increase in temperature changes from 1971 to 2017, AA is greatest in the cold season and smallest in the warm season (June through September).
Later freeze up of sea ice (e.g. Markus et al 2009) and advection of moisture into the Arctic (Zhang et al 2013, Neff et al 2014) are key contributors to the rise in cold season air temperatures, producing maximum Arctic warming in autumn and winter. For the 1959–2008 period, Bekryaev et al (2010) conclude annual AA to be 1.52 for 1959–2008. The values of AA depend on the region considered, e.g. Arctic Ocean else land, distance from the coast (Bekryaev et al (2010) and altitude (Hernandez-Henriquez et al 2015). See Serreze and Barry 2011) for further review. Evaluating AA using paleo data, Miller et al (2010) concluded a higher AA, between 3 and 4. However, during the last glacial maximum, AA was negative due to a stronger northern latitude insolation increase as compared to the present Anthropogenic warming driven by excessive greenhouse gas concentrations.
4.2. Permafrost and carbon cycling
New record-high annual average temperatures in the upper 10–20 m of the ground have been observed at many permafrost observatories with the greatest temperature increases (>2 °C) occurring in the colder permafrost of the northern Arctic (Romanovsky et al 2017). Here, at 20 m depth for three North Slope of Alaska sites (West Dock, Deadhorse and Franklin Bluffs) we find a 2.5 °C permafrost temperature increase in the past 47 years (figure 1(b)). In northern Alaska, the active layer freeze-up date in the 2010s (mid-December) was almost two months later than in the mid-1980s (mid-October). In Zackenberg, northeast Greenland, maximum thaw depths increased by c. 1.6 cm yr−1 between 1997 and 2010 (Lund et al 2014). Reduced permafrost area contributes to amplified warming because of a reduced ground latent heat sink (Lund et al 2014, Parazoo et al 2018).
The impact of thawing permafrost on ecosystem processes is dependent on permafrost type and local hydrology. In areas with discontinuous permafrost, thawing can lead to permafrost collapse with major implications for hydrology, vegetation composition and biogeochemical cycling (Johansson et al 2006). Bring et al (2016) suggest that permafrost thaw may increase hydrological connectivity between groundwater and surface water systems and change water storage in lakes and soils, which will influence exchange of moisture with the atmosphere. Jorgenson et al (2001) document permafrost degradation causing ecosystem shifts from birch forests to fens and bogs. In upland tundra areas with continuous permafrost, increasing active layer depths may on the other hand lead to soil drying (Liljedahl et al 2016), limiting vegetation growth.
As a response to increased air and ground temperature, there are now clear signs of permafrost thaw (Nicolsky et al 2017, Romanovsky et al 2017). In combination with warming-induced impacts on Arctic tundra vegetation, these landscape-scale structural changes will affect tundra-atmosphere interactions including both biogeophysical and biogeochemical feedback effects on the climate system (Lund 2018).
Jeong et al (2018) find accelerating rates of carbon cycling revealed by 42 years of atmospheric CO2 measurements from Barrow, Alaska (71.29 N, 156.79 W). They conclude that: 'Temperature dependencies of respiration and carbon uptake suggest that increases in cold season Arctic labile carbon release will likely continue to exceed increases in net growing season carbon uptake under continued warming trends'. See also section 4.4. Tundra greening and terrestrial ecosystems, below.
For the Canadian boreal forest, Price et al (2013) document how 'approximately 40% of the forested area is underlain by permafrost, some of which is already degrading irreversibly, triggering a process of forest decline'. Through modeling, Schuur et al (2015) suggest that Arctic climate warming will cause an increasingly large net upward flux of terrestrial carbon to the atmosphere via microbial release of carbon from decomposition of accumulated surface biomass. Observational data from Zackenberg, NE Greenland, combined with ecosystem modeling for the period 2000–2014 also shows trends towards increased overall carbon cycling but of a variable nature differing between time periods 2000–2008 and 2008–2014 (Zhang et al 2018). Long-term observational records are needed to verify any possible consistent trends in possible Arctic tundra carbon emissions as the potential releases are hypothetically an extremely important feedback given that it would likely amplify future climate warming. Hugelius et al (2014) estimate that Arctic soils contain ∼50% of the world's global soil carbon and hence the potential release is enormous.
While Arctic seafloor methane (CH4) release is observed (Shakova et al 2013, Andreassen et al 2017), there is no conclusive proof that hydrate-derived CH4 is reaching the atmosphere today (Ruppel and Kessler 2017). Most of the CH4 is oxidized or dissolved into the sediments or water column before reaching the atmosphere, especially in deeper waters (>50 m) (Parmentier et al 2017). Nonetheless, the idea of warming-triggered carbon release is hypothetically an extremely important feedback given that it would likely amplify future climate warming. This effect was recently quantified for CH4 only to potentially cause a more than 20% increase in the CH4 radiative forcing on top of anthropogenic 'business as usual' scenario. However, it is also shown that with serious mitigation of anthropogenic emissions or a 'maximum feasible reduction' scenario the effect of even extreme natural arctic CH4 emission increase will be neutralized and even still maintain a lower radiative forcing by 2100 than a business as usual scenario will lead to (Christensen et al 2019).
Recent changes in biogeophysical energy exchange and transport within the Arctic, and between this region and the rest of the globe, now exceed even extreme projections. There is now clear evidence for both the marine and terrestrial Arctic environments that winter is not, as has previously been assumed, a dormant time for ecosystem processes (Mastepanov et al 2008, Christensen, 2014, Pirk et al 2016, Commane et al 2017). The winter includes carbon exchange through sea ice (Parmentier et al 2013). Terrestrial carbon exchange is complicated by the interaction of thawing permafrost, intensified hydrological cycle, vegetation change, and coupling between the land and ocean.
There is now mounting evidence for increasing gross primary production and ecosystem respiration with warming, however, the net effect on land-atmosphere CO2 exchange remains unclear (Lund et al 2010, Lopez-Blanco et al 2017). The sea ice decline associated with late-summer-focused warming impacts terrestrial processes and ecosystems and greenhouse gas exchange (Parmentier et al 2013, Post et al 2013). The greening of the Arctic is expected to result in stronger growing season carbon uptake as well as lower albedo and higher turbulent heat fluxes (Chapin et al 2005, Lund 2018). Conversely, thawing permafrost mobilizes carbon through both vertical (Schuur et al 2015) and lateral pathways (Spencer et al 2015). The CO2:CH4 emission ratio from thawing permafrost soils is dependent on soil moisture conditions (Schadel et al 2016). While higher temperatures promote CH4 production within Arctic soils, the net flow into the atmosphere is constrained by the water table depth. Whether the Arctic surface will become wetter or drier may thus determine the net atmospheric CH4 exchange (Watts et al 2014). Under climate change, trends in the net carbon flux may thus be damped (Parmentier et al 2011, Lund et al 2012) and possibly offset by increases in early winter respiration when plants have senesced (Commane et al 2017).
4.3. Changes to arctic hydroclimatology
4.3.1. Arctic humidification
Available observations from land and coastal stations indicate a humidity increase at the Arctic surface (Hartmann et al 2013, Vihma et al 2016) and in the mid troposphere (Serreze et al 2012). The humidification is in part related to increased advection of moist air from mid-latitudes (Zhang et al 2013) and longer sea ice-free seasons (Markus et al 2009, Serreze et al 2012). Walsh et al (2011) find increases in cloudiness over the Arctic, especially in low clouds during the warm season. The higher humidity increases downward longwave radiation (Zhang et al 2001), contributing to amplification of warming (Pithan and Mauritsen 2014).
4.3.2. Precipitation increase
While there is considerable uncertainty in precipitation trends over the Arctic, the available observations and reanalysis datasets (Rawlins et al 2010, Rapaic et al 2015) suggest increases of 1.5%–2.0% per decade in annual precipitation which is consistent with the estimated temperature sensitivity of Arctic precipitation of 4.5% per K (Bintanja and Selten 2014).
Here, according to NCEP/NCAR Reanalysis, the increase in annual total precipitation for the area north of 50 deg. N latitude 1971–2017 (47 years) is strongest during the cold season (October through May), increasing from 1971 to 2017 by 6.8% about an average rate of 225 mm during the eight-month period with high confidence (1 − p = 0.994). The increase during the June through September warm season is less; 4.7% about an average rate of 168 mm during the four-month period (1 − p = 0.935). The 1971–2017 period of Arctic precipitation exhibits inter-decadal fluctuations with a prominent increase from the mid 1980s to the late 2000s (figure 1(c)). Annually, the increase is 6.2% (1 − p > 0.999) about an average of rate of 393 mm per year.
Consistent with precipitation enhancement from water vapour feedback theory (e.g. Trenberth 2011), Box et al (2013) find a +6.8% °C−1 increase in Greenland snow accumulation. Here, regression of annual NCEP/NCAR reanalysis precipitation for the Arctic region (north of 50° latitude) for the 1971–2017 (47 year) period with Northern Hemispheric air temperatures suggest a +7.5% °C-1 sensitivity (R = 0.276, 1 − p >0.937)25 . Seasonally, the precipitation sensitivity is 7.1% °C−1 (R = 0.191, 1 − p = 0.795) for the Arctic warm season and 6.5% °C−1 (R = 0.203, 1 − p = 0.823) for the cold season. When using Arctic temperatures (instead of the Hemispheric temperatures), the precipitation sensitivity values range from 3.3% to 3.7%, roughly a factor of two lower, presumably because the amplitude of Arctic temperature variability is roughly 2× higher than hemispheric air temperature. The associated correlations: 0.270 (1 − p = 0.930) in the warm season, R = 0.447 (1 − p = 0.998) in the cold season and R = 0.510 (1 − p > 0.999) annually, suggest that interannual variations in air temperature is not the only process controlling precipitation.
Increased precipitation does not necessarily mean that the Arctic surface will become wetter, since increased temperature tends to increase evapotranspiration (Zhang et al 2009). For example, drying conditions result in areas where changes in evapotranspiration exceed precipitation inputs. Increased drainage following permafrost thaw may also lead to drier conditions (Liljedahl et al 2016), and reductions in water availability will limit vegetation growth and CO2 uptake.
4.3.3. Rainfall increase
Decreasing snowfall at the expense of increasing rainfall is observed around the Greenland ice sheet margin (Doyle et al 2015) and in regions with warmer winter climates such as Scandinavia and the Baltic Sea basin (Rasmus et al 2015, Irannezhad et al 2016). Increasing snowfall is documented in colder regions such as northern Canada and Siberia (Kononova, 2012, Vincent et al 2015) and the lower elevations of the Greenland ice sheet (Box et al 2013, Hawley et al 2014, Wong et al 2015).
4.3.4. Soil moisture
Spatial variability in soil moisture may be an important driver of local-scale plant composition (Nabe-Nielsen et al 2017). On a larger scale, the spatial variability in soil moisture may explain the heterogeneous pattern of vegetation growth as deducted from remotely-sensed vegetation greenness indices (Bhatt et al 2017). Changes in precipitation patterns (e.g. shifts from snow to rain) will impact animal distribution and demographics both directly (e.g. Schmidt et al 2015, Kankaanpaa et al 2018) and indirectly through changes in plant composition and productivity. Increased winter snow fall will accelerate permafrost warming from increased insulation (Zhang 2005). Increasing cloudiness decreases tundra ecosystem photosynthesis and, contrary to the effect over snow- and ice-covered surfaces, it reduces surface energy availability (Lund et al 2017). Any summer drying may be outweighed by enhanced winter precipitation (Serreze et al 2002). Further, changes in evaporation only exceed those in precipitation in a limited area of the Arctic oceanic domain and not over land areas (Jakobson and Vihma 2010).
4.3.5. Arctic river discharge increase
An increase in the discharge of major rivers terminating in the Arctic is well documented (e.g. Peterson et al 2002, Serreze et al 2006, Rawlins et al 2010, Haine et al 2015, Holmes et al 2015, Vihma et al 2016), with Eurasian rivers showing the greatest increase. Here, we assess Arctic river discharge using Global Runoff Data Centre (GRDC) data, providing 91% complete temporal coverage of six Eurasian rivers (Ob, Pechora, Severnaya Dvina, Yenisei, Lena, and Kolyma) during 1981–2011 and 86% complete coverage from the two major North American Arctic rivers (Mackenzie and Yukon) during 1975–2015 (figure 1(d)). By volume, the six-Eurasian river discharge is 1.8 times the average of the assessed two-North American river discharge. The combined river basin area cover 70% of the pan-Arctic drainage area (Holmes et al 2015).
For the limited set of cases when all rivers are reporting data, we find the average discharge increasing in Eurasian rivers by 56.1 km3 yr−1 or . The North American river discharge increased by 23.6 km3 yr−1 over the 1.32× longer 1975–2015 period (table 1). While for a different period, the Eurasian discharge increase about a six-river 1981–2011 average of 467 km3 yr−1 is +12%, the North American Arctic river discharge about a 1975–2015 average of 253 km3 yr−1 is lower; +9%. We find no high confidence correlations of individual nor composite river discharge with Arctic nor hemispheric temperatures (table 1).
4.3.6. Arctic sedimentation increase
Increased delivery of organic matter and nutrients is evident in Arctic near‐coastal zones (Bring et al 2016). Increases in Greenland ice sheet meltwater runoff during the 20th Century are linked to increased sedimentation rates (Bendixen et al 2017). Hawkings et al (2016) estimated that the Greenland ice sheet contributes about 15% of total bioavailable phosphorus input to the Arctic oceans (∼11 Gt yr−1) and dominates the total phosphorus input (408 Gt yr−1), which is more than three times that estimated from Arctic rivers (126 Gt yr−1).
4.3.7. Arctic ocean freshening
Arctic Ocean freshening is being driven by increases in Arctic precipitation and river discharge (Vihma et al 2016), with enhanced oceanic heat inflows from both the North Atlantic and the North Pacific playing a role in the retreat of sea ice in the Arctic Ocean. Increased ocean heat storage in newly sea-ice-free ocean areas has been confirmed from recent shipboard observations (Walsh et al 2011).
4.4. Tundra greening and terrestrial ecosystems
Arctic greening (overall increases in vegetation biomass as deducted from satellite observations of land surface reflectance via NDVI, the normalized difference vegetation index) has been observed across tundra ecosystems over the past 30 years (e.g. Bhatt et al 2017) (figure 1(e)). Since Arctic tundra vegetation is temperature-limited, summers with above average summer warmth correspond to higher NDVI values and vice versa. Here, the increase of Arctic tundra average and maximum NDVI both correlate with high confidence with TArctic Warm Season (table 1). The NDVI covariability with air TArctic Warm Season is most likely related to greater amounts of photosynthetically active radiation during warmer-than-normal summers. Further, Martin et al (2017) link shrub biomass with air temperature, soil moisture, herbivory, and snow dynamics. Declines in the NDVI, i.e. 'browning', may be related to water or nutrient limitation, permafrost degradation, and extreme winter events (Phoenix and Bjerke 2016, Bhatt et al 2017).
Tundra-atmosphere CO2 exchange, as presented by observation-based modelling (Zhang et al 2018), indicates a trend towards increased tundra CO2 sink functioning (more negative net ecosystem exchange) during 2000–2008, caused by a stronger increase in gross primary production compared with ecosystem respiration (Lund et al 2012). However, this trend reversed from 2008 to 2014. As discussed above, high-latitude CH4 emissions from Arctic tundra ecosystems represent a potentially important biogeochemical climate feedback, and are related to changes in temperature, moisture, and shifts in vegetation composition (e.g. Olefeldt et al 2013). Long-term observations of CH4 emissions at Arctic sites are still relatively rare, and in particular few studies include non-growing season CH4 emissions, which may represent up to 50% of annual CH4 emissions (Treat et al 2018). The rather stable interannual variation in ecosystem respiration, as indicated by CH4 emissions is observed at Zackenberg, NE Greenland. However, when comparing with other sites where similar monitoring is taking place in West Greenland and on Svalbard, a clear relationship is found with an increasing annual CH4 emission with growing degree days (figure 3; Pirk et al 2017). Differing local tundra CH4 dynamics points towards the importance of comparable observations being made at multiple sites for an improvement of our understanding of the potential CH4 tundra emission changes (Christensen 2014).
In terms of floral population dynamics, there is now strong evidence that the summer warming trend is causing an earlier and more condensed flowering period of key plant species in the interaction web, including pollination. A condensed flowering period leaves a progressively shorter time-window for the pollinators with possible subsequent cascading effects through the ecosystem (Hoye et al 2013, Schmidt et al 2016).
4.5. Fire
Fire clearly causes dramatic short-term changes in vegetation and ecosystem function (Bret-Harte et al 2013). Drier conditions and an increase in maximum air temperatures contribute to increased fire risk (Jolly et al 2015). Price et al (2013), conclude that increases in the average North American area burned will be gradual, despite periodic extremes. The fire data analyzed here (figure 1(f)) do exhibit non-normal distributions, containing a relatively small number of severe years. Burned area does not exhibit any co-linearity with TArctic Warm Season in this analysis (table 1). Rather, the fire-climate relationship is related to sub-seasonal dry/warm episodes and to increasing lightning ignition that is shown to correlate with air temperature and precipitation (Veraverbeke et al 2017). That study finds an increase in lightning ignitions since 1975, and that the large 2014 and 2015 events (figure 1(f)) 'coincided with a record number of lightning ignitions and exceptionally high levels of burning near the northern treeline. Indeed, lightning ignition explains the majority of the interannual variability in burned area'. Supportive of a climate driven fire relationship, for Alaska, Young et al (2017) find 'summer temperature and annual moisture availability as the most influential controls of historical fire regimes' and 'a nonlinear increase in the probability of fire above an average July temperature'.
4.6. Disturbance
Physical disturbance events such as wildfire and abrupt permafrost thaw and insects are becoming more frequent and could accelerate biome shifts, including increasing tree density in taiga, expansion of tall shrubs and trees into tundra, and conversion between terrestrial and aquatic ecosystems. For example, shrubs and trees have been observed to increase in upland tundra ecosystems when permafrost thaw increases soil drainage. Price et al (2013) make the following synthesis 'Maladaptation commonly occurs when climate becomes significantly different from that to which the local gentoypes have adapted. The climatic effects may be direct (e.g. effects of increased temperature on respiration rates) or indirect (e.g. increased drought stress owing to decreased soil water availability resulting from increased evapotranspiration and (or) reduced precipitation). These climatic effects often render trees more susceptible to additional stressors and their interactions, including insect pests (Frey et al 2004, Hogg et al 2008, Morin et al 2009), disease (Kliejunas et al 2009), and fire (e.g. Bergeron and Leduc 1998, Volney and Hirsch 2005).'
4.7. Terrestrial snow cover decrease
Seasonal snow covers part of the Arctic for up to ten months each year. Through its unique physical properties of high reflectivity and low thermal conductivity, as well as its water storage effects, snow cover plays critical roles in energy and water exchanges, ice growth, hydrology, ground thermal regime, carbon cycling, and ecosystem services (Brown et al 2017). The start and end dates of snow cover, and hence its duration, are closely linked to air temperature with spring snow cover duration anomalies significantly correlated with May–June (MJ) Arctic air temperatures (R = −0.464, 1 − p = 0.998) (table 1).
There is widespread evidence of a reduced snow cover duration in the Arctic; by two to four days per decade over the past 30–40 years (figure 1(g)). The largest downward trends are occurring at high latitudes and elevations, a pattern that is consistent with Arctic amplification of warming and enhanced albedo feedbacks (Hernandez-Henriquez et al 2015, Pepin et al 2015). Most of the decrease in snow cover duration results from earlier snow melt, but delayed snow onset is more important to the snow duration decline in e.g. eastern Canadian Arctic (Brown et al 2018). Climate change attribution studies have detected the influence of greenhouse gas induced climate warming in the observed decreases of spring snow cover (Najafi et al 2016) and snow water equivalent (Jeong et al 2017).
Arctic spring (May through June) snow cover extent on land has now decreased by more than 30% since 1971 (figure 1(g)). Trends in annual maximum snow accumulation are more uncertain but suggest a decreasing trend of pan-Arctic land areas in the amount of water stored in seasonal snow cover over the past ∼20 years. There is evidence of increased ice layer development in snowpacks in some regions of the Arctic in response to more frequent winter thaw and rain-on-snow events (Langlois et al 2016).
Snow is a major driver for Arctic ecosystem functioning, affecting the surface energy balance, permafrost thaw, hydrology, plant phenology and greenhouse gas exchange. Longer snow-free periods will strongly affect tundra energy budgets, with increasing surface energy availability and higher turbulent heat fluxes to the atmosphere (Chapin et al 2005, Stiegler et al 2016). The timing of snow melt is key for both growing season CO2 (Parmentier et al 2011, Lund et al 2012) and CH4 emissions (Mastepanov et al 2013, Pirk et al 2016). Longer snow-free seasons will further extend the period of plant growth, enhancing CO2 uptake, but at the same time respiration increases too. Changes in the net carbon balance may, therefore, not be as strong (Parmentier et al 2011, Lund et al 2012) and possibly offset by increases in early winter respiration when plants have senesced (Commane et al 2017).
Changes in snow cover can also have large impacts on ecosystems outside of the growing season. Snow cover is a good insulator and protects plants from extreme winter temperatures. Winter warm spells, however, may remove this protective cover and cause plant damage (Phoenix and Bjerke 2016). Rain-on-snow events can lead to thick ground ice while a complete melt of snow cover exposes vegetation to a return to cold conditions. The damage caused by these extreme winter events can affect vegetation growth and carbon cycling in the following growing season (Parmentier et al 2018) and is linked with mass caribou mortality (Tyler 2010).
Snow cover sensitivities are complex and may include timing dependencies that create transient phenological and trophic mismatches from rapidly changing snow cover, e.g. Doiron et al (2015). Rapid advance in snowmelt timing can cause a timing mismatch between Arctic plant flowering and pollinating species, with cascading effects throughout the trophic levels (Hoye et al 2013, Schmidt et al 2016).
The relation between declining Arctic spring snow cover and lower latitude climate is unclear, as most of the available evidence suggest that potential linkages are more likely during the snow cover onset period in the fall (Cohen et al 2014). Observations of increasing Arctic snow cover in the fall period from the NOAA-CDR dataset (e.g. Cohen et al 2012) have been shown to be inconsistent with multiple lines of observational evidence and climate model simulations (Brown and Derksen, 2013, Mudryk et al 2017).
The loss of the perennial snow banks that buffer low flow periods in dry Arctic environments is evident (Woo and Young 2014). Traditional activities of northern residents such as hunting are sensitive to snow conditions (Bokhorst et al 2016). The Arctic-wide trend towards a shorter snow season is adversely impacting access to food sources with implications for health and disposable income (Furgal et al 2012).
4.7.1. Sea ice
The recent decade continues the unprecedented change in Arctic sea ice, in both the rates and magnitude of change in extent, area, thickness, spatial distribution, and most aspects of temporal and spatial variability (e.g. Overland and Wang 2013, Meier et al 2014, Comiso et al 2017). The Arctic has transformed from an environment dominated by thick multi-year sea ice to one dominated by thinner first-year sea ice (Tschudi et al 2016), with an earlier melt onset (Bliss et al 2017), later freeze-up (Markus et al 2009, Stroeve et al 2014), and longer open water period (Parkinson 2014, Stroeve et al 2016, Peng et al 2018, Wang et al 2018). Sea-ice extent (figure 1(h)), thickness and volume (Kwok and Cunningham 2015) are continuing their downward trends. The past six years have seen high variability, with record-low extent in summer 2012, low extents in 2015 through 2017, but relatively higher extent and thickness in 2013 and 2014 (though still much lower than values in the 1980s and 1990s). Here, the highest correlation among the compared variables with TArctic Warm Season is for September sea ice extent (table 1), strongly suggesting that further sea ice loss is to be expected from a warming Arctic.
The Pacific sector of the Arctic Ocean, and Hudson Bay and Baffin Bay, are showing increased open water from August through December. This autumn extension of the open-water period (Stroeve et al 2016; Peng et al 2018) is dominated by the ice albedo feedback (Perovich and Polashenski 2012; Stroeve et al 2014) and heat capture in the upper ocean (Serreze and Barry 2011; Lien et al 2017). The Atlantic sector shows increased open water in winter. The open-water period is dominated by horizontal ocean heat fluxes. Understanding the evolution of snow on sea ice remains a significant challenge and basin-wide estimates of snow are rare (Webster et al 2014). The increasing presence of very young ice types results in high salinity ice covers (e.g. frost flowers) that are reactive in chemical exchanges with the atmosphere and ocean.
Along with Arctic sea ice decline, there is emerging evidence for a loss of biodiversity in sea-ice habitats (Meier et al 2014), including that of the polar bear (Amstrup et al 2010). Open-water species, here whales (cetaceans), may see new habitats opening. According to Meier et al (2014), 'Killer whales (Orcinus orca) sightings have increased markedly in the eastern Canadian Arctic over a period of decades; associated with changing ice patterns (Higdon et al 2012), blue whales (Balaenoptera musculus) have been acoustically recorded in Fram Strait over an extended seasonal period, covering June through until October (Moore et al 2011), and North Atlantic right whales (Eubalaena glacialis) appear to have spread north as southeast Greenland (Mellinger et al 2011). Similarly, in the Pacific regions, fin whales (Balaenoptera physalus) are present in the Bering Sea almost year-round now (Stafford et al 2010) and gray whales (Eschrichtius robustus) are spending increasingly long periods in Arctic waters, delaying the southward migrations [Moore 2008]. White whales (Delphinapterus leucas) in West Greenland have shifted their summer distribution westward as sea ice has declined [Heidi-Jørgensen et al 2010]. Sea surface temperature changes (intimately linked to sea ice formation) have also been implicated in changing phonologies of movements in this species in the Canadian Arctic [Bailleaul et al 2012]. Bowhead whale (B. mysticetus) distribution has also shifted recently, with significant population level implications; Alaskan and Greenlandic populations, which have been separated by ice in the past, are now overlapping spatially in the Northwest Passage [Heidi-Jørgensen et al 2012].
4.7.2. Land ice
Observational records of Arctic land ice mass balance indicate stability or growth from 1971 until the mid 1980s, followed by a strong increase in ice loss. In the 47 year period (1971–2017), the Arctic was the largest global source of land ice to sea-level rise, accounting for 48% of the contribution during 2003–2010 (AMAP 2017) and 30% of the total sea-level rise since 1992 (Box et al 2018). After Greenland, the largest northern contributions are from Alaska, Arctic Canada and the Russian High Arctic. Glacier mass balance deficit increased in the Alaskan sector in the late 1980s followed by Arctic Canada then Greenland (figure 1(i)).
Persistent extremes in warm season atmospheric circulation are very influential for the observed mass balance changes. In figure 1(i), note for example periods of anti-correlation between Alaska and Arctic Canada mass balance, after 21st century, linked to persistent regional atmospheric circulation extremes (Box et al 2018). A shift to more negative Arctic Canada glacier mass balance occurred after 1986 (Gardner and Sharp 2007), linked to increased July air temperatures related to variations in the position and strength of the July circumpolar vortex. The years since 2013 have been a mix of extremes; Ahlstrøm et al (2017) suggest evidence for a regime shift in atmospheric circulation after 2006.
Increases in the post-2005 equilibrium line altitude by >250 m relative to the pre-2005 levels (Thomson and Copland 2017, Burgess 2017) coincide with enhanced warming of ice cap surfaces above 1400 m a.s.l. (Mortimer et al 2016). Densification of ice cap firn areas due to warming has reduced or eliminated the refreezing storage capacity of the many ice caps in this region, thus increasing their sensitivity to future warming (Noël et al 2018). Of the global glacier mass loss between 1991 and 2010, 70% has been attributed to anthropogenic climate change by Marzeion et al (2014).
Here, NCEP/NCAR reanalysis region-specific warm season (June through September) (Tregional Warm Season) and cold season (October through May) precipitation (Pregional Cold Season) is compared with Greenland, Alaskan, Canadian, Scandinavian and Svalbard land ice mass balance (table 2). First, glacier mass balance is closely varying with Tregional Warm Season. The connection is through the long demonstrated simple melting degree days relationship (e.g. Braithwaite 1995) but also connected with downward longwave irradiance (Ohmura 2001) and surface albedo reduction associated with increased melting (Hock 2003). Of the glacier mass balance regions compared, the Greenland ice sheet exhibits the strongest correlation with Tregional Warm Season, followed by Arctic Canada and Svalbard land ice mass balance. Scandinavian mass balance records, though more numerous and thus being expected to yield robust statistical sampling, do not correlate with Tregional Warm Season. Scandinavian mass balance variability has been more influenced by precipitation variability (Dowdeswell et al 1997). Norwegian glacier positive mass balance anomalies in the 1990s are attributed to North Atlantic Oscillation (NAO) extremes (Nesje et al 2000). The NAO is regarded as internal variability that is not well correlated with Tregional Warm Season. The lacking Alaskan sensitivity to Tregional Warm Season is similar to the low correlation also found comparing with the Northern Hemisphere air temperature series.
Table 2. Regional land ice mass balance comparison with regional warm season temperature and regional cold season precipitation.
| Region | Correlation coefficient, mass balance versus Tregional Warm Season | Correlation coefficient, mass balance versus Pregional Cold Season | Multiple correlation coefficient, mass balance versus Tregional Warm Season and Pregional Cold Season |
|---|---|---|---|
| Greenland | −0.612 | −0.038 | 0.620 |
| Alaska | −0.715 | 0.281 | 0.744 |
| Arctic Canada | −0.760 | 0.087 | 0.760 |
| Scandinavia | −0.674 | 0.627 | 0.823 |
| Svalbard | −0.633 | 0.032 | 0.656 |
Including precipitation totals in the regression analysis suggests a dominance of warm season climate on mass balance, consistent with Dowdeswell et al (1997) and Østby et al (2017). Note how there is a consistent pattern of larger magnitude negative mass balance correlation with Tregional Warm Season and a smaller magnitude positive mass balance correlation with Pregional Cold Season (table 2).
Taking the reasonable assumption that Tregional Warm Season is independent of Pregional Cold Season yields multiple regression correlation coefficients that are larger than single regressions with Tregional Warm Season or Pregional Cold Season (table 2). Explained variance is highest for Scandinavia (Correlation2 = 0.674) where precipitation correlates with mass balance nearly as highly as with Tregional Warm Season. Dowdeswell et al (1997) similarly found that Scandinavia had a stronger mass balance response from the relatively more variable precipitation rate for other Arctic glaciated regions.
Arctic Canada has no apparent precipitation sensitivity yet exhibits the strongest Tregional Warm Season sensitivity (Correlation = −0.760), consistent with low precipitation rates (under 300 mm yr−1, Cogley et al 1996, Dyurgerov 2002) based on the reanalysis product. Arctic Canada snow accumulation rates are similar to other High Arctic glacier regions. With few exceptions, using annual or warm season precipitation degrades the correlations, reinforcing the expectation that mass balance may be best represented by integrating cold season precipitation, i.e. the accumulation season part of the so-called 'winter balance'.
4.8. Ecosystems
Long-term observational data to identify ecosystem trends in the Arctic are few, due to the remoteness of the region. However, in the past decade, newly available contributions through sustained long-term research have begun to enhance our ability to document ecological change in the Arctic. Some of these contributions are through research programs associated with Arctic observatories, including Zackenberg in Greenland (Schmidt et al 2017), northern Sweden at Abisko (Callaghan et al 2013), and the Alaskan Arctic near Toolik Lake (Hobbie and Klings 2014, Hobbie et al 2017). Other long-term ecological data are available through coordinated networks spanning multiple sites, such as the International Tundra Experiment, that aims to evaluate the long-term effects of increases in temperature on plant growth, phenology, and community composition (Oberbauer et al 2013). Moreover, long-term Arctic vertebrate data have been compiled and routinely updated based on contributions from individuals and organizations to identify trends across 35% of the known Arctic vertebrates since 1970 (Barry and Helgason 2016). While these newly available contributions are essential for reaching a better understanding of long-term ecological Arctic change, new initiatives are also needed, particularly for data collected during the critical spring and fall shoulder seasons, as well as the winter period, to gain a better understanding of change over the full annual cycle (e.g. Bokhorst et al 2012; Blume-Werry et al 2016).
5. Summary and conclusions
5.1. Key messages
Arctic air temperature: Arctic annual average air temperatures 1971–2017 increased 2.7 °C, at 2.4 times the rate of the Northern Hemisphere average. The 3.1 °C increase in the cold season (October–May) is the largest by season, 2.8 times the rate of the Northern Hemisphere cold season average. Arctic warm season (June through September) temperatures increased 1.8 °C, 1.7 times the rate of Northern Hemisphere summer.
Alaskan permafrost: New record-high annual average temperatures in the upper 10–20 m of the ground have been observed at many permafrost observatories. At 20 m depth for three North Slope of Alaska sites (West Dock, Deadhorse and Frankiln Bluffs) we find a 2.5 °C permafrost temperature increase in the past 47 years.
Arctic hydroclimatology: Observations from land and coastal stations indicate widespread increases in humidity, low-level clouds, precipitation, rainfall (at the expense of snowfall), river discharge, sedimentation and delivery of organic matter to the Arctic ocean, freshening of the Arctic Ocean, and reductions in snow cover, all of which are controlling factors in Arctic terrestrial and probably marine ecosystems.
Snow cover: Arctic snow cover is responding to multiple environmental drivers and feedbacks (such as warming, increased moisture availability, changing atmospheric circulation, changing vegetation, increased frequency of winter thaws, rain-on-snow events). There is widespread multi-dataset evidence of declining snow cover over the Arctic with the annual duration of snow on the ground shortening by 2 to 4 days per decade with the largest negative trends occurring at high latitudes and elevations consistent with AA of warming and enhanced albedo feedbacks.
Arctic Ocean sea ice: Sea ice extent and volume are continuing their downward trends. The past decade had record-low extent in summer 2012, and it is the lowest decade ever in satellite era beginning in the 1970s. These are unprecedented change in Arctic sea ice, in both the rates and magnitude of change in extent, area, thickness, and spatial distribution. Along with Arctic sea ice decline, there is emerging evidence for a loss of biodiversity in sea-ice habitats.
Arctic land ice: In the 47 year period (1971–2017), the Arctic was the largest global source of sea-level rise contribution, 48% of the global land ice contribution 2003–2010 and 30% of the total sea-level rise since 1992. Temperature effects are dominant in land ice mass balance; precipitation represents a source of either damping or amplifying feedbacks respectively via snow and rain.
Arctic region wildfires: Drier conditions and an increase in maximum air temperatures contribute to increased fire risk. Fire clearly causes dramatic short-term changes in vegetation and ecosystem function. The fire-climate relationship is related to increasing lightning ignition that is shown to correlate with air temperature and precipitation, thus linking Arctic warming with the liklihood for increased fire.
Tundra and terrestrial ecosystems: Arctic greening has been observed across tundra ecosystems over the past 30 years. The increase of Arctic tundra average and maximum NDVI both correlate with Arctic warm season air temperature with high confidence.
Carbon cycling: The changes in the global climate system are already affecting biogeophysical energy exchange and transport within the Arctic. The response of the carbon cycle in northern high latitude regions is influenced by terrestrial carbon exchange and by coupling between the land and ocean, which has worldwide consequences. Importantly, there are substantial organic matter stocks of carbon in the Arctic contained in permafrost and within the methane hydrates that exist beneath both subterranean and subsea permafrost of the Arctic, all of which can affect carbon cycling. Observational data indicate increased tundra ecosystem CO2 uptake during the growing season. Further temperature increase will affect tundra CO2 and CH4 emissions, their ratio being dependent on local hydrology and permafrost thaw.
5.2. Closing remarks
Increasingly clear linkages are evident within and between multiple Arctic climate indicators, having cascading effects, from condensed flowering and pollination plant species periods; timing mismatch between plant flowering and pollinators; increased plant vulnerability to insect disturbance; increased shrub biomass; increased ignition of wildfires; increased growing season CO2 uptake, with counterbalancing increases in shoulder season and winter CO2 emissions; increased carbon cycling, regulated by local hydrology and permafrost thaw; conversion between terrestrial and aquatic ecosystems; and shifting animal distribution and demographics.
The Arctic biophysical system is now clearly trending away from its previous state and into a period of unprecedented change, with implications not only within but also beyond the Arctic. These indicator-based observations also provide a foundation for the research that is needed to address the gaps in knowledge and to support a more integrated understanding of the Arctic region and its role in the global dynamics of the Earth's biogeophysical systems.
5.3. Recommendations for future work
Future work should be concerned with further unifying our understanding of physical and biological elements of the Arctic system.
In situ observations must be maintained, especially where verifying higher spatial coverage satellite observation, in data assimilation and for model verification studies. Further, in situ observations should be extended to include the critical winter period.
There is a need to quantify ecosystem impacts of changes and their relationships to physical drivers in the Arctic system.
Indicators that capture changes in extreme events (winds, extreme temperatures, intense precipitation events, droughts, fires) are needed to complement indicators based on mean values, especially in the context of impacts on humans and ecosystems.
Socioeconomic indicators are largely absent from this study, primarily because their development has lagged the compilation of physical and biological indicators.
Major gaps include: poor knowledge of Arctic precipitation; Arctic snow water equivalent; Arctic freshwater budget, lacking high resolution homogeneous reanalysis datasets; hydrological and biophysical processes in mountain regions; etc.
The period since SWIPA 2011 has seen important advances in snow science and greater understanding of the role and interactions of snow in Arctic soil-climate-vegetation systems. However, there are still fundamental knowledge gaps and scaling issues that need to be addressed to narrow uncertainties in observing, understanding, and predicting Arctic snow cover and snow-cover processes.
Critical areas for further work include: documenting and narrowing the uncertainties in snow observing systems over the Arctic (snow water equivalent in particular); more realistic treatment of sub grid-scale processes and snow-vegetation interactions in land surface models; and the development of fully-coupled snow chemistry and physics models.
Acknowledgments
This work is in support of the Arctic Monitoring and Assessment Program (AMAP). Financing for this study is primarily by DANCEA (Danish Cooperation for Environment in the Arctic) under the Danish Ministry of Energy, Buildings and Climate. Wang is partially funded by the Joint Institute for the Study of the Atmosphere and Ocean (JISAO) under NOAA Cooperative Agreement NA15OAR4320063, Contribution No. 2018–0169, NOAA grant (NA17OAR4310160). Parmentier was supported by the Norwegian Research Council under grant agreement 274711, and the Swedish Research Council under registration nr. 2017-05268.
Footnotes
- 25
Both temperature and precipitation time series are temporally detrended to avoid spurious correlation.