
Abstract
Comprehensive analysis of molecular pathology requires a collection of reference samples representing normal tissues from healthy donors. For the available limited collections of normal tissues from postmortal donors, there is a problem of data incompatibility, as different datasets generated using different experimental platforms often cannot be merged in a single panel. Here, we constructed and deposited the gene expression database of normal human tissues based on uniformly screened original sequencing data. In total, 142 solid tissue samples representing 20 organs were taken from post-mortal human healthy donors of different age killed in road accidents no later than 36 hours after death. Blood samples were taken from 17 healthy volunteers. We then compared them with the 758 transcriptomic profiles taken from the other databases. We found that overall 463 biosamples showed tissue-specific rather than platform- or database-specific clustering and could be aggregated in a single database termed Oncobox Atlas of Normal Tissue Expression (ANTE). Our data will be useful to all those working with the analysis of human gene expression.
Design Type(s) | gene expression analysis objective • data integration objective • organism part comparison design • transcription profiling design |
Measurement Type(s) | transcription profiling assay |
Technology Type(s) | RNA sequencing |
Factor Type(s) | sex • age • organism subdivision |
Sample Characteristic(s) | Homo sapiens • kidney • Kidney • Colon • Liver • brain • Lung • endometrium • Ovary • prostate gland • Esophagus • Stomach • Mammary gland • Thyroid gland • Pancreas • Tonsil • skeletal muscle tissue • small intestine • Adrenal gland • urinary bladder • skin of body • uterus • uterine cervix • Small intestine • tonsil • blood • bone marrow • esophagus • liver |
Machine-accessible metadata file describing the reported data (ISA-Tab format)
Background & Summary
High throughput gene expression (transcriptomic) analyses can be used in every aspect of biomedicine1,2,3, including fundamental research4,5,6 and molecular diagnostics7. Growing amount of transcriptomic data is deposited in the special public repositories like Gene Expression Omnibus, GEO8 and Array-Express9 which have already accumulated over two million individual transcriptomic profiles obtained in over 100,000 series of experiments10. The data cover a wide spectrum of specific human physiological conditions, including most of known diseases and developmental features8,9,11,12.
The enclosed transcriptional profiles were obtained using different experimental platforms of either microarray hybridization or next-generation sequencing (NGS) of mRNA. However, the gene expression may be poorly comparable across the different platforms because of use of different equipment and reagents13,14,15,16,17. The NGS methods have become the standard in the field of gene expression studies because of higher reproducibility and lower platform bias18.
Comprehensive studies of molecular pathology or tissue specific patterns require a collection of reference samples19,20. Ideally, they should represent normal tissues from healthy donors, profiled in a single series of experiments using the same equipment and reagents. Nowadays, there is a shortage of such gene expression data. The largest published dataset, GTEx21 (11,688 samples), lacks publicly available data on the donors’ age, and this puts limits on data analysis and makes impossible age-matched studies, which are crucial for many practical applications and aging research. For that reason, we didn’t include GTEx data in this study.
The other relevant databases of significant size do include the information on the donors’ age: TCGA22 (625 samples), ENCODE23 polyA RNA-seq (38 samples), and ENCODE total RNA-seq (89 samples). However, they lack one or several of the previously mentioned features. For example, in The Cancer Genome Atlas (TCGA) project database, specimens of histologically normal tissue adjacent to surgically removed tumors24 are considered normal. However, these tissues may not be completely normal due to numerous effects tumors may have on the neighboring cells, including biased growth factors and cytokine balances25, pathological inflammation26, and altered vascularization27. The ENCODE polyA RNA-seq and ENCODE total RNA-seq datasets were generated based on the normal tissues subjected to NGS using different library preparation methods. They have only 1–4 samples profiled per tissue type (both male and female donors included) and most of the cases can not form a statistically significant reference group.
During our study we have designed and assembled the gene expression database of normal human tissues based on uniformly obtained original sequencing data using Illumina HiSeq-3000 engine. A total of 142 solid tissue samples representing 20 organs were taken from post-mortem human healthy donors, who had died in road accidents, no later than 36 hours after death. Blood samples were taken from 17 healthy volunteers. The materials, that had been being collected since 2012, were stored until gene expression profiles were obtained in one series of experiments using the same reagents and protocols. The gene expression profiles were then submitted to Gene Expression Omnibus under accession id GSE12079528. We also compared our data for consistency with the transcriptomic profiles taken from databases The Cancer Genome Atlas (TCGA), ENCODE polyA RNA-seq, and ENCODE- total RNA-seq. We found that 463 biosamples showed tissue-specific rather than platform- or database-specific clustering. These have beeen aggregated in a single database named Oncobox Atlas of Normal Tissue Expression (ANTE) (can be found on Figshare29 in the file “ANTE overview”), including 11 sex-matched statistically significant tissue groups. Our data will be useful to all those working with the analysis of human gene expression.
Methods
Biosamples
In the period from March 2012 to May 2018, we obtained 142 solid tissue samples from 20 human organs at the Department of Pathology at the Faculty of Medicine, Moscow State University, Russia, from autopsies taken from 23 non-related adult healthy donors killed in road accidents, no later than 36 hours after death. We also collected normal blood samples from 17 healthy volunteers. For each biosample an informed written consent to participate in the study was obtained from the patient’s legal representative. The consent procedure and the design of the study were approved by the ethical committees of the Faculty of Medicine, Moscow State University, and of the National Research Center for Hematology. The biosamples were evaluated by a pathologist to confirm the tissue origin of every specimen prior to analyses.
Overall, blood and solid tissues were taken from 8 male and 9 female and 14 male and 9 female donors, respectively. The mean age was 33.47 years old (range 23–75 y.o.) and 37.39 y.o. (12–54 y.o.), respectively. The full list of the tissues and biosamples obtained is given in Online-only Table 1.
Preparation of libraries and RNA sequencing
RNA extraction
Solid tissue samples were either immediately stabilized in RNAlater (Qiagen, Germany) and then stored at −70 °C or fixed in formalin and embedded in paraffin blocks. RNA extraction was performed immediately before the preparation of sequencing libraries using QIAGEN RNeasy Kit (Qiagen) or Direct-zol™ RNA MiniPrep (Zymo Research) with TRI Reagent (MRC) for tissues in RNAlater and the RecoverAll™ Total Nucleic Acid Isolation Kit for FFPE (Invitrigen), following the manufacturer’s protocol. In cases of whole blood normal samples, mononuclear cells were extracted shortly after peripheral blood collection. Alternatively, a fraction of CD138 + cells was isolated from bone marrow with Ficoll Paque Plus (Sigma) followed by enrichment using CD138 MicroBeads (Miltenyi Biotec) and MS Columns (Miltenyi Biotec). Cells were counted by Scepter™ 2.0 Handheld Automated Cell Counter (Merck Millipore) and immediately subjected to RNA extraction. For RNA extraction, cells were resuspended in TRI Reagent (MRC) and then Direct-zol™ RNA MiniPrep (Zymo Research) was used for the RNA extraction. RNA was quantified using Nanodrop (Thermo Fisher Scientific), ethanol-precipitated, and stored in liquid nitrogen until sequencing.
Library preparation
RNA Integrity Number (RIN) was measured using Agilent 2100 bioanalyzer. Agilent RNA 6000 Nano or Qubit RNA Assay Kits were used to measure RNA concentration. KAPA RNA Hyper with RiboErase (KAPA Biosystem) Kit was used for further depletion of ribosomal RNA and library preparation. Different adaptors were used for multiplexing samples in one sequencing run. Library concentrations and quality were measured using Qubit ds DNA HS Assay kit (Life Technologies) and Agilent Tapestation (Agilent). RNA sequencing was performed using Illumina HiSeq 3000 equipment for single end sequencing, 50 bp read length, for approximately 30 million raw reads per sample. Data quality check was conducted using Illumina SAV. De-multiplexing was performed using Illumina Bcl2fastq2 v 2.17 software.
Processing of RNA sequencing data
RNA sequencing FASTQ files were processed with STAR aligner30 in ‘GeneCounts’ mode with the Ensembl human transcriptome annotation (Build version GRCh38 and transcript annotation GRCh38.89). Ensembl gene IDs were converted to HGNC gene symbols using Complete HGNC dataset (https://www.genenames.org, database version of July 13, 2017. In total, expression levels were established for 36596 annotated genes with corresponding HGNC identifiers. Additional QC metrics for obtained data were generated using NCBI MAGIC software18,31,32. All metrics and detailed protocol for each sample can be found on Figshare29 in the file “QC and additional meta-information”.
Data clustering
‘1’ was added to all raw gene counts prior to cluster analyses, to avoid zero expression values, as described by Dillies et al.33, the gene expression data were merged into single datasets and quantile normalized34. Hierarchical clustering was performed using R ward.D2 method. The dendrogram was visualized using custom R script.
Data Records
Gene expression profiles were deposited at the Gene Expression Omnibus database (GEO) under accession number GSE12079528. The data is provided as a matrix of raw counts as generated by STAR. The raw data can be downloaded from the Sequence Read Archive (SRA35). The mapping statistics for corresponding dataset can be found on Figshare29 in the file “QC and additional meta information”. The available RNA sequencing profiles for normal and cancer tissues matched normal samples were extracted from the websites of projects TCGA and ENCODE (portal.gdc.cancer.gov and www.encodeproject.org, respectively). Combined meta information for compatible gene expression profiles from different databases can be found on Figshare29 in the file “ANTE overview”.
Technical Validation
RNA sequencing data quality control and consistency tests
To assess if the obtained gene expression profiles are in correlation with the biological nature of the biosamples tested and identify samples that might be of low quality, we performed cluster analysis of all the RNA sequencing data we had obtained (Fig. 1). The color on the dendrogram indicates technical type of biosamples: FFPE or tissue in RNAlater for solid tissue, and RNA in ethanol for blood samples.

The hierarchical clustering dendrogram of all experimental RNA sequencing profiles of human tissues. Gene expression data were used to calculate Euclidian distances between the samples. Color indicates the sample preparation method (tissue in FFPE, RNA in ethanol, tissue in RNAlater). The lower scale indicates the number of uniquely mapped reads. QC denotes the quality control threshold of 2.5 million uniquely mapped reads.
The FFPE and RNAlater samples formed several mixed clusters on the dendrogram, which suggests that the clustering was independent of the sample preparation technique for solid tissues. The blood samples formed a clearly distinct cluster on the left side of the dendrogram, which is in line with the histological status of this tissue (Fig. 1), which stand apart among other samples.
However, we then observed a mixed cluster next to the one formed by the blood samples, which included both blood and solid tissue specimens (Fig. 1, red), and such clustering did not correspond to physiological origin of biosamples. We noticed that that cluster was formed exclusively by the samples with relatively low (less than 2.5 million) number of uniquely mapped sequencing reads (Fig. 1, scale) and hypothesized that this may represent a deviation which arose due to insufficiency of data. We analyzed contents of the samples with respect to the number of uniquely mapped reads (Fig. 2) and found that the samples with lowest number of reads indeed formed a distinct cluster with the upper threshold of ~2.5 million reads uniquely mapped to HGNC genes (Fig. 2). We, therefore, used this threshold, which enabled us to separate effectively solid tumors from hematological ones, as an indicator for quality control (QC) of the sequenced gene expression profiles. 132 samples out of a total of 159 passed the QC threshold (Table 1). After the QC filter was applied RNA sequencing profiles became clustered in the hierarchical way following the histological origin of the tissues (Fig. 3).

The distribution of the experimental RNA sequencing profiles with respect to the number of uniquely mapped reads. The vertical dashed line indicates the QC threshold of 2.5 million uniquely mapped reads per sample.

The hierarchical clustering dendrogram of QC-passed experimental RNA sequencing profiles of human tissues. Gene expression data were used to calculate Euclidian distances between the samples. The color markers indicate the tissue types. The lower scale indicates the number of uniquely mapped reads. ‘QC’ denotes the quality control threshold of 2.5 million uniquely mapped reads.
The established threshold effectively marked samples with low quality values of other QC metrics, e.g. proportion of genomic counts, high rate of mismatches, number of reads spanning splice junction, high percentage of ribosomal counts. Full list of mapping statistics generated by STAR aligner and additional QC metrics generated by NCBI MAGIC is available on Figshare29 in the file “QC and additional meta information”.
We then looked for a correlation between whether a biosample passes the QC and its internal characteristics. The following parameters were investigated:
-
(i)
RIN, that shows the level of RNA degradation (lower RIN points to more degraded RNA). All samples with high RIN (RIN > 4) passed the QC (Fig. 4). However, low RIN turned out not to be an informative marker of the insufficient number of reads, and most of the samples with 1 < RIN < 2 passed the QC as well.
Fig. 4 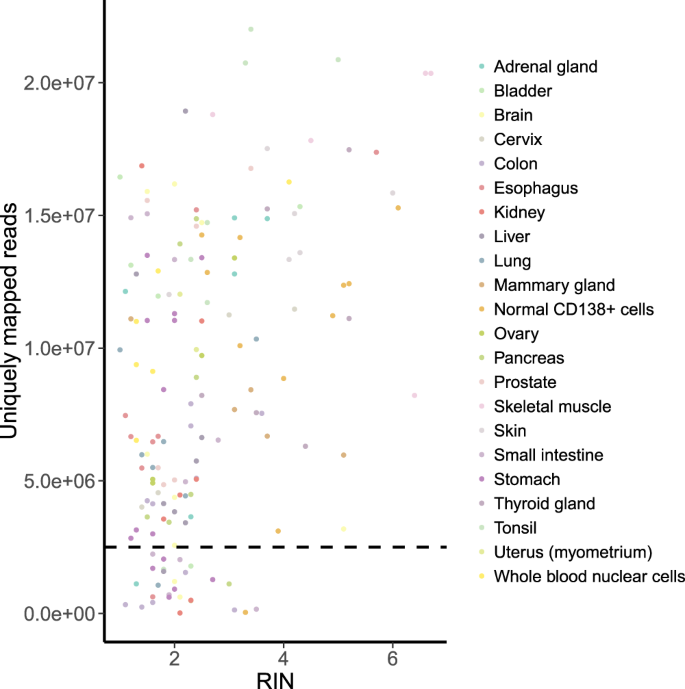
RIN vs number of uniquely mapped reads per sample. Spearman’s rho = 0.344 (p-value = 9.687e-06). The horizontal dashed line indicates the QC threshold of 2.5 mln uniquely mapped reads.
-
(ii)
RNA concentration. We found no correlation between RNA concentration and number of uniquely mapped reads (Fig. 5). Therefore, low RNA concentration was not a significant indicator for quality assessment. In most of the cases, low RNA concentration still allowed the sample to pass the QC.
Fig. 5 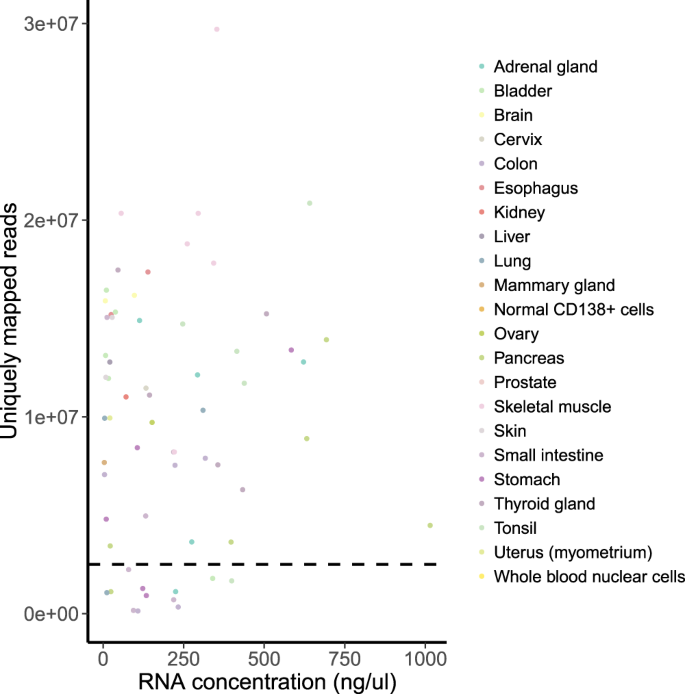
RNA concentration vs number of uniquely mapped reads per sample. Spearman’s rho = 0.03 (p-value = 0.8). The horizontal dashed line indicates the QC threshold of 2.5 mln uniquely mapped reads.


Only the samples that had more reads than the QC threshold were analyzed in further comparisons.
Finally, we assessed the reproducibility of the RNA sequencing output data for the characterization of normal human tissues. We performed RNA sequencing of four different fragments of each of the following tissue specimens: two human liver (ID 16_5) and esophagus (ID E_3). The tissue fragments were blinded and sent for sequencing separately. In each case, one of quadruplicates was sequenced and mapped in a separate batch. In both cases we observed high pairwise correlation coefficients between quantile normalized gene expression values (Spearman’s rho ≥ 0.94 in all cases) (Fig. 6a,b). We concluded that the obtained gene expression profiles are highly reproducible among the replicates for materials taken from different portions of the same biosample.

The correlation plots for four gene expression profiles in replicate RNA sequencing experiments. (a) Comparison for the esophagus, E_3 tissue biosample. (b) Comparison for the liver, ID 15_6 tissue biosample. Upper part of the diagonally split matrix shows correlation coefficients (Spearman’s rho). Bottom diagonal shows pairwise plots for gene expression values in logarithmic scale for every pair of replicates under comparison.
Compatibility with other gene expression datasets
After that we checked if our gene expression data are compatible with previously published transcriptomic datasets. The largest published datasets of RNA sequencing data for normal tissues were TCGA database22 of ‘normal’ tissues adjacent to tumors (625 samples, see the file “TCGA gene expression data” on Figshare29), ENCODE23 database, poly(A) priming library preparation (38 samples, see the file “ENCODE polyA RNA-seq gene expression data” on Figshare29), and ENCODE23 database, random priming library preparation (see the file “ENCODE total RNA-seq gene expression data” on Figshare29). All the above mentioned gene expression profiles, both obtained in our experiments and published earlier, were merged and quantile normalized34. We then performed cluster analysis of these data and found that both ENCODE databases showed clustering similar to that of the current experimental database, with clear tissue specific, rather than database specific, clustering patterns (Fig. 7). Contrariwise, most of the samples from the TCGA database clustered in a database specific way (Fig. 7), probably due to cancer-associated pathological changes in the respective tissue specimens. However, the TCGA samples of lung, liver, kidney, thyroid gland, adrenal gland, and brain clustered according to the tissue they represent along with the samples from other datasets (Fig. 7). We then assembled all the biosamples in all four datasets, that clustered in the tissue-specific way, in a single database named Oncobox Atlas of Normal Tissue Expression (ANTE). The database overview is presented in the Table 2, the detailed information can be found on Figshare29 in the file “ANTE overview”. In total, the ANTE database contains 463 transcriptomic profiles for 11 tissue types. All the types of tissue are represented by seven samples or more, with the mean representation of 42 samples per tissue.

The dendrogram of normal samples from Oncobox (no prefix in sample names), TCGA database (“TCGA_” prefix in samples names) and ENCODE (“ENCODE_” prefix in samples names). For the TCGA data 10 random samples per tissue type were selected for visualization, in cases when more norms were available. Euclidian distance between the samples was measured using gene expression data. The dendrogram was built using R ward.D2 method. The color markers indicate the tissue type. The lower scales indicate the number of uniquely mapped reads.
Usage Notes
We have assembled the gene expression database of normal human tissues termed Oncobox Atlas of Normal Tissue Expression (ANTE). The database includes 67 original experimental and 396 previously published gene expression profiles for 11 normal human tissues. The experimental profiles that are published here for the first time can be considered a golden standard data from the histopathological point of view as they had been obtained for the post-mortem human healthy donors, killed in road accidents, no later than 36 hours after death. Blood samples were taken from 17 healthy volunteers. The ANTE database provides unparalleled source of normal human tissues for transcriptomic research. The data in the database are in a machine-readable format and annotated by the available patients’ data which include tissue type, sex, and age of a donor. Besides comparisons of individual gene expressions, e.g. of pathological v normal human tissues, this collection of molecular data could be beneficial for a more complex level of data analysis such as molecular pathway activation scoring36,37 and bioinformatic ranking of drugs38. Additionally, the database can be used to revise lists of tissue specific gene expression biomarkers and housekeeping genes.
Code Availability
R code for building dendrograms with bar plots is freely available on Gitlab at: https://gitlab.com/oncobox/watermelon_multisection/blob/master/utils/gallow_plot.R.
References
Campbell, J. D., Spira, A. & Lenburg, M. E. Applying gene expression microarrays to pulmonary disease. Respirology 16, 407–418 (2011).
Laguna, J. C. & Alegret, M. Regulation of gene expression in atherosclerosis: insights from microarray studies in monocytes/macrophages. Pharmacogenomics 13, 477–495 (2012).
Gov, E., Kori, M. & Arga, K. Y. RNA-based ovarian cancer research from ‘a gene to systems biomedicine’ perspective. Syst. Biol. Reprod. Med. 63, 219–238 (2017).
Bak, R. O. & Mikkelsen, J. G. miRNA sponges: soaking up miRNAs for regulation of gene expression. Wiley Interdiscip. Rev. RNA 5, 317–333 (2014).
Friedensohn, S. & Sawarkar, R. Cis-regulatory variation: significance in biomedicine and evolution. Cell Tissue Res 356, 495–505 (2014).
Vedeler, A., Hollas, H., Kari Grindheim, A. & M. Raddum, A. Multiple Roles of Annexin A2 in Post-Transcriptional Regulation of Gene Expressio. Curr. Protein Pept. Sci. 13, 401–412 (2012).
Sapino, A. et al. MammaPrint Molecular Diagnostics on Formalin-Fixed, Paraffin-Embedded Tissue. J. Mol. Diagnostics 16, 190–197 (2014).
Edgar, R., Domrachev, M. & Lash, A. E. Gene Expression Omnibus: NCBI gene expression and hybridization array data repository. Nucleic Acids Res 30, 207 (2002).
Brazma, A. et al. ArrayExpress—a public repository for microarray gene expression data at the EBI. Nucleic Acids Res. 31, 68 (2003).
Barrett, T. et al. NCBI GEO: archive for functional genomics data sets—update. Nucleic Acids Res. 41, D991–D995 (2012).
Jones, C., Simpson, P., Mackay, A. & Lakhani, S. R. In Breast Cancer Research Protocols 403–414 (Humana Press, 2006).
McLendon, R. et al. Comprehensive genomic characterization defines human glioblastoma genes and core pathways. Nature 455, 1061–1068 (2008).
Buzdin, A. A. et al. The OncoFinder algorithm for minimizing the errors introduced by the high-throughput methods of transcriptome analysis. Front. Mol. Biosci. 1, 8 (2014).
Maouche, S. et al. Performance comparison of two microarray platforms to assess differential gene expression in human monocyte and macrophage cells. BMC Genomics 9, 302 (2008).
Zhang, L. et al. Investigating the concordance of Gene Ontology terms reveals the intra- and inter-platform reproducibility of enrichment analysis. BMC Bioinformatics 14, 143 (2013).
Lin, S.-H. et al. Cross-Platform Prediction of Gene Expression Signatures. PLoS One 8, e79228 (2013).
Wen, Z. et al. Evaluation of gene expression data generated from expired Affymetrix GeneChip® microarrays using MAQC reference RNA samples. BMC Bioinformatics 11, S10 (2010).
SEQC/MAQC-III Consortium. A comprehensive assessment of RNA-seq accuracy, reproducibility and information content by the Sequencing Quality Control Consortium. Nat. Biotechnol. 32, 903–914 (2014).
Kilpinen, S. K., Ojala, K. A. & Kallioniemi, O. P. Alignment of gene expression profiles from test samples against a reference database: New method for context-specific interpretation of microarray data. Bio Data Min 4, 5 (2011).
Dvinge, H. et al. Sample processing obscures cancer-specific alterations in leukemic transcriptomes. Proc. Natl. Acad. Sci. 111, 16802–16807 (2014).
Lonsdale, J. et al. The Genotype-Tissue Expression (GTEx) project. Nat. Genet. 45, 580–585 (2013).
Cancer Genome Atlas Research Network, J. N. et al. The Cancer Genome Atlas Pan-Cancer analysis project. Nat. Genet. 45, 1113–20 (2013).
Davis, C. A. et al. The Encyclopedia of DNA elements (ENCODE): data portal update. Nucleic Acids Res. 46, D794–D801 (2018).
Huang, X., Stern, D. F. & Zhao, H. Transcriptional Profiles from Paired Normal Samples Offer Complementary Information on Cancer Patient Survival – Evidence from TCGA Pan-Cancer Data. Sci. Rep 6, 20567 (2016).
Jones, A. C. et al. Prostate Field Cancerization: Deregulated Expression of Macrophage Inhibitory Cytokine 1 (MIC-1) and Platelet Derived Growth Factor A (PDGF-A) in Tumor Adjacent Tissue. PLoS One 10, e0119314 (2015).
Casbas-Hernandez, P. et al. Tumor Intrinsic Subtype Is Reflected in Cancer-Adjacent Tissue. Cancer Epidemiol. Biomarkers Prev. 24, 406–414 (2015).
Zhao, Y. et al. Renal cell carcinoma-adjacent tissues enhance mobilization and recruitment of endothelial progenitor cells to promote the invasion of the neoplasm. Biomed. Pharmacother. 67, 643–649 (2013).
Buzdin, A. et al. Atlas of RNA sequencing profiles of normal human tissues. Gene Expression Omnibus, http://identifiers.org/geo:GSE120795 (2018).
Li, X. et al. Atlas of RNA sequencing profiles for normal human tissues. figshare. https://doi.org/10.6084/m9.figshare.c.4270817 (2019).
Dobin, A. et al. STAR: ultrafast universal RNA-seq aligner. Bioinformatics 29, 15–21 (2013).
Thierry-Mieg, D. & Thierry-Mieg, J. AceView: a comprehensive cDNA-supported gene and transcripts annotation. Genome Biol. 7(Suppl 1), S12.1–14 (2006).
Wang, C. et al. The concordance between RNA-seq and microarray data depends on chemical treatment and transcript abundance. Nat. Biotechnol. 32, 926–32 (2014).
Dillies, M.-A. et al. A comprehensive evaluation of normalization methods for Illumina high-throughput RNA sequencing data analysis. Brief. Bioinform. 14, 671–83 (2013).
Bolstad, B. M., Irizarry, R. A., Astrand, M. & Speed, T. P. A comparison of normalization methods for high density oligonucleotide array data based on variance and bias. Bioinformatics 19, 185–93 (2003).
NCBI Sequence Read Archive, http://identifiers.org/ncbi/insdc.sra:SRP163252 (2018).
Ozerov, I. V. et al. In silico Pathway Activation Network Decomposition Analysis (iPANDA) as a method for biomarker development. Nat. Commun. 7, 13427 (2016).
Buzdin, A. A. et al. Oncofinder, a new method for the analysis of intracellular signaling pathway activation using transcriptomic data. Front. Genet. 5, 55 (2014).
Buzdin, A. et al. Molecular pathway activation – New type of biomarkers for tumor morphology and personalized selection of target drugs. Semin. Cancer Biol. https://doi.org/10.1016/j.semcancer.2018.06.003 (2018).
Acknowledgements
The study was supported by the Oncobox research program in oncology, by OmicsWay Corp., by Amazon and Microsoft Azure grants for cloud-based computational facilities, by RSCF grants: 17-74-10197 to Maxim Sorokin (bioinformatic data analysis), 18-15-00061 to Anton Buzdin and Maria Suntsova (tissue collection management and histopathological analysis, breast tissue sequencing), 14-14-01089 to Pavel Spirin and Vladimir Prassolov (isolation and preparation of blood tissue samples).
Author information
Authors and Affiliations
Contributions
M.Su, N.G., M.So, V.P., A.M., A.G. and A.B. contributed conception and design of the study. N.G., A.R. performed autopsies. M.N., P.S., V.P., L.M., V.M., A.S. isolated and prepared blood tissue samples. D.A. did histological investigations. M.Su, D.A., X.L. performed molecular analyses. M.Su, N.G., M.So, A.M., A.G. and A.B. analyzed the data. M.Su, A.M., M.So, A.B. wrote the paper.
Corresponding author
Ethics declarations
Competing Interests
The authors declare no competing interests.
Additional information
Publisher’s note: Springer Nature remains neutral with regard to jurisdictional claims in published maps and institutional affiliations.
Online-only Table
ISA-Tab metadata file
Rights and permissions
Open Access This article is licensed under a Creative Commons Attribution 4.0 International License, which permits use, sharing, adaptation, distribution and reproduction in any medium or format, as long as you give appropriate credit to the original author(s) and the source, provide a link to the Creative Commons license, and indicate if changes were made. The images or other third party material in this article are included in the article’s Creative Commons license, unless indicated otherwise in a credit line to the material. If material is not included in the article’s Creative Commons license and your intended use is not permitted by statutory regulation or exceeds the permitted use, you will need to obtain permission directly from the copyright holder. To view a copy of this license, visit http://creativecommons.org/licenses/by/4.0/.
The Creative Commons Public Domain Dedication waiver http://creativecommons.org/publicdomain/zero/1.0/ applies to the metadata files associated with this article.
About this article

Cite this article
Suntsova, M., Gaifullin, N., Allina, D. et al. Atlas of RNA sequencing profiles for normal human tissues. Sci Data 6, 36 (2019). https://doi.org/10.1038/s41597-019-0043-4
Received:
Accepted:
Published:
DOI: https://doi.org/10.1038/s41597-019-0043-4
This article is cited by
-
Lipidomics reveals new lipid-based lung adenocarcinoma early diagnosis model
EMBO Molecular Medicine (2024)
-
Developing a Radiomics Atlas Dataset of normal Abdominal and Pelvic computed Tomography (RADAPT)
Journal of Imaging Informatics in Medicine (2024)
-
Identification of tumor-related genes via RNA sequencing of tumor tissues in Xenopus tropicalis
Scientific Reports (2023)
-
Differences in Transcriptomic Profiles of Brain and Thyroid Tumors with NTRK Gene Rearrangement
Bulletin of Experimental Biology and Medicine (2023)
-
Depiction of neuroendocrine features associated with immunotherapy response using a novel one-class predictor in lung adenocarcinoma
Discover Oncology (2023)
