
Abstract
The blood–brain barrier (BBB) greatly restricts the entry of biological and engineered therapeutic molecules into the brain. Due to challenges in translating results from animal models to the clinic, relevant in vitro human BBB models are needed to assess pathophysiological molecular transport mechanisms and enable the design of targeted therapies for neurological disorders. This protocol describes an in vitro model of the human BBB self-assembled within microfluidic devices from stem-cell-derived or primary brain endothelial cells, and primary brain pericytes and astrocytes. This protocol requires 1.5 d for device fabrication, 7 d for device culture and up to 5 d for downstream imaging, protein and gene expression analyses. Methodologies to measure the permeability of any molecule in the BBB model, which take 30 min per device, are also included. Compared with standard 2D assays, the BBB model features relevant cellular organization and morphological characteristics, as well as values of molecular permeability within the range expected in vivo. These properties, coupled with a functional brain endothelial expression profile and the capability to easily test several repeats with low reagent consumption, make this BBB model highly suitable for widespread use in academic and industrial laboratories.
Introduction
The blood–brain barrier (BBB) constitutes the main access point into the brain parenchyma for endogenous and therapeutic molecules alike. Molecular transport across the BBB is highly regulated, owing principally to its unique cellular architecture with endothelial cells (ECs) lining the blood vessels, pericytes (PCs) in close contact with the ECs, and astrocytes (ACs) extending their end-feet to the abluminal side of the vessels1,2. This configuration results in the formation of tight junctions between ECs that limit paracellular transport, while transcellular transport (transcytosis) is also diminished across the BBB owing to reduced vesicular traffic2,3. At the same time, expression of efflux pumps in BBB ECs can strongly oppose small-molecule diffusion across the cell membrane4. This uniquely restrictive interface between blood and parenchyma protects the brain from toxins and pathogens, yet conversely limits the passage of therapeutics5. Models of the human BBB can, therefore, find widespread use as tools to study molecular transport in health and disease and aid the development of therapeutics with improved distribution into the brain.
Difficulties in translating results from animals to the clinic have led several research groups to focus their efforts on the design of in vitro models of the BBB. Numerous 2D EC monolayer assays using human cells in coculture (ECs and PCs or ACs) have been designed in the hope of modeling transport of therapeutic molecules across the selective endothelium6,7,8. These models, however, intrinsically fall short of recapitulating the 3D cellular organization of brain capillaries. Recently, greater emphasis has been placed on generating 3D BBB models where cells are embedded in a physiologically relevant gel matrix. While these techniques are able to generate tube-like vessel structures, the geometries and cellular organization achieved still fail to mimic the BBB in vivo9,10,11. Critically, the functional properties of these models do not fully recapitulate physiological levels, particularly in terms of protein/gene expression profiles and vascular barrier function.
We recently developed a human BBB model incorporating ECs, PCs and ACs encased in a 3D gel matrix within microfluidic devices12. The cells self-assemble into 3D vessel architectures resembling the natural BBB, with gene expression profiles and permeability values to macromolecules comparable to those observed in vivo. Methodologies developed in our group allow for quantitative assessment of permeability in the model for any molecules of interest13,14. The present protocol comprises the steps required to fabricate this BBB model and measure physiologically relevant molecular permeabilities, which may be used in academic or industry laboratories to study and predict transport across the BBB.
Development of the protocol
Recognizing the need to better recapitulate the human BBB in vitro, as well as the challenges of current 2D or 3D systems, we developed an in vitro microfluidic model of the BBB featuring perfusable microvascular networks (MVNs) composed of human ECs, PCs and ACs12. This protocol extends on our previous MVN model in which human umbilical vein ECs were used to generate microvessels in one channel of the microfluidic device, and normal human lung fibroblasts were used in the adjacent channels for stromal support15. Here, we engineer a brain-specific human microvascular model within an improved microfluidic device design that allows for culture of all BBB cell components in the same gel matrix. Induced pluripotent stem-cell-derived ECs (iPS-ECs) or primary human brain microvascular ECs (HBMECs) are cultured along with primary brain PCs and primary brain ACs to form the BBB MVNs. Several protocols have been established to obtain ECs from induced pluripotent stem cells, and endothelial state maintenance was confirmed for several passages in vitro and after implantation in vivo16,17. The successful use of iPS-ECs in the BBB MVNs may allow, in the future, the development of patient-specific models. With this aim, we validated that iPS-ECs in the BBB MVNs not only maintain their EC phenotype over time but recapitulate several key features of HBMECs in the brain microvasculature in vivo, notably perivascular cellular interactions through juxtracrine signaling, vessel morphology, gene expression profiles and functional barrier properties.
Analysis of molecular permeability is a key application of BBB models, whereby the barrier strictly controls the access of both therapeutics and biomolecules to the brain in health and disease. Here, we show that the BBB MVNs can be used to study the vascular permeabilities of model molecules and therapeutics, which are found to be of magnitudes comparable to those measured in animal models (3.1 × 10⁻⁷ cm/s for 10 kDa dextran in rat brain capillaries18 compared with 1.7 × 10⁻⁷ cm/s in the BBB MVN model, and 1.4–1.9 × 10⁻⁷ cm/s for 40 kDa dextran in rat18,19 and mouse20 brain capillaries compared with 4.2 × 10⁻⁸ cm/s in the BBB MVN model). To measure permeability in MVNs for any molecule of choice, we developed methodologies based on either imaging of fluorescence signal13, or collection and analysis of interstitial fluid14, both of which are included in this protocol. The two different methodologies may find easier application in either academic research laboratories or in industry, depending on equipment available and preferred application, making the protocol suitable for widespread use. Finally, downstream processing of the BBB MVNs included in this protocol allows for high-resolution imaging of junction and transporter proteins and cell collection for gene/protein analysis for comparison with permeability results and validation of the BBB-like properties of this platform.
The assays described in this protocol should be easily implementable in both academic and industry laboratories, as they only require standard cell culture equipment and contain several procedures that can be readily outsourced to highly accessible companies at reasonable cost, such as 3D printing companies to generate microfluidic device molds or cytokine/gene analysis companies. In addition, the small dimensions of the microfluidic devices allow for the use of reduced volumes of reagents and low cell numbers, decreasing the costs associated with each experiment and allowing for large numbers of repeats per experiment.
Applications of the method
Although this protocol describes the formation of BBB MVNs for molecular permeability analyses, the methods described are robust and flexible and can find applications in numerous other investigations. For example, the use of iPS-ECs to form BBB MVNs is a critical advantage of the model, as it allows for the formation of patient-specific MVNs. Particularly, we demonstrate that iPS-ECs adopt several key features of native BBB ECs (HBMECs) when cocultured with PCs and ACs in microfluidic devices, attesting to the relevance of this protocol in designing patient-specific BBB MVNs with potential applications in the clinic. Personalized BBB MVNs can be used to assess changes in barrier function and cellular architecture under disease conditions, such as neurological disorders where the BBB may be compromised21,22. The BBB MVNs can also be used for the permeability analysis of entities other than molecules, such as novel therapeutic carriers like nanoparticles23,24,25 or infectious agents like severe acute respiratory syndrome coronavirus 2. Similarly, the permeability analysis detailed here can be applied to other MVNs13,14 and in vitro vascular models, attesting to the flexibility of this protocol. In addition, as we have previously shown, the MVNs can be used to assess tumor cell arrest and extravasation during metastasis15,26, which can be studied in a brain-specific microenvironment using the BBB MVNs27. Inclusion of a tumor model can also be achieved in the BBB MVNs for the study of local permeability changes and therapeutic engagement28. Finally, the perfusable nature of the BBB MVNs allows for the study of expected pathophysiological flow-induced changes on endothelial function29. For example, we have shown that application of physiological levels of vascular flow through a microfluidic pump results in lower MVN permeabilities and extended model stability30.
Alternative methods
While in vivo brain investigations in animal models have offered great insight into the physiology of this organ, challenges remain in the translation of animal findings to human patients. This is evident in the high failure rates (>80%) in clinical trials of drugs previously validated to cross the BBB in animals5,21. In addition, ethical concerns and increased costs of animal experiments have driven the design of in vitro human BBB models for use as preclinical assays.
Monolayer human BBB models
The majority of in vitro BBB systems described in the literature are 2D monolayer platforms, where ECs are plated on a porous membrane or on top of a thin hydrogel layer (often collagen) and, in some cases, with a combination of PCs, ACs or neurons8,31,32,33,34. The simplicity and ease of use of these systems have increased their popularity and allow for the design and implementation of experiments that require few cells and reagents and yield results in short timeframes7,35. Permeability can be easily measured by direct analysis of molecular concentrations in fluid. Thus, this type of assay has proved to be amenable for high-throughput drug testing in a simple platform or the study of cancer cell transmigration in 2D36. However, the capability of these systems to recapitulate the brain microenvironment to generate a clinically relevant model remains limited. Particularly, 2D EC monolayer models fail to mimic key cellular interactions present in the brain between ECs, PCs and ACs. In addition, the morphological features of brain capillaries pertaining to their geometry and structural organization are lacking in 2D models, resulting in shortcomings in their functional properties. This is notably observed in measurements of permeability, which are often one to three orders of magnitude higher in 2D BBB models compared with results in vivo, despite the presence of confluent endothelial monolayers13.
Tube-like human BBB models
To address the limitations of 2D monolayer models in their ability to mimic the BBB in both architecture and function, several groups have shifted their efforts to the design of tube-like 3D vessel structures. These models are either generated from hollow structures in 3D hydrogel produced with a needle pull-out method9,37,38 or within hollow channels in microfluidic systems10,11,39. ECs are then perfused to line the internal walls of the channels and assemble into monolayers that adopt a tube-like structure. In these systems, PCs, ACs or neurons can be perfused prior to the ECs to ensure that the cells are positioned on the abluminal side of the tube-like vessel9, or can even be directly embedded in the hydrogel8,10. As such, tube-like models offer an additional layer of complexity and accuracy when compared with 2D monolayer models. These models also allow for quantification of vascular permeability via confocal microscopy of fluorescence signal9,10, and the effects of microenvironmental changes on vessel stability and barrier function can also be assessed through measurements of impedance-based permeability39. Nevertheless, the tube-like structures produced lack physiological microvessel diameter sizes, as they are typically as large as 600–800 µm in diameter9,39, so that the local surface curvature at the scale of a cell is not far from that of a planar monolayer. In addition, although vascular permeabilities in these structures are shown to decrease with the presence of PCs or ACs9, their values are still relatively close to those obtained in 2D models and one to two orders of magnitude higher than typical permeabilities in vivo3,9,10. While monolayer and tube-like vessels are highly appropriate tools for high-throughput quantification of barrier permeability in a simple setup, the BBB MVN model presented here features physiologically relevant vessel morphology in 3D, appropriate BBB gene expression and low values of permeability. These characteristics make it clinically relevant and highly amenable for the study of receptor-mediated transport, cell transmigration in 3D and interactions of stromal cells with the endothelium12,27.
Alternative measurements of permeability
Vascular permeability has been measured either by assessment of electrical impedance of EC monolayers or by monitoring of molecular concentration in the abluminal interstitial space over time40. The first method, which measures transendothelial electrical resistance (TEER), requires the ECs to be plated in contact with electrodes, after which measurement can be performed with great ease over time. For this reason, the method has found some application in monolayer BBB models3,31,39. One key advantage to TEER lies in its ability to provide real-time monitoring of barrier permeability with a simple electrode setup41, a temporal resolution often difficult to achieve with other methods. TEER is also used as a proxy for EC junctional integrity, providing a general assessment of paracellular transport (i.e., in between junctions) across the endothelium, with no regard to molecular specificity or transcellular transport (i.e., transcytosis of larger molecules and passive membrane diffusion of small molecules). Measurements of permeability through molecular flux, on the other hand, are sensitive to those factors and can be performed in both 2D and 3D BBB models, unlike TEER, which is limited in 3D because of difficulties in electrode positioning42. However, physiologically low paracellular permeabilities are necessary to not overshadow transcellular transport and allow for its quantification. Using MVN models, we were able to show improved physiological vascular permeabilities compared with 2D and 3D tube-like vessel platforms, as well as the ability to finely assess transcellular transport and separate it from paracellular transport13,14.
Advantages and limitations of the protocol
The BBB MVN model described in this protocol and the associated methods to evaluate vascular permeability hold several advantageous characteristics:
-
ECs, PCs and ACs are used to generate 3D triculture microvessels with small diameters (~10–40 µm) and appropriate BBB gene expression profiles, thus offering greater physiological relevance when compared with conventional EC monolayer or tube models
-
Human cells (stem-cell-derived or brain primary cells) can be exclusively used in this model, increasing the relevance of this platform to predict molecular permeability in the human brain in health and disease compared with animal models
-
Analysis of permeability in the BBB MVN models is simple to perform and highly quantitative compared with analysis in animal models, where difficulties in imaging through thick tissues and animal drift greatly complicate the measurements
-
BBB MVN permeability can be measured with high spatiotemporal control to assess changes over time due to specific treatments or challenge with disease-associated factors like proinflammatory cytokines13,43
-
Transmural flow can be applied in the BBB MVNs to assess molecular permeability under physiological intravascular pressure conditions44
-
Physiologically low paracellular transport in MVNs allows for assessment of transcytosis. Specific transporter or efflux proteins can be inhibited to study their role in molecular transport across the endothelium13
-
Clearance of perfused molecules by ECs can be assessed through colocalization analysis in different cell compartments, such as the early endosome and lysosome13
-
The technical expertise to form the BBB MVNs is low compared with other techniques for in vitro brain vascular models that require 3D cell printing techniques, sacrificial gels or needle pull-out techniques
-
Cell isolation for quantification of gene and protein expression levels is simple compared with animal models, which require specialized knowledge of invasive techniques to isolate cells from the brain and additional expensive equipment
-
The BBB MVN model can be engineered using standard cell culture equipment and is inexpensive with low reagent volumes and cell counts needed per device (considered a biological repeat). Therefore, information on BBB MVN properties can be obtained from numerous repeats at greatly reduced costs (<0.40 USD per device for fabrication costs15 and <1.50 USD per device for device seeding and cell culture costs) compared with animal models, which are at least 50 times more expensive (>25.00 USD per animal for purchase and >80.00 USD per animal per month for housing45). In addition, users can also opt for commercially available devices (e.g., 3D cell culture chips by AIM Biotech) to generate the BBB MVNs following the protocol below
A key limitation to the BBB MVN model, as in any other in vitro model, is the only partial recapitulation of the BBB microenvironment in vivo. The model fails to fully capture the interactions of perfused molecules with other host cells in the brain circulation and parenchyma; for example, immune cells that play a role in the clearance of therapeutics and other molecules46. The flexibility of the BBB MVNs allows for modifications of the model to include additional cell types (e.g., immune cells in the circulation or neurons15,47). Another key limitation of the model is that perfusion of molecules in the BBB MVNs for long-term studies is not feasible due to a lack of physiological clearing mechanisms in the gel matrix (i.e., glymphatic flow in the BBB in vivo48) and diffusion of the perfusate across the side monolayer. As such, only short-term studies of permeability can be performed in the BBB MVNs. Nevertheless, short-term permeability analysis remains highly effective to rank transport of different therapeutics across the BBB MVN endothelium. Changes in permeability over long time periods (days) may still be assessed by washing out the perfusate with fresh medium and attempting permeability analysis with the same perfusate on another occasion.
Experimental design
Characterizing molecular transport across the BBB requires a brain microvascular model featuring morphological and functional properties comparable to those of brain capillaries in vivo, the capability for high spatiotemporal resolution imaging, and extraction of the cells contained in the 3D gel matrix for protein/gene analyses and comparison with ex vivo tissue and cells. To this end, we have developed an in vitro BBB microfluidic model with 3D MVNs composed of ECs (iPS-ECs or HBMECs), PCs and ACs that presents those features and capabilities. The protocol consists of four major modules: (i) microfluidic device fabrication and BBB MVN formation (Steps 1–20), (ii) measurement of vascular permeability (Steps 21–46), (iii) imaging of proteins and cell architecture (Steps 47–60), and (iv) cell collection for gene/protein analyses (Steps 60–67).
Device fabrication and BBB MVN formation (Steps 1–20)
Two different device types, both featuring a central gel channel and two adjacent medium channels, are employed in this protocol: (i) the microdevice and (ii) the macrodevice (Fig. 1, Supplementary Figs. 1 and 2, Supplementary Table 1 and Supplementary Data 1 and 2). Central channels in microdevices are delineated by upright microposts separated by 200 µm to allow for surface-tension-assisted filling of cell-laden fibrin gels. In the macrodevices, the additional height of the device makes it possible to use a partial wall from the top surface of the device chamber to separate the central and side channels, allowing for an uninterrupted gel–medium interface.

Figure partially made using Biorender.com.
The choice of device for use in the formation of BBB MVNs should be dictated by the user’s end application. All methodologies described in this protocol can be applied for both device types, although we point out the suggested device for each application throughout. Generally, permeability measurements are easier and less variable when performed in the macrodevice, due to the increased width of the central gel channel limiting diffusion of perfusates from the side channels over time. The macrodevice also contains more cells for gene/protein analysis, and the increased size of the gel makes it easier to collect for further histological sectioning. However, the increased size of the macrodevice also makes it difficult to perform effective immunofluorescence staining—the microdevice should be used, instead, for high-resolution imaging of immunofluorescence-labeled proteins and cell interactions. The microdevice also utilizes less than half of the cell numbers required for the macrodevice, resulting in up to three times more repeats for the same starting cell numbers. The number of devices seeded per experiment is at the discretion of the user, but we have concluded that 100 independent microdevices or 35 independent macrodevices can be seeded in one sitting without compromising cell viability.
We have validated that both human iPS-ECs and primary HBMECs can be employed to form the BBB MVN model, and have compared the protein and gene expression profiles of both ECs in the microfluidic chips after 7 d of culture. Human iPS-ECs or HBMECs, along with human primary brain PCs and ACs suspended in fibrin gels, are injected into the central channel of the device (Fig. 1). During device culture, iPS-ECs or HBMECs elongate, connect with neighboring cells, and form lumen structures that stabilize within 7 d. Simultaneously, PCs and ACs adopt a perivascular position along the newly formed blood vessels as observed in vivo, with PCs wrapping around the lumens and ACs extending their end-feet to touch the abluminal side of the vessels (Fig. 1). The adopted 3D cellular architecture and resulting vessel morphologies recapitulate the properties of BBB capillaries in vivo, and maintain stable dimensions starting at day 6 of culture (Extended Data Fig. 1). The addition of a monolayer of ECs at the medium–gel channel interface on day 4 helps prevent diffusion of solutes through the gel surrounding the MVNs when measuring permeability (Fig. 1).
Permeability analysis (Steps 21–46)
A key advantage of the BBB MVNs12 and other, tissue nonspecific MVNs developed in our group13,14 is the capability to recapitulate vascular permeabilities comparable to those measured in animal models. Formation of physiological tight junctions and the expression of a functional glycocalyx and basement membrane limit paracellular transport between ECs13, which is key to the low permeability values measured in our systems for macromolecules compared with simpler 2D EC monolayer models (5.6 × 10⁻⁷ cm/s for 10 kDa dextran in 2D HBMEC monolayer models49 compared with 1.7 × 10⁻⁷ cm/s in the BBB MVN model, and 2.0–9.0 × 10⁻⁷ cm/s for 40 kDa dextran in 2D HBMEC49,50 or iPS-EC monolayer models8 compared with 4.2 × 10⁻⁸ cm/s in the BBB MVN model). Expression of BBB-specific transporters and efflux proteins makes the BBB MVN model also amenable to the study of small-molecule transport by passive diffusion across the cell membrane and large-molecule transcytosis. Permeability in the BBB MVNs may be measured in one of two ways, described below with their relevant experimental parameters, or a combination of the two for additional validation of the results (Supplementary Method, Supplementary Table 2 and Supplementary Software 1 and 2).
Permeability analysis—confocal microscopy of fluorescence signal
Imaging through confocal microscopy can be used to measure permeability of molecules conjugated to fluorophores (Fig. 2), under the core assumption that fluorescence intensity varies linearly with molecular concentration13. Numerous molecules are commercially available as preconjugated to fluorophores, such as the ones used in this protocol, making knowledge of fluorescence labeling techniques unnecessary. The molecule of choice is dissolved in cell culture medium and perfused through the BBB MVNs, after which the sample is imaged in the same locations at different timepoints. Image analysis is used to yield the average fluorescence intensity in the vasculature and matrix over time, as well as relevant morphological parameters. The permeability, P, is calculated as51:
where Δt is the time between timepoints, ΔIm = Im,2 – Im,1 is the increase in average fluorescence intensity in the gel matrix with volume Vm, SAv is the surface area of the vasculature, and ΔI = Iv,1 – Im,1 is the difference in average intensity between the vasculature and matrix at the start of the measurement. A confocal microscope is strictly required for this methodology owing to the 3D morphology of the BBB MVNs and resulting 3D analysis. Equation 1 assumes that the matrix is homogeneous and permissible, as previously confirmed14. Bleaching of the fluorescent solutes used in this protocol has rarely been observed, likely due to the short imaging times involved in the methodology described, yet it may modify the permeability values measured. Assuming a constant solute concentration in the vascular space through the duration of the measurement, photobleaching may be observed as a decrease in the vascular fluorescence intensity, and Eq. 1 can be applied by replacing Im,2 with Im,2 * = Im,2 × (Iv,1/Iv,2), where Iv,2 is the vascular fluorescence intensity at the second timepoint. A further assumption is that no transport occurs across the boundaries of the imaged region. This is supported by the fact that the vessel density and fluorescent dye concentration are relatively homogeneously distributed. Variations in either variable could give rise to errors in the measurement.

Figure partially made using Biorender.com.
As with any fluorescence image analysis technique, image acquisition on the confocal microscope must be set up so as to not oversaturate the signal, which would result in loss of information. Even when collecting signal just below the saturation limit, sufficient time is required between timepoints to measure a substantial increase in fluorescence intensity compared with noise in the matrix (Extended Data Fig. 2), due to the low permeabilities typically measured in MVNs. Conversely, prolonged time between timepoints will negatively impact the measurement owing to diffusion of the perfusate from the side channels through the monolayer. An optimal time window, therefore, exists for the measurements depending on the solute molecular weight, reported in Table 1 for a range of molecules in the macrodevice. In the microdevice or commercially available AIM Biotech chips, due to the smaller gel channel, a substantial increase in matrix fluorescence intensity can be observed sooner due to diffusion from the side channels, and the lower bound of the time windows in Table 1 should be used to minimize corruption of the measurements and abnormally high permeabilities resulting from compound effect of permeability through the BBB MVNs and diffusion through the monolayer (Extended Data Fig. 2).
The size of the imaged sample volume can also affect the quality of the permeability measurements by confocal microscopy. Scattering of the fluorescence signal at increasing depths lowers the intensity measured, resulting in a reduced signal-to-noise ratio (Extended Data Fig. 3). Irrespective of the height of the device, therefore, the imaged volume used for the analysis should be thicker than 50 µm only for especially bright conjugated fluorophores. In the xy-plane, the area imaged should be as large as possible as to best capture the average morphology of the BBB MVNs. For this protocol, we used a 10× confocal objective (approximate field of view 1,250 × 1,250 µm), although higher-resolution objectives may be used, provided they allow for imaging of areas larger than 600 × 600 µm, for which consistent results are expected (Extended Data Fig. 3). Image resolutions as low as 640 × 640 pixels are adequate to effectively capture boundaries between BBB MVNs and gel matrix. These parameters and considerations are provided in Table 2 for user reference during experimental design.
Permeability analysis—interstitial fluid collection
The use of confocal microscopy may not be available or preferred in some laboratories, which may instead be more accustomed to analysis of perfusates in fluid through techniques such as ELISA and mass spectrometry. In addition, conjugation of molecules to fluorophores may alter their physicochemical properties and result in different permeabilities across the vascular endothelium52. Therefore, we have developed a methodology that can be applied in the MVNs to collect interstitial fluid for direct analysis of labeled and unlabeled molecules14. The BBB MVNs are pressurized to a physiological net pressure across the endothelium (Fig. 3). This pressurization in turn produces physiological transmural flow across the vascular endothelium of the BBB MVNs, whereby fluid flow continues across the gel matrix and exits the device through the gel ports, where it can be directly collected.

Devices are perfused with the solute of interest, connected to the pressure regulator for pressurization, and interstitial fluid is collected from the opposite port. Perfusates can be analyzed by ELISA, mass spectrometry or other techniques of choice by the user.
The perfusate concentration in the interstitial fluid collected, c, is a fraction of the concentration perfused in the BBB MVNs, c0. This methodology assumes that no solute will become bound to the matrix, so that the difference between c0 and c is entirely due to solute partition across the vascular wall. This assumption is supported by the large permissivity of the fibrin gel matrix, as previously described14. The ratio between c0 and c can be used to compare different molecules, as it is often done when testing molecular distribution in preclinical animal models53. In the BBB MVNs, the ratio can also be used to yield the BBB MVN permeability, P, through the relationship:
Here Δp is the pressure applied, Lp is the hydraulic conductivity of the BBB MVNs (Extended Data Fig. 4) and σ is the reflection coefficient of the perfusate. The values that can be assumed for this analysis are reported in Table 3.
Similar to the methodology using confocal microscopy, permeability analysis through pressurization of the BBB MVNs has an optimal window for data collection. At short times (1–3 min) after pressurization, the fluid collected is the one originally present in the matrix, where the perfusate concentration is virtually zero. At long times (typically >15 min), diffusion and convection of the perfusate through the side monolayer will corrupt the measurements and yield abnormally high concentrations. Collection of interstitial fluid every 1 min after pressurization for 10 min will ensure that consistent values of perfusate concentration can be measured (Fig. 3).
The suggested applied pressure of 1 kPa may also be changed by the user depending on the available pressure regulators. However, a higher pressure will result in a shortening of the optimal window for the measurements, and pressures >2.5 kPa have not been attempted by the authors and may result in damage to the BBB MVNs.
Pressurization of the BBB MVNs can be combined with fluorescence imaging by confocal microscopy to measure effective permeability values under physiological transmural flow conditions. We have shown that the effective permeability in these conditions is higher for small molecules that can squeeze through EC junctions and be transported by flow, while it does not change for large molecules like plasma proteins and monoclonal antibodies14.
Imaging of proteins and cellular architecture in whole or sectioned gel (Steps 47–60)
Visualization of proteins associated with transport regulation through the BBB MVNs can be performed to assess their presence and localization. Proteins can be visualized in the models in 3D by fixing and processing devices for immunofluorescence staining, in a similar manner to tissue staining. The small dimensions of the devices result in substantial reductions in reagent volumes needed to perform immunofluorescence staining and, therefore, costs of the method. Additionally, the presence of two adjacent medium channels flanking the gel region allows for the application of a hydrostatic pressure drop across the central gel channel, ensuring appropriate perfusion of antibodies and optimal immunostaining conditions. Another advantage of this method when using the microdevice lies in the capability for high spatial resolution imaging of the entire gel thickness with BBB MVNs (Fig. 1). The ability to visualize these proteins is extremely valuable to identify the 3D organization of the BBB MVN cells and specific cellular interactions that can result in improved BBB-like protein expression1,54.
The limitations of confocal microscopy imaging, in terms of scattering of the fluorescence signal at large depths in the devices and resolution thresholds, can be overcome in the BBB MVNs by extracting the gel from the devices for histological sectioning. This approach, similar to ex vivo tissue sectioning, allows for high-resolution (60×) confocal imaging of MVNs at any depth13, or for alternative modes of imaging to be applied, such as histology (e.g., hematoxylin and eosin staining13,14) and electron microscopy for nanometer-resolution imaging13. These methods can be used to differently evaluate 3D cell architecture in the BBB MVNs and image subcellular transport processes.
Cell collection for gene and protein analyses (Steps 60–67)
Gene and protein expression profiles of the BBB MVN cell components can be measured for comparison with primary cells or to assess changes due to various treatments. Here, extraction and isolation of iPS-ECs was of interest to quantify gene expressions via real-time quantitative reverse transcription polymerase chain reaction (qRT-PCR) of relevant junctional and transporter markers characteristic of BBB ECs2,5,55. Cells can be extracted from the 3D gel at any timepoint during device culture to evaluate gene/protein levels; however, we have previously shown that MVN maturity is achieved at day 7 of culture12,13. Pooling the gels of three macrodevices per biological repeat ensures that enough ECs can be isolated via fluorescence-activated cell sorting (FACS) to obtain suitable RNA levels necessary for appropriate gene quantification via PCR (Fig. 1). The capability for EC isolation following 3D culture with PCs and ACs can provide unique insight into the functional properties of brain microvessels.
Materials
Reagents
Device fabrication
-
Dow Corning Sylgard 184 Silicone Elastomer base and curing agents (Ellsworth Adhesives, cat. no. 184 SIL ELAST KIT 0.5KG)
Cell seeding
-
iCell Endothelial Cells (passage (P) 5 or lower, Fujifilm Cellular Dynamics, cat. no. 01434, any lot no. if available, or cat. no. 11713, lot no. C1021)
Caution
The cell lines used in your research should be regularly checked to ensure they are authentic and are not infected with mycoplasma.
Critical step
Due to variability in cell source and isolation/differentiation protocols from manufacturers, the recommended lot number of iCell Endothelial Cells for this protocol is lot no. C1021 from Fujifilm Cellular Dynamics.
-
HBMECs (P7 or lower, Angio-Proteomie, cat. no. cAP-0002, lot no. 2015120403 or 2015122002)
Caution
The cell lines used in your research should be regularly checked to ensure they are authentic and are not infected with mycoplasma.
Critical step
Certain lot numbers indicated in this protocol may be out of stock. If results are unsuccessful with one of the lot numbers available, the authors recommend switching to a different lot number from the manufacturers.
-
Human brain vascular PCs (P7 or lower, ScienCell, cat. no. 1200, variable lot no.)
Caution
The cell lines used in your research should be regularly checked to ensure they are authentic and are not infected with mycoplasma.
Critical step
Due to variability in primary human brain samples and isolation protocols from manufacturers, certain lot numbers of PCs or ACs provided by ScienCell may not yield optimal results for this protocol. If cell viability decreases over time following seeding in the devices, we recommend switching to different lot number of PCs and/or ACs.
-
Human ACs from cerebral cortex (P7 or lower, ScienCell, cat. no. 1800, variable lot no.)
Caution
The cell lines used in your research should be regularly checked to ensure they are authentic and are not infected with mycoplasma.
Critical step
Due to variability in primary human brain samples and isolation protocols from manufacturers, certain lot numbers of PCs or Acs provided by ScienCell may not yield optimal results for this protocol. If cell viability decreases over time following seeding in the devices, we recommend switching to different lot number of PCs and/or ACs.
-
Fibrinogen from bovine plasma (Millipore Sigma, cat. no. F8630)
Critical step
Repeating freeze–thaw cycles result in a greater percentage of crystallized water in the fibrinogen container and a lower fibrinogen concentration per weight unit.
-
Thrombin from bovine plasma (Millipore Sigma, cat. no. T4648)
-
Dulbecco’s PBS (Thermo Fisher Scientific, cat. no. 14190235)
-
Sterile dH2O
-
Human plasma fibronectin purified protein (Millipore Sigma, cat. no. FC010)
-
Poly-l-lysine solution (Millipore Sigma, cat. no. P4707)
-
Vasculife vascular endothelial growth factor (VEGF) endothelial medium complete kit (Lifeline Cell Technology, cat. no. LL-0003)
-
Fetal bovine serum (FBS; Thermo Fisher Scientific, cat. no. 26140-079)
-
Pericyte medium complete kit (ScienCell, cat. no. 1201)
-
Astrocyte medium complete kit (ScienCell, cat. no. 1801)
-
0.05% trypsin–EDTA (wt/vol) (Thermo Fisher Scientific, cat. no. 25300054)
-
TrypLE express enzyme (1×), phenol red (Thermo Fisher Scientific, cat. no. 12605028)
-
Recombinant human VEGF-165 (Peprotech, cat. no. 100-20)
Permeability assay
-
Fluorescein isothiocyanate (FITC)–dextran, mol. wt. 10,000 (Millipore Sigma, cat. no. FD10S)
-
FITC–dextran, mol. wt. 40,000 (Millipore Sigma, cat. no. FD40)
-
FITC–dextran, mol. wt. 150,000 (Millipore Sigma, cat. no. 46946)
-
Oregon Green–paclitaxel (Thermo Fisher, cat. no. P22310)
Caution
Paclitaxel is a hazardous reagent known to cause acute oral, dermal, respiratory and reproductive toxicity. When handling this chemical, use appropriate personal protective equipment, ensure adequate ventilation and avoid dust formation. Paclitaxel should not be released into the environment.
-
Elacridar (Cayman Chemical, cat. no. 18128)
Caution
Elacridar is a hazardous reagent, harmful if swallowed and dangerous to the environment. When handling this chemical, use appropriate personal protective equipment and dispose of contents/container in accordance with regulations.
-
Dimethyl sulfoxide (ATCC, cat. no. 4-X-5)
Caution
Dimethyl sulfoxide causes serious eye irritation and is a flammable liquid. When handling this chemical, use appropriate personal protective equipment and keep away from heat, sparks and open flames. Dispose of contents/container in accordance with regulations.
-
FITC–IgG from human serum (Millipore Sigma, cat. no. F9636)
-
FITC–Fab fragment (Jackson Laboratories, cat. no. 115-097-003)
-
Alexa Fluor 647–VEGF antibody (bevacizumab, Novus Biologicals, cat. no. NBP2-59638AF647)
Immunostaining and antibodies
-
8% paraformaldehyde (PFA) aqueous solution (Electron Microscopy Sciences, cat. no. 1578100)
Caution
PFA is a hazardous reagent known to cause acute oral, dermal and respiratory toxicity. It also causes serious eye damage and may cause genetic defects and cancer. When handling this chemical, use appropriate personal protective equipment including eye and face protection, ensure adequate ventilation and avoid dust formation. PFA should not be released into the environment.
-
0.1% Triton X-100 (Thermo Fisher Scientific, cat. no. 85112)
Caution
Triton X-100 is a hazardous reagent known to cause acute oral and dermal toxicity as well as serious eye damage. When handling this chemical, use appropriate personal protective equipment including eye and face protection, and ensure adequate ventilation. Triton X-100 should not be released into the environment.
-
BSA (Millipore Sigma, cat. no. A9647)
-
Goat serum (Thermo Fisher Scientific, cat. no. 16210064)
-
Anti-cluster of differentiation 31 (CD31) antibody (Abcam, cat. no. ab32457; RRID: AB_726369)
-
Anti-platelet-derived growth factor receptor beta (PDGFR-β) antibody (Abcam, cat. no. ab69506; RRID: AB_1269704)
-
Anti-glial fibrillary acidic protein (GFAP) antibody (Abcam, cat. no. ab10062; RRID: AB_296804)
-
Anti-claudin 5 antibody (Abcam, cat. no. ab15106; RRID: AB_301652)
-
Anti-zonula occludens 1 (ZO-1) polyclonal antibody (Thermo Fisher Scientific, cat. no. 61-7300; RRID: AB_2533938)
-
Anti–vascular endothelial cadherin (VE-cadherin) antibody (Enzo Life Sciences, cat. no. ENZ-ABS661-0100; RRID: AB_2891154)
-
Anti-aquaporin 4 antibody (Thermo Fisher Scientific, cat. no. PA553234; RRID: AB_2638104)
-
Anti-P-glycoprotein (Pgp) antibody (MRK16) (Enzo Life Sciences, cat. no. ENZ-ABS558-0100; RRID: AB_2891155)
-
Anti-laminin antibody (Abcam, cat. no. ab11575; RRID: AB_298179)
-
Anti-collagen IV antibody (Abcam, cat. no. ab6586; RRID: AB_305584)
-
Anti-heparan sulfate proteoglycan 2 antibody (Santa Cruz Biotechnology, cat. no. sc-377219; RRID: AB_2891156)
-
Anti-hyaluronic acid antibody (GeneTex, cat. no. GTX17370; RRID: AB_2891157)
Gel collection and cell isolation
-
Liberase research grade (Millipore Sigma, cat. no. 5401119001)
Caution
Liberase is a hazardous reagent known to cause acute oral, dermal and respiratory toxicity as well as serious eye damage. When handling this chemical, use appropriate personal protective equipment including eye and face protection, and ensure adequate ventilation. Liberase should not be released into the environment.
-
Dulbecco’s modified Eagle’s medium (Thermo Fisher Scientific, cat. no. 11995073)
-
EDTA (Invitrogen, cat. no. 15575-020)
Caution
EDTA is a hazardous reagent known to cause acute dermal and target organ toxicity as well as serious eye damage. When handling this chemical, use appropriate personal protective equipment including eye and face protection, and ensure adequate ventilation. EDTA should not be released into the environment.
-
Ethyl alcohol, anhydrous, 200 proof (Electron Microscopy Sciences, cat. no. 15058)
Caution
Ethyl alcohol is a highly flammable liquid and vapor and causes serious eye irritation. When handling this chemical, use appropriate personal protective equipment including eye and face protection, and ensure adequate ventilation. Ethyl alcohol should not be released into the environment.
-
FITC anti-human CD31 antibody (Biolegend, cat. no. 303104)
Equipment
Device fabrication and handling
-
Photomasks with microdevice design (available for download in Supplementary Data 2)
-
Mold for macrodevice (3D printing template available in Supplementary Data 1)
-
Vacuum desiccator (Cole Parmer, cat. no. WU-06514-30)
-
Autoclave
-
Expanded plasma cleaner (Harrick Plasma, cat. no. PDC-001)
-
Drying oven (60–80 °C)
-
Miltex biopsy punches with plunger (1, 2 and 4 mm, Ted Pella, Inc., cat. nos. 15110-10, 15110-20 and 15110-40)
-
Scalpel blades (VWR, cat. no. 25608-065)
-
Razor blades (Ted Pella, Inc., cat. no. 121-32)
-
No. 1 25 × 25 mm and No. 1 24 × 40 mm glass coverslips (VWR, cat. nos. 48366-089 and 48393-092)
-
Scotch tape
Cell seeding and collection
-
Sterile 0.2 µm filters, 25 mm (VWR, cat. no. 514-0061)
-
Hemocytometer or other cell counting tools
-
Disposable pipet tips (10, 200 and 1,000 µL, VWR, cat. nos. 53509-130, 37001-534, 83007-380)
-
Disposable gel-loading pipet tips (VWR, cat. no. 37001-152)
-
Falcon tubes 15 mL (cat. no. 62406-200)
-
Benchtop centrifuge for use with 15 mL tubes
-
Water bath set at 37 °C
-
Falcon 35 mm not tissue-culture-treated Petri dish (Corning, cat. no. 351008)
-
Disposable Petri dish 150 × 15 mm (VWR, cat. no. 25384-326)
-
Surgical scissors
-
Incubator set at 37 °C and 5% CO2
-
Falcon 5 mL tube with cell-strainer cap (Corning, cat. no. 352235)
-
BD FACSAria III Cell Sorter (BD Biosciences)
-
BD FACSDiva software (BD Biosciences)
Imaging and permeability analysis
-
Confocal microscope with environmental chamber (maintained at 37 °C and 5% CO2) and motorized stage (Olympus, cat. no. FV-1200) with 10× (air) and 60× (oil immersion) objectives
-
Open-access Fiji distribution of ImageJ software by NIH56 with 3D analysis plugin installed (available at https://imagejdocu.tudor.lu/plugin/stacks/3d_ij_suite/start)
-
(Optional) Imaris software by Bitplane
-
FlowEz pressure regulator (Fluigent)
-
Silicone tubing 1/16″ ID, 1/8″ OD (McMaster-Carr, cat. no. 3038K11)
-
Polypropylene tube connectors (Cole-Parmer, cat. no. EW-06365-90)
-
Tube clamps (Fisher Scientific, cat. no. 22-260447)
-
Orbital shaker
-
Benchtop centrifuge for use with 1 mL tubes
Reagent setup
Fibrinogen solution, 6 mg/mL
This step has been modified from a previous protocol from our laboratory15.
-
To reduce batch-to-batch variability in seeding experiments, we recommend preparing several aliquots of fibrinogen solution from a single batch of fibrinogen and storing them at −80 °C until use. This is done by dissolving 60 mg of bovine fibrinogen in 10 mL of sterile PBS in a 15 mL tube and incubating the mixture in a 37 °C water bath for 3 h until completely dissolved. Do not vortex
-
Filter-sterilize the solution (0.2 µm filter), and divide the dissolved fibrinogen mixture into aliquots in 1 mL Eppendorf tubes (at least 750 µL of fibrinogen is needed for 50 macrodevices or 100 microdevices/AIM chips)
-
Store the aliquots at −80 °C until use, and thaw at 4 °C for up to 10 d prior to seeding devices. We recommend keeping fibrinogen aliquots on ice while seeding devices and mixing the thawed fibrinogen solution at the beginning of the procedure.
Critical step
Prolonged storage of fibrinogen aliquots at 4 °C will result in a decreased concentration of active fibrinogen over time and, consequently, longer gelling times during cell seeding in the devices. In turn, this will result in increased cell sedimentation and larger vessels at the bottom of the devices. For optimal isotropic distribution of vessel sizes in 3D, we suggest thawing the aliquot 1–4 d prior to seeding.
Low-heparin medium (for thrombin stock solution resuspension)
-
Prepare Vasculife VEGF endothelial medium from Lifeline Cell Technologies with all supplements included but only one-fourth (125 µL) of the heparin provided in the kit.
Critical step
The low-heparin medium formulation must be used to resuspend the thrombin stock solution. The additional heparin in the complete medium will prevent fibrin gelation.
Thrombin resuspension medium
-
Prepare thrombin stock solution at 100 U/mL, and store at −80 °C. This step has been described in a previous protocol from our laboratory15
-
Upon use, thaw thrombin stock solution on ice, add 40 µL of it to 1 mL of cold (4 °C) low-heparin medium and mix well to produce a 4 U/mL thrombin solution. Make this solution immediately before device seeding, and keep it on ice. Do not reuse.
Critical step
Thrombin is highly sensitive to temperature. Ensure all steps involving it are carried out on ice, including preparation of the stock solution, thawing before seeding and mixing with cold low-heparin medium. Make the thrombin resuspension medium immediately prior to device seeding, and use within 2 h. Prolonged times, even on ice, will severely impair gel formation.
iPS-EC medium (for culture and neutralization of TrypLE)
-
Prepare Vasculife VEGF endothelial medium from Lifeline Cell Technologies with all supplements included, plus additional 10 mL of l-glutamine, and 50 mL of FBS57
iPS-EC medium + VEGF (with additional VEGF for first 4 d of device culture)
-
Prepare recombinant human VEGF-165 aliquots at 100 µg/mL in sterile PBS, and store at −80 °C until use
-
Before use, thaw each aliquot and mix it in 40 mL of iPS-EC medium to obtain a final iPS-EC medium aliquot supplemented with 50 ng/mL of VEGF-165. This medium is used in the devices for the first 4 d of culture to promote vasculogenesis
iPS-EC, PC and AC culture
-
Thaw at least 1 × 10⁶ iPS-ECs in fibronectin-coated flasks at 30 µg/mL in dH2O (placed in an incubator for 2 h without washing) to seed a total of 50 mini-macrodevices or 100 microdevices/AIM devices. Cell numbers can be scaled accordingly if more or fewer devices are to be seeded. iPS-EC medium for culture described above should be used for iPS-ECs
-
Use lower-passage iPS-ECs (P5 or lower) for best MVN formation results, as ECs become more senescent with increasing passage numbers
-
In separate poly-l-lysine-coated flasks at 0.15 µg/mL in dH2O (placed in an incubator for 2 h and washed three times with PBS), thaw at least 0.75 × 10⁶ PCs and 1.5 × 10⁶ ACs, in their respective ScienCell medium, to seed a total of 50 mini-macrodevices or 100 microdevices/AIM devices. Cell numbers can be scaled accordingly if more or fewer devices are to be seeded
Perfusate solutions for permeability assays
-
Dissolve FITC–dextran (any molecular weight), FITC–IgG and FITC–Fab fragment in PBS to a concentration of 10 mg/mL, and aliquot for storage at −20 °C. Upon use, dilute 1:100 (final concentration 0.1 mg/mL) in iPS-EC medium
-
Dissolve Oregon Green–paclitaxel in dimethyl sulfoxide to a concentration of 1 mM, and aliquot for storage at −80 °C. Upon use, dilute 5:1,000 (final concentration 5 µM) in iPS-EC medium
-
Dissolve elacridar in sterile dH2O to a concentration of 10 mM, and aliquot for storage at −80 °C. Upon use, dilute 1:1,000 (final concentration 10 µM) in iPS-EC medium
-
Store Alexa Fluor 647–bevacizumab at 4 °C until use. Dilute to a final concentration of 0.1 mg/mL in iPS-EC medium upon use
Liberase resuspension medium
-
Dissolve liberase in sterile dH2O to a final concentration of 5 mg/mL. Prepare aliquots and store them at −80 °C (for up to 1 year) until use
-
Add 50 µL of the liberase stock solution to 450 µL of Dulbecco’s modified Eagle’s medium, and mix well to make a 0.5 mg/mL liberase solution. Make this solution immediately before digesting the MVN gel, and keep it on ice. Do not reuse
FACS buffer
-
Prepare 2% (vol/vol) FBS and 2 mM EDTA in PBS. Store at 4 °C for up to 4 weeks
Procedure
PDMS device fabrication
Timing 12 h for fabrication and >24 h in oven for restoration of hydrophobicity
-
1
Fabricate the microdevice polydimethylsiloxane (PDMS) mold as described in our previous protocol (step 1 in Chen et al.15) using the photo-mask pattern provided in Supplementary Data 2. A 3D-printed macrodevice PDMS mold can be obtained from Proto Labs Inc. or similar supplier using the CAD file provided in Supplementary Data 1.
Critical step
The present protocol is optimal for BBB MVN formation in any three-channel microfluidic device with channel height between 100 and 500 µm and channel width between 1.3 and 3 mm. The authors recommend the use of the microdevice (or commercial alternative, e.g., AIM Biotech chip) for immunostaining and analysis of cell morphology and interactions over time, and of the macrodevice for permeability analysis and downstream processing of the gel and cells within.
-
2
Fabricate and sterilize PDMS devices using the procedure outlined in our previous protocol (steps 9–26 in Shin et al.58). We recommend punching 4 mm diameter holes for medium reservoirs and 1 mm diameter holes for the gel injection ports (Fig. 4). Place bonded devices in an oven set at 60–80 °C for >24 h before seeding to ensure hydrophobicity is restored.
Fig. 4: Summary of protocol steps for the fabrication of the microdevice with an SU-8 wafer and the macrodevice with a 3D printed mold (Steps 1–2 in the protocol). Critical step
Make sure to keep devices in sterile conditions until opening the Petri dish container under a sterile tissue culture hood upon seeding.

Seeding of iPS-ECs, PCs and ACs in devices for BBB MVN formation
Timing 3 h for seeding and 7 d for culture
Critical
The following Steps 3–14 have been modified from our previous protocol (steps 3–12 in Chen et al. 15) to form BBB MVNs. These MVNs can also be formed with HBMECs, PCs and ACs by replacing the iPS-ECs in Step 6 with HBMECs at 36 × 106 cells/mL. The remaining steps are identical for BBB MVNs formed with HBMECs instead of iPS-ECs.
-
3
Keep sterile devices at room temperature (RT, ~20–25 °C) in a sterile tissue culture hood.
Critical step
Make sure to keep all solutions (fibrinogen, thrombin and cell suspensions) on ice in a sterile tissue culture hood throughout the entire seeding experiment.
-
4
Maintain fibrinogen solution and thrombin resuspension medium on ice. Before resuspending the cells, mix 10 µL of the fibrinogen solution with 10 µL of the thrombin solution by pipetting up and down four or five times in a 0.5 mL Eppendorf tube. Close the tube, and leave at RT for 5 min. After 5 min, try to pipet the mixture. It should have gelled and become solid and difficult to fully pipet. This step ensures that the thrombin and fibrinogen solutions were prepared correctly and can form a gel when mixed at RT.
-
5
Use undiluted TrypLE express (2 mL per T75 flask) for 3 min to lift iPS-ECs and trypsinize PCs and ACs with diluted 0.05% trypsin–EDTA in PBS (ratio of 1:2). Neutralize each cell type with its respective medium (equal volume to TrypLE), and centrifuge at RT for 5 min at 200g.
Critical step
Make sure to use iPS-EC medium to neutralize lifted cells. This medium is constituted of Vasculife VEGF endothelial medium with 10% l-glutamine and 50% FBS55. This is not the same as the low-heparin medium used to resuspend the thrombin stock solution.
-
6
Aspirate the medium from the cell pellets, and separately resuspend the iPS-ECs at 30 × 106 cells/mL, the PCs at 3 × 10⁶ cells/mL and the ACs at 6 × 10⁶ cells/mL in the thrombin resuspension medium.
Critical step
Make sure to aspirate as much of the supernatant as possible in the centrifuged cells as the error in resuspended cell density can be easily increased and propagated when working with small volumes. The authors recommend aspirating the majority of the medium with a sterile pipet connected to a vacuum line and aspirating the remaining small volume of medium manually and slowly with a 200 µL pipettor.
-
7
Prepare the total working volume of cell solution in thrombin by mixing equal volumes of iPS-EC, PC and AC suspensions. This minimizes small volume errors and ensures devices are seeded consistently.
Critical step
Do not mix the entire volume of iPS-ECs with PCs and ACs. Ensure that there are enough leftover iPS-ECs resuspended in the thrombin solution in a separate Eppendorf tube (at least 10 µL). These cells will be replated at the end of the seeding procedure and cultured until day 4 in a separate flask to use in the formation of an endothelial monolayer at the medium–gel interface in the devices (Step 15).
-
8
For microdevices and AIM devices, mix 5 µL of the cell suspension from Step 7 with 5 µL of the fibrinogen solution by quickly pipetting up and down ten times inside a 0.5 mL Eppendorf tube, while avoiding forming air bubbles. Withdraw 10 µL, and immediately inject the cell–gel mixture into the center channel of the device by slowly pipetting it via one injection port until the solution reaches the start of the narrower downstream channel. Retract the pipet tip slowly without releasing the injector to prevent the formation of bubbles in the gel. For macrodevices, mix 15 µL of the cell solution from Step 7 with 15 µL of the fibrinogen aliquot and withdraw 30 µL to inject into the center channel of the device.
Critical step
The cell–gel mixture should be injected slowly to prevent leakage into the medium channel.
Critical step
Mix the fibrinogen and cell solution quickly in the Eppendorf tube before slowly injecting into the central channel. If the mixing is not performed quickly, the solution can begin to polymerize, resulting in gel fiber alignment and the formation of nonperfusable MVNs aligned parallel to the long axis of the gel channel.
-
9
Place the finished device in a 150 mm sterile Petri dish covered with a lid. Repeat Step 8 to entirely fill the large Petri dish with seeded devices.
-
10
(Optional) View the device within a sterile Petri dish under a phase-contrast or bright-field microscope to ensure that cells are homogeneously seeded.
-
11
Place a 35 mm Petri dish in the center of the large dish, fill it with 5 mL of sterile PBS, and leave it uncovered. Close the large Petri dish containing the seeded devices and the uncovered small dish of PBS, and carefully transfer it to an incubator maintained at 37 °C and 5% CO2. Allow for gelation for >20 min. While waiting, repeat Steps 8–11 with the rest of the devices.
Critical step
Ensure that the working cell solution from Step 7 is well mixed before withdrawing 5 or 10 µL each time, as cells will sink to the bottom of the tube quickly, resulting in inhomogeneous seeding densities.
-
12
When all devices are seeded, ensure that there are leftover iPS-EC cells in the thrombin resuspension solution. Then, plate these cells in a T75 flask and culture in regular iPS-EC medium in an incubator at 37 °C and 5% CO2. Change medium the next day with regular iPS-EC medium to remove any debris or remaining thrombin following replating. These iPS-ECs will be used to form a monolayer of ECs at the medium–gel channel interface on day 4 following device seeding (Step 15). This monolayer limits direct diffusion from the cell culture medium into the hydrogel matrix during permeability analyses.
Critical step
Make sure to change medium for the replated iPS-ECs to ensure they proliferate and remain healthy until the addition of the monolayer on day 4 following device seeding.
-
13
After gel polymerization, keep the devices in the large Petri dish with a small dish of PBS and fill the side medium channels with iPS-EC +VEGF medium. Because the medium channels are still hydrophobic, a tight seal is needed around the medium port with the pipet tip. To achieve this, use surgical scissors to cut the pipet tip at a location that allows the formation of a tight seal. Inject medium until all reservoirs are filled. Repeat with the remaining devices, and place them back in the large, covered Petri dishes in the incubator at 37 °C and 5% CO2.
Critical step
Make sure to use the iPS-EC + VEGF medium supplemented with 50 ng/mL of VEGF for the first 4 d of culture in the devices. The additional VEGF promotes initial iPS-EC proliferation and vascularization in the devices since iPS-ECs, PCs and ACs are competing for nutrients.
Critical step
Top off the medium reservoirs with additional medium to ensure they are completely covered, and the devices do not dry out in the incubator. Leaving the small open Petri dish with PBS inside the large, covered dish is also helpful in maintaining local humidity for the devices in the incubator
-
14
Change the medium in the devices every 24 h by aspirating each medium reservoir with a fine-tipped gel-loading tip. For the first 4 d of culture, use the iPS-EC +VEGF medium. For the remaining 3 d of culture, use the regular iPS-EC medium. When changing medium, fill both top reservoirs with medium (~100 µL per channel for both the micro- and macrodevices) and allow it to flow down the channel, causing the medium levels to rise in the bottom reservoirs. Top off the reservoirs with more medium to ensure the openings are completely covered.
Monolayer formation at medium–gel channel interface
Timing 1 h
-
15
On day 4 following seeding of the devices, add a monolayer of ECs at the medium–gel channel interface to limit direct diffusion from the cell culture medium into the hydrogel matrix during permeability analyses. This monolayer will integrate with the pre-existing microvessels in the central channel and is particularly important when characterizing the barrier properties of the MVNs.
-
16
Lift the iPS-ECs replated in a flask following the seeding procedure with undiluted TrypLE express (2 mL per T75 flask) for 3 min. Neutralize with iPS-EC medium and centrifuge at RT for 5 min at 200g. Aspirate the medium from the cell pellets, and resuspend the iPS-ECs at 1 × 10⁶ cells/mL in iPS-EC medium.
-
17
Aspirate the medium of all devices with a fine-tipped gel-loading tip, and add 40 µL of iPS-EC cell suspension in one of the two medium reservoirs. Ensure the solution has filled the entire reservoir lengthwise. Then, tilt the device on the edge of the Petri dish to allow gravity to bring iPS-ECs to the medium–gel interface (Fig. 5). Set a timer for 5 min for the cells to attach to this interface.
Fig. 5: Summary of protocol steps for the addition of EC monolayers in the side medium reservoirs on day 4 of culture (Steps 15–19 in the protocol). 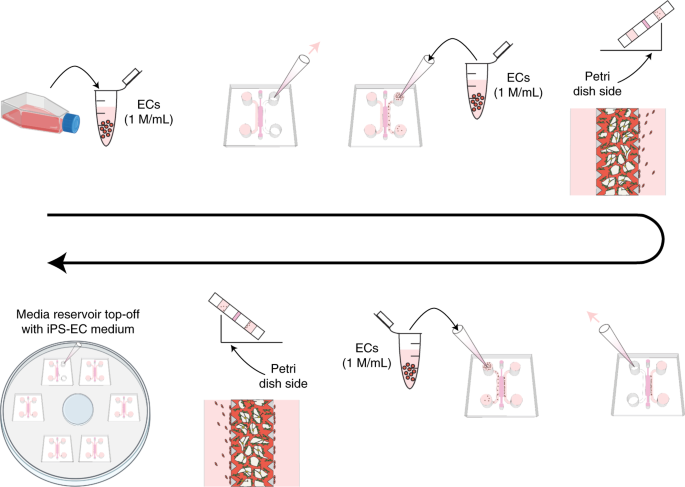
Figure partially made using Biorender.com.
-
18
Repeat Step 17 with the opposite medium reservoir. Do not aspirate the cells already filled in the first reservoir.
-
19
When both medium channels are filled with cells, place the devices in the large Petri dish and top off all reservoirs with additional iPS-EC medium before placing the devices back in the incubator.
Critical step
Day 4, when the endothelial monolayer is seeded, corresponds to the first day in which the iPS-EC + VEGF medium is replaced with regular iPS-EC medium.
-
20
Continue changing medium with regular iPS-EC medium every 24 h in the devices by aspirating each medium reservoir with a fine-tipped gel-loading tip. MVNs will integrate with the endothelial monolayer and will be ready for experiments and perfusion of solutes on day 7.
Critical step
The BBB MVN model is typically assayed on day 7 of culture when microvessel stability is maintained (Extended Data Fig. 1). Viability of the system is maintained for up to 12 d of culture for iPS-ECs and 28 d of culture for HBMECs prior to MVN regression, resulting in loss of vessel connectivity and perfusability. Strategies to improve viability beyond 12 and 28 d for iPS-ECs and HBMECs include the use of alternative EC lot numbers and continuous vascular flow through a microfluidic pump during device culture, as previously shown by our group30.

Analysis of BBB MVN permeability by confocal microscopy
Timing 30 min per device, including analysis
Critical
The permeability analysis protocol detailed in Steps 21–37 is applicable to both micro- and macrodevices. However, we suggest the use of larger (macro) devices owing to an increased width of the central gel channel, which limits diffusion of perfusates from the side channels over time.
-
21
On day 7, when BBB MVNs are fully formed and ready for experiments, the permeability of any fluorophore-conjugated molecule can be measured in the BBB MVNs by confocal microscopy. Aspirate all medium in one medium channel of a device with a fine-tipped gel-loading tip, and replace it by adding 100 µL of perfusate solution in a medium reservoir of the same channel.
-
22
Repeat Step 21 for the opposite medium channel of the device. This step will ensure effective perfusion of the BBB MVNs with the solution (Fig. 6).
Fig. 6: Schematic visualization of molecular perfusion through the BBB MVNs (Steps 21–22 in the protocol). 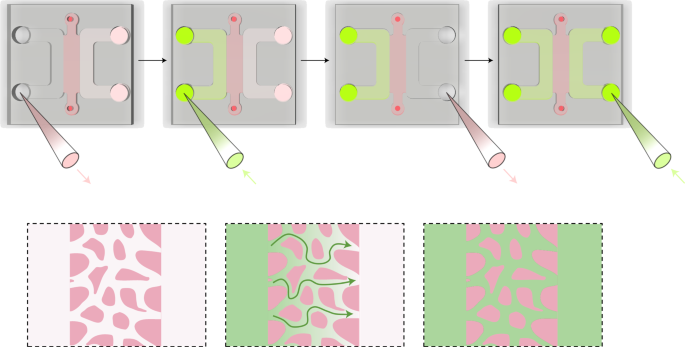
The permeability of the perfusate (green) through the BBB MVNs can be measured following these steps.
-
23
(Optional) If the user is interested in assessing barrier permeability in response to inhibitors to transporter receptors, treat the BBB MVNs with protein inhibitors (e.g., the P-gp inhibitor elacridar) through perfusion of the inhibitor solution by following Steps 21 and 22.
-
24
(Optional) For analysis of cytokine secretion by BBB cells, collect medium from the device reservoirs at any timepoint following device seeding and store at 4 °C for analysis within 2 d, or store at −80 °C for longer-term analysis.
Critical step
The permeability of the side-monolayer is one to two orders of magnitude higher than that of the BBB MVNs. As a result, diffusion from the side channels will gradually dominate the permeability measurements. To ensure quantitative resolution of the BBB MVN permeability, have the confocal microscope ready to image with the environmental enclosure at 37 °C and 5% CO2 before device perfusion. Start imaging the sample immediately after perfusion.
-
25
Place sample in the environmental enclosure of the confocal microscope, and begin image acquisition with the 10× objective and the appropriate laser line for the perfusate fluorophore used (e.g., 488 laser for FITC-conjugated molecules).
-
26
Acquire z-stacks of at least three random and nonoverlapping locations in the device, using a z-spacing between confocal slices of 5 µm, and an overall z-stack height of 150 µm (30 slices).
Critical step
To account for microscope thermal z-drift and maintain the sample within the imaging range, ensure that the bottom of the z-stack selected is at least 25 µm (five slices) below the lowest slice where fluorescence signal is observed; this is the bottom of the gel, at the interface with the glass slide. Similarly, make sure 30 slices are imaged overall, even though the signal is mostly lost at depths >50 µm in the gel because of scattering.
-
27
Repeat image acquisition of the same locations a second time. Refer to Table 1 for optimal timepoint selection.
-
28
(Optional) If you are interested in assessing potential changes in permeability over time, acquire images of the same location at additional timepoints.
-
29
Once finished with the permeability assay, discard the device or place back in the incubator in a separate Petri dish to minimize risk of contamination. If continued culture of the device is necessary, replace the remaining medium in the side channels with fresh medium.
Pause point
Image analysis to quantify BBB MVN permeability from the z-stacks collected can be performed at any later point.
-
30
A macro for ImageJ, FIJI distribution and associated files is available in Supplementary Software 1 and 2 for semi-automated analysis of permeability from the z-stack collected. Steps 31–37, below, require human input for the macro. The full list of steps performed by the macro is also available in the Supplementary Method as a ‘READ ME’ file, should the reader wish to alter it for specific analyses or perform the analysis manually. Consult the ‘READ ME’ file for instructions regarding the use of the macro and associated files.
-
31
Open FIJI and select Plugins → Macros → Run…, then locate and select the ‘macro_permeability_win.ijm’ file.
-
32
Select and open the confocal z-stack files collected at the two timepoints. A new command window will open, requiring user input in aligning the stacks. Do not press ‘OK’ until Steps 33–35 are completed.
-
33
Trim the stacks to adjust for potential microscope drift. To do so, locate on each of the two z-stacks the same slice of the sample, e.g., the bottom slice where the signal is brightest near the glass. If the slice number is different in the two stacks, select the stack for which the slice number is higher and use Image → Stack → Tools → Slice Remover to remove a number of slices from the top of the stack equal to the difference between the two slice numbers. (For example, if the same slice is at 21/30 in the first stack and 18/30 in the second stack, select the first stack and remove slices 1–3. Now, the slice will appear at 18/30 for both stacks.)
Critical step
When using the Slice Remover tool in FIJI, the ‘interval’ between slices to be removed is initially automatically set to 2 (i.e., every other slice in the range selected is removed). Ensure this is changed to 1 to remove all slices in the range selected.
-
34
Select the volume of interest within the stack to be analyzed by removing additional slices from the two stacks, for which the signal may be faint, i.e., at depths >50 µm within the gel or absent (below the glass cover slip). The final stack should start from the slice of the gel closer to the glass (the brightest slice) and be five to ten slices thick overall. Make sure the same trimming procedure is followed for both stacks, so that you are analyzing virtually the same volume over the two timepoints.
-
35
(Optional) If interested in assessing the permeability of a specific subarea of the location imaged, crop the stack in the xy-plane by selecting an area of interest with the Rectangle tool and using Image → Crop. Ensure the same area is selected on both stacks by selecting the second stack and pressing Ctrl + Shift + E before cropping.
-
36
Press ‘OK’ on the command window. The macro will now run automatically, analyzing the geometry and fluorescence signal of the vessels and matrix. Once finished, the macro will output two CSV files that contain the morphological parameters (volume of BBB MVNs, volume of the surrounding matrix, surface area of the BBB MVNs) and fluorescence intensities (average of signals from the BBB MVNs and surrounding matrix at the two timepoints) required for permeability analysis.
-
37
Input the morphological and intensity parameters into the ‘Permeability template’ Excel file provided in Supplementary Table 2 to calculate the permeability.

Analysis of BBB MVN permeability by collection of interstitial fluid
Timing 30 min per device, including analysis
Critical
The permeability analysis protocol detailed in Steps 38–50 is applicable to micro- and macrodevices. However, the authors suggest the use of larger (macro) devices because of increased diffusion and convection times of perfusates from the side channels in wider gels, hence increased ease of measurement. The FlowEz pressure regulator used in Steps 42–46 can be replaced with any other air pressure regulator capable of outputting a pressure of 1 kPa.
-
38
Shorten the larger side of four tube connectors (part no. 6365-40) with a razor blade to ensure fitting into the 4 mm ports of the device (Fig. 7; stages 1–2).
Fig. 7: Fabrication of flow stoppers and pressure line to prepare the BBB MVN device for pressurization (Steps 38–43 in the protocol). 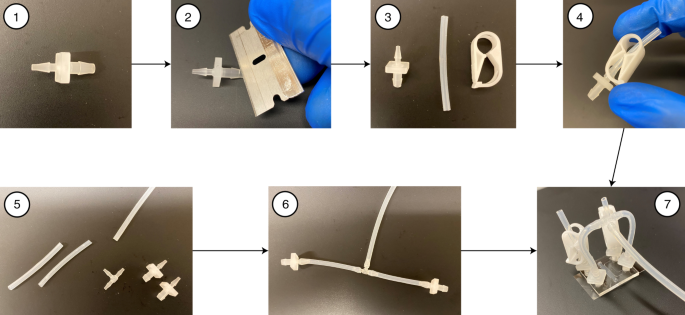
Stages 1–2: fitting into the device ports is ensured by shortening the tube connectors; stages 3–4: fitting into the pressure regulator is ensured by splitting the silicone tube connectors; stages 5–7: tube clamps are employed to ensure appropriate connections between device and pressure regulator and to make flow stoppers.
-
39
Use connector part no. 6365-70 to split the silicone tube attached to the pressure regulator into two short tube lengths of ~4 cm. Connect two of the connectors from Step 38 to these tubes (Fig. 7; stages 3–4).
-
40
Connect the remaining two connectors from Step 38 to two short tube lengths of ~4 cm (Fig. 7; stages 5–6). Clamp these tubes with tube clamps to make flow stoppers (Fig. 7; stage 7).
-
41
Follow Steps 21–22 to perfuse the BBB MVNs with iPS-EC medium containing the molecule of choice.
Critical step
Diffusion and convection from the side channels will dominate the measurement over time. Ensure that the FlowEz pressure regulator and all tubing are connected and ready for use. Commence pressurization immediately after perfusion.
-
42
Connect the two top medium reservoirs of a device to the FlowEz pressure regulator using the split tube from Step 39.
-
43
Close the two bottom medium reservoirs of the device using the flow stoppers from Step 40. The device is now ready for pressurization.
-
44
Increase FlowEz pressure to 1 kPa. Start timer. Interstitial fluid will gradually accumulate out of one or both of the gel filling ports, ~1–2 µL/min.
-
45
Collect the interstitial fluid each min for 10 min, and store in separate 0.5 mL Eppendorf tubes on ice.
-
46
Lower FlowEz pressure to 0 Pa, and disconnect tubing and flow stoppers from device.
-
47
Collect 10 µL from either medium channel of the device in a separate 0.5 mL Eppendorf tube. This sample will be used to measure the final perfused concentration to account for dilution with medium in the device.
-
48
(Optional) Take multiple samplings of the medium channel fluid for additional accuracy in the average concentration measured.
-
49
Discard or place the device back in the incubator in a separate Petri dish to minimize risk of contamination. If continued culture of the device is necessary, replace the remaining medium in the side channels with fresh medium.
-
50
Dilute the interstitial and perfused fluids collected 1:100 in PBS. Lower dilutions are possible depending on downstream analysis method.
Pause point
The interstitial fluid collected can now be stored at 4 °C for use within 2–4 d. Longer waiting times will require storage at −80 °C.
-
51
Analyze samples through an appropriate method for the molecule assessed. For example, a fluorescence plate reader can be used for fluorophore-labeled molecules.

Visualization of endothelial junction proteins and basement membrane via immunofluorescence staining
Timing 5 d, includes overnight incubations
Critical
The following Steps 52–59 have been modified from our previous protocol (steps 21–28 in Chen et al.15) to ensure optimal staining results in the BBB MVNs. The immunostaining protocol is applicable to both micro- and macrodevices. However, we suggest the use of smaller devices (micro) because of increased difficulty in obtaining good-quality immunostaining through wider gel compartments.
-
52
When the BBB MVNs are fully formed and perfusable, or after they have been used for permeability analysis, devices can be fixed for immunofluorescence imaging. Aspirate all medium entirely in the two medium channels, and wash once with PBS by adding ~50 µL in one medium channel and ~150 µL in the other, then incubate for 5 min. The difference in volume between the two medium channels produces flow through the BBB MVN, facilitating effective staining and washing of unbound reagents.
-
53
Empty the two medium channels, and perfuse the BBB MVN with 4% PFA as per Steps 21–22. Incubate the devices at RT for 1 h, overnight for macrodevices. Then, remove the PFA from all medium channels and wash three times by perfusing the BBB MVNs with PBS, incubating for 5 min per wash.
Pause point
Fixed devices following washing with PBS can be stored for 2–3 weeks at 4 °C in a sealed Petri dish with parafilm to prevent evaporation and drying of the MVN gel channel. Stored devices can later be used for imaging and/or immunofluorescence staining.
-
54
If staining for intracellular proteins, permeabilize the cells in the devices with 0.1% (vol/vol) Triton X-100, added under perfusion, and incubate for 5 min for microdevices or 45 min for macrodevices. Wash the devices twice by perfusion with PBS, incubating for 5 min per wash and making sure to empty the medium channels entirely each time. If staining for basement membrane proteins, this step can be skipped.
-
55
Block the devices with 4% (wt/vol) BSA and 0.5% (vol/vol) goat serum in PBS (~200 µL per device under perfusion) overnight at 4 °C on an orbital shaker. The following day, wash three times with PBS under perfusion at RT, incubating for 5 min each time. Leave the third wash of PBS in the devices, and place them on an orbital shaker at 4 °C overnight.
-
56
Aspirate the PBS, and dilute primary antibodies of choice to the recommended dilution in PBS (~200 µL per device under perfusion). Incubate the devices with primary antibodies overnight at 4 °C on an orbital shaker. The following day, wash three times with PBS under perfusion at RT, incubating for 5 min each time. Leave the third wash of PBS in the devices, and place them on an orbital shaker at 4 °C overnight.
-
57
Aspirate the PBS, and dilute secondary antibodies of choice to the recommended dilution (typically, 1:200) in PBS (~100 µL per device under perfusion). Incubate the devices with secondary antibodies overnight at 4 °C on an orbital shaker. The following day, wash three times with PBS under perfusion at RT, incubating for 5 min each time. Leave the third wash of PBS in the devices, and place them on an orbital shaker at 4 °C overnight.
-
58
(Optional) When adding secondary antibodies, consider adding DAPI counterstain at 1:1,000 in PBS to the devices to visualize cell nuclei.
Pause point
Stained devices can be stored for 2–3 weeks at 4 °C in a sealed Petri dish with parafilm.
-
59
Image the devices on a confocal microscope or episcope. For visualization of junction proteins such as ZO-1, claudin 5 or VE-cadherin, acquire images with a 60× objective for best results (Fig. 1).
Gel preparation for sectioning and alternative imaging modes
Timing 2 d, includes overnight incubations
Critical
Steps 60–64 describe preparation of the gel in the devices for subsequent histological sectioning and confocal or electron microscopy. These steps yield best results in macrodevices, which contain larger gels that are easier to handle.
-
60
Fix the devices following Steps 52–53, including the optional Pause Point below.
Pause point
If a different fixative is required for a particular downstream application, you may substitute 4% PFA for the optimal fixative.
-
61
After washing the fixative from the devices with PBS, submerge the whole devices in 70% (vol/vol) ethanol in a Petri dish. Leave on the bench for 2 h at RT. The ethanol will partially dehydrate the gel, making it more robust and substantially easier to handle.
-
62
Remove a device from the ethanol, and empty the medium channels entirely with a fine-tipped gel-loading tip. Using a scalpel, cut a rectangle in the PDMS surrounding the central gel channel. Starting from one of the edges, carefully lift the cut PDMS with the scalpel. The central gel will now be exposed, either on the bottom glass of the device after pulling the PDMS away, or on the bottom of the cut PDMS rectangle, where it can be directly accessed (Fig. 8).
Fig. 8: Access and collection of the BBB MVN gel within PDMS microfluidic devices (Steps 62–64 in the protocol). 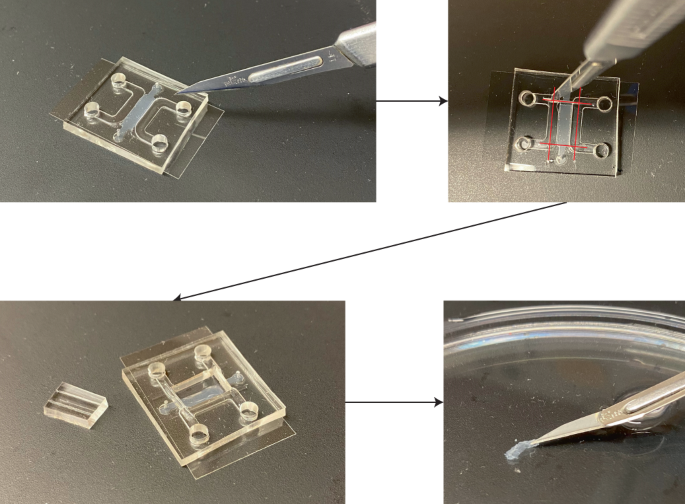
Devices are placed on a flat sterile surface, and a scalpel is used to cut the PDMS around the BBB MVN gel region. The top PDMS layer is then carefully removed, exposing the BBB MVN gel, which can be collected for further analysis.
Critical step
Make sure to not break the glass underneath the PDMS when making cuts with the scalpel so as to not damage the central gel.
-
63
Resubmerge the part of the device the gel is adhered to in 70% ethanol. Using the scalpel, gently separate the gel from the device. The gel should float in ethanol and maintain its shape.
-
64
At this point, the gel can be collected using tweezers to grab one of its extremities. The gel can then be deposited within the appropriate medium for further processing, for example, epoxy resin for electron microscopy13 or optimal cutting temperature compound for cryotome sectioning.

Isolation of cells from BBB MVNs for gene or protein analysis
Timing 9 h
Critical
The following Steps 65–72 yield best results in macrodevices, which contain larger gel volumes, hence providing greater ease of handling, and contain higher cell number per device.
-
65
At any stage during BBB MVN formation and maintenance, ECs (iPS-ECs or HBMECs) can be isolated from the MVNs in the gel channel to quantify their gene expression levels (Figs. 1 and 8). Prepare the liberase resuspension medium, and keep it on ice in a sterile tissue culture hood for the duration of the cell collection. Aliquot the liberase resuspension medium in 50 µL aliquots in 0.5 mL Eppendorf tubes, and keep them on ice.
Critical step
Each 50 µL liberase aliquot is used for the MVN gels of three pooled devices. To ensure there are enough ECs to accurately quantify gene expression levels, at least three macrodevices (or a comparable gel volume in smaller devices) should be pooled per biological repeat.
-
66
Working in sets of three devices at a time, empty the medium channels of each device entirely with a fine-tipped gel-loading tip. Using a scalpel, cut a rectangle in the PDMS surrounding the central gel channel. Starting from one of the edges, carefully lift the cut PDMS with the scalpel. The central gel will now be exposed, either on the bottom glass of the device after pulling the PDMS away, or on the bottom of the cut PDMS rectangle, where it can be directly accessed (Fig. 8).
-
67
Using a disposable 2 mm biopsy punch, carefully create suction on the exposed gel with BBB MVNs to pull it from the PDMS or glass coverslip. The gel should come out in one piece, collapsed to a pellet. Deposit the gel in one of the liberase 50 µL aliquots by pressing on the biopsy punch injector. Slowly retract the biopsy punch from the liberase solution without releasing the injector to ensure the entire gel is within the liberase solution. Repeat Steps 29–30 with the two remaining devices per biological repeat, depositing their gels in the same liberase aliquot.
Critical step
Make sure to work slowly and carefully when extracting the device gels as these are very fragile. If the gels are severely damaged by the scalpel blade or by suction from the biopsy punch, the percentage of resulting viable ECs might be too low to yield enough RNA and obtain accurate gene expression levels via qRT-PCR.
-
68
Close the lid of the liberase + gel solution, and firmly tap the 0.5 mL Eppendorf on a hard surface to remove all air bubbles. Start a 30 min timer.
-
69
At the end of each 10 min interval, use a 200 µL pipet to gently mix the liberase + gel solution, ensuring no additional bubbles form. By the end of the 30 min, the gel should be mostly broken down liberating the individual cells in the solution.
-
70
Immediately transfer the liberase + gel solution to a 0.5 mL Eppendorf tube containing 350 µL of FACS buffer kept on ice. Mix well to create a homogeneous solution, and keep on ice.
-
71
Repeat Steps 29–33 for each set of three devices, making sure to use a new scalpel blade and a new 2 mm biopsy punch for each biological repeat (set of three devices). Use a new 50 µL liberase aliquot each time, and transfer this liberase + gel solution to a new 350 µL FACS buffer solution after 30 min.
Critical step
After starting the 30 min timer for the first biological repeat (three devices), it is possible to work in parallel and immediately start extracting the gels of the next set of three devices, while ensuring the initial liberase + gel solutions are mixed every 10 min.
-
72
Filter the cell suspension through cell strainer in 5 mL Falcon tubes to remove any remaining gel clots. At this point, the cells collected can then be further processed, for example, by FACS sorting to assess gene or protein expression for the endothelial (CD31+) cells only.
Timing
-
Steps 1 and 2, PDMS device fabrication: 36 h
-
Steps 3–14, cell seeding and MVN formation: 3 h for seeding, 7 d for device culture
-
Steps 15–20, monolayer seeding: 1 h
-
Steps 21–37, permeability analysis by confocal imaging: 30 min per device
-
Steps 38–51, permeability analysis by interstitial fluid collection: 30 min per device
-
Steps 52–59, immunofluorescence staining and confocal imaging: 5 d
-
Steps 60–64, gel preparation for sectioning and alternative modes of imaging: 2 d
-
Steps 65–72, cell isolation for gene/protein analysis: 9 h
Anticipated results
This protocol describes a highly physiologically relevant model of the BBB microcirculation, which can be robustly characterized with the techniques described for the measurement of vascular permeabilities, the evaluation of cellular architecture, and the analysis of gene and protein expression. The BBB MVN model is particularly relevant for current academic and industrial applications given the high transport selectivity of the BBB, the elevated rates of failures in clinical trials of therapeutics targeting the brain, and the increasing incidence of neurological disorders5,21. In addition to their application in the BBB MVN model, the characterization techniques described in this protocol are highly versatile and can be employed in other in vitro vascular models.
We first characterize the morphological features of the BBB MVN model, focusing particularly on the vessel dimensions and their 3D cellular architecture. Following self-assembly via vasculogenesis in the devices, ECs form interconnected vascular structures, PCs adopt a perivascular position along the vessels, and ACs are observed to extend their end-feet and come into contact with the abluminal side of the vessels (Fig. 9b,c). Following 7 d of culture, vessel branch length increases, revealing highly interconnected structures that can be perfused with solutes through vascular diameters in the range of 10–40 µm (Fig. 2, Extended Data Fig. 1). Although the BBB MVN diameters are somewhat larger than those of human BBB capillaries in vivo (7–10 µm), this model showcases some of the smallest in vitro BBB vessel diameters to date59. PC coverage of the endothelium is also assessed in the BBB MVNs. By surface area, PCs are found to cover 30% of the endothelium by day 7, which is similar to values reported in mouse models60 (Table 5). This is also observed via immunofluorescence staining of PDGFR-β, which is found to be strongly expressed perivascularly on the endothelium (Fig. 9b). AC–EC interactions and water channel protein expression are also evidenced by aquaporin 4 immunofluorescence staining (Extended Data Fig. 5a).

a, Staining of adherens (VE-cadherin) and tight (ZO-1) junction proteins in the BBB MVNs. b, Staining of adherens junction protein (CD31) and PC marker (PDGFR-β) in the MVNs, along with F-actin to visualize interactions between the three cell types of the BBB. c, Staining of adherens junction protein (CD31) and AC marker (GFAP) in the MVNs, along with F-actin to visualize interactions between the three cell types of the BBB. Scale bars: 50 µm for a and 100 µm for b and c.
To further characterize the functional architecture of the BBB MVNs, EC junction expression and extracellular matrix deposition can be assessed via immunofluorescence staining. Expression of tight junction proteins ZO-1 and claudin 5 (Fig. 9a, Extended Data Fig. 5b), adherens junction proteins CD31 and VE-cadherin (Fig. 9a–c), basement membrane proteins laminin and collagen IV (Fig. 10a), and glycocalyx proteins heparan sulfate proteoglycan 2 and hyaluronic acid (Fig. 10b, Extended Data Fig. 5c) are all validated in the BBB MVNs with iPS-ECs, PCs and ACs. Expression of relevant BBB proteins in iPS-ECs BBB MVNs is comparable to that in BBB MVNs formed with HBMECs, PCs and ACs (Extended Data Fig. 6). Sectioning of the 3D gel and imaging via SEM further confirms the physiological cellular architecture of the BBB MVNs, illustrating seamless EC junctions (Fig. 11) and spatial interactions between ECs, PCs and ACs, where the latter two are found to come in contact with ECs on the abluminal side of the vessels. Increased vesicular density within the ECs in close proximity of AC end-feet suggests juxtacrine signaling among the BBB cells (Fig. 11b). Vesicle density per length of endothelium (1.27 ± 0.21 µm−1, Fig. 11d) is comparable to levels measured in brain capillaries (~1 µm−1 from Andreone et al.2) and 1.92 times smaller than that measured in a non-tissue specific MVN model assembled from human umbilical vein ECs and lung fibroblasts (2.44 ± 0.61 µm−1 from Offeddu et al.13), suggesting decreased transcytosis in the BBB MVNs.

a, Staining of basement membrane proteins (collagen IV and laminin) in the BBB MVNs. b, Staining of glycocalyx protein (heparan sulfate proteoglycan 2) in the BBB MVNs. Scale bars, 100 µm.

a, Interaction between ECs, PCs and ACs. b, AC end-foot connection to EC and close-up of increased vesicle density at the contact point. c, Seamless EC with no junction showing around the microvessel perimeter. The close-up shows the very low vesicle density observed in the BBB MVN ECs. d, Measurement of vesicle density in the BBB MVN ECs; n = 10 cells imaged. Scale bars, 5 μm.
ECs can be collected from the gel (Fig. 8) and isolated via FACS to quantify their gene or protein expression levels. In this study, models of iPS-EC + PC + AC and HBMEC + PC + AC were employed to compare expression levels of 22 BBB-relevant genes via qRT-PCR following EC isolation through FACS (Fig. 12a,b; source data are in Supplementary Data 3). The triculture MVN conditions were compared with iPS-ECs MVN monoculture in the 3D fibrin gel, and to 2D iPS-ECs and HBMECs cultured in well plates for 3 d (Fig. 12a). Genes associated with tight junctions (e.g., claudins, occludin, zonula occludens-1 (ZO-1)), adherens junctions (e.g., VE-cadherin, junctional adhesion molecule A (JAM-A), vascular cell adhesion molecule 1 (VCAM1)), transporter receptors (e.g., low-density lipoprotein receptor-related protein 1 (LRP1), L-type amino acid transporter 1 (LAT1), glucose transporter 1 (GLUT1), transferrin receptor (TfR), breast cancer resistance protein (BCRP), multidrug resistance proteins (MRPs)), and cellular interactions between ECs and PCs (e.g., PDGF-B) generally show significantly higher expression levels in ECs isolated from 3D triculture conditions, compared with 3D monoculture or 2D conditions (Fig. 12c). Remarkably, gene expression levels for iPS-ECs isolated from triculture devices consistently match those of HBMECs isolated from similar triculture devices (Fig. 12c and Extended Data Figs. 7–9; source data are in Supplementary Data 3). This strongly suggests that, in appropriate culture conditions with BBB-specific perivascular cells, iPS-ECs adopt gene expression profiles that closely match those of human primary brain ECs. Assessing the expression levels of transporter proteins in the BBB MVNs is critical to inform the development of therapeutic molecules that can employ specific transport mechanisms to cross the BBB.

a, Summary of different EC culture conditions considered for gene analysis via qRT-PCR. Figure partially made using Biorender.com. b, Example of FACS histogram of CD31 expression to sort for ECs in the triculture BBB MVNs (HBMEC sorting from triculture MVNs shown here). c, Heatmap showing levels of 22 genes of interest at the BBB for the culture conditions described in a. Values were obtained via qRT-PCR and were normalized by control gene 18S and by levels expressed in HBMECs cultured in 2D. n = 3 repeats were considered per condition, and each repeat consists of three pooled macrodevices (3D) or three pooled wells in a six-well plate (2D). CAT1, cationic amino acid transporter 1; CERP, cholesterol efflux regulator protein; MFSD2A, major facilitator superfamily domain containing 2A; MOT1, monocarboxylate transporter 1; PDGF-BB, platelet-derived growth factor BB; P-GP, P-glycoprotein; RAGE, receptor for advanced glycation end products.
Transport across the BBB MVNs can be assessed for any molecule to rank their capability to cross the barrier. Vascular permeabilities for molecules of size ranging from <1 kDa to 150 kDa show a typical magnitude in the range of 10−8 to 10−7 cm/s (Fig. 13). Dextran permeabilities are comparable to values measured in animal models5,12, suggesting physiological nonspecific paracellular transport through EC junctions. Small molecules mostly showcase higher permeabilities than large molecules; remarkably, bevacizumab, a monoclonal antibody used for glioblastoma VEGF therapy61,62,63, has a significantly larger permeability than plasma IgG, despite a similar molecular weight, and a permeability comparable to paclitaxel, a chemotherapeutic small molecule, suggesting enhanced transcytosis across the BBB MVNs. The efflux pump Pgp, for which paclitaxel is a known substrate64, is expressed at the protein level in the BBB MVNs (Fig. 14a), despite a nonmeasurable gene expression level (Fig. 12). Its function is demonstrated by the increased permeability of paclitaxel after Pgp inhibition with elacridar (Fig. 14b).

a, Permeability of various molecules across the BBB MVNs; n = 3 device repeats, each the average of three ROIs. (b) Representative images of selected ROIs at times 0 and 12 min for FITC and IgG in the BBB MVNs. Scale bar, 100 µm. Figure partially made using Biorender.com.

a, Immunofluorescence staining of BBB MVNs showing expression of Pgp in iPS-ECs (weaker signal) and perivascular cells (stronger signal, consistent with expression of Pgp in PCs and ACs71,72). Scale bar, 100 µm. b, Functional Pgp permeability assay showing increased permeability of paclitaxel after treatment of the BBB MVNs with elacridar (Pgp inhibitor28, perfused in the BBB MVNs at 10 µM for 30 min prior to the permeability assay); n = 3 device repeats, each the average of three ROIs.
Circulating cytokines in brain capillaries have been reported to affect expression of efflux transporters at the BBB65. For instance, treatment of brain ECs with interleukin (IL)-1β, IL-6 and tumor necrosis factor α (TNF-α) resulted in downregulation of BCRP (ATP-binding cassette subfamily G member 2 (ABCG2)) along with reductions in the uptake of BCRP substrate drugs66. Secreted cytokines in the BBB MVNs can be evaluated via Luminex analysis of the medium perfused in the model (Fig. 15a). Accounting for the presence of growth factors in the iPS-EC medium and iPS-EC + VEGF medium (notably, endothelial growth factor (EGF), VEGF-A and fibroblast growth factor 2 (FGF-2)), the secreted cytokines with highest concentrations in the BBB MVNs are C–C motif chemokine ligand 2 (CCL2) (monocyte chemoattractant protein 1 (MCP-1)), C–X–C motif chemokine ligand 1 (CXCL1), and IL-8 (at >1,000 pg/mL), IL-6, PDGF-AA and granulocyte colony-stimulating factor (G-CSF) (at >100 pg/mL), while the rest of the measured cytokines secreted have concentrations <50 pg/mL (Fig. 15b). The BBB MVN model described in this protocol can provide a simple, physiologically accurate platform to study correlations between cytokine signaling and transporter gene/protein expression.

a, Summary of protocol steps to collect perfused medium in the devices for cytokine analysis by Luminex. Figure partially made using Biorender.com. b, Levels of 42 secreted cytokines in the collected medium of the BBB MVNs. Luminex assay was performed by Eve Technologies using n = 3 repeats for each cytokine considered, where each repeat consists of medium collected from three pooled microdevices. EGF, VEGF-A and FGF-2 are all found in the iPS-EC medium at 5,000 pg/mL each57.
These findings cumulatively attest to the ability of the BBB MVN model to recapitulate key aspects of the natural BBB. Importantly, this model offers a new avenue for the development of therapeutics in a human BBB model with relevant properties, notably in terms of vascular morphology and appropriate cellular organization, transport capabilities and relevant gene/protein expression profiles.
Reporting Summary
Further information on research design is available in the Nature Research Reporting Summary linked to this article.
Data availability
Source data are provided with this paper. All raw data needed to generate the figures presented in this work are available in the source data files. Raw image files are available from the corresponding author upon request.
References
Abbott, N. J., Patabendige, A. A. K., Dolman, D. E. M., Yusof, S. R. & Begley, D. J. Structure and function of the blood–brain barrier. Neurobiol. Dis. 37, 13–25 (2010).
Andreone, B. J. et al. Blood–brain barrier permeability is regulated by lipid transport-dependent suppression of caveolae-mediated transcytosis. Neuron 94, 581–594.e5 (2017).
Hajal, C., LeRoi, B., Kamm, R. D. & Maoz, B. M. Biology and models of the blood–brain barrier. Annu. Rev. Biomed. Eng. 23, 359–384 (2021).
Hammarlund-Udenaes, M., Fridén, M., Syvänen, S. & Gupta, A. On the rate and extent of drug delivery to the brain. Pharm. Res. 25, 1737–1750 (2008).
Hajal, C., Campisi, M., Mattu, C., Chiono, V. & Kamm, R. D. In vitro models of molecular and nano-particle transport across the blood–brain barrier. Biomicrofluidics 12, 42213 (2018).
Sip, C. G., Bhattacharjee, N. & Folch, A. Microfluidic transwell inserts for generation of tissue culture-friendly gradients in well plates. Lab. Chip 14, 302–314 (2014).
Stone, N. L., England, T. J. & O’Sullivan, S. E. A novel transwell blood brain barrier model using primary human cells. Front. Cell. Neurosci. 13, (2019).
Ahn, S. I. et al. Microengineered human blood–brain barrier platform for understanding nanoparticle transport mechanisms. Nat. Commun. 11, 175 (2020).
Herland, A. et al. Distinct contributions of astrocytes and pericytes to neuroinflammation identified in a 3D human blood–brain barrier on a chip. PLOS ONE 11, e0150360 (2016).
Adriani, G., Ma, D., Pavesi, A., Kamm, R. D. & Goh, E. L. K. A 3D neurovascular microfluidic model consisting of neurons, astrocytes and cerebral endothelial cells as a blood–brain barrier. Lab. Chip 17, 448–459 (2017).
Brown, J. A. et al. Recreating blood–brain barrier physiology and structure on chip: a novel neurovascular microfluidic bioreactor. Biomicrofluidics 9, (2015).
Campisi, M. et al. 3D self-organized microvascular model of the human blood–brain barrier with endothelial cells, pericytes and astrocytes. Biomaterials 180, 117–129 (2018).
Offeddu, G. S. et al. An on-chip model of protein paracellular and transcellular permeability in the microcirculation. Biomaterials 212, 115–125 (2019).
Offeddu, G. S. et al. Application of transmural flow across in vitro microvasculature enables direct sampling of interstitial therapeutic molecule distribution. Small 15, 1902393 (2019).
Chen, M. B. et al. On-chip human microvasculature assay for visualization and quantification of tumor cell extravasation dynamics. Nat. Protoc. 12, 865–880 (2017).
Wimmer, R. A., Leopoldi, A., Aichinger, M., Kerjaschki, D. & Penninger, J. M. Generation of blood vessel organoids from human pluripotent stem cells. Nat. Protoc. 14, 3082–3100 (2019).
Olmer, R. et al. Differentiation of human pluripotent stem cells into functional endothelial cells in scalable suspension culture. Stem Cell Rep. 10, 1657–1672 (2018).
Yuan, W., Lv, Y., Zeng, M. & Fu, B. M. Non-invasive measurement of solute permeability in cerebral microvessels of the rat. Microvasc. Res. 77, 166–173 (2009).
Shi, L., Zeng, M., Sun, Y. & Fu, B. M. Quantification of blood–brain barrier solute permeability and brain transport by multiphoton microscopy. J. Biomech. Eng. 136, 31005 (2014).
Kutuzov, N., Flyvbjerg, H. & Lauritzen, M. Contributions of the glycocalyx, endothelium, and extravascular compartment to the blood–brain barrier. Proc. Natl Acad. Sci. USA 115, E9429–E9429 (2018).
Offeddu, G. S., Shin, Y. & Kamm, R. D. Microphysiological models of neurological disorders for drug development. Curr. Opin. Biomed. Eng. 13, 119–126 (2020).
Vatine, G. D. et al. Human iPSC-derived blood–brain barrier chips enable disease modeling and personalized medicine applications. Cell Stem Cell 24, 995–1005.e6 (2019).
Lee, S. W. L. et al. Modeling nanocarrier transport across a 3D in vitro human blood-brain–barrier microvasculature. Adv. Healthc. Mater. 9, 1901486 (2020).
Straehla, J. P., Hajal, C., Dacoba, T., Kamm, R. D. & Hammond, P. T. THER-15. Functionalized nanoparticle trafficking assessed in a novel microfluidic model of the blood–brain barrier with high grade glioma spheroids. Neuro-Oncol. 21, ii117–ii117 (2019).
Straehla, J. P. et al. DDEL-04. Engineered nanocarriers to enhance drug delivery across the blood–brain barrier. Neuro-Oncol. 22, iii284 (2020).
Chen, M. B., Whisler, J. A., Jeon, J. S. & Kamm, R. D. Mechanisms of tumor cell extravasation in an in vitro microvascular network platform. Integr. Biol. Quant. Biosci. Nano Macro 5, 1262–1271 (2013).
Hajal, C. et al. The CCL2-CCR2 astrocyte-cancer cell axis in tumor extravasation at the brain. Sci. Adv. 7, 26 (2021).
Haase, K., Offeddu, G. S., Gillrie, M. R. & Kamm, R. D. Endothelial regulation of drug transport in a 3D vascularized tumor model. Adv. Funct. Mater. 30, 2002444 (2020).
Cucullo, L., Hossain, M., Puvenna, V., Marchi, N. & Janigro, D. The role of shear stress in blood–brain barrier endothelial physiology. BMC Neurosci. 12, 40 (2011).
Gs, O. et al. Microheart: a microfluidic pump for functional vascular culture in microphysiological systems. J. Biomech. 119, (2021).
Wang, Y. I., Abaci, H. E. & Shuler, M. L. Microfluidic blood–brain barrier model provides in vivo-like barrier properties for drug permeability screening. Biotechnol. Bioeng. 114, 184–194 (2017).
Bowman, P. D., Ennis, S. R., Rarey, K. E., Betz, A. L. & Goldstein, G. W. Brain microvessel endothelial cells in tissue culture: a model for study of blood–brain barrier permeability. Ann. Neurol. 14, 396–402 (1983).
Rauh, J., Meyer, J., Beuckmann, C. & Galla, H. J. Development of an in vitro cell culture system to mimic the blood–brain barrier. Prog. Brain Res 91, 117–121 (1992).
Shafaie, S., Hutter, V., Brown, M. B., Cook, M. T. & Chau, D. Y. S. Influence of surface geometry on the culture of human cell lines: a comparative study using flat, round-bottom and v-shaped 96 well plates. PLOS ONE 12, e0186799 (2017).
Dehouck, M. P., Méresse, S., Delorme, P., Fruchart, J. C. & Cecchelli, R. An easier, reproducible, and mass-production method to study the blood–brain barrier in vitro. J. Neurochem. 54, 1798–1801 (1990).
Xu, H. et al. A dynamic in vivo-like organotypic blood–brain barrier model to probe metastatic brain tumors. Sci. Rep. 6, srep36670 (2016).
Li, X., Xu, J., Bartolák-Suki, E., Jiang, J. & Tien, J. Evaluation of 1-mm-diameter endothelialized dense collagen tubes in vascular microsurgery. J. Biomed. Mater. Res. B Appl. Biomater. 108, 2441–2449 (2020).
Linville, R. M., Boland, N. F., Covarrubias, G., Price, G. M. & Tien, J. Physical and chemical signals that promote vascularization of capillary-scale channels. Cell. Mol. Bioeng. 9, 73–84 (2016).
Park, T.-E. et al. Hypoxia-enhanced blood–brain barrier chip recapitulates human barrier function and shuttling of drugs and antibodies. Nat. Commun. 10, 2621 (2019).
Bischoff, I. et al. Pitfalls in assessing microvascular endothelial barrier function: impedance-based devices versus the classic macromolecular tracer assay. Sci. Rep. 6, 23671 (2016).
Srinivasan, B. et al. TEER measurement techniques for in vitro barrier model systems. J. Lab. Autom. 20, 107–126 (2015).
Bang, S. et al. A low permeability microfluidic blood–brain barrier platform with direct contact between perfusable vascular network and astrocytes. Sci. Rep. 7, 8083 (2017).
Offeddu, G. S. et al. The cancer glycocalyx mediates intravascular adhesion and extravasation during metastatic dissemination. Commun. Biol. 4, 1–10 (2021).
Hajal, C., Ibrahim, L., Serrano, J. C., Offeddu, G. S. & Kamm, R. D. The effects of luminal and trans-endothelial fluid flows on the extravasation and tissue invasion of tumor cells in a 3D in vitro microvascular platform. Biomaterials 265, 120470 (2021).
McPherson, C. et al. Cost analysis and rate setting manual for animal research facilities. Lab Anim. 30, 15–16 (2001).
Dobrovolskaia, M. A., Aggarwal, P., Hall, J. B. & McNeil, S. E. Preclinical studies to understand nanoparticle interaction with the immune system and its potential effects on nanoparticle biodistribution. Mol. Pharm. 5, 487–495 (2008).
Chen, M. B. et al. Inflamed neutrophils sequestered at entrapped tumor cells via chemotactic confinement promote tumor cell extravasation. Proc. Natl Acad. Sci. USA 115, 7022–7027 (2018).
van Veluw, S. J. et al. Vasomotion as a driving force for paravascular clearance in the awake mouse brain. Neuron 105, 549–561.e5 (2020).
Ll, B. et al. Electrospun gelatin biopapers as substrate for in vitro bilayer models of blood–brain barrier tissue. J. Biomed. Mater. Res. A 104, (2016).
Di Marco, A. et al. Application of an in vitro blood–brain barrier model in the selection of experimental drug candidates for the treatment of Huntington’s disease. Mol. Pharm. 16, 2069–2082 (2019).
Kedem, O. & Katchalsky, A. Thermodynamic analysis of the permeability of biological membranes to non-electrolytes. Biochim. Biophys. Acta 27, 229–246 (1958).
Hedegaard, S. F. et al. Fluorophore labeling of a cell-penetrating peptide significantly alters the mode and degree of biomembrane interaction. Sci. Rep. 8, 6327 (2018).
Shah, D. K. & Betts, A. M. Antibody biodistribution coefficients: inferring tissue concentrations of monoclonal antibodies based on the plasma concentrations in several preclinical species and human. mAbs 5, 297–305 (2013).
Dore-Duffy, P. & Cleary, K. Morphology and properties of pericytes. Methods Mol. Biol. 686, 49–68 (2011).
Barar, J., Rafi, M. A., Pourseif, M. M. & Omidi, Y. Blood–brain barrier transport machineries and targeted therapy of brain diseases. BioImpacts 6, 225–248 (2016).
Schindelin, J. et al. Fiji: an open-source platform for biological-image analysis. Nat. Methods 9, 676–682 (2012).
Product datasheet: iCell Endothelial Cells https://www.fujifilmcdi.com/wp/wp-content/uploads/2020/07/CDI_iCell_EndothelialCells_DS.pdf (2018).
Shin, Y. et al. Microfluidic assay for simultaneous culture of multiple cell types on surfaces or within hydrogels. Nat. Protoc. 7, 1247–1259 (2012).
Lee, S., Chung, M., Lee, S.-R. & Jeon, N. L. 3D brain angiogenesis model to reconstitute functional human blood–brain barrier in vitro. Biotechnol. Bioeng. 117, 748–762 (2020).
Bonkowski, D., Katyshev, V., Balabanov, R. D., Borisov, A. & Dore-Duffy, P. The CNS microvascular pericyte: pericyte-astrocyte crosstalk in the regulation of tissue survival. Fluids Barriers CNS 8, 8 (2011).
Iwamoto, F. M. & Fine, H. A. Bevacizumab for malignant gliomas. Arch. Neurol. 67, 285–288 (2010).
Li, Y., Ali, S., Clarke, J. & Cha, S. Bevacizumab in recurrent glioma: patterns of treatment failure and implications. Brain Tumor Res. Treat. 5, 1–9 (2017).
Kim, M. M., Umemura, Y. & Leung, D. Bevacizumab and glioblastoma: past, present, and future directions. Cancer J. Sudbury Mass 24, 180–186 (2018).
Jang, S. H., Wientjes, M. G. & Au, J. L. Kinetics of P-glycoprotein-mediated efflux of paclitaxel. J. Pharmacol. Exp. Ther. 298, 1236–1242 (2001).
Pan, W. et al. Cytokine signaling modulates blood–brain barrier function. Curr. Pharm. Des. 17, 3729–3740 (2011).
Poller, B. et al. The human brain endothelial cell line hCMEC/D3 as a human blood–brain barrier model for drug transport studies. J. Neurochem 107, 1358–1368 (2008).
Wong, A. et al. The blood–brain barrier: an engineering perspective. Front. Neuroeng. 6, (2013).
Frank, R. N., Dutta, S. & Mancini, M. A. Pericyte coverage is greater in the retinal than in the cerebral capillaries of the rat. Invest. Ophthalmol. Vis. Sci. 28, 1086–1091 (1987).
Haase, K., Gillrie, M. R., Hajal, C. & Kamm, R. D. Pericytes contribute to dysfunction in a human 3D model of placental microvasculature through VEGF-Ang-Tie2 signaling. Adv. Sci. 6, 1900878 (2019).
Fang, T. et al. Nanobody immunostaining for correlated light and electron microscopy with preservation of ultrastructure. Nat. Methods 15, 1029–1032 (2018).
Golden, P. L. & Pardridge, W. M. P-glycoprotein on astrocyte foot processes of unfixed isolated human brain capillaries. Brain Res 819, 143–146 (1999).
Bendayan, R., Ronaldson, P. T., Gingras, D. & Bendayan, M. In situ localization of P-glycoprotein (ABCB1) in human and rat brain. J. Histochem. Cytochem. 54, 1159–1167 (2006).
Hajal, C. Blood–Brain Barrier Model on a Microfluidic Chip for the Study of Tumor Cell Extravasation. Thesis, Massachusetts Institute of Technology, 2018.
Acknowledgements
The authors thank L. Possenti for help with writing the ImageJ Macro, J. Whisler and K. Haase for initial design of the macrodevice, and L. Vega for help with the 3D printing mold for the macrodevice. C.H. is supported by the Ludwig Center for Molecular Oncology Graduate Fellowship and by the National Cancer Institute (U01 CA202177). G.S.O. is supported by Amgen Inc. Y.J. and R.K. acknowledge support from the Cure Alzheimer’s Fund and the National Institute of Neurological Disorders and Stroke (R21NS105027).
Author information
Authors and Affiliations
Contributions
Y.S. and C.H. developed and optimized the BBB MVN protocol; G.S.O. developed the transport measurement protocols; C.H., G.S.O., Y.S., D.H., C.G.K. and R.D.K. designed the experiments; C.H., G.S.O., Y.S., S.Z. and O.M. performed the experiments; C.H. and G.S.O. analyzed the data; C.H., G.S.O. and Y.S. designed the figure schematics; C.H. and G.S.O. wrote the first draft of the manuscript, and all authors contributed to its final form.
Corresponding author
Ethics declarations
Competing interests
R.D.K. is a cofounder of AIM Biotech, which markets microfluidic systems for 3D culture.
Additional information
Peer review information Nature Protocols thanks Luca Cucullo and Loes Segerink for their contribution to the peer review of this work.
Publisher’s note Springer Nature remains neutral with regard to jurisdictional claims in published maps and institutional affiliations.
Related links
Key references using this protocol:
Campisi, M. et al. Biomaterials 180, 117–129 (2018): https://doi.org/10.1016/j.biomaterials.2018.07.014
Offeddu, G. S. et al. Biomaterials 212, 115–125 (2019): https://doi.org/10.1016/j.biomaterials.2019.05.022
Offeddu, G. S. et al. Small 15, 1902393 (2019): https://doi.org/10.1002/smll.201902393
Chen, M. B. et al. Nat. Protoc. 12, 865–880 (2017): https://doi.org/10.1038/nprot.2017.018
Shin, Y. et al. Nat. Protoc. 7, 1247–59 (2012): https://doi.org/10.1038/nprot.2012.051
Extended data
Extended Data Fig. 1 Morphological properties of the BBB MVNs over time starting at day 2 of culture after device seeding.
Extended Data Fig. 2 Steps for vascular permeability measurements via confocal microscopy.
(a) Representative images of perfused plasma IgG (green) at times 0 and 12 min, and increasing matrix intensity over time; the single data points represent the same single pixels in the matrix imaged over time. Scale bar, 100 μm. (b) Permeability of plasma IgG in the BBB MVNs over time. At short times (<12 min), variability in the measurement derives from low signal-to-noise ratio. At long times (>20 min), higher permeability values derive from progressive perfusate diffusion from the side channels. (c) Comparison in 40 kDa dextran permeability measured in the micro and macro devices; n = 3 device repeats, each the average of 3 regions of interest (ROIs). The higher permeability in the micro device derives from increased perfusate diffusion from the side channels over the same time.
Extended Data Fig. 3 Steps for vascular permeability measurements via fluid sampling.
(a) Example vascular and matrix intensities measured for IgG as a function of depth imaged within the device. Both intensities are normalized to the vascular intensity near the bottom glass. They decrease with depth as a result of light scattering, falling within the background intensity range (shaded area) in the case of the matrix intensity. (b) Example microscope z-drift measured during a typical experiment. (c) Permeability of plasma IgG as a function of imaged region of interest (ROI) size. Average and standard deviation between 3 devices are reported. For ROIs smaller than 600 µm by side, the varying permeability values are an artifact due to incomplete capture of the BBB MVN average morphology.
Extended Data Fig. 4 Effective permeability of FITC (assumed σ = 0) across the BBB MVNs as a function of intravascular pressure applied.
The slope of the linear fit represents the hydraulic conductivity Lp14.
Extended Data Fig. 5 Immunofluorescence staining for various proteins of interest in the BBB MVNs with iPS-ECs (steps 52-59 in the protocol).
(a) Staining of water channel protein (aquaporin 4) in ACs in the BBB MVNs. (b) Staining of glycocalyx protein (hyaluronic acid) in the BBB MVNs. (c) Staining of tight junction protein (claudin-5) in the BBB MVNs. Scale bars are 100 µm for (a-b) and 50 µm for (c).
Extended Data Fig. 6 Immunofluorescence staining for various proteins of interest in the BBB MVNs with HBMECs (steps 52-59 in the protocol).
(a) Staining of PC marker (PDGFR-β) in the MVNs, along with F-actin to visualize interactions between HBMECs and PCs. (b) Staining of AC marker (GFAP) in the MVNs, along with F-actin to visualize interactions between HBMECs and ACs. (c) Staining of tight junction protein (ZO-1) in the BBB MVNs with HBMECs. (d) Staining of basement membrane proteins (collagen IV and laminin) in the BBB MVNs with HBMECs. Scale bars are 100 µm for (a, d) and 50 µm for (b-c).
Extended Data Fig. 7 Gene levels measured via qRT-PCR in the different conditions described in Fig. 12a for tight junctions.
(a) Claudin 1, (b) claudin 3, (c) claudin 5, (d) occludin, and (e) ZO-1.
Extended Data Fig. 8 Gene levels measured via qRT-PCR in the different conditions described in Fig. 12a for adherens junctions.
(a) VE-cadherin, (b) JAM-A, and EC adhesion markers (c) PDGF-B and (d) VCAM1.
Extended Data Fig. 9 Gene levels measured via qRT-PCR in the different conditions described in Fig. 12a for transporter receptors.
(a) LRP1, (b) LAT1, (c) CAT1, (d) GLUT1, (e) TfR, (f) BCRP, (g) MOT1, (h) CERP, (i) MRP1, (j) MRP2, (k) RAGE, (l) MFSD2A, and (m) P-GP.
Supplementary information
Supplementary Information
Supplementary Figs. 1 and 2, Supplementary Table 1 and Supplementary Method.
Supplementary Data 1
CAD file 1 for macro device
Supplementary Data 2
CAD file 2 for micro device
Supplementary Data 3
Raw data to graph and obtain statistical measures for Fig. 12 and Extended Data Figs. 7–9.
Supplementary Software 1
Macro code for permeability measurements using ImageJ
Supplementary Software 2
Classifier model for permeability measurements using ImageJ
Supplementary Table 2
Spreadsheet with template for permeability measurements using ImageJ
Source data
Source Data Fig. 11
Raw data to graph and obtain statistical measures.
Source Data Fig. 13
Raw data to graph and obtain statistical measures.
Source Data Fig. 14
Raw data to graph and obtain statistical measures.
Source Data Fig. 15
Raw data to graph and obtain statistical measures.
Source Data Extended Data Fig. 1
Raw data to graph and obtain statistical measures.
Source Data Extended Data Fig. 2
Raw data to graph and obtain statistical measures.
Source Data Extended Data Fig. 3
Raw data to graph and obtain statistical measures.
Source Data Extended Data Fig. 4
Raw data to graph and obtain statistical measures.
Rights and permissions
About this article

Cite this article
Hajal, C., Offeddu, G.S., Shin, Y. et al. Engineered human blood–brain barrier microfluidic model for vascular permeability analyses. Nat Protoc 17, 95–128 (2022). https://doi.org/10.1038/s41596-021-00635-w
Received:
Accepted:
Published:
Issue Date:
DOI: https://doi.org/10.1038/s41596-021-00635-w
This article is cited by
-
Modeling early pathophysiological phenotypes of diabetic retinopathy in a human inner blood-retinal barrier-on-a-chip
Nature Communications (2024)
-
Vascularized organoid-on-a-chip: design, imaging, and analysis
Angiogenesis (2024)
-
Addressing Cardiovascular Toxicity Risk of Electronic Nicotine Delivery Systems in the Twenty-First Century: “What Are the Tools Needed for the Job?” and “Do We Have Them?”
Cardiovascular Toxicology (2024)
-
The Progress in Molecular Transport and Therapeutic Development in Human Blood–Brain Barrier Models in Neurological Disorders
Cellular and Molecular Neurobiology (2024)
-
An optofluidic platform for interrogating chemosensory behavior and brainwide neural representation in larval zebrafish
Nature Communications (2023)
Comments
By submitting a comment you agree to abide by our Terms and Community Guidelines. If you find something abusive or that does not comply with our terms or guidelines please flag it as inappropriate.
