
Abstract
Understanding cell type identity in a multicellular organism requires the integration of gene expression profiles from individual cells with their spatial location in a particular tissue. Current technologies allow whole-transcriptome sequencing of spatially identified cells but lack the throughput needed to characterize complex tissues. Here we present a high-throughput method to identify the spatial origin of cells assayed by single-cell RNA-sequencing within a tissue of interest. Our approach is based on comparing complete, specificity-weighted mRNA profiles of a cell with positional gene expression profiles derived from a gene expression atlas. We show that this method allocates cells to precise locations in the brain of the marine annelid Platynereis dumerilii with a success rate of 81%. Our method is applicable to any system that has a reference gene expression database of sufficiently high resolution.
Main
High-throughput single-cell RNA-sequencing by automated reaction processing in multiwell plates1 or by microfluidics devices2 is becoming an established experimental technique3. The sample collection step in these protocols results in the dissociation of tissue and therefore loss of spatial information. However, investigating the molecular composition of individual cells in the context of spatial location is important, especially when studying primary cells. This is particularly relevant when looking at complex tissues, such as the early embryo or the brain, where multiple heterogeneous cell types are located in close proximity.
Single-molecule fluorescence in situ hybridization (FISH)4 has been widely used to quantitate transcript numbers at single-cell resolution within the context of a tissue of interest. This allows gene expression to be assayed in many cells but it can only be applied to a small number of genes. More recently, methods for high-throughput, spatially resolved single-cell RNA-seq have been developed using in vivo marking and picking of selected cells from predefined spatial coordinates4, or in situ amplification of cellular transcriptomes on tissue sections5. Although these approaches facilitate analysis of all expressed genes in each captured cell, they are limited in terms of the number of cells that can be labeled and then processed (Supplementary Note 1). An alternative approach is to carry out unbiased single-cell RNA-sequencing (where cells are dissociated without knowledge of their spatial location) followed by computational approaches, such as Principal Component Analysis, to partially recover the spatial structure of the tissue of interest6. However, such approaches do not facilitate a fine-grained reconstruction whereby the location of each cell can be precisely determined.
To overcome these limitations, we propose an integrated approach that combines previously generated in situ hybridization (ISH)-based gene expression atlases with unbiased single-cell transcriptomics (Fig. 1). Notably, ISH atlases exist for many species and developmental stages (Table 1) making our approach broadly applicable. Moreover, beyond the model systems for which comprehensive maps are typically available, targeted ISH of tens of marker genes is commonly used to study spatially restricted patterns of gene expression in systems that provide key insights into evolution and development7,8,9. Such screens could also be used as a mapping reference for RNA-seq data, and, for several ‘nonmodel’ species (e.g., zebra finch or the ascidian Ciona intestinalis), high-quality gene expression data are already being assembled into structured databases (Table 1).

We used an existing gene expression atlas (right column) to link scRNA-seq data (left column) from cells extracted from the developing brain of P. dumerilii (top left) with spatial coordinates. The gene expression atlas was binarized, resulting in a matrix of n positions that each comprise presence and absence values for m genes. For each sequenced cell c, expression data for the same set of m genes was compared to expression profiles at all n positions in the reference matrix and matched based on highest similarity. An example of the likely position for one cell is indicated in the two images at the bottom by the red circle in the bottom left (ventral view of P. dumerilii larva) and red voxels in the apical view at bottom right. The upper right panel of this figure is modified from ref. 17. Scale bars, 50 μm.
Results
Experimental design and quality control
We used the developing brain of a marine annelid, P. dumerilii, to demonstrate the utility of our approach. P. dumerilii is an important model system for studying bilaterian brain evolution10,11 so obtaining spatially registered transcriptomic profiles of cells within its brain is valuable for understanding how cell types in the vertebrate brain evolved.
At 48 h post-fertilization (hpf), the P. dumerilii larval brain is composed of a relatively low number of cells (∼2,000). However, this small number of cells harbors a wide range of cell types, including several types of differentiated neurons, sensory cells and proliferating progenitor cells12,13,14,15,16. Previously, whole-mount in situ hybridization (WMISH) was used to study the expression pattern of 169 differentially expressed candidate genes such as transcription factors, regulators of cell fate and body plan patterning, within the brain of P. dumerilii, thus facilitating the creation of a WMISH expression atlas14,17. Subsequently, this WMISH data set was divided into 3-μm3 voxels and binarized, resulting in a matrix (Fig. 1) where genes are arranged in the rows and spatial coordinates (voxels) in the columns17. Using a previously described approach17, we removed genes with low-quality WMISH signals, resulting in a reduced reference set of 98 genes. Considering the 3-μm3 voxel size and the observation that cell diameters range from 4 to 25 μm, most cells in the P. dumerilii brain are expected to correspond to 11–174 voxels. An entry in the matrix (one voxel) is set equal to 1 if the corresponding gene is expressed in the voxel of interest and set equal to 0 otherwise.
To generate the single-cell RNA-sequencing (scRNA-seq) data, we dissociated P. dumerilii larval brains, and followed that by cell capture, cDNA synthesis and amplification on the C1 Single-Cell Auto Prep IFC. In total, we sequenced 213 samples, of which 155 (73%) corresponded to single cells (as judged by visual inspection of the captured cells) with the remainder consisting of single dead cells, wells containing multiple cells and empty wells, which were sequenced as a negative control (Supplementary Table 1).
For each cell, the scRNA-seq data were mapped to the P. dumerilii reference transcriptome augmented with the ERCC spike-in molecule sequences18. The quality of the data was evaluated by calculating the percentage of all reads mapping to the reference transcriptome and to the ERCC spike-in sequences (Supplementary Fig. 1). Samples where >10% of reads mapped to the ERCC sequences and <10% of reads mapped to the reference transcriptome were excluded from further analyses. In addition, samples containing no cells or multiple cells were excluded, leaving 139 high-quality filtered cells (QF cells) that were used in downstream analyses (Supplementary Table 1). We note that 139 cells corresponds to ∼7% of all cells in the larval brain of P. dumerilii.
To assess whether the 139 QF cells represented a random sample of cells from across the whole brain, we compared the proportion of sequenced cells in which each gene was expressed with the proportion of voxels showing expression of the same gene in the binarized reference atlas (Supplementary Fig. 2). This revealed that the ratios display good concordance (Supplementary Fig. 2; Spearman's Rho = 0.48, P < 2 × 10⁻⁵ Spearman's Rank Test), thus providing confidence that the sequenced cells represent a broad sample of cells from across the P. dumerilii brain.
Mapping of individual cells
To determine the spatial origin of each sequenced cell we applied a three-step approach. First, for each cell, we calculated a specificity score that indicates to what extent each gene is specifically expressed in that cell relative to all other cells (Supplementary Note 2). For each cell, its score vector was then transformed using a logistic function such that its elements took values between 0 and 1, where a value near 1 indicates that a gene is highly specific to the cell of interest. Subsequently, a ‘correspondence score’ was determined for each cell-voxel combinations. For each gene expressed in the scRNA-seq data and present in the WMISH atlas (72/98 genes; others correspond to genes expressed at low levels or expressed exclusively in cells that we did not capture), a match or mismatch between the scRNA-seq and the WMISH data resulted in the transformed specificity weight being added or subtracted from the cell-voxel score, respectively. This yielded a cell-voxel correspondence score for all combinations of cells and voxels. Third, we used simulations to determine, for each cell, the significance of the cell-voxel correspondence scores (Supplementary Figs. 3 and 4). More specifically, we generated a randomized data set by permuting the specificity scores 100 times for each cell and mapped these simulated cells back to the reference. Based upon this simulated data set, we determined the empirical probability that each true cell was mapped back to a particular number of voxels at a given correspondence score threshold.
We mapped 69 cells (50%) with high confidence (at least 21 voxels with a score >1.5 corresponding to <10% chance of occurrence in the simulated data), 43 cells (31%) with medium confidence (at least 16 voxels with a score > 0.5 corresponding to <30% chance of occurrence in the simulated data) and 14 cells (10%) with low confidence (>11 voxels with a score > 0 corresponding to <50% chance of being observed in the simulated data; Supplementary Figs. 3 and 4). We considered the voxels with the highest confidence for each sample as being the most likely loci from which the cell assayed by means of scRNA-seq originated (Supplementary Table 2). Altogether, we established a likely location for 91% of cells in our data set (Fig. 2d), with the median number of voxels per mapped cell being 54 (interquartile range: 30 – 110).

(a) An example of a cell mapped at single-cell precision (<150 voxels). 83% of cells in our data set fit this mapping profile. (b) An example of a cell mapping to a small brain region. 13% of cells in our data set fit this mapping profile. (c) An example of a broad mapping where many voxels score above the threshold. 4% of cells in our data set fit this mapping profile. Note that for mapping profiles shown in b and c, smaller high-score voxel groups (dark red) can be identified within the large number of above-threshold voxels. Such high-score domains likely correspond to the precise positions of the cell. The samples shown in a–c are mapped with high confidence. (a–c) apical view of the brain; (a′–c′) lateral view; (a″–c″) dorsal view. Voxels with a correspondence score < 1.5 are colored blue. Upper right corner: cell ID; lower right: number of voxels above threshold (in parentheses: voxels localized in the left/right-side of the brain, respectively). (d) Distribution of mapped cells across the defined confidence levels stratified by the number of voxels to which each cell is mapped back. (e) Percentage of cells mapping back to each category (high/medium/low/unmapped) for the reference used in this study (72 genes out of the 98 genes in the full P. dumerilii spatial reference atlas that were expressed in at least one of the sequenced cells; right-hand side) and the mean (± s.e.m.) number of cells assigned to each category when simulated references containing different numbers of genes (30, 40, 50 and 60) are used.
Notably, the set of voxels to which each cell is mapped back to are typically arranged in small, bilaterally symmetric and spatially coherent groups (Fig. 2a-a″, 2b-b″ and Supplementary Table 2). This is expected, because the voxel size in our model is much smaller than one cell, and the P. dumerilii brain shows strong bilateral symmetry at 48 hpf. Given that the captured cells are between 8 and 17 μm in diameter (Supplementary Note 2) and the voxels are all 3 μm3, our results suggest that we can map back the majority (83%; number of corresponding voxels <150, Fig. 2d) of sequenced cells to a precise, single location (considering bilateral symmetry; Fig. 2a-a″). The remaining cells map back to either a small number of voxels (13%; number of corresponding voxels between 150 and 500; Fig. 2b-b″) or, in three cases, to a broader domain (4%; number of corresponding voxels >500; Fig. 2c-c″). Broad mapping domains are indicative of relative molecular homogeneity of the respective brain regions, at least when considering the genes included in the reference. In this case, augmenting the reference atlas with genes that display variable patterns of expression in the cells mapped back to such regions should improve the precision of the mapping. A summary of the locations across the brain to which all cells are mapped back can be found in Supplementary Figure 5. The individual cell mappings can be viewed at the following link: http://www.ebi.ac.uk/~jbpettit/map_viewer/?dataset=examples/coord_full.csv&cluster0=examples/resultsBio.csv.
The size of the reference atlas
To investigate how the number of reference genes affected the mapping, we generated simulated spatial reference atlases, each containing a subset of the genes used in the initial atlas (30, 40, 50 and 60 gene subsets were used), and mapped each cell back to these simulated references. We observed that the fraction of cells mapped back with medium or high confidence increased as a function of the number of reference genes. On average, 58% of cells were mapped back with medium or high confidence when only 30 reference genes were used, in contrast to the 81% of cells that were mapped back when the full reference set of 72 genes (corresponding to genes included in the WMISH atlas and expressed in the scRNA-seq data) was deployed (Fig. 2e). This suggests that a relatively small number of genes (between 50 and 100) with spatially distinct patterns of expression are needed to map cells to a specific location with a high degree of confidence (Discussion). Critically, pre-existing ISH resources often contain more genes (Table 1) than the P. dumerilii reference used in this study.
Mapping validation and the associated challenges
Overall, our approach enables the majority of cells to be mapped back with medium to high confidence. However, even for these cases, there exist discrepancies where, for example, a highly specific gene is not expressed in the region to which a cell is mapped (Fig. 3). This can occur as our approach uses a relatively large reference set and is therefore robust to such mismatches assuming that other, highly specific, genes exist. However, understanding the factors that lead to such discrepancies between the ISH and scRNA-seq data sets provides valuable insights into the quality of both data sets.

Co-expression analysis for combinations of cell-specific genes that were not represented in the binarized ISH data set. (a,b) Digital overlay of averaged ISH images of 48 hpf P. dumerilii larvae (image registration and average pattern calculations were performed on 3–6 animals per gene14) showing the co-expression of Gsx and Tubby with Coe (a,b). (c) Visualization of the mapping result for the respective cell (C2x41.1L). Labeling scheme as in Figure 2. In addition, the mapping confidence level is indicated for each sample. (d–h) Comparison of averaged ISH overlay images and dual ISH on individual P. dumerilii larvae. Dual ISH on 48 hpf P. dumerilii larvae showing cells co-expressing Proenkephalin and ER81 (e) and Proenkephalin and Lhx3 (h), undetected in both the averaged ISH images (d,g, respectively) and the binarized reference matrix. Colocalization of genes is shown in white. (f) The position of the cell (C4x38.1S) indicated by spatial mapping corresponds to the position of the cells co-expressing the genes analyzed by ISH. The outline of P. dumerilii brain is drawn with dashed line. White arrows point to the location of co-expressing cells. Scale bar, 50 μm.
First, our WMISH database used averaged expression patterns, which can lead to both false ‘presence’ and ‘absence’ calls in the reference matrix, especially for genes with variable expression across individuals. Indeed, in 13 cells where one of the four most specific genes was never co-expressed in the same domain as the remaining three genes, we observed that overlaying the averaged, nonbinarized ISH images revealed areas of co-expression (Fig. 3a–c and Supplementary Fig. 6). Altering the binarization threshold can overcome this problem and improve the reference.
Second, imperfections in our WMISH database, such as missing expression domains due to probe design, low gene expression levels in particular cells or insufficient signal development, can also lead to misannotation of a gene expression value. Illustrating this, we chose four additional cells where one of the top four most-specific genes was not co-expressed with any of the other three most-specific genes and where the mismatch was not explained by overlaying the nonbinarized WMISH patterns. In all four cases we performed new dual ISHs between the mismatch gene and at least one of the remaining highly specific genes. The domains of dual ISH co-labeling overlapped the locations indicated by the spatial mapping in all cases (Fig. 3 and data not shown), affirming the initial mapping.
Finally, scRNA sequencing is susceptible to substantially more technical noise than bulk sequencing approaches19. It is possible that such biases might lead to a disproportionately large number of reads being associated with a particular gene in a given cell and, consequently, a high specificity score. As the quality of scRNA-seq data improves, this will become less of a problem.
Nevertheless, we identified the probable loci of origin for 81% of cells with high or medium confidence, suggesting that our approach is robust to technical challenges.
Validation using reference-independent marker genes
To validate the mapping, we selected four genes expressed in a small number of voxels (each gene expressed in <2% of voxels) that were expressed specifically in few cells (specificity score > 4 in each cell). We removed each gene, in turn, from the reference and compared the mapping results obtained using the reduced reference with those generated with the full atlas (Fig. 4).

(a–d) Comparison of the mapping success before and after a highly specific marker gene is removed from the reference. For each gene, we considered cells showing specific expression of that gene in the scRNA-seq data (specificity score > 4). From these cells, we assessed the number of successfully mapped cells against the full reference atlas (blue bar) and after removing the respective gene from the reference (yellow bar). The expression pattern of the gene is shown on the right (WMISH). Scale bar, 50 μm. One example of the mapping result (corresponding voxels in red) against the full reference (ref: full) and the reference lacking the respective gene (ref: removed, gene indicated in the top right corner) is shown for each case.
For each cell in which the gene of interest was specifically expressed, we considered mapping successful when there was statistically significant overlap (Fisher Exact Test; P-values were corrected for multiple testing using the Benjamini-Hochberg approach; significance threshold = 0.05) between the voxels to which it was mapped back and the expression domain of the selected marker gene (Supplementary Table 3). Of the 17 cells tested, 14 displayed concordant results with both references (13/14 of these cells were mapped back to domains that showed statistically significant overlap with the relevant marker gene; for 1 of the 14 cells, no significant overlap was observed when either reference was used). For the remaining three cells, one was marginally significant when the full reference was used but showed a statistically insignificant overlap when the reduced reference was employed. The final two cells were not mapped back to voxels expressing the gene of interest only when the reduced reference was used. However, in both cases, closer inspection of the reference atlas revealed weak expression of the respective gene in the areas matching the predicted position of these unsuccessfully mapped cells (data not shown).
Our approach provides a tool for identifying genes co-expressed with known markers, thus revealing new biological insights. To demonstrate this, we registered new WMISH patterns for three genes that were expressed in a subset of cells in the scRNA-seq data set, which suggests they each have a spatially restricted expression pattern. We then assessed whether the expression domain of each marker conforms to the spatial mapping. We found that Ten3 (Supplementary Fig. 7c,d), Cux1/2 (Supplementary Fig. 7g,h,l) and Fezf (Supplementary Fig. 7k,l) were each co-expressed with known reference genes in the locations indicated by spatial mapping (Supplementary Fig. 7a,e,i, white arrows). In all cases, combination with the new marker defined the location even more precisely than the known genes. Thus, new marker genes identified from the scRNA-seq experiment independently validated the spatial mapping and could be used to further refine the reference atlas.
These validations strongly support the quality of our mapping approach and demonstrate how it can be used to exploit a relatively small, spatially referenced in situ atlas alongside scRNA-seq to identify new marker genes that can form the basis of downstream studies.
Discussion
In this manuscript, we developed a computational approach that combines a spatially referenced ISH atlas with single-cell transcriptome profiles generated using scRNA-seq to map each cell back to the tissue under study. We demonstrated the utility of our approach using cells taken from the brain of the marine annelid, P. dumerilii, at 48 hpf. Profiling over 7% of cells in its brain, we observed that 81% of cells were mapped back to a relatively precise location. We validated our results both computationally and using ISH for genes that displayed variability in expression in the scRNA-seq data.
Recently, alternative approaches for profiling the transcriptomes of spatially referenced cells have been proposed5,20. Transcriptome in vivo analysis (TIVA)20 allows individual cells to be fluorescently labeled within a tissue, visualized and then sequenced after capture. In practice, this is extremely useful when a particular cell, or small number of cells, is of interest. However, the throughput of this approach is potentially limited by the manual photoactivation and picking steps and also the number of tags that can be employed simultaneously.
By contrast, fluorescent in situ RNA-seq (FISSEQ)5 sequences individual cells in situ (i.e., directly on cells or tissue mounted on a coverslip). Such an approach can, in theory, be broadly applied, although the practical challenges are substantial. Moreover, only cells that are relatively close to one another can be assayed in the same experiment.
Our approach is complementary to these experimental strategies. Fundamentally, we do not aim to maintain the tissue structure through the experimental process, but aim to recover this structure post hoc by combining the scRNA-seq data with a pre-existing spatially referenced ISH atlas. Unlike TIVA, we do not need to label cells a priori and, unlike FISSEQ, we can assay cells from across a relatively large tissue simultaneously. However, the spatial origin of the cells assayed by TIVA and FISSEQ can be determined unambiguously, which may have advantages in certain circumstances.
From a computational perspective, our method could be extended in a number of ways. First, instead of using a binarized threshold for determining whether a gene is expressed from the ISH data, we could treat the reflection data for each gene as a continuous variable. Second, the in situ data used in our study have a very high resolution, with 11–174 voxels making up a typical cell. As discussed below this is somewhat atypical, with most resources having substantially lower resolution. Nevertheless, when such high-resolution information exists, one option is to first build a cellular model and to map each cell back to this new atlas. Finally, our method penalizes mismatches when a gene is expressed in the scRNA-seq data and not in the reference atlas. This is justified by noting that current scRNA-seq protocols display a substantial degree of technical noise, meaning that calling a gene as unexpressed in a given cell is challenging19. As scRNA-seq protocols improve, a two-way penalization criterion may become more appropriate (Supplementary Note 3).
Our approach depends critically upon the quality of the reference atlas. Consequently, it is important to filter out genes with low-quality ISH patterns, because these can create co-expression domains that in reality do not exist, but can lead to false-positive mappings. In practice, this can be done using automated approaches that process and filter out low-quality images21. Additionally, the number of genes in the reference database is of high importance. In this paper we used simulations to demonstrate that, as expected, increasing the number of genes in the reference set leads to a monotonic increase in the number of cells mapped back with high confidence. However, somewhat surprisingly, we observed that the increase in the number of confidently mapped cells increased only slightly when the reference set was increased from 60 to 72 expressed genes. One important consideration when determining whether an ISH database provides a suitable reference is the information content of the genes contained therein, with genes expressed in a spatially restricted and nonoverlapping manner providing the most utility.
The precision of mapping is also affected by the resolution of the ISH atlas. Indeed, the majority of species listed in Table 1 lack a cellular resolution reference atlas. However, even without such an atlas, cells can be mapped back to small and restricted spatial domains using our method, thus facilitating important biological insights including the identification of new tissue-specific genes. Illustrating this, Satija et al.22 have developed an analogous computational approach, which they apply to assign individual cells to locations within the gastrulating zebrafish embryo using a low-resolution ISH atlas.
As with the ISH atlas, potential problems can also arise during the scRNA-seq data generation. At present, scRNA-seq is a relatively noisy technology, with only ∼20–40% of molecules being captured per cell in a typical experiment. Consequently, for genes expressed at low to moderate levels, quantification of expression is challenging. Moreover, some technologies require that cells fall within a specific size window before processing and sequencing. This might result in under-representation of particular cell types, thus seriously affecting the utility of approaches such as that described herein. The use of microwell plates and droplet technology, as well as protocol improvements, promise to overcome these limitations.
Methods
Single cell dissociation and capture protocol.
P. dumerilii larvae were incubated in filtered natural seawater (FNSW), at 18 °C for 47 h to reach the desired stage. For single-cell dissociation, 80–100 47 hpf larvae were picked, washed in Ca- and Mg-free artificial sea water (CMF-SW) and incubated for 5 min in 0.5% Pronase (Roche cat # 10165921001), 1% sodium thioglycolate (Sigma T0632) in CMF-SW. After this treatment, the trunks and epispheres separated. 50–80 epispheres were randomly picked, rinsed in 1:1 FNSW:1× PBS, followed by 1× PBS, and incubated for 1 min in 150 μg/ml Liberase (Roche, cat # 05401119001) in 1× PBS. Epispheres were rinsed in 1× PBS twice, transferred to a nonstick Eppendorf tube and triturated by pipetting. Dissociated cells were washed twice in 200 μl of 1× PBS and concentrated by centrifuging (1 min, 200g). Cells were resuspended in 20 μl of 1× PBS, of which 5–15 μl was loaded on the capture chip (Fluidigm cat # 100-5760).
Cell capture, lysis, reverse transcription and cDNA amplification were performed on the C1 IFC for mRNA-seq (10–17 μm ‘chip’, Fluidigm cat # 100-5760) on Fluidigm C1 Single-Cell Auto Prep System.
Following the company's recommendation, we used SMARTer Ultra Low Input RNA Kit for on-chip reverse transcription and the ADVANTAGE-2 PCR kit (Clontech cat # 634832) for on-chip PCR. We added 1 μl of 1:4,000 dilution of ERCC spike-in RNA (Ambion, cat # 4456740) to the C1 lysis mix; this concentration equals 1 μl of 1:800,000 dilution per cell. Sequencing libraries were prepared using the Nextera XT DNA Sample Preparation kit (Illumina cat # FC-131-1096) and 100 bp paired-end sequences were generated using the Illumina HiSeq2000 platform.
Mapping and quantitation of next-generation sequencing data.
We used bowtie2 (ref. 24) to map the raw sequencing reads to the P. dumerilii reference transcriptome (http://4dx.embl.de/arendt/publicdata/Publicdata.html). Expression counts for each gene were obtained using HTSeq1 (refs. 25,26), and normalized by the total number of reads mapped to the transcriptome in order to account for sequencing depth (tpm). For the spatial mapping, we limited our gene expression data set to a curated set of 169 genes that had spatial expression information in the reference ISH database. Of these, we further excluded 71 expression patterns that had previously been shown to be of moderate to poor quality17, leaving a final set of 98 reference genes in our ISH set. The raw count data for this gene set in all cells are provided in Supplementary Table 4.
Sequences of the reference genes in P. dumerilii WMISH atlas.
Nucleotide sequences for the genes included in the P. dumerilii WMISH reference atlas used in this study are provided as Supplementary Sequences. Gene sequences were obtained from the following sources: previous publications: WntA (ref. 27), rOpsin, Six1/2, Pax6 (ref. 28); Rx12; DHE3.R30 (P. dumerilii EST IB0AAA32CF06EM1), Dll, GLT, NK21, Tubby (P. dumerilii EST IB0AAA40DH05EM1)29; Hb80 (ref. 30); ChAT, Chx10, Dbx, Gsx, Islet, Lhx2, Sim, VAChT31; Otp, Phc2, Syt, Vax13; Ngn32; FVRI, FVRIamide33, Prox1, Sox2 (ref. 34); miR.277, miR.7 (ref. 35); Gli36; Ascl, BF1 (Foxg1), Brn124, COE, Dach, Emx, ER81.H85.H86, Ets3.H71, Svp, Tll (Tlx), TrpHyd, Wnt5, Wnt8 (ref. 14); Trp2 (Steinmetz et al.37); DLamide; FLamide, FVMamide, FVamide, HIGA, LYamide, NPY (NPY4), RYamide, SPY, WLD, YFamide38; RGWamide39; VWamide (MIP)40, Pax258 (ref. 41); rOpsin3 (ref. 15); Proenkephalin42; FGFR, GBRL2.Y85, KLF.H38, Tektin.2.R68 (ref. 16); Bsx, Not43; NCBI nucleotide database: Dpn.H35 (HES3, GenBank KC999041), HIGA (GenBank KF515947), Otx (GenBank AJ278856), MLDneuropeptide (GenBank KF515945), NGEWneuropeptide (GenBank KF515948); Arendt lab P. dumerilii EST sequencing library: CALM.R29 (EST IB0AAA31DB02EM1), cpa (EST IB0AAA35BD12FM1), Dek.H2 (EST IB0AAA15CC12EM1), HEN1.Y61 (EST IB0AAA56YF10EM1), LDB3.R10 (EST IB0AAA19CC08EM1), MyoD.H29 (EST IB0AAA28CH12EM1), p53.63.73.like.H45 (EST IB0AAA34AG01EM1), PRVA-Y49 (Parvalbumin-alpha, EST IB0AAA53YF24FM1), Tekitin.3.R7 (EST IB0AAA18BD02EM1), Tolloid.Y68 (EST IB0AAA57YH01EM1), ZFAT.like.H97 (EST IB0AAA37DA10EM1); Lhx3 (provided by Kristin Tessmar-Raible), Pnr (provided by Maria Antonietta Tosches), Eya and Sepiapterin reductase (provided by Keren Guy).
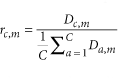
Gene specificity.
Given the set of 98 reference genes and the set of cells that were sequenced, we define an C × M read count matrix, D, where Dc,m describes the normalized number of reads mapped to cell c for gene m. Subsequently, for each cell-gene combination, we define its specificity ratio, rc,m as:
The specificity scores for each gene in the quality-filtered cells are provided in Supplementary Table 5.
Computing the correspondence score.
To map back each sequenced single cell to its localization in the reference ISH data set, we developed a scoring system where we calculate the correspondence between every cell-voxel combination.
This scoring system compares the binary vector of expression provided by the WMISH data with a binarized version of the expression pattern for each cell sequenced. To binarize the expression vectors, we used a threshold of ten reads above which a gene was considered expressed.
The score  between the binary expression vector ec from single cell c and eref from voxel ref in the ISH data set is defined as:
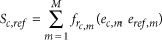
with
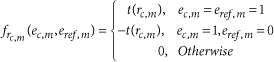
and
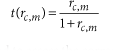
This scoring scheme is designed to assess the correspondence between a single cell and each reference voxel with regard to the specificity ratio of each gene for the considered single cell. The specificity scores are transformed to fall in the interval [0,1] following an algebraic function, t, which avoids giving too much weight to exceptionally specific genes and quickly reduces the weight of nonspecific genes that may hinder the precision of the mapping.
The correspondence scores for each cell-voxel combination in the quality-filtered cells are provided in Supplementary Table 6.
The method presented above penalizes only mismatches when the gene is expressed in the RNA-seq data and not in the reference atlas (one-way penalization). It is possible to penalize similarly mismatches that arise when a gene is not found to be expressed by the RNA-seq but expressed in the reference atlas (two-way penalization) as detailed in Supplementary Note 3 and Supplementary Table 7. The one-way penalization is justified by noting that current scRNA-seq protocols display a substantial degree of technical noise, meaning that accurately calling a gene as unexpressed in a given cell is challenging.
Selecting the score threshold based on simulated data.
For a single cell c, once the scores against every voxel in the reference data set are computed and sorted, we need to define a score threshold above which we consider the voxels as the potential area where the single cell came from.
To find this threshold, we conducted a simulation study by generating 13,900 (100 per sequenced cell) random “simulated single cells.” Each simulated single cell is created by randomly shuffling the specificity scores for all genes in each sequenced cell.
We then apply the mapping method to this set of randomly generated samples and summarize the results for different thresholds. Supplementary Figure 3 shows the proportion of simulated cells with at least n voxels (x axis) above a certain threshold (different lines on the plot). From this null distribution, we chose three different thresholds corresponding to different levels of confidence in the mapping. (i) High confidence mapping for cells that have at least 21 voxels scoring higher than 1.5. The probability of a simulated cell mapping back with the same criteria is less than 10%. (ii) Medium confidence mapping for cells with at least 16 voxels scoring higher than 0.5. The probability of a simulated cell mapping back with these criteria is less than 30%. (iii) Low confidence mapping for cells that have at least 11 voxels scoring higher than 0. For these cells, the mapping can be considered as providing a strong hypothesis about the location of these cells, although the confidence in the mapping is relatively low (<50% of obtaining such a result by chance in the null set). For comparison, Supplementary Figure 4 shows the same proportion plot for different thresholds but for the sequenced cells.
R scripts for the analysis.
Curated R scripts and example analysis workflows for the computation of gene specificity ratios, correspondence scores and the thresholds for confidence values are provided as Supplementary Scripts. Alternatively, the scripts can be found at GitHub (https://github.com/jbogp/nbt_spatial_backmapping).
In situ hybridization, imaging and image registration.
In situ hybridization (ISH) and dual ISH on 48 hpf P. dumerilii larvae was performed as described previously44. All the colocalization patterns shown were replicated in at least four animals.
The P. dumerilii genes analyzed by ISH were: ER81 (ref. 14), Fezf16, Lhx3 (produced by K. Tessmar-Raible), Proe42, Cux1/2 and Ten3. For the synthesis of mRNA probes against Proe, Cux1/2 and Ten3, wild-type P. dumerilii RNA was reverse transcribed using SuperScriptIII reverse transcriptase (Life Technologies, cat. # 18080044), and amplified by PCR using TaKaRa ExTaq DNA polymerase (Clontech, cat. # RR001A) and the following gene specific primers:
Proe (5′-CATTTGCAAGTTCCGAGGTT-3′ and 5′-GCTTGTCACTGGTTGGTTCC-3′),
Cux1/2 (5′-CTGCCCTTGAAGAGGAGTTG-3′and 5′-GACTCCAACGGTTCGATGAT-3′),
Ten3 (5′-ATCTGTAAGCCAGGCTGGAA-3′ and 5′-GGTCGCAAGTGACCGTTTAT-3′).
The resulting PCR fragments were cloned into pCRII-TOPO vector (Life Technologies, cat # K4610-20). For the synthesis of ISH probes, cDNA plasmids were linearized and antisense RNA probes were transcribed using SP6 or T7 RNA polymerase (Roche, cat. #11487671001 and 10881775001, respectively) and DIG RNA-labeling mix (Roche, cat. #11277073910)Top of FormBottom of Form or Fluorescein RNA labeling mix (Roche, cat. # 11685619910).
For imaging of ISH samples, samples were mounted in 97% 2,2′-thiodiethanol (Sigma, cat. # 166782) and imaged on Leica TCS SP8 confocal microscope, using a combination of fluorescence and reflection45 microscopy. The colocalization analyses and image post-processing was performed using Fiji46 software. The figure panels were compiled using Adobe Illustrator and Adobe Photoshop software. Image registration and gene expression averaging was performed as previously described47.
Accession codes.
Raw sequencing data are available from ArrayExpress, accession number E-MTAB-2865.
References
Jaitin, D.A. et al. Massively parallel single-cell RNA-seq for marker-free decomposition of tissues into cell types. Science 343, 776–779 (2014).
Tan, S.J. et al. A microfluidic device for preparing next generation DNA sequencing libraries and for automating other laboratory protocols that require one or more column chromatography steps. PLoS ONE 8, e64084 (2013).
Shapiro, E., Biezuner, T. & Linnarsson, S. Single-cell sequencing-based technologies will revolutionize whole-organism science. Nat. Rev. Genet. 14, 618–630 (2013).
Battich, N., Stoeger, T. & Pelkmans, L. Image-based transcriptomics in thousands of single human cells at single-molecule resolution. Nat. Methods 10, 1127–1133 (2013).
Lee, J.H. et al. Highly multiplexed subcellular RNA sequencing in situ. Science 343, 1360–1363 (2014).
Durruthy-Durruthy, R. et al. Reconstruction of the mouse otocyst and early neuroblast lineage at single-cell resolution. Cell 157, 964–978 (2014).
Garcia-Solache, M., Jaeger, J. & Akam, M. A systematic analysis of the gap gene system in the moth midge Clogmia albipunctata. Dev. Biol. 344, 306–318 (2010).
Biffar, L. & Stollewerk, A. Conservation and evolutionary modifications of neuroblast expression patterns in insects. Dev. Biol. 388, 103–116 (2014).
Pani, A.M. et al. Ancient deuterostome origins of vertebrate brain signalling centres. Nature 483, 289–294 (2012).
Ferrier, D.E. Evolutionary crossroads in developmental biology: annelids. Development 139, 2643–2653 (2012).
Arendt, D. The evolution of cell types in animals: emerging principles from molecular studies. Nat. Rev. Genet. 9, 868–882 (2008).
Arendt, D., Tessmar-Raible, K., Snyman, H., Dorresteijn, A.W. & Wittbrodt, J. Ciliary photoreceptors with a vertebrate-type opsin in an invertebrate brain. Science 306, 869–871 (2004).
Tessmar-Raible, K. et al. Conserved sensory-neurosecretory cell types in annelid and fish forebrain: insights into hypothalamus evolution. Cell 129, 1389–1400 (2007).
Tomer, R., Denes, A.S., Tessmar-Raible, K. & Arendt, D. Profiling by image registration reveals common origin of annelid mushroom bodies and vertebrate pallium. Cell 142, 800–809 (2010).
Randel, N., Bezares-Calderon, L.A., Guhmann, M., Shahidi, R. & Jekely, G. Expression dynamics and protein localization of rhabdomeric opsins in Platynereis larvae. Integr. Comp. Biol. 53, 7–16 (2013).
Marlow, H. et al. Larval body patterning and apical organs are conserved in animal evolution. BMC Biol. 12, 7 (2014).
Pettit, J.B. et al. Identifying cell types from spatially referenced single-cell expression datasets. PLOS Comput. Biol. 10, e1003824 (2014).
Jiang, L. et al. Synthetic spike-in standards for RNA-seq experiments. Genome Res. 21, 1543–1551 (2011).
Stegle, O., Teichmann, S.A. & Marioni, J.C. Computational and analytical challenges in single-cell transcriptomics. Nat. Rev. Genet. 16, 133–145 (2015).
Lovatt, D. et al. Transcriptome in vivo analysis (TIVA) of spatially defined single cells in live tissue. Nat. Methods 11, 190–196 (2014).
Puniyani, K., Faloutsos, C. & Xing, E.P. SPEX2: automated concise extraction of spatial gene expression patterns from Fly embryo ISH images. Bioinformatics 26, i47–i56 (2010).
Satija, R., Farrell, J.A., Gennert, D., Schier, A.F. & Regev, A. Spatial reconstruction of single-cell gene expression data. Nat. Biotechnol. 33, doi:10.1038/nbt.3192 (14 April 2015).
Grange, P. et al. Cell-type-based model explaining coexpression patterns of genes in the brain. Proc. Natl. Acad. Sci. USA 111, 5397–5402 (2014).
Langmead, B. & Salzberg, S.L. Fast gapped-read alignment with Bowtie 2. Nat. Methods 9, 357–359 (2012).
Anders, S., Pyl, P.T. & Huber, W. HTSeq - A Python framework to work with high-throughput sequencing data. Bioinformatics 31, 166–169 (2015).
Fonseca, N.A., Petryszak, R., Marioni, J. & Brazma, A. iRAP - an integrated RNA-seq analysis pipeline. bioRxiv http://dx.doi.org/10.1101/005991 2014.
Prud'homme, B., Lartillot, N., Balavoine, G., Adoutte, A. & Vervoort, M. Phylogenetic analysis of the Wnt gene family. Insights from lophotrochozoan members. Curr. Biol. 12, 1395 (2002).
Arendt, D., Tessmar, K., de Campos-Baptista, M.I., Dorresteijn, A. & Wittbrodt, J. Development of pigment-cup eyes in the polychaete Platynereis dumerilii and evolutionary conservation of larval eyes in Bilateria. Development 129, 1143–1154 (2002).
Raible, F. et al. Vertebrate-type intron-rich genes in the marine annelid Platynereis dumerilii. Science 310, 1325–1326 (2005).
Kerner, P. et al. The expression of a hunchback ortholog in the polychaete annelid Platynereis dumerilii suggests an ancestral role in mesoderm development and neurogenesis. Dev. Genes Evol. 216, 821–828 (2006).
Denes, A.S. et al. Molecular architecture of annelid nerve cord supports common origin of nervous system centralization in bilateria. Cell 129, 277–288 (2007).
Simionato, E. et al. atonal- and achaete-scute-related genes in the annelid Platynereis dumerilii: insights into the evolution of neural basic-Helix-Loop-Helix genes. BMC Evol. Biol. 8, 170 (2008).
Jekely, G. et al. Mechanism of phototaxis in marine zooplankton. Nature 456, 395–399 (2008).
Kerner, P., Simionato, E., Le Gouar, M. & Vervoort, M. Orthologs of key vertebrate neural genes are expressed during neurogenesis in the annelid Platynereis dumerilii. Evol. Dev. 11, 513–524 (2009).
Christodoulou, F. et al. Ancient animal microRNAs and the evolution of tissue identity. Nature 463, 1084–1088 (2010).
Dray, N. et al. Hedgehog signaling regulates segment formation in the annelid Platynereis. Science 329, 339–342 (2010).
Steinmetz, P.R., Kostyuchenko, R.P., Fischer, A. & Arendt, D. The segmental pattern of otx, gbx, and Hox genes in the annelid Platynereis dumerilii. Evol. Dev. 13, 72–79 (2011).
Conzelmann, M. et al. Neuropeptides regulate swimming depth of Platynereis larvae. Proc. Natl. Acad. Sci. USA 108, E1174–E1183 (2011).
Conzelmann, M. & Jekely, G. Antibodies against conserved amidated neuropeptide epitopes enrich the comparative neurobiology toolbox. Evodevo 3, 23 (2012).
Conzelmann, M. et al. Conserved MIP receptor-ligand pair regulates Platynereis larval settlement. Proc. Natl. Acad. Sci. USA 110, 8224–8229 (2013).
Backfisch, B. et al. Stable transgenesis in the marine annelid Platynereis dumerilii sheds new light on photoreceptor evolution. Proc. Natl. Acad. Sci. USA 110, 193–198 (2013).
Jekely, G. Global view of the evolution and diversity of metazoan neuropeptide signaling. Proc. Natl. Acad. Sci. USA 110, 8702–8707 (2013).
Tosches, M.A., Bucher, D., Vopalensky, P. & Arendt, D. Melatonin signaling controls circadian swimming behavior in marine zooplankton. Cell 159, 46–57 (2014).
Tessmar-Raible, K., Steinmetz, P.R., Snyman, H., Hassel, M. & Arendt, D. Fluorescent two-color whole mount in situ hybridization in Platynereis dumerilii (Polychaeta, Annelida), an emerging marine molecular model for evolution and development. Biotechniques 39, 460, 462, 464 (2005).
Jekely, G. & Arendt, D. Cellular resolution expression profiling using confocal detection of NBT/BCIP precipitate by reflection microscopy. Biotechniques 42, 751–755 (2007).
Schindelin, J. et al. Fiji: an open-source platform for biological-image analysis. Nat. Methods 9, 676–682 (2012).
Asadulina, A., Panzera, A., Veraszto, C., Liebig, C. & Jekely, G. Whole-body gene expression pattern registration in Platynereis larvae. Evodevo 3, 27 (2012).
Acknowledgements
The sequencing and expression analysis of P. dumerilii EST clones was carried out by H. Snyman and R. Tomer. K. Tessmar-Raible, K. Guy and M.A. Tosches provided the sequence data and plasmids for P. dumerilii Lhx3, Sepiapterin reductase, Eya and Pnr. H. Martinez-Vergara assisted with the image registration and averaging of the WMISH signal for Ten3, Cux1/2 and Fezf. We thank the members of the Marioni and Arendt groups for helpful discussions. We also thank D. Logan, the Sanger-EBI single-cell genomics centre and the EMBL Genomics core for technical support. The work was supported by the European Molecular Biology Laboratory (J.B.P., L.R.R., K.A., T.L., D.A., J.C.M.); the EMBL International PhD Programme (J.B.P., D.G.); the EMBL Interdisciplinary Postdoc Programme under Marie Curie Actions COFUND (K.A., T.L.); the Wellcome Trust Sanger Institute (L.R.R.) and by the European Union's Seventh Framework Programme project: ERCEA-AdG-2011-294810_‘BrainEvoDevo’ to D.A.
Author information
Authors and Affiliations
Contributions
K.A. developed most experimental protocols, performed experiments, helped analyze and interpret the data and wrote the manuscript. J.-B.P. developed the computational approach, analyzed the data and helped write the manuscript. L.R.S. performed single-cell RNA-sequencing experiments. D.G. initiated the single-cell work in Platynereis, developed the protocol for dissociating cells from the P. dumerilii brain and tested single-cell RNA sequencing protocols. T.L. generated the reference transcriptome and analyzed gene expression. D.A. conceived the project, supervised the study and helped write the manuscript. J.C.M. conceived the project, supervised the study and wrote the manuscript.
Corresponding authors
Ethics declarations
Competing interests
The authors declare no competing financial interests.
Integrated supplementary information
Supplementary Figure 1 Quality filtering of the scRNA-seq samples.
The quality of the scRNAseq data was evaluated by calculating the proportion of reads derived from the synthetic spike-in sequences (ERCC) or from the P. dumerilii transcriptome. (a) Percentage of reads mapping to the ERCC spike-in sequences (y-axis) plotted against the percentage of reads mapping to the reference transcriptome in each single-cell sequencing library (x-axis). (b) Percentage of reads mapping to the ERCC spike-in sequences (y-axis) plotted against the total number of reads in the sequencing library (x-axis). Dashed lines mark the quality filtering thresholds (10% of reads mapped to ERCC; 10% of reads mapped to P.dumerilii transcriptome). Box in the bottom right of (a) panel encloses samples satisfying both quality criteria. Sample categories (listed in Supplementary Table 1) are indicated in colours: yellow data points, no cell detected; red, dead cell; grey, small cell (ca 8-10 µm in diameter); blue, medium-sized cell (ca 10-15 µm); cyan, large cell (>15 µm); yellow, single, dead, cell; black, multiple cells captured.
Supplementary Figure 2 Comparison between the proportion of voxels in which a gene is expressed in the reference atlas and the corresponding proportion of cells in the scRNA-seq data.
A boxplot comparing the difference between the proportion of single cells in which a gene is expressed from the scRNA-seq data and the proportion of voxels in the WMISH atlas in which a gene is expressed is shown. For most genes, the difference is close to 0, indicating good agreement between the two data sources. A small number of outlying genes are noticeably more expressed in the scRNA-seq data than the WMISH experiments (outliers towards the right hand side of the distribution). The Spearman correlation between the proportions is shown and deviates significantly from 0 (Spearman Rank Test).
Supplementary Figure 3 Summary of simulation results at different thresholds.
For each of the 139 sequenced cells, we generated 100 simulated cells by shuffling the specificity score vector. The resulting 13,900 simulated cells were mapped back to the reference gene atlas. We present here the proportion of simulated cells having at least n (x axis) voxels scoring higher than a variety of thresholds (indicated above the curves). This null distribution of scores allows us to choose the threshold and n combinations representing the different confidence levels in the mapping. The high confidence threshold (score >= 1.5, n>= 21) corresponds to a probability of < 10% by chance, the medium confidence threshold (score >= 0.5, n >= 16) corresponds to a probability of < 30% by chance, the low confidence threshold (score >= 0, n >= 11) corresponds to a probability of < 50% by chance.
Supplementary Figure 4 Summary of true cell mapping results at different thresholds.
Similarly to Supplementary Figure 3, we present here the proportion of sequenced cells having at least n (x axis) voxels scoring higher than a variety of thresholds (indicated above the curves). Compared to the results on simulated data, this plot shows a clear enrichment in the proportion of cells scoring higher than all of the thresholds.
Supplementary Figure 5 Cumulative distribution of the locations to which cells are mapped back.
In grey is shown the background location of voxels in the brain. No cells were mapped to the grey voxels. Note that these areas contain large cells that were not captured in our experimental setup (ventral domains) and the central area that suffered most from imaging artefacts and thus were poorly covered in the WMISH atlas.
Supplementary Figure 6 Validation of co-expressed genes in the scRNAseq data.
Co-expression analysis was performed for combinations of genes that were co-expressed in scRNAseq data but not represented in the binarized ISH dataset. For each cell, corresponding voxels indicated by spatial mapping is shown on the left (Mapping result), followed by the visualization of combined expression of the considered genes in the binarized spatial reference (gray voxels, none of the genes expressed, blue voxels, at least one of the gens expressed, red voxels, all considered genes expressed, the considered genes are listed on figure), and pairwise WMISH analysis of the respective genes. White arrows point to the location of co-expressing cells. (a-d) presents the data shown in Figure 3 alongside with the visualization of the expression of Coe, Tubby and Gsx in the binarized reference. (e-h) For the cell C2x46.1L, we detected one voxel co-expressing Ascl, YFamide and HEN1 (f, upper arrow). Digital overlay of averaged ISH images of 48 hpf P.dumerilii larvae (g,h) revealed larger overlap of the respective gene pairs in the indicated locations. (i-n) Dual ISH on individual P. dumerilii larvae (l, n) for genes co-detected in cell C4x59.1S (i,j) confirmed the colocalization of the gene pairs weakly indicated by the averaged ISH overlay images (k, m).
Supplementary Figure 7 Co-expression of novel markers with known reference genes conforms with the spatial mapping.
(a, e, i) Locations of 3 cells indicated by spatial mapping. (b, f, j) Co-expression of 2 highly specifically expressed reference genes in the respective cells. Co-expression of the two markers is indicated in white. (c-d) Co-expression of Ten3 with the known reference genes presented in (b) in cell C2x40.1S. (g-h) Co-expression of Cux1/2 with the known reference genes presented in (f) in cell C5x18.1S. (k) Co-expression of Fezf with Syt in cell C5x01.1M. (l) Co-expression of two novel markers, Fezf and Cux1/2 in cell C5x01.1M. Arrows point to the mapped cell. The outline of P.dumerilii brain is drawn with dashed line.
Supplementary information
Supplementary Text and Figures
Supplementary Figures 1–7, Supplementary Table 1 and Supplementary Notes 1–3 (PDF 2062 kb)
Supplementary Table 2
Spatial mapping summary scores for the sequenced cells (TXT 6 kb)
Supplementary Table 3
Mapping success scoring table using highly specific marker genes (XLSX 36 kb)
Supplementary Table 4
RNAseq counts for the WMISH reference gene set (TXT 42 kb)
Supplementary Table 5
Specificity indices for the reference genes in single cells (TXT 47 kb)
Supplementary Table 6
Cell-voxel correspondence scores (CSV 78283 kb)
Supplementary Table 7
Spatial mapping summary scores for each sequenced cell when applying two-way penalization (TXT 6 kb)
Supplementary Sequences (Pdu_WMISH_Reference.fasta)
Sequences of the genes included in the P.dumerilii WMISH reference atlas used in this study, infasta format. (TXT 117 kb)
Supplementary Scripts
Curated R scripts and example analysis workflows (ZIP 36 kb)
Rights and permissions
About this article

Cite this article
Achim, K., Pettit, JB., Saraiva, L. et al. High-throughput spatial mapping of single-cell RNA-seq data to tissue of origin. Nat Biotechnol 33, 503–509 (2015). https://doi.org/10.1038/nbt.3209
Received:
Accepted:
Published:
Issue Date:
DOI: https://doi.org/10.1038/nbt.3209
This article is cited by
-
Transcriptomic landscape of posterior regeneration in the annelid Platynereis dumerilii
BMC Genomics (2023)
-
BdLT-Seq as a barcode decay-based method to unravel lineage-linked transcriptome plasticity
Nature Communications (2023)
-
Spatiotemporal Dynamics of the Molecular Expression Pattern and Intercellular Interactions in the Glial Scar Response to Spinal Cord Injury
Neuroscience Bulletin (2023)
-
UnMICST: Deep learning with real augmentation for robust segmentation of highly multiplexed images of human tissues
Communications Biology (2022)
-
NovoSpaRc: flexible spatial reconstruction of single-cell gene expression with optimal transport
Nature Protocols (2021)
