


Article Figures & Data
Figures
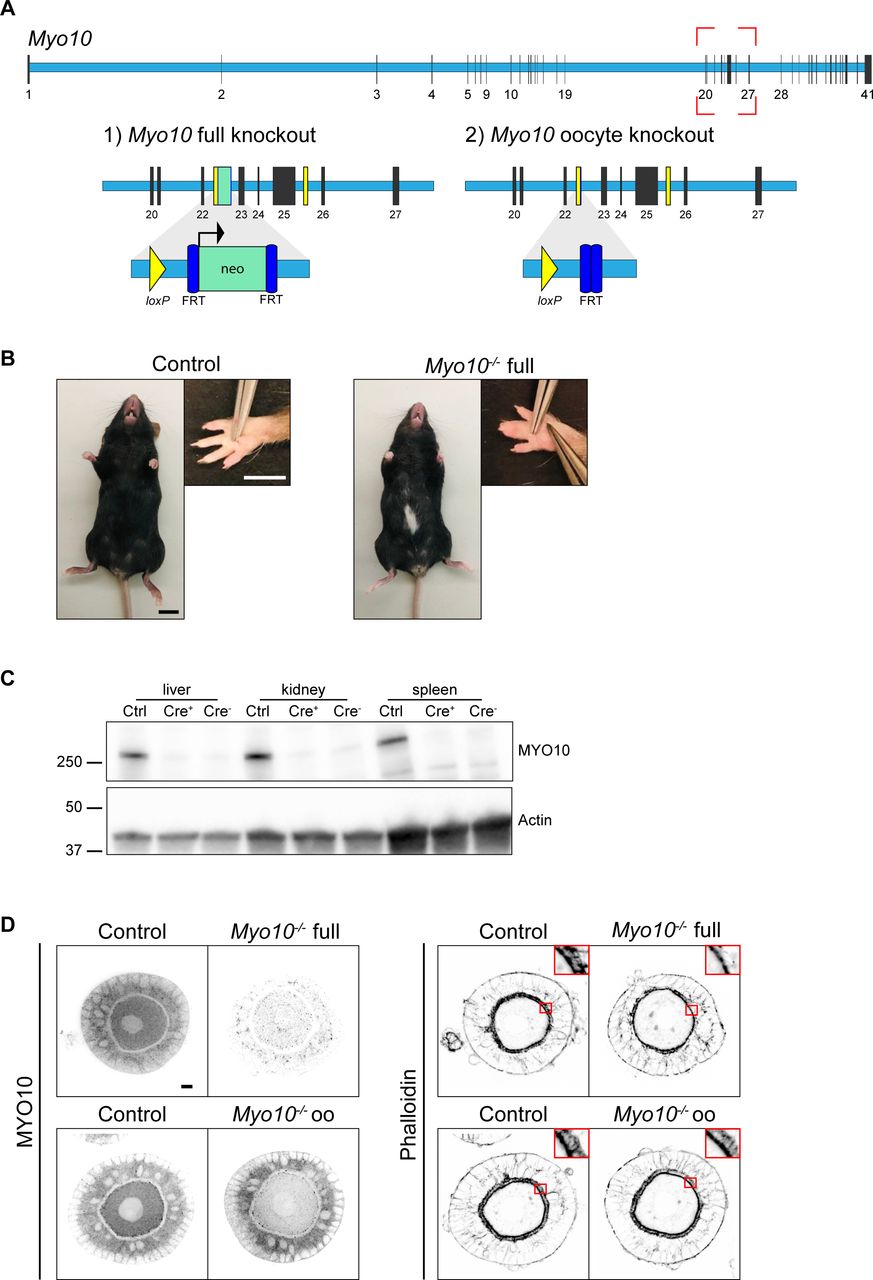
- Figure S1. Myo10 full knockout, generation, and validation.
(A) Scheme of the Myo10 gene with introns in light blue rectangles and exons in black vertical lines according to the Ensembl database. The red dotted rectangle indicates the region targeted to invalidate MYO10. (1) For Myo10 full knockout, the neomycin selection cassette (neo, green rectangle) inserted between exons 22 and 23 was retained, allowing its promoter to interfere with MYO10 expression in all cell types. (2) For Myo10 conditional knockout in oocytes, the neo cassette was removed after FLP-mediated excision at the FRT sites (dark blue rectangles). ZP3-Cre–mediated excision at the loxP sites (yellow rectangles and triangles) flanking exons 23-25 results in a premature stop codon and the absence of MYO10 in oocytes. (B) Control (left panel) and Myo10−/− full (right panel) mice of the Myo10 full knockout strain. Scale bar = 10 mm. For each panel, the image on the right shows the mouse front paw (Scale bar = 5 mm). Some phenotypes characteristic of previously described Myo10 full knockout were observed in our Myo10−/− full mice, such as a white belly spot and webbed digits. (C) Immunoblotting performed on liver, kidney, and spleen extracts from mice from the Myo10 full knockout strain. Control (Ctrl) extracts are from a Myo10wt/flox; Cre+ genotyped mouse, Cre+ extracts are from a Myo10flox/flox; Cre+ genotyped mouse, and Cre− extracts are from a Myo10flox/flox; Cre− genotyped mouse. The membrane was stained for MYO10 (upper image) and for actin (lower image) as a loading control. Indicated ladders: 37, 50, and 250 kD. (D) Preantral follicles from the Myo10 full knockout strain (upper images) and the Myo10 oocyte knockout strain (lower images). Follicles were stained for MYO10 (left panel) and with phalloidin (right panel; top corners show the magnification of the red rectangles focusing on the zona pellucida). For each panel, control follicles are on the left, and Myo10−/− follicles, on the right. For MYO10 staining, contrast adjustment is similar between follicles of the same strain. Scale bar = 10 μm.
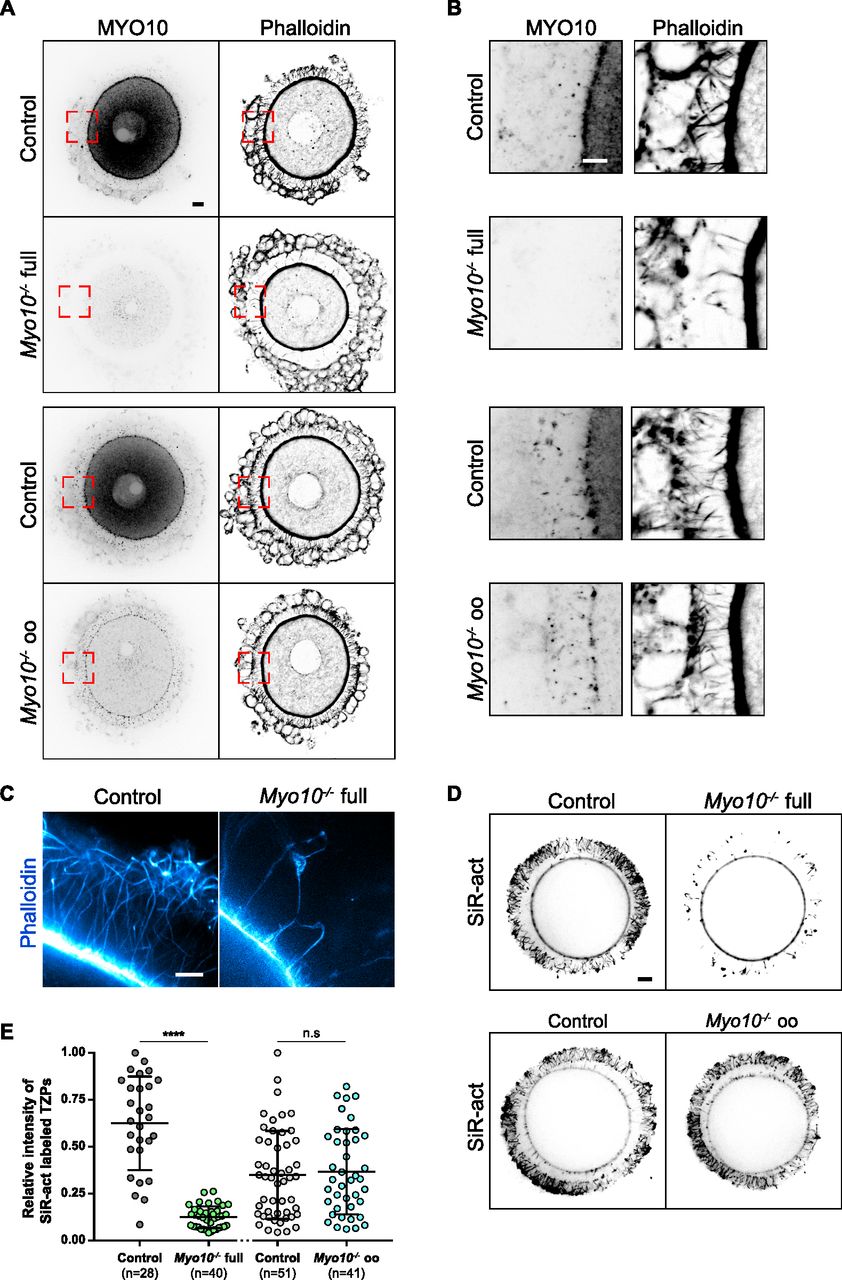
- Figure 1. Global deletion of Myo10 decreases the density of transzonal projections.
(A) Cumulus–oocyte complexes stained for myosin-X (MYO10, left images) and with phalloidin to label F-actin (right images). The upper panel shows complexes from the Myo10 full knockout strain (full), and the lower panel, complexes from the Myo10 oocyte knockout strain (oo). For each panel, control complexes are at the top, and Myo10−/− complexes, at the bottom. For MYO10 staining, contrast adjustment is similar between complexes of the same strain. Scale bar = 10 μm. (A, B) Cropped images of the red dotted rectangles shown in (A) focusing on the zona pellucida. MYO10 staining is on the left, and phalloidin, on the right. Scale bar = 5 μm. (C) STED microscopy images of phalloidin-labeled oocytes arrested in prophase freed of follicular cells, focusing on the zona pellucida of a control oocyte (left) and a Myo10−/− full oocyte (right). Scale bar = 2 μm. (D) Live fully grown oocytes arrested in prophase stained with SiR-actin to label F-actin. The upper images are oocytes from the Myo10 full knockout strain (full), and the lower images are those from Myo10 oocyte knockout strain (oo). Controls are on the left, and Myo10−/− oocytes, on the right. Scale bar = 10 μm. (E) Scatter plot of the intensity of all SiR-actin–labeled TZPs of fully grown oocytes arrested in prophase. Control and Myo10−/− full oocytes are in dark gray and green, respectively. Control and Myo10−/− oo oocytes are in light gray and blue, respectively. (n) is the number of oocytes analyzed. Data are the mean ± s.d. with individual data points plotted. Data are from three to five independent experiments. Statistical significance of differences was assessed by an ANOVA or a Kruskal–Wallis test depending on whether the data followed a Gaussian distribution, P < 0.0001 (****, Ctrl full versus Myo10−/− full), P = 0.6857 (n.s, Ctrl full versus Ctrl oo), P = 0.4479 (n.s. Ctrl full versus Myo10−/− oo), P < 0.0001 (****, Myo10−/− full versus Ctrl oo), P < 0.0001 (****, Myo10−/− full versus Myo10−/− oo), and P = 0.9722 (n.s, Ctrl oo versus Myo10−/− oo). n.s, not significant.
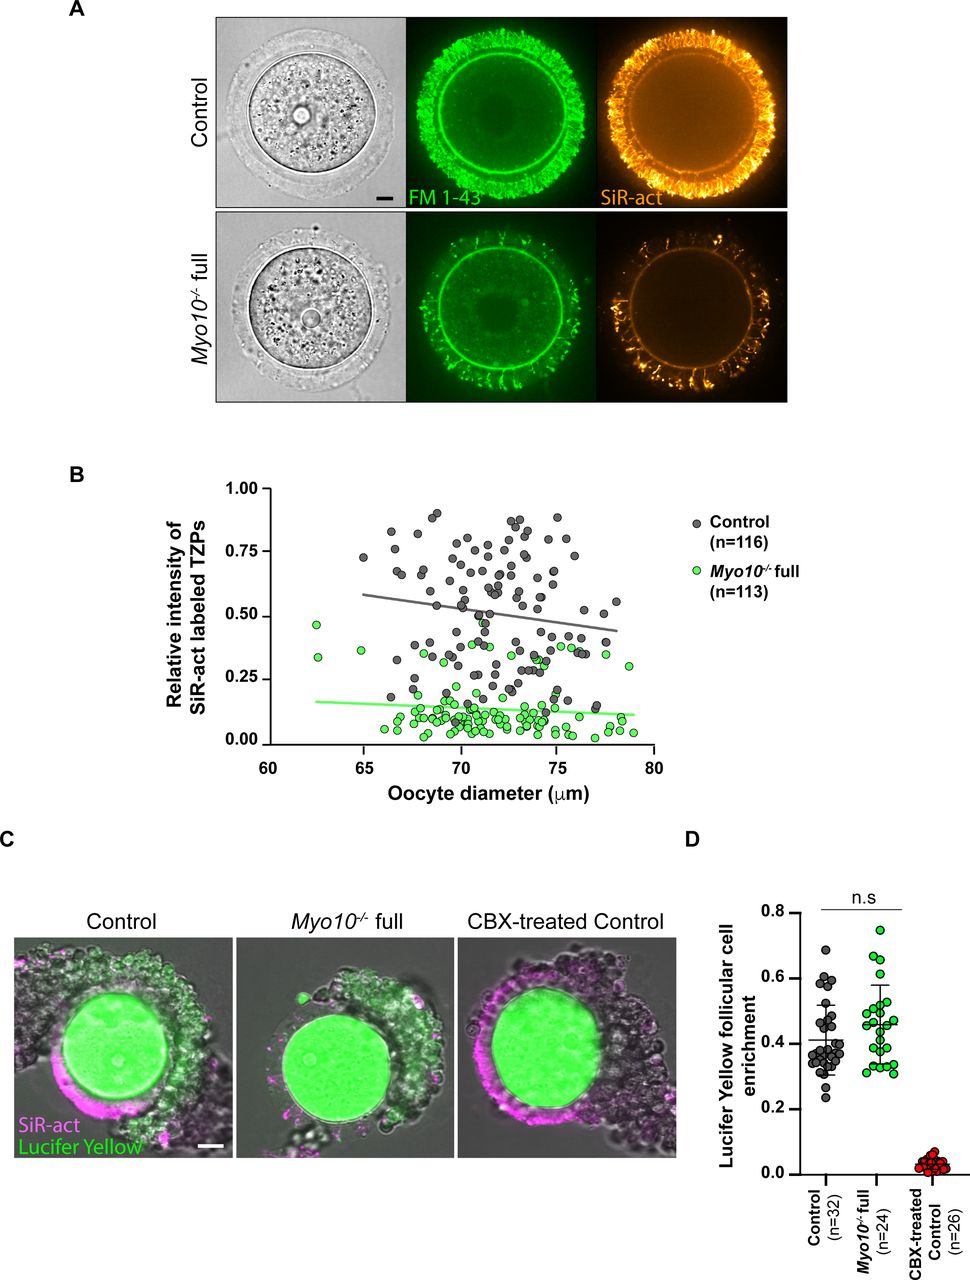
- Figure S2. Global deletion of Myo10 decreases the density of all transzonal projections.
(A) Images of fully grown control (upper panel) and Myo10−/− full (lower panel) oocytes stained with FM 1–43 (green, middle images) to label membranes and SiR-actin (SiR-act, orange, right images) to label F-actin. The left images show oocyte brightfield images. Scale bar = 10 μm. (B) Scatter plot of the intensity of all SiR-act–labeled TZPs (y-axis) versus oocyte diameter in μm (x-axis) of oocytes recovered from growing and fully grown follicles. Control and Myo10−/− full oocytes are in dark gray and green, respectively. (n) is the number of oocytes analyzed. Data are from eight independent experiments. Lines are a simple linear regression for easier visualization. (C) Control and Myo10−/− full live cumulus–oocyte complexes stained with SiR-actin (magenta) to label TZPs in which each oocyte was injected with 10% Lucifer Yellow (green). Some control cumulus–oocyte complexes were incubated for 1 h in 150 μM carbenoxolone (CBX-treated) to block gap junctions. Scale bar = 20 μm. (D) Scatter plot showing cumulus–oocyte coupling represented by the Lucifer Yellow follicular cell enrichment, quantified by the ratio of Lucifer Yellow fluorescence intensity between the follicular cell and the oocyte 30 min after Lucifer Yellow microinjection into the oocyte. Measurements were performed on cumulus–oocyte complexes when single follicular cells were visible, still connected to the oocyte by TZPs (visible with SiR-actin). Control cumulus–oocyte complexes are in dark gray; Myo10−/− full complexes, in green; and control complexes incubated for 1 h in 150 μM carbenoxolone (CBX-treated) to block gap junctions, in red. (n) is the number of single follicular cell coupling analyzed. Data are the mean ± s.d. with individual data points plotted. Data are from three independent experiments. Statistical significance of differences was assessed by an ANOVA, P = 0.1493 (n.s, Ctrl full versus Myo10−/− full), P < 0.0001 (****, Ctrl full versus CBX-treated), and P < 0.0001 (****, Myo10−/− full versus CBX-treated). n.s, not significant.
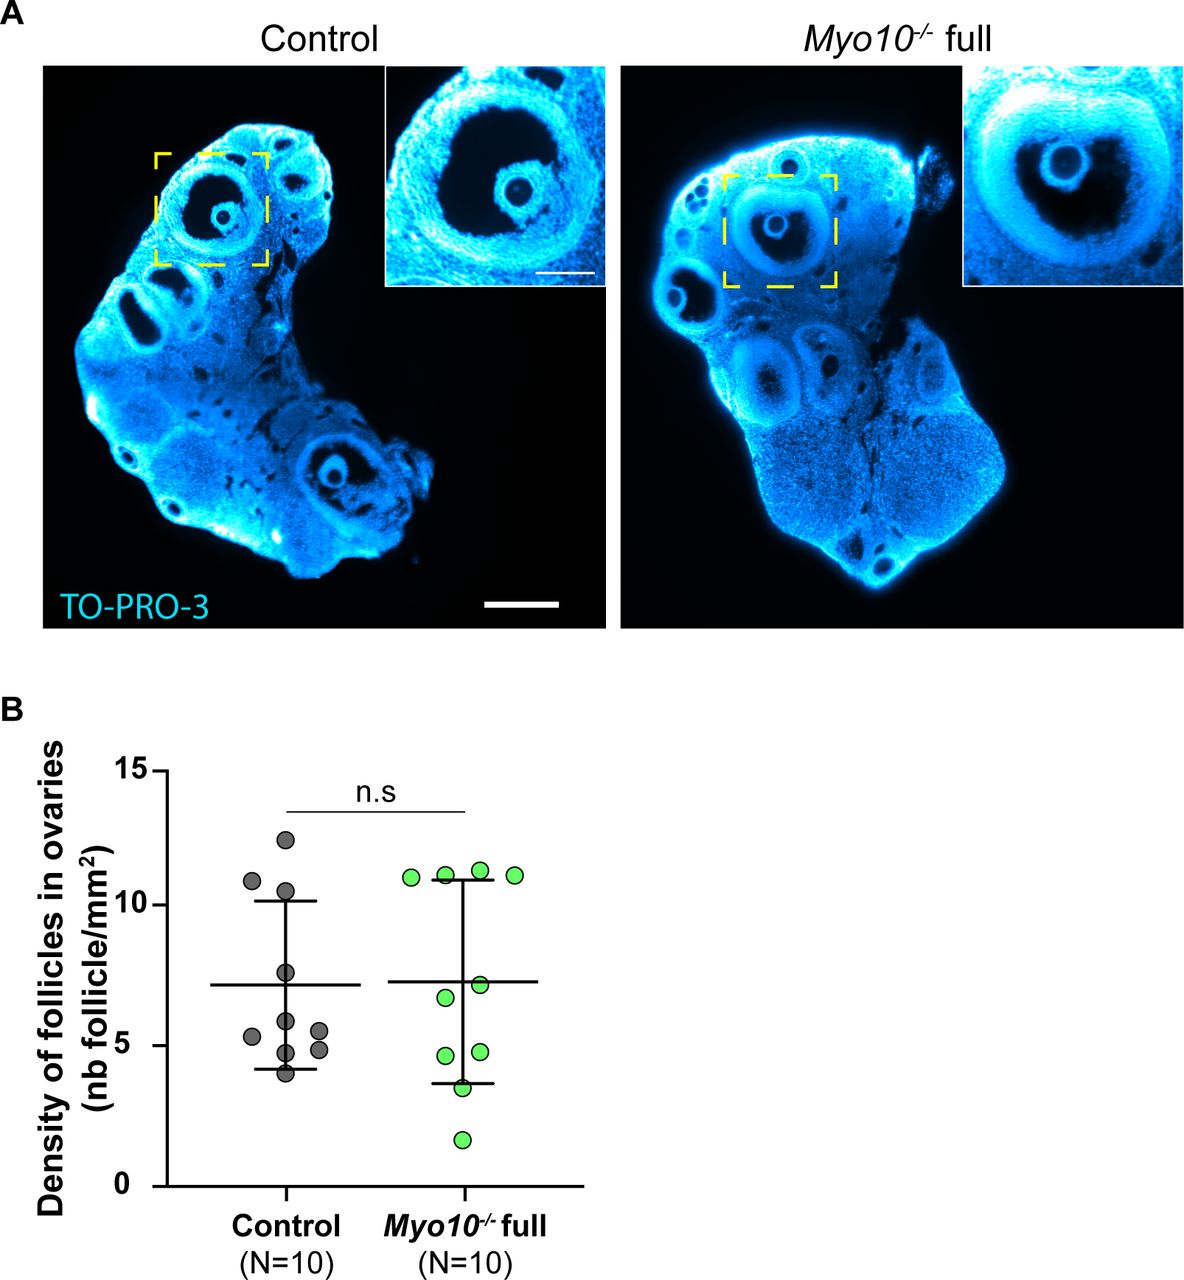
- Figure S3. Follicular density is normal in Myo10−/− full ovaries.
(A) Light-sheet fluorescence microscopy images of cleared ovaries stained with TO-PRO-3 (blue) to label nucleic acid. The control ovary is on the left, and the Myo10−/− full ovary, on the right. Scale bar = 0.25 mm. The images inserted at the top right show antral follicles from the magnification of the yellow-dotted rectangles. Scale bar = 0.1 mm. (B) Scatter plot of the density of follicles in ovaries (number of follicles per millimeter2). Control ovaries are in dark gray, and Myo10−/− full ovaries, in green. For each condition, data are from five different mice. (N) is the number of ovaries analyzed. Data are the mean ± s.d. with individual data points plotted. Statistical significance of differences was assessed by a two-tailed unpaired t test with Welch's correction, P = 0.9389. n.s, not significant.
- Figure 2. TZP-deprived oocytes have morphological alterations.
(A) Brightfield images of fully grown oocytes from the Myo10 full knockout strain (left panel) and the Myo10 oocyte knockout strain (right panel). For each panel, controls are on the left, and Myo10−/− oocytes, on the right. Scale bar = 10 μm. (B) Scatter plot of the equatorial plane area of control and Myo10−/− full oocytes (in dark gray and green, respectively) and control and Myo10−/− oo oocytes (in light gray and blue, respectively). (n) is the number of oocytes analyzed. Data are the mean ± s.d. with individual data points plotted. Data are from four to 13 independent experiments. Statistical significance of differences was assessed by an ANOVA or a Kruskal–Wallis test depending on whether the data followed a Gaussian distribution, P = 0.4459 (n.s, Ctrl full versus Myo10−/− full), P = 0.7355 (n.s, Ctrl full versus Ctrl oo), P > 0.9999 (n.s, Ctrl full versus Myo10−/− oo), P = 0.9905 (n.s, Myo10−/− full versus Ctrl oo), P > 0.9999 (n.s, Myo10−/− full versus Myo10−/− oo), and P > 0.9999 (n.s, Ctrl oo versus Myo10−/− oo). n.s, not significant. (C) Scatter plot of the zona pellucida texture of control and Myo10−/− full oocytes (in dark gray and green, respectively) and control and Myo10−/− oo oocytes (in light gray and blue, respectively). (n) is the number of oocytes analyzed. Data are the mean ± s.d. with individual data points plotted. Data are from four to 13 independent experiments. Statistical significance of differences was assessed by an ANOVA or a Kruskal–Wallis test depending on whether the data followed a Gaussian distribution, P = 0.0280 (*, Ctrl full versus Myo10−/− full), P = 0.3355 (n.s, Ctrl full versus Ctrl oo), P > 0.9999 (n.s, Ctrl full versus Myo10−/− oo), P < 0.0001 (****, Myo10−/− full versus Ctrl oo), P = 0.0083 (**, Myo10−/− full versus Myo10−/− oo), and P = 0.3895 (n.s, Ctrl oo versus Myo10−/− oo). n.s, not significant. (D) Brightfield images of a fully grown control (upper panel) and Myo10−/− full oocyte (bottom panel). For each panel, the right image displays the automatic segmentation of the oocyte perivitelline space (perivitelline space, yellow). Scale bar = 10 μm. (E) Scatter plot of the coefficient of variation of the perivitelline space thickness, as represented by the schemes on the left. Control and Myo10−/− full oocytes are in dark gray and green, respectively. Control and Myo10−/− oo oocytes are in light gray and blue, respectively. (n) is the number of oocytes analyzed. Data are the mean ± s.d. with individual data points plotted. Data are from four to 13 independent experiments. Statistical significance of differences was assessed by an ANOVA or a Kruskal–Wallis test depending on whether the data followed a Gaussian distribution, P < 0.0001 (****, Ctrl full versus Myo10−/− full), P > 0.9999 (n.s, Ctrl full versus Ctrl oo), P = 0.3139 (n.s, Ctrl full versus Myo10−/− oo), P < 0.0001 (****, Myo10−/− full versus Ctrl oo), P = 0.0103 (*, Myo10−/− full versus Myo10−/− oo), and P = 0.0811 (n.s, Ctrl oo versus Myo10−/− oo). n.s, not significant. (F) Images of the flattened zona pellucida obtained from oocyte segmentation. The top panel shows a control zona pellucida, and the lower one, a Myo10−/− full zona pellucida. For each panel, the bottom image is a magnification of the brightfield image of the zona pellucida at the top. Scale bar = 10 μm. Below each flattened zona pellucida are examples of the zona pellucida from control and Myo10−/− full oocytes. Brightfield images are on the left panels, SiR-actin (white)–labeled TZPs are on the middle panels, and merge images (SiR-actin in magenta) are on the right panels. Scale bar = 9 μm. (G) Scatter plot of the presence of vertical TZP-like structures in the zona pellucida (ZP), as represented by the schemes on the left. Control and Myo10−/− full oocytes are in dark gray and green, respectively. Control and Myo10−/− oo oocytes are in light gray and blue, respectively. (n) is the number of oocytes analyzed. Data are the mean ± s.d. with individual data points plotted. Data are from four to 13 independent experiments. Statistical significance of differences was assessed by an ANOVA or a Kruskal–Wallis test depending on whether the data followed a Gaussian distribution, P < 0.0001 (****, Ctrl full versus Myo10−/− full), P = 0.7183 (n.s, Ctrl full versus Ctrl oo), P = 0.7291 (n.s, Ctrl full versus Myo10−/− oo), P < 0.0001 (****, Myo10−/− full versus Ctrl oo), P < 0.0001 (****, Myo10−/− full versus Myo10−/− oo), and P = 0.9999 (n.s, Ctrl oo versus Myo10−/− oo). n.s, not significant.
- Figure S4. TZP-deprived oocytes have morphological differences.
(A) Scatter plot of the zona pellucida thickness of control and Myo10−/− full oocytes (in dark gray and green, respectively) and control and Myo10−/− oo oocytes (in light gray and blue, respectively). (n) is the number of oocytes analyzed. Data are the mean ± s.d. with individual data points plotted. Data are from four to 13 independent experiments. Statistical significance of differences was assessed by an ANOVA or a Kruskal–Wallis test depending on whether the data followed a Gaussian distribution, P > 0.9999 (n.s, Ctrl full versus Myo10−/− full), P = 0.0503 (n.s, Ctrl full versus Ctrl oo), P = 0.0566 (n.s, Ctrl full versus Myo10−/− oo), P = 0.0063 (**, Myo10−/− full versus Ctrl oo), P = 0.0388 (*, Myo10−/− full versus Myo10−/− oo), and P > 0.9999 (n.s, Ctrl oo versus Myo10−/− oo). n.s, not significant. (B) Scatter plot of the zona pellucida perimeter of control and Myo10−/− full oocytes (in dark gray and green, respectively) and control and Myo10−/− oo oocytes (in light gray and blue, respectively). (n) is the number of oocytes analyzed. Data are the mean ± s.d. with individual data points plotted. Data are from four to 13 independent experiments. Statistical significance of differences was assessed by an ANOVA or a Kruskal–Wallis test depending on whether the data followed a Gaussian distribution, P > 0.9999 (n.s, Ctrl full versus Myo10−/− full), P = 0.9997 (n.s, Ctrl full versus Ctrl oo), P = 0.5007 (n.s, Ctrl full versus Myo10−/− oo), P = 0.9941 (n.s, Myo10−/− full versus Ctrl oo), P = 0.9522 (n.s, Myo10−/− full versus Myo10−/− oo), and P = 0.8581 (n.s, Ctrl oo versus Myo10−/− oo). n.s, not significant. (C) Fully grown control (left panel) and Myo10−/− full (right panel) oocytes stained with SiR-DNA (blue). For each panel, the brightfield image of the oocyte is at the top, and the corresponding SiR-DNA labeling, at the bottom. Some follicular-like cells are ectopically located in the perivitelline space of the Myo10−/− full oocyte (red arrows). Scale bar = 10 μm. (D) Bar graph of the 16 most important morphological features describing oocytes used by our machine-learning algorithm to discriminate control from Myo10−/− full oocytes. Features are ranked according to their importance for oocyte classification. (E) Scatter plot of the aspect ratio (circularity) of oocytes, as represented by the schemes on the left. Control and Myo10−/− full oocytes are in dark gray and green, respectively. Control and Myo10−/− oo oocytes are in light gray and blue, respectively. (n) is the number of oocytes analyzed. Data are the mean ± s.d. with individual data points plotted. Data are from four to 13 independent experiments. Statistical significance of differences was assessed by an ANOVA or a Kruskal–Wallis test depending on whether the data followed a Gaussian distribution, P = 0.0030 (**, Ctrl full versus Myo10−/− full), P = 0.4773 (n.s, Ctrl full versus Ctrl oo), P = 0.4353 (n.s, Ctrl full versus Myo10−/− oo), P > 0.9999 (n.s, Myo10−/− full versus Ctrl oo), P > 0.9999 (n.s, Myo10−/− full versus Myo10−/− oo), and P > 0.9999 (n.s, Ctrl oo versus Myo10−/− oo). n.s, not significant. (F) Scatter plot of the perimeter of control and Myo10−/− full oocytes (in dark gray and green, respectively) and control and Myo10−/− oo oocytes (in light gray and blue, respectively). (n) is the number of oocytes analyzed. Data are the mean ± s.d. with individual data points plotted. Data are from four to 13 independent experiments. Statistical significance of differences between Myo10−/− full oocytes and control oocytes was assessed by an ANOVA or a Kruskal–Wallis test depending on whether the data followed a Gaussian distribution, P = 0.0412 (*, Ctrl full versus Myo10−/− full), P = 0.6078 (n.s, Ctrl full versus Ctrl oo), P > 0.9999 (n.s, Ctrl full versus Myo10−/− oo), P = 0.9516 (n.s, Myo10−/− full versus Ctrl oo), P > 0.9999 (n.s, Myo10−/− full versus Myo10−/− oo), and P > 0.9999 (n.s, Ctrl oo versus Myo10−/− oo). n.s, not significant. (G) Schemes summarizing the most important morphological features used by our machine-learning algorithm to discriminate a control (left image) from a Myo10−/− full oocyte (right image). (C) Features include the zona pellucida composition (vertical TZP-like structures passing through it; Fig 2F and G), heterogeneity in perivitelline space thickness (Fig 2D and E), and oocyte circularity (C). (H) Elasticity of the zona pellucida of control and Myo10−/− full oocytes, measured with atomic force microscopy (AFM). Data are the mean ± s.d. with individual data points plotted. Data are from three independent experiments. Statistical significance of differences was assessed by a two-tailed Mann–Whitney test, P = 0.0098.
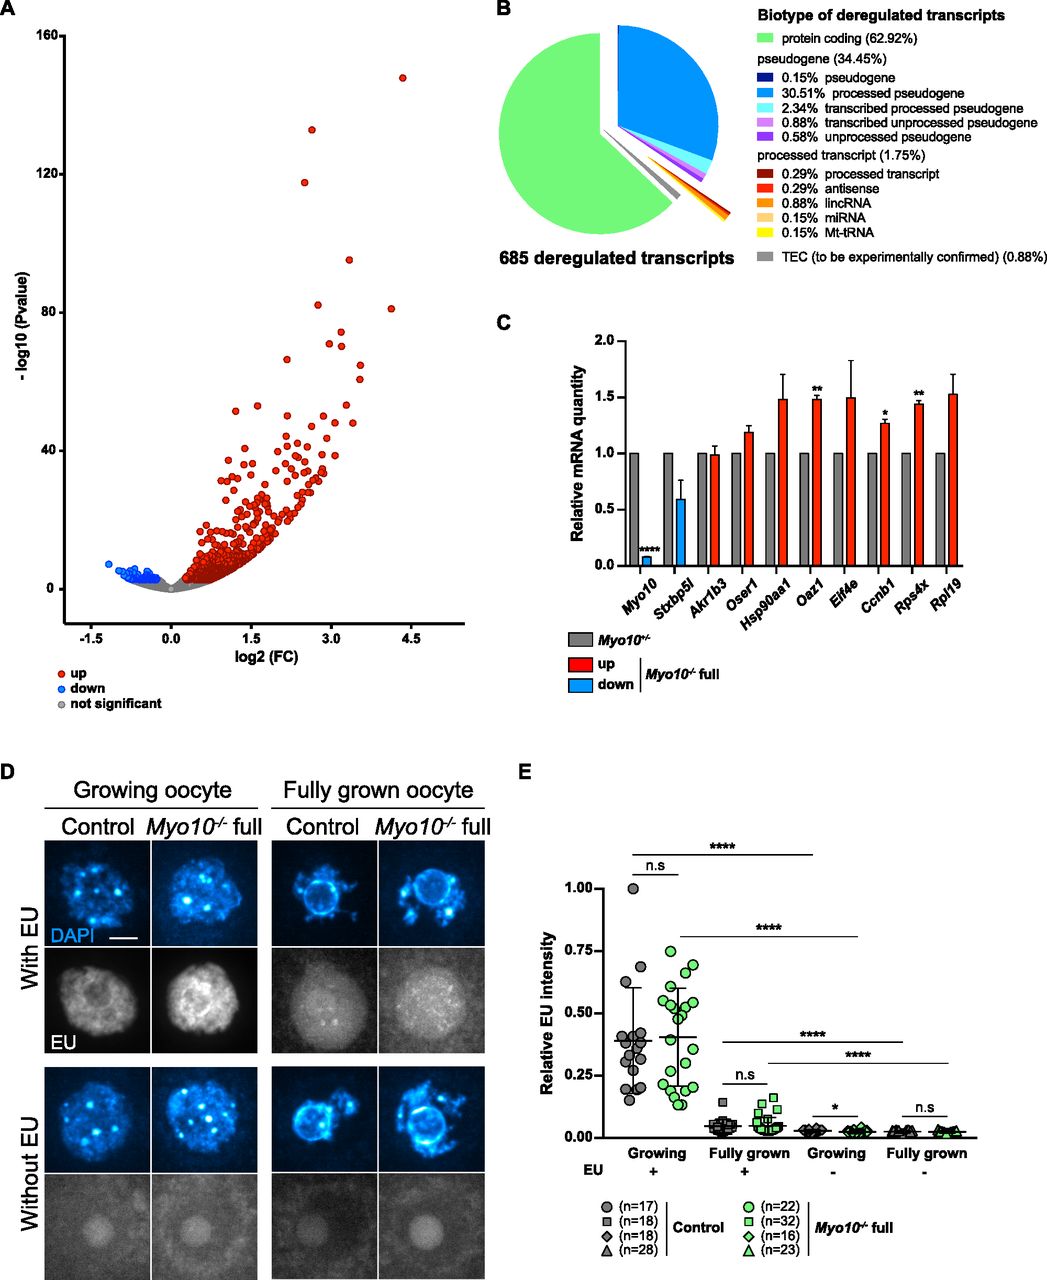
- Figure 3. Gene expression is modified in TZP-deprived oocytes.
(A) Volcano plot of differential gene expression between fully grown Myo10+/− and Myo10−/− full oocytes. Differential transcriptomic analysis was performed by RNA-Seq. Up-regulated transcripts are shown in red (up, 605 transcripts); down-regulated transcripts, in blue (down, 80 transcripts, including Myo10); and non-deregulated transcripts, in gray (not significant, 15,702 transcripts). Significance was set at P-adj < 0.05. Myo10−/− full oocytes were collected from two Myo10flox/flox; Cre+ mice and Myo10+/− oocytes from two Myo10wt/flox; Cre+ mice. For each condition, three biological replicates (each containing 10 oocytes) and three technical replicates were performed. (B) Pie chart of deregulated transcript biotypes from the RNA-Seq analysis. lincRNA: long intergenic non-coding RNAs; miRNA: microRNA precursors; Mt-tRNA: transfer RNA located in the mitochondrial genome; and TEC: to be experimentally confirmed. (C) Bar graph of the relative mRNA quantity in fully grown Myo10−/− full oocytes (colored bars) normalized to fully grown Myo10+/− oocytes (gray bars) performed by RT–qPCR. (A) Selected mRNAs were chosen based on their biological relevance and their deregulatory strength (log2[FC] and P-adj) in the RNA-Seq analysis described in (A). mRNAs indicated as up- or down-regulated by RNA-Seq analysis are shown in red and blue, respectively. Myo10−/− full oocytes were collected from Myo10flox/flox; Cre− mice and Myo10+/− oocytes from Myo10wt/flox; Cre+ mice. For each condition, two biological replicates were performed (one containing 30 oocytes and the other containing 24 oocytes) from two different mice each time and two technical replicates were performed. The SEM is shown. For each mRNA, the mean of Myo10+/− oocytes was normalized to that of Myo10+/− oocytes. The mean and the SEM for Myo10−/− full oocytes = 0.08 ± 0.004 (Myo10); 0.59 ± 0.171 (Stxbp5l); 0.99 ± 0.079 (Akr1b3); 1.19 ± 0.059 (Oser1); 1.48 ± 0.222 (Hsp90aa1); 1.48 ± 0.034 (Oaz1); 1.49 ± 0.333 (Eif4e); 1.27 ± 0.037 (Ccnb1); 1.44 ± 0.034 (Rps4x); and 1.53 ± 0.179 (Rpl19). Statistical significance of differences was assessed by two-tailed unpaired t tests, P < 0.0001 (Myo10), P = 0.1394 (Stxbp5l), P = 0.9001 (Akr1b3), P = 0.0864 (Oser1), P = 0.1612 (Hsp90aa1), P = 0.0050 (Oaz1), P = 0.2765 (Eif4e), P = 0.0180 (Ccnb1), P = 0.0060 (Rps4x), and P = 0.0987 (Rpl19). (D) Sum of Z projection images of oocytes stained with DAPI to label DNA (blue, top images of each panel) and incubated or not with 5-ethynyl uridine to label global RNA transcription (EU, bottom images of each panel). For each panel, control oocytes are on the left, and Myo10−/− full oocytes, on the right. Growing and fully grown oocytes are on the left and right panels, respectively. Oocytes incubated with or without EU are on the upper and lower panels, respectively. For EU staining, contrast adjustment is similar between all conditions except for growing oocytes incubated with EU for which the signal intensity is too high to be shown with the same adjustment as the others. Scale bar = 10 μm. (E) Scatter plot of the relative EU signal intensity normalized to the DAPI signal intensity in control (dark gray) and Myo10−/− full (green) growing or fully grown oocytes incubated or not with EU. (n) is the number of oocytes analyzed. Data are the mean ± s.d. with individual data points plotted. Data are from three to five independent experiments. Statistical significance of differences was assessed by two-tailed Mann–Whitney’s tests, P = 0.7688 (growing Myo10−/− full oocytes with EU compared to growing control oocytes with EU), P = 0.7564 (fully grown Myo10−/− full oocytes with EU compared to fully grown control oocytes with EU), P = 0.0326 (growing Myo10−/− full oocytes without EU compared to growing control oocytes without EU), P < 0.0001 (growing control oocytes with EU compared to growing control oocytes without EU), P < 0.0001 (growing Myo10−/− full oocytes with EU compared to growing Myo10−/− full oocytes without EU), P < 0.0001 (fully grown control oocytes with EU compared to fully grown control oocytes without EU), and P < 0.0001 (fully grown Myo10−/− full oocytes with EU compared to fully grown Myo10−/− full oocytes without EU). Statistical significance of differences was assessed by a two-tailed unpaired t test to compare fully grown Myo10−/− full oocytes without EU to fully grown control oocytes without EU, P = 0.2647. n.s, not significant.
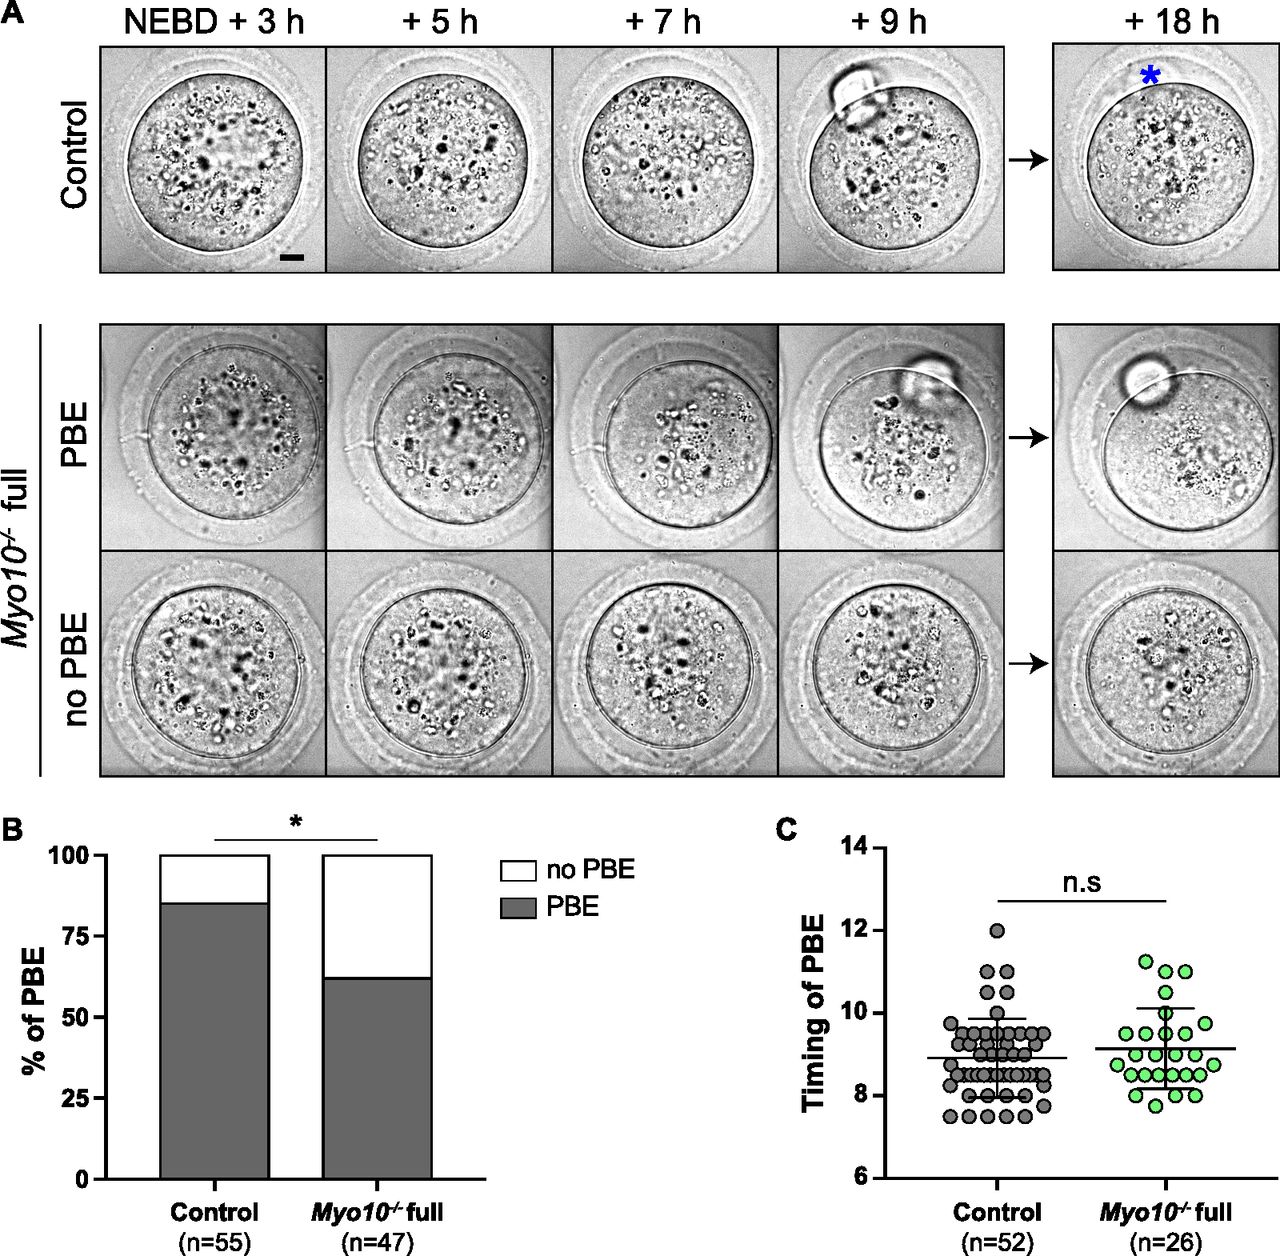
- Figure 4. TZP-deprived oocytes tend to arrest in meiosis I.
(A) Brightfield images from spinning disk videos from 3 h to 18 h after NEBD. The top images show a control oocyte; the middle ones, a Myo10−/− full oocyte that extruded a polar body (PBE); and the bottom ones, a Myo10−/− full oocyte that did not extrude a polar body (no PBE). The blue asterisk indicates a lysed polar body. Scale bar = 10 μm. (B) Stacked bars of first polar body extrusion rate as a percentage of control and Myo10−/− full oocytes. The gray bars represent the percentage of oocytes that extruded a polar body (PBE), and the white bars, the percentage of oocytes that did not extrude a polar body (no PBE). (n) is the number of oocytes analyzed. Data are from three independent experiments. Statistical significance of differences was assessed by a two-sided Fisher exact test, P = 0.0113. (C) Scatter plot of the timing in hours after NEBD of first polar body extrusion of control (dark gray) and Myo10−/− (green) full oocytes. (n) is the number of oocytes analyzed. Data are the mean ± s.d. with individual data points plotted. Data are from six independent experiments. Statistical significance of differences was assessed by a two-tailed Mann–Whitney test, P = 0.3194. n.s, not significant.
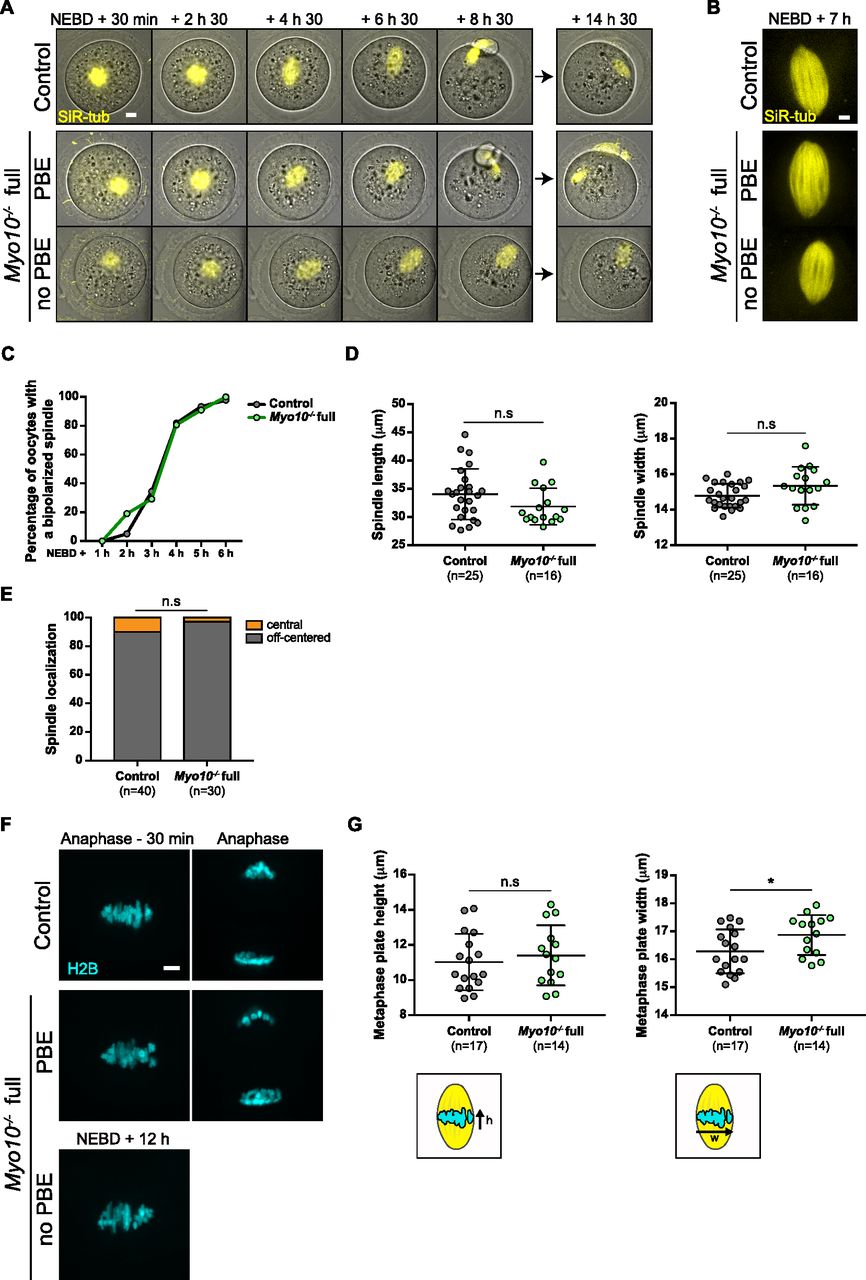
- Figure 5. TZP-deprived oocytes have correctly formed and positioned spindles and aligned chromosomes.
(A) Maximum-intensity Z projection images of oocytes stained with SiR-tubulin to label microtubules (SiR-tub, yellow) merged with corresponding brightfield images. Images are extracted from spinning disk videos from 30 min to 14 h 30 min after NEBD. The top images show a control oocyte; the middle ones, a Myo10−/− full oocyte that extruded a polar body (PBE); and the bottom ones, a Myo10−/− full oocyte that did not extrude a polar body (no PBE). Scale bar = 10 μm. (B) Maximum-intensity Z projection images of oocytes stained with SiR-tub (yellow) 7 h after NEBD. The top image shows the spindle of a control oocyte; the middle one, the spindle of a Myo10−/− full oocyte that extruded a polar body (PBE); and the bottom one, the spindle of a Myo10−/− full oocyte that did not extrude a polar body (no PBE). Scale bar = 5 μm. (C) Graph of the percentage of control (dark gray) and Myo10−/− (green) full oocytes with a bipolarized spindle as a function of time after NEBD. Data are from four independent experiments. For each time point, statistical significance of differences was assessed by a two-sided Fisher exact test, P > 0.9999 for 1 h after NEBD, P = 0.3433 for 2 h after NEBD, P = 0.7765 for 3 h after NEBD, P > 0.9999 for 4 h after NEBD, P = 0.6937 for 5 h after NEBD, and P > 0.9999 for 6 h after NEBD. (D) Scatter plots of spindle interpolar length (left) and central width (right) 7 h after NEBD in control (dark gray) and Myo10−/− (green) full oocytes. (n) is the number of oocytes analyzed. Data are the mean ± s.d. with individual data points plotted. Data are from four independent experiments. Statistical significance of differences was assessed by a two-tailed unpaired t test, P = 0.0989 for the length, and by a two-tailed unpaired t test with Welch’s correction, P = 0.0753 for the width. n.s, not significant. (E) Stacked bars of spindle cell localization 30 min before anaphase for oocytes that extruded a polar body or 12 h after NEBD for those that did not, as a percentage of control and Myo10−/− full oocytes. Gray bars represent the percentage of oocytes with an off-centered spindle, and orange bars, the percentage of oocytes with a central spindle. (n) is the number of oocytes analyzed. Data are from four independent experiments. Statistical significance of differences was assessed by a two-sided Fisher exact test, P = 0.3832. n.s, not significant. (F) Maximum-intensity Z projection images from spinning disk videos of oocytes injected with H2B-GFP to label chromosomes (H2B, cyan) in a control oocyte (top images), a Myo10−/− full oocyte that extruded a polar body (PBE, middle images), and a Myo10−/− full oocyte that did not extrude a polar body (no PBE, bottom image). Left images show chromosomes 30 min before anaphase for polar body–extruding oocytes or 12 h after NEBD for the Myo10−/− full oocyte that did not extrude a polar body. Right images show chromosomes after anaphase. Scale bar = 5 μm. (G) Scatter plots of metaphase plate height (left) and width (right), as shown in the lower schemes, 30 min before anaphase for oocytes that extruded a polar body or 12 h after NEBD for those that did not. Control and Myo10−/− full oocytes are in dark gray and green, respectively. (n) is the number of oocytes analyzed. Data are the mean ± s.d. with individual data points plotted. Data are from three independent experiments. Statistical significance of differences was assessed by two-tailed unpaired t tests. P = 0.5331 for the height and P = 0.0395 for the width. n.s, not significant.
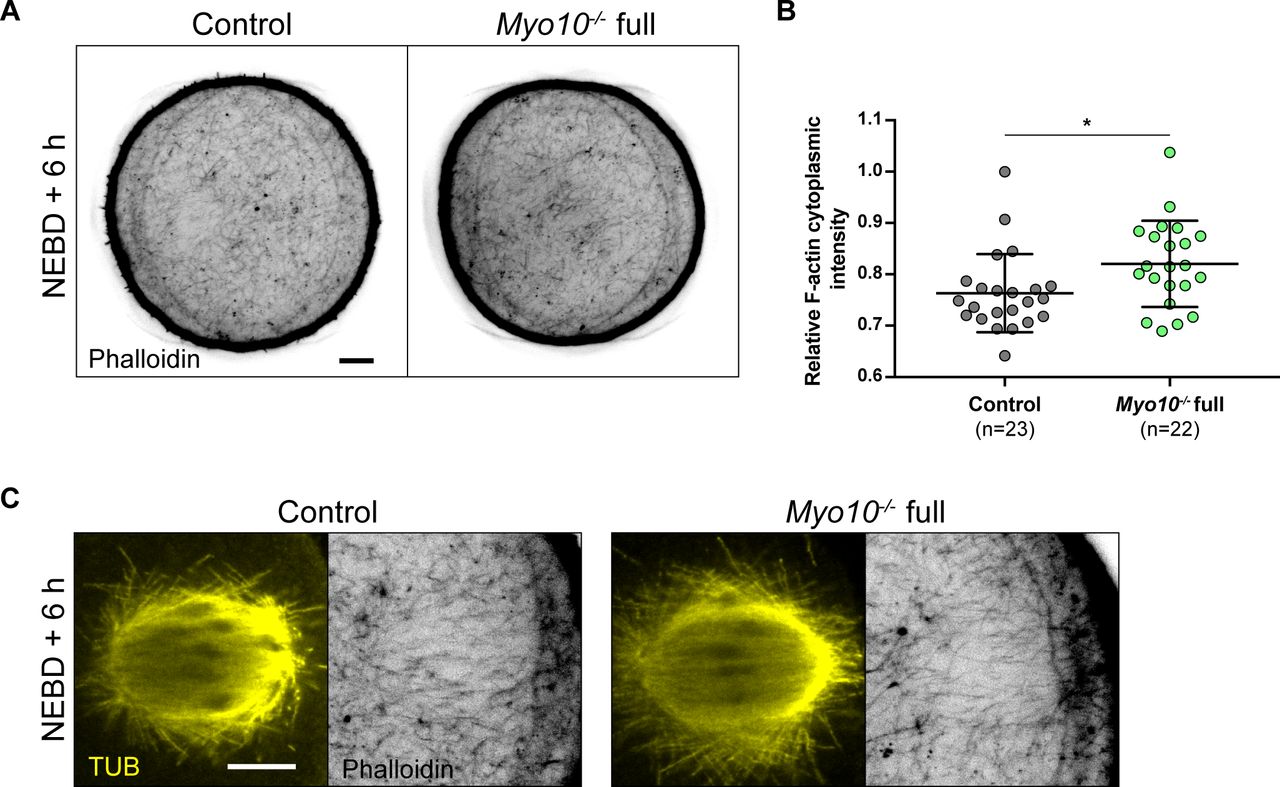
- Figure S5. Cytoplasmic F-actin network is normally organized in TZP-deprived oocytes.
(A) Equatorial planes of control (left) and Myo10−/− full (right) oocytes stained with phalloidin 6 h after NEBD. Scale bar = 10 μm. (B) Scatter plot of cytoplasmic F-actin intensity 6 h after NEBD in control (dark gray) and Myo10−/− full (green) oocytes. (n) is the number of oocytes analyzed. Data are the mean ± s.d. with individual data points plotted. Data are from three independent experiments. Statistical significance of differences was assessed by a two-tailed Mann–Whitney test, P = 0.0111. (C) Images of spindles and F-actin cages from control (left panel) and Myo10−/− full (right panel) oocytes 6 h after NEBD. Oocytes are stained for tubulin (TUB, yellow, left panel images) and stained with phalloidin (black, right panel images). Scale bar = 10 μm.
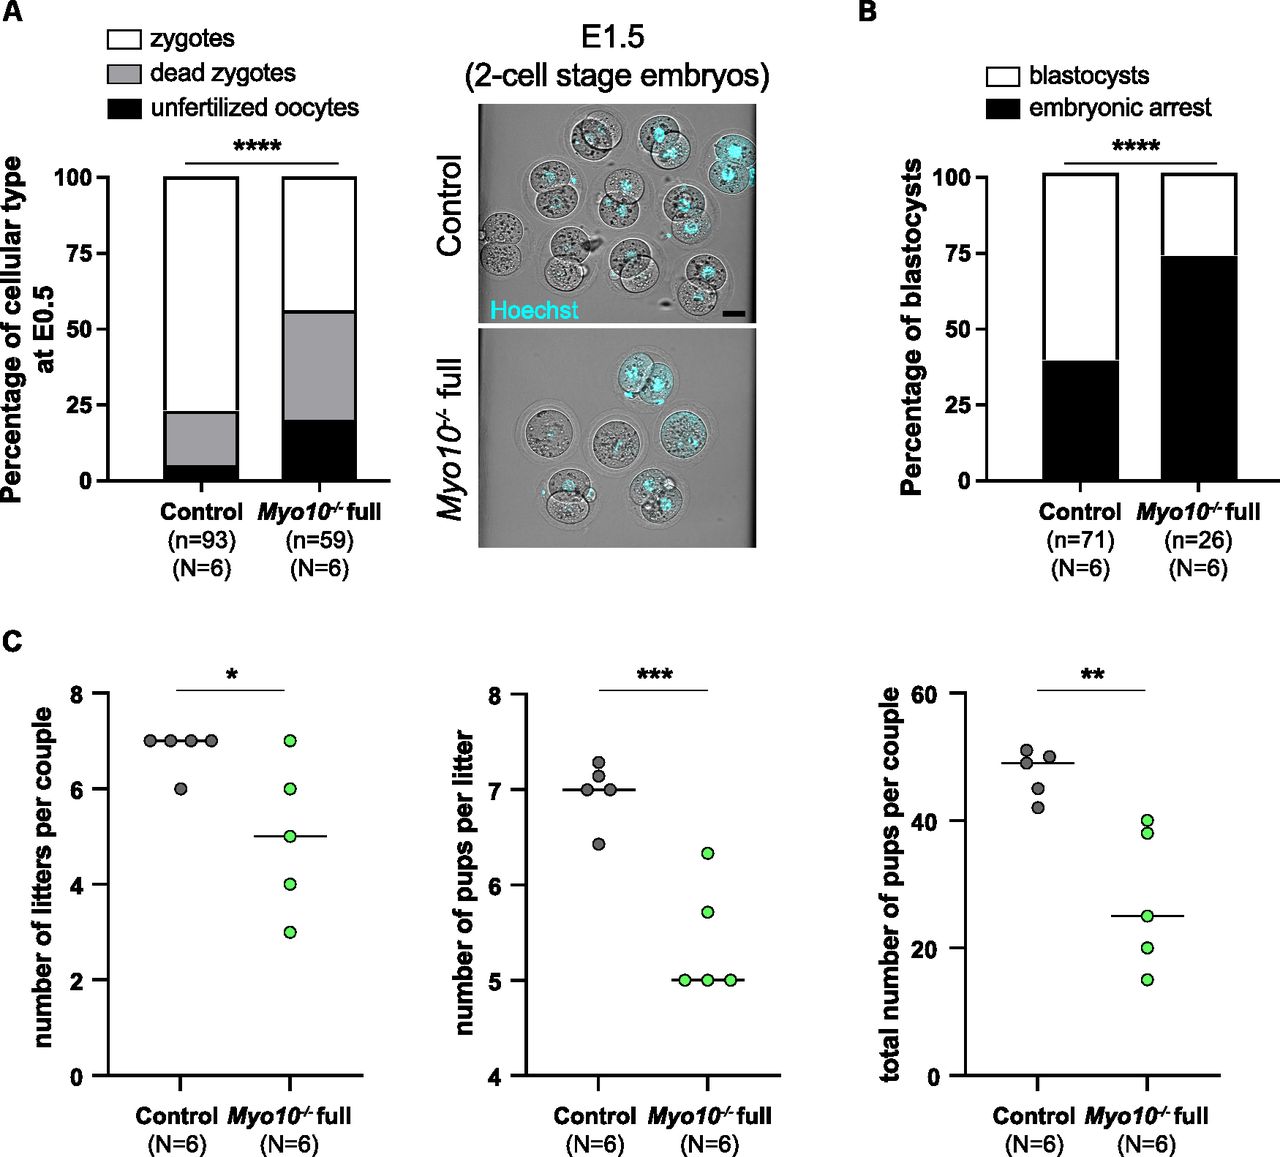
- Figure 6. Developmental potential of TZP-deprived oocytes is altered, correlating with subfertility in females.
(A) On the left, stacked bars showing the percentage of unfertilized oocytes (black bars), dead zygotes (gray bars), and alive zygotes (white bars) recovered at E0.5. (n) is the number of cells recovered, and (N) is the number of successful matings analyzed. Data are from three independent experiments. Statistical significance of differences was assessed with a chi-squared test, P < 0.0001. On the right, cells recovered at E0.5 and cultured to E1.5 from a control female (upper panel) and a Myo10−/− full female (lower panel), stained with Hoechst (blue) to visualize DNA. Scale bar = 40 μm. (B) Stacked bars showing the percentage of embryonic arrest (black bars) and blastocysts (white bars). (n) is the number of cells recovered, and (N) is the number of successful matings analyzed. Data are from three independent experiments. Statistical significance of differences was assessed by a two-sided Fisher exact test, P < 0.0001. (C) Scatter plots of the number of litters per couple, number of pups per litter, and total number of pups per couple from Myo10wt/wt; Cre+ female mice (control, gray) and Myo10flox/flox; Cre+ female mice (carrying Myo10−/− full oocytes, green). Six independent matings (N) were set for six months each with Myo10wt/wt; Cre− males. Statistical significance of differences was assessed with two-tailed unpaired t tests, P = 0.04 (for the number of litters per couple), P = 0.0009 (for the number of pups per litter), and P = 0.0052 (for the total number of pups per couple).


Tables
Selected genes to validate the RNA-Seq by RT-qPCR.
Forward primer Reverse primer Gapdh TGGAGAAACCTGCCAAGTATG GGTCCTCAGTGTAGCCCAAG Akr1b3 AGAGCATGGTGAAAGGAGCC CCATAGCCGTCCAAGTGTCC Ccnb1 GAGAGGTTGACGTCGAGCAG GAGTTGGTGTCCATTCACCG Eif4e GAGGTTGCTAACCCAGAGCA CATAGGCTCAATCCCGTCCTT Hsp90aa1 CGTCTCGTGCGTGTTCATTC CCAGAGCGTCCGATGAATTG Myo10 GGCACGAAAGCAATATAGAAAGG CTTCTGGAACACGATGGCTG Oaz1 CAGCAGCGAGAGTTCTAGGG CTCGTCGGAGTACAGGATGC Oser1 CCAGCTGCGAGGAGTATTAAC GGGCCTTCTCCAACAGACAG Paox GGTCCAGCCTTCTTTTGAGTCT GTAGGAACCTCGGGTGTACG Psma5 CAGGTGCTATGTCTCGTCCC ATGAGCGAGGACTTGATGGC Rpl19 CGCTGCGGGAAAAAGAAGGT CCTCTTCCCTATGCCCATATGC Rps4x GGCGAGTCTCTTTCCGTTCC GGATGGACGAGGAGCAAACAC Stxbp5l GATTTGCAAGACAGTTCGGC TGGCAGTAACAGTCAACAC
- Video 1
Decreased TZP density in Myo10−/− full oocytes highlighted by OMX super-resolution microscopy. OMX microscopy videos showing TZPs of fully grown oocytes freed of follicular cells and stained with phalloidin. The control oocyte is on the left, and the Myo10−/− full oocyte, on the right. Videos are 3D projection images reconstructed from the 125 nm-spaced Z acquisition from the outer layer of the zona pellucida (ZP) to the oocyte cortex. Videos start with the top view of the ZP outer layer, rotate to a ZP cross-sectional view, and come back to the ZP outer layer. Scale bar = 5 μm. Download video
- Video 2
Intra-ovarian organization of Myo10−/− full ovaries. Light-sheet fluorescence microscopy videos of cleared ovaries stained with TO-PRO-3 to label nucleic acid. Videos are cross-sectional images of the ovaries spaced 1 μm apart. Videos of four ovaries from two adult control mice. Scale bars = 200 μm. Download video
- Video 3
Intra-ovarian organization of Myo10−/− full ovaries. Light-sheet fluorescence microscopy videos of cleared ovaries stained with TOPRO-3 to label nucleic acid. Videos are cross-sectional images of the ovaries spaced 1 μm apart. Videos of four ovaries from two adult Myo10−/− full mice. Scale bars = 200 μm. Download video
- Video 4
Some TZP-deprived oocytes arrest in meiosis I. Spinning disk videos showing brightfield images of a control oocyte (top video), a Myo10−/− full oocyte that extruded a polar body (middle video), and a Myo10−/− full oocyte that did not extrude a polar body (bottom video). The oocytes are those shown in Fig 4A. Videos start 2 h 30 min after NEBD and end 18 h after NEBD. Images are acquired every 30 min. Scale bar = 10 μm. Download video
- Video 5
TZP-deprived oocytes correctly form and position meiosis I spindles. Spinning disk videos of oocytes stained with SiR-tubulin (SiR-tub) to label microtubules (yellow) from 30 min to 14 h 30 min after NEBD. The top videos show a control oocyte, the middle ones, a Myo10−/− full oocyte that extruded a polar body, and the bottom ones, a Myo10−/− full oocyte that did not extrude a polar body. For each oocyte, the left video shows maximum-intensity Z projection of SiR-tub labeling, and the right one, the same SiR-tub labeling merged with the corresponding brightfield images. The oocytes are those shown in Fig 5A. Images are acquired every 30 min. Scale bar = 10 μm. Download video
- Video 6
TZP-deprived oocytes properly align meiosis I chromosomes. Spinning disk videos of oocytes injected with H2B-GFP to label chromosomes from 2 h 30 min to 18 h after NEBD. The top videos show a control oocyte; the middle ones, a Myo10−/− full oocyte that extruded a polar body; and the bottom ones, a Myo10−/− full oocyte that did not extrude a polar body. For each oocyte type, the left video shows maximum-intensity Z projection of H2B labeling, and the right one, the same H2B labeling merged with the corresponding brightfield image. The oocytes are those shown in Fig 5F. Images are acquired every 30 min. Scale bar = 10 μm. Download video


