


Article Figures & Data
Figures
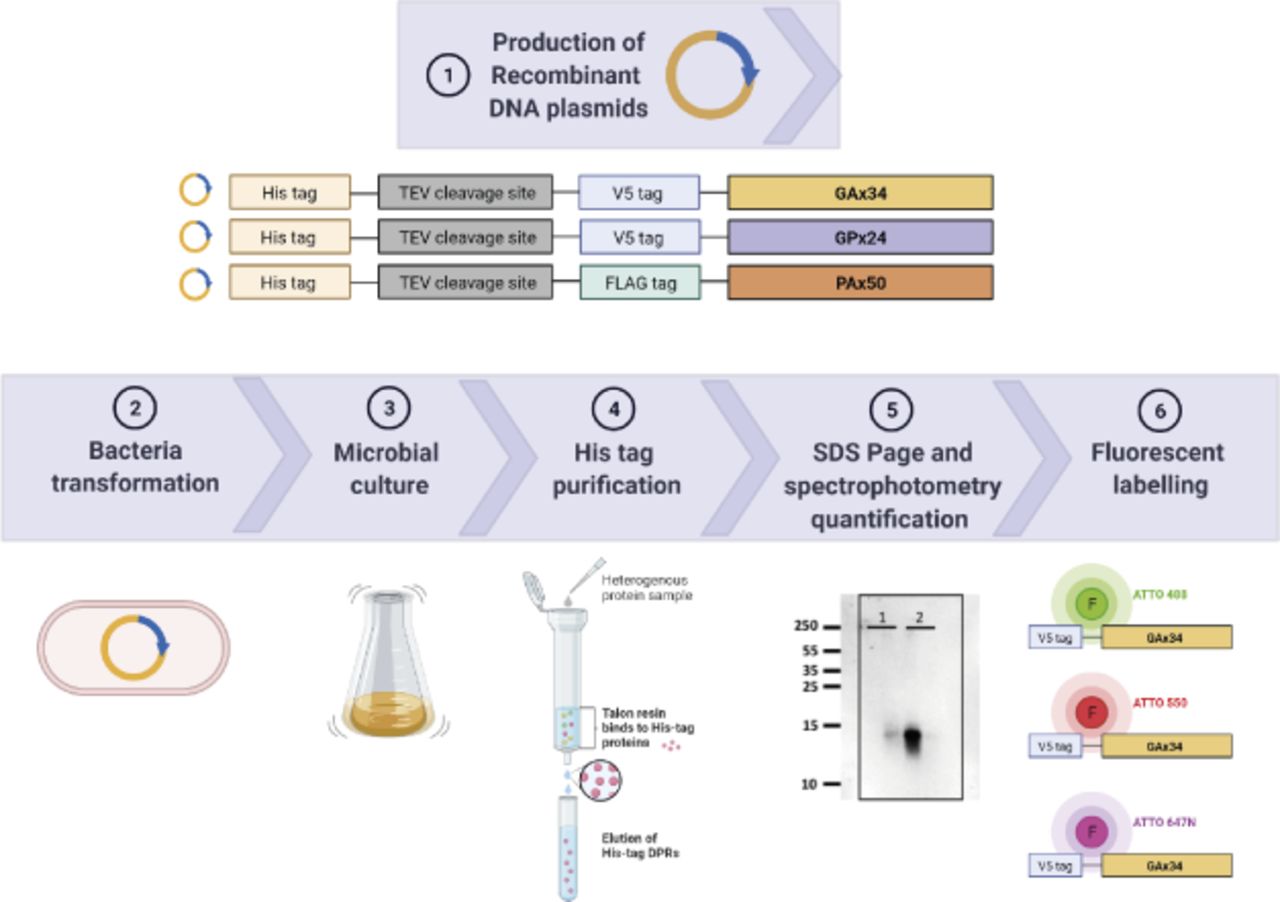
- Figure S1. Schematic diagram of recombinant proteins’ production.
DNA sequences encoding V5-tag followed by 34 repeats of GA or 24 repeats of GP; and FLAG-tag followed by 50 repeats of PA were subcloned in a bacterial expression vector containing an N-terminal 6xHis-Tag and a TEV protease cleavage site. The Escherichia coli BL21 strain was transformed with these recombinant plasmids. His-tagged proteins were purified on Talon columns. Eluted fractions were analysed by SDS–PAGE, and proteins were quantified spectrophotometrically and labelled with fluorescent dyes. Figure created with BioRender.com under academic license.
- Figure S2. Anti-GA or anti-PA immunoreactivity and fluorophore labelling for dipeptide repeats.
(A) Dot-blotted membrane of purified poly-GA fibris, poly-GA oligomers, or poly-PA oligomers in serial dilution after staining with the respective anti-repeat antibodies (anti-GA = Proteintech 24492-1-AP; anti-PA = Proteintech 24493-1-AP). PBS indicates a control condition with no purified proteins. Graphs show quantification of Mean grey values for each corresponding condition. Data information, sample numbers: no 1 = 1 µM; no 2 = 0.5 µM; no 3 = 0.25 µM; no 4 = 0.13 µM; no 5 = 0.06 µM; no 6 = PBS only. (B) Poly-GA oligomers and fibrils labelled by ATTO-647N (molar ratio Atto:GA = 2:1) exhibit fluorescent signal and Coomassie staining after protein gel electrophoresis and fluorescent signal after dot-blot. Whereas both oligomers and fibrils exhibit fluorescence signal, the fibrils’ signal is three times higher (left). On the Coomassie gel, the quantity of monomers and fibrils is comparable (centre). (C) 5 μl at 100 μM (4.5 μg) of fibrillar poly-GA labelled by ATTO-550 (molar ratio Atto:GA = 5:1) were resolved on an acrylamide gel, and the fluorescence of Atto-550 (black signal) was recorded (left). Two samples were also analysed by dot blot on nitrocellulose membrane, and the fluorescence of Atto-550 is displayed (black signal) (right).
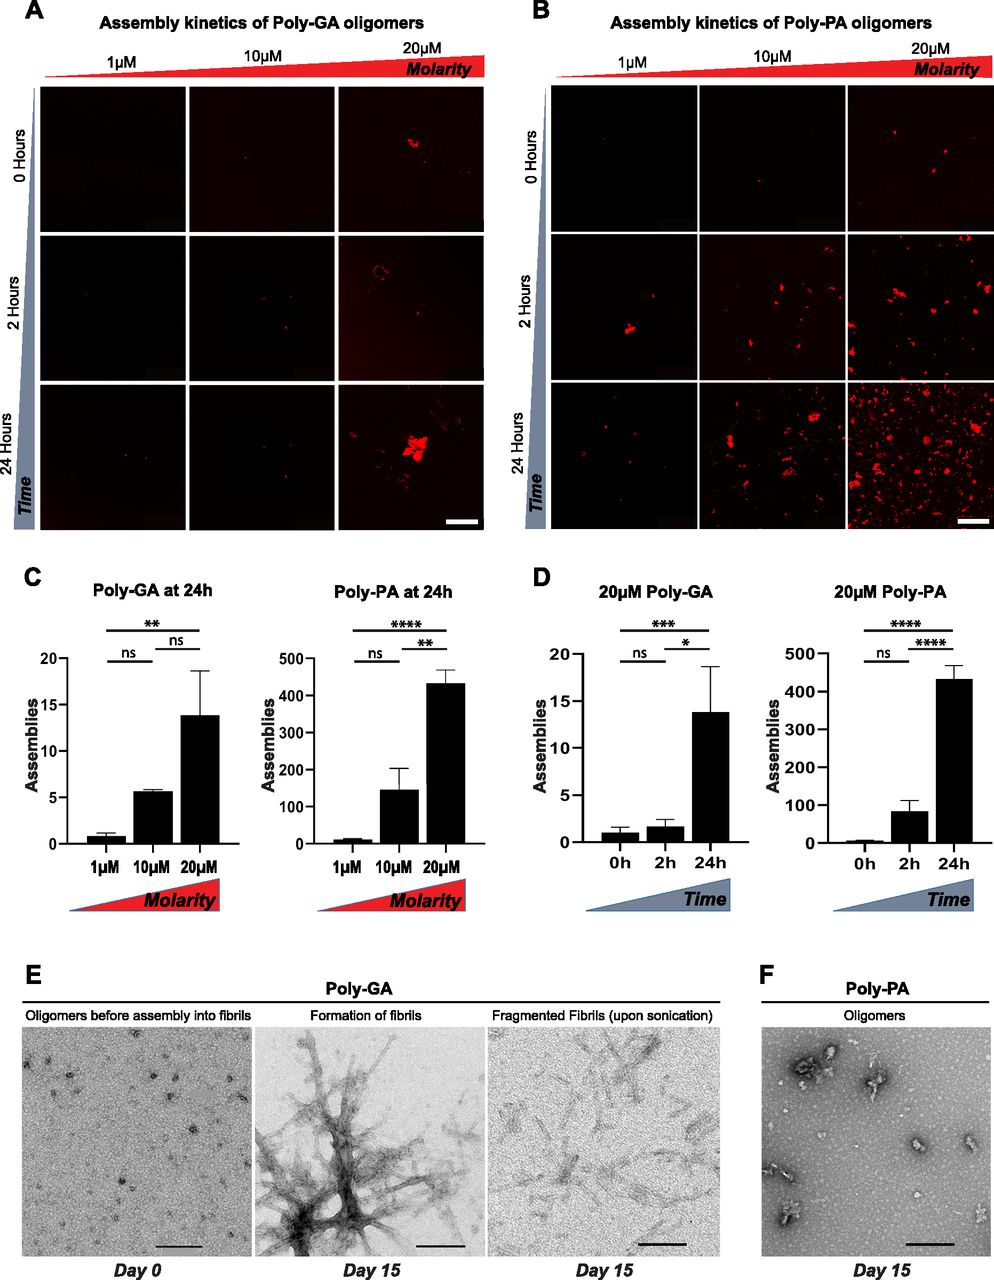
- Figure 1. Poly-GA oligomers form solid-like structures and assemble into characteristic β-sheet fibrils.
(A, B, C, D) Aggregation of (A) poly-GA and (B) poly-PA oligomers in vitro, with relative quantification of the number of assemblies formed upon (C) increasing molarity or (D) time. Bar graphs of mean ± SEM. One-way ANOVA with Tukey’s multiple-comparisons test. *P ≤ 0.05, **P ≤ 0.01, and ****P ≤ 0.0001. The data were collected from two independent biological replicates. (E, F) Electron micrographs show that poly-GA oligomers form characteristic fibrils after 15 d in vitro (E), unlike poly-PA oligomers (F). (A, B, E, F) Poly-GA fibrils are shown before and after sonication, which drives the production of fragmented fibrils. Scale bar: 50 μm (A, B); 200 μm (E, F).
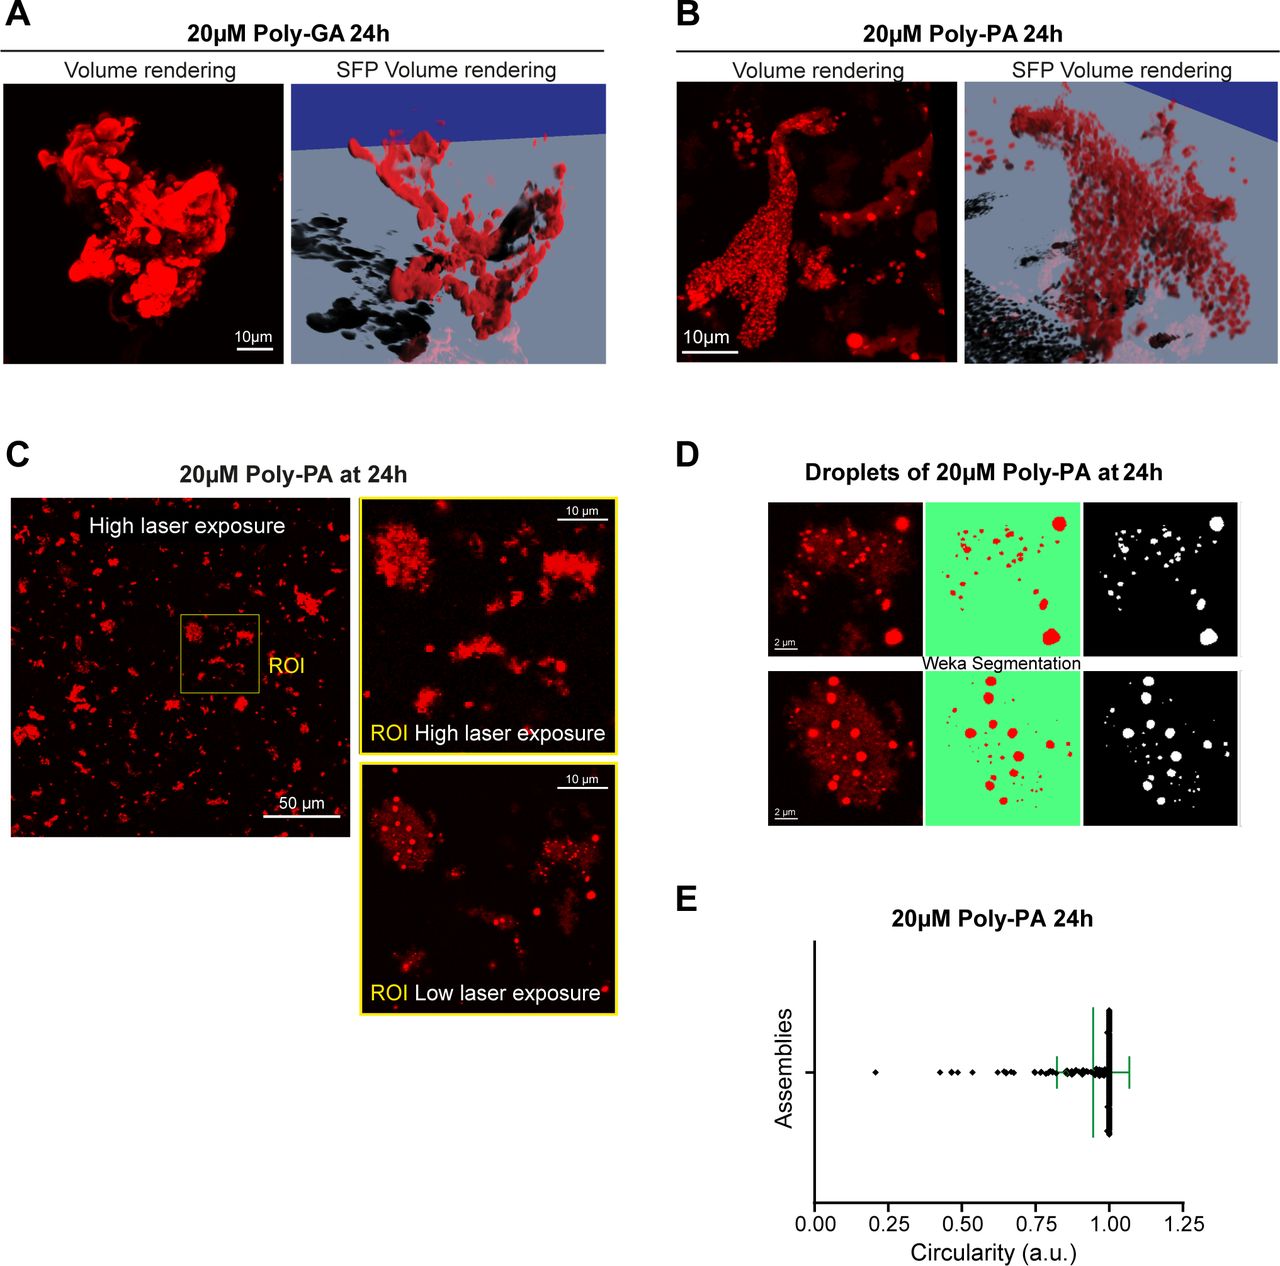
- Figure S3. In vitro coalescence of poly-GA and poly-PA in 3D-rendering.
(A) The largest poly-GA structures formed at 20 µM 24 h are shown in 3D rendered images; the corresponding movie is shown in Video 1. (B) The largest poly-PA structures formed at 20 µM and 24 h are shown in 3D rendered images; the corresponding movie is shown in Video 2. (C) Confocal image showing the in vitro coalescence of poly-PA assemblies at 20 µM, 24 h. The image was first acquired with high laser intensity and then with low laser intensity and Nyquist sampling, so the droplets became distinguishable. (D, E) After segmenting the poly-PA droplets with the Trainable Weka Segmentation FIJI plug-in (Arganda-Carreras et al, 2017), (E) the droplets’ average circularity was calculated to be 0.95 (±SD).
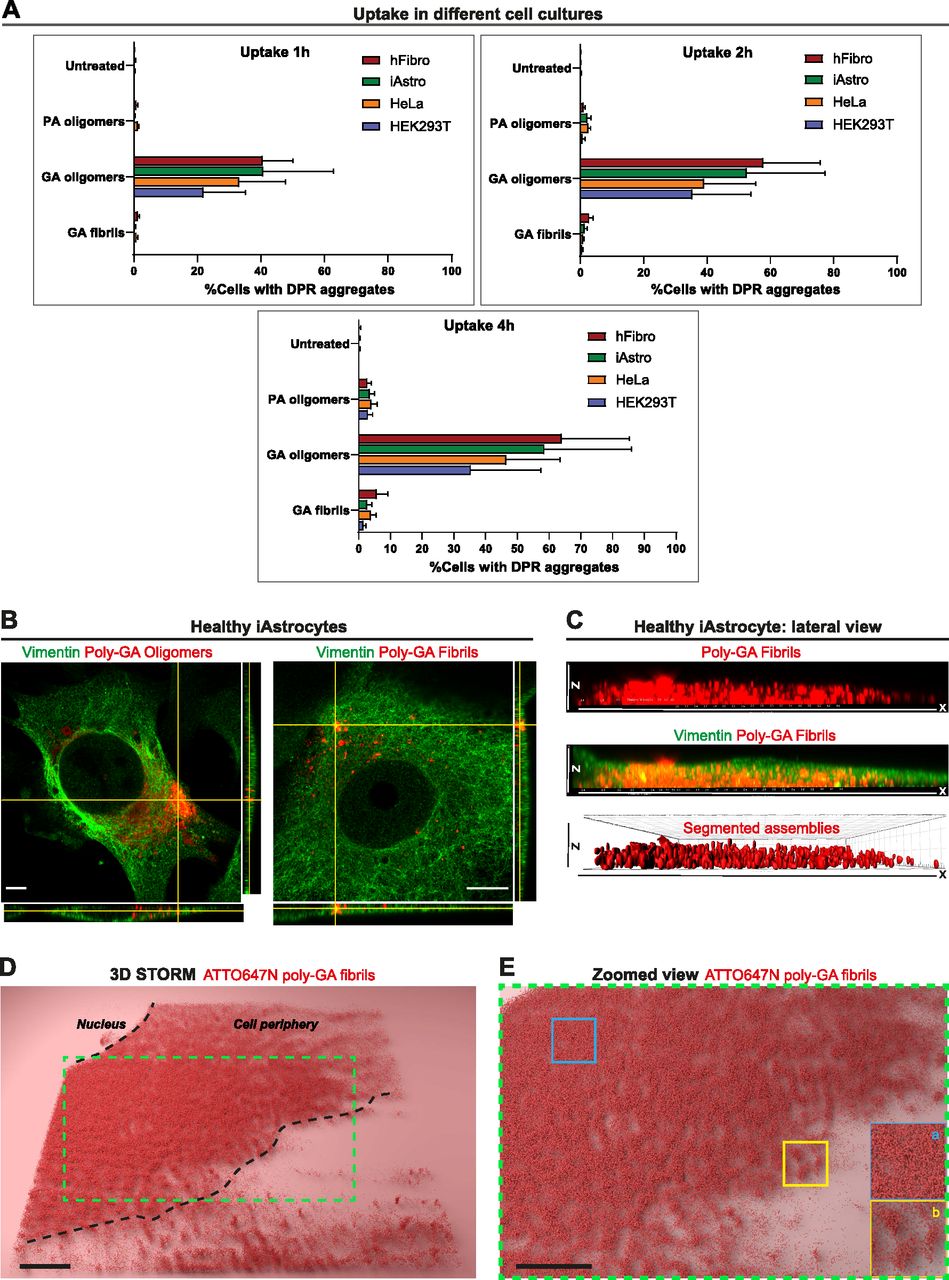
- Figure 2. Dipeptide repeat uptake in various cell lines and in healthy iAstrocytes.
(A) Quantitative analysis of the %cells displaying large dipeptide repeat aggregates (1 µM) overtime (1 h, 2 h, 4 h). Different cell cultures were used in this experiment such as human fibroblasts (hFibro, red), iAstrocytes (iAstro, green), HeLa cells (orange), and HEK293T cells (blue). ∼8,000 cells/culture were analysed. The data were collected from three independent biological replicates. Bar graphs of mean ± SEM. (B) Orthogonal views from AiryScan microscopy show the uptake of 1 µM poly-GA oligomers and 1 µM poly-GA fibrils in vimentin-stained healthy iAstrocytes after 24 h exposure. Scale bar = 10 μm. (C) 3D-rendered lateral view of a single vimentin-stained healthy iAstrocyte shows the uptake of 1 µM poly-GA fibrils through the xz dimension. Corresponding movies are shown in Videos 3 and 4. (D) 3D-STORM imaging was used to visualize 1 µM ATTO647N labelled poly-GA fibrils in healthy iAstrocytes after 24 h uptake. (E) The zoomed view shows how molecules of poly-GA fibrils can be densely clustered (inset a) but also compartmentalized in spherical structures (inset b).
- Figure S4. Uptake and binding of dipeptide repeats (DPRs) to glial cells in culture.
(A) To confirm the uptake of poly-GA in glia, trypan blue was used to quench any external or membrane-bound fluorescence coming from 1 µM ATTO488-labelled poly-GA added to the medium of 1321N1 human astrocytoma cells for 24 h. As shown in the figure, most of the poly-GA fluorescent signal is conserved after the addition of trypan blue (arrow heads), suggesting that these aggregates are taken up by the cells and internalised. The data were collected from two independent biological replicates. (B) Scatter density plots showing ATTO550+ (blue) and ATTO550− (red) light scattering events detected by flow cytometry in 1321N1 human astrocytoma cells from a total of 10,000 events. Detection of ATTO550+ signal was set at 610/20 voltage. Cells not treated with DPRs acted as control producing the gating to discriminate between the ATTO550+ and the ATTO550− cells. The data were collected from three independent biological replicates. (C, D) After 24 h DPR exposure (at 1 µM), total protein of 1321N1 human astrocytoma cells (C) or healthy iAstrocytes (D) was extracted into lysis buffer and then dot blotted onto a nitrocellulose membrane using a microfiltration apparatus. The membranes were then sliced into strips and analysed by anti-V5 immunostaining to show sub-populations of cells positive for V5-tagged DPRs. The data were collected from three independent biological replicates.
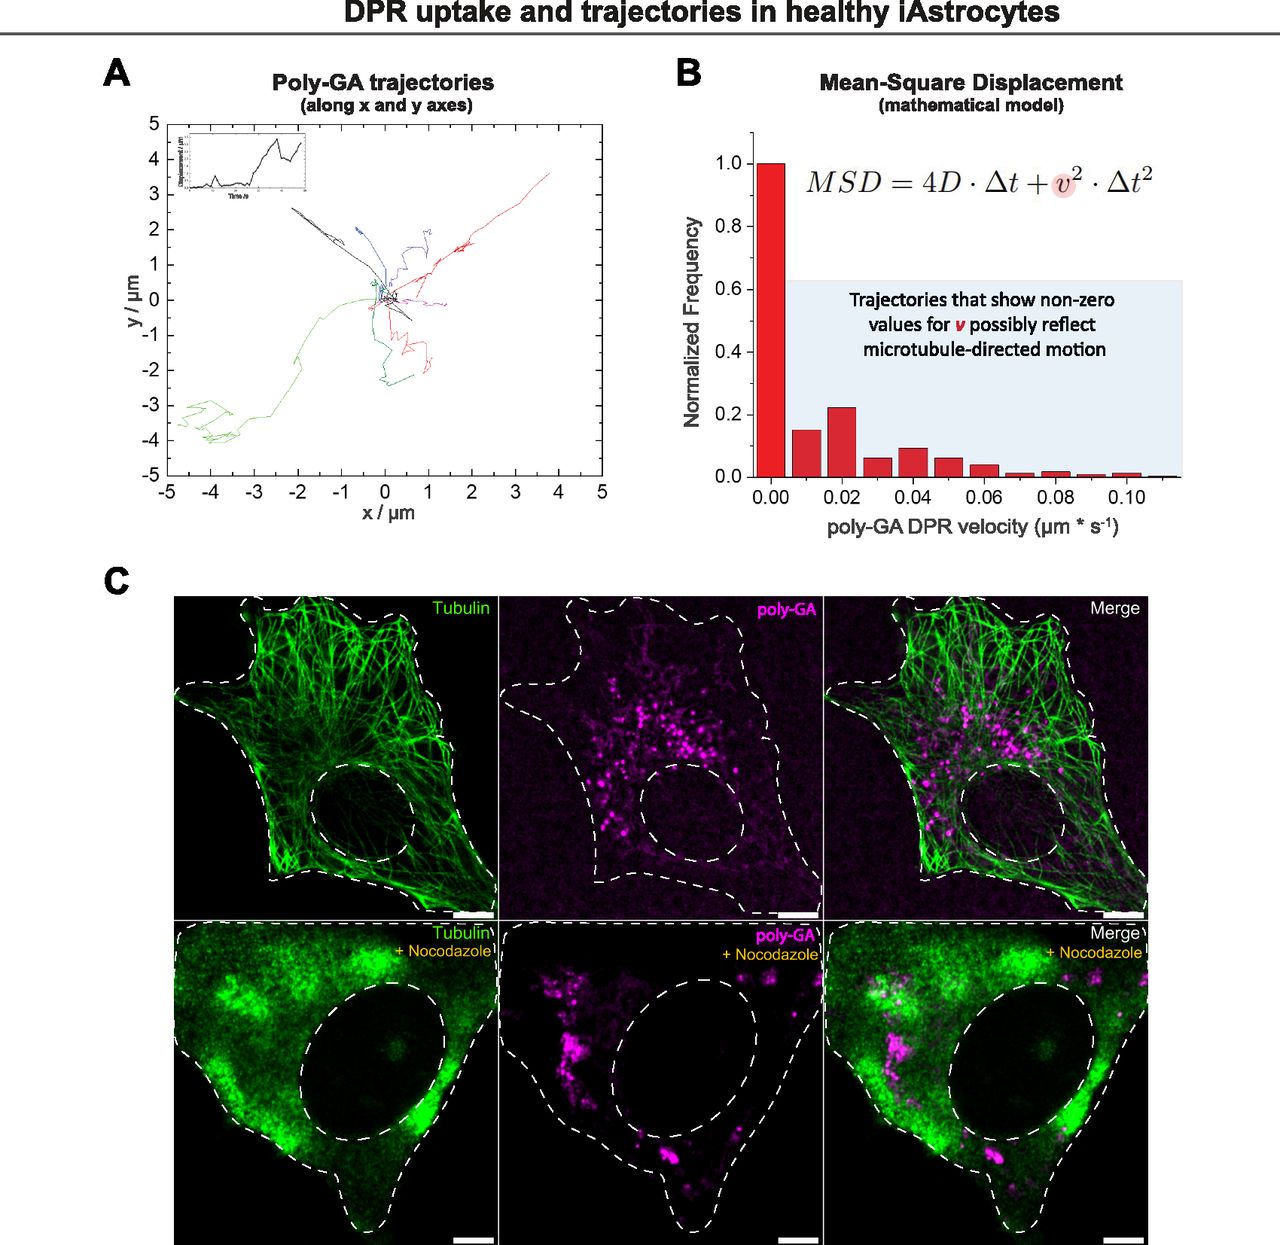
- Figure 3. Dipeptide repeat (DPR) motion after uptake in healthy iAstrocytes.
After 24 h exposure to 1 µM DPRs, healthy iAstrocytes were prepared for confocal live-imaging and ATTO550 DPR trajectories were analysed via mean Square Displacement. (A) Some tracks, analysed with TrackMate, are shown in the xy space. Corresponding movie shown in Video 5. (B) Quantification of DPR average velocity v is displayed in the corresponding graph, in which trajectories that show non-zero values for v are suggestive of microtubule-directed motion. (C) After 24 h exposure to 1 µM DPRs, healthy iAstrocytes were subjected to a 30-min pre-treatment with the microtubule de-polymerising agent nocodazole (30 μM) before fixation. Confocal images are shown, following anti-tubulin (green) immunostaining and ATTO550 fluorophore detection for DPRs (magenta). Nocodazole treatment induces cellular relocation of DPRs. Scale bar = 10 µm (upper panel), 5 µm (lower panel). The data were collected from two independent biological replicates.
- Figure 4. Oligomeric vs fibrillar poly-GA dipeptide repeats entry-routes in glia.
(A) Confocal images of Alexa647-Transferrin (control) and 1 µM ATTO550-Poly-GA aggregates after 1 h uptake at 37°C or at 4°C in healthy iAstrocytes. Quantification of the log10-transformed mean grey values is reported in bar graphs of mean ± SEM. ≥300 cells/condition. Kolmogorov–Smirnov non-parametric test after testing normal distribution with the Shapiro–Wilk test. **P ≤ 0.01, and ****P ≤ 0.0001. Scale bars = 5 µm. The data were collected from four independent biological replicates. (B) Quantification of the Mean grey values of Alexa647-Transferrin (control) and 1 µM ATTO550-DPRs upon 1 h treatment with Dynasore (or 0.2% DMSO). Bar graphs of mean ± SEM. ≥250 cells/condition. Kruskal–Wallis non-parametric test with Dunn’s multiple-comparisons after testing normal distribution with the Shapiro–Wilk test. ***P ≤ 0.001, and ****P ≤ 0.0001. The data were collected from three independent biological replicates. (C) Healthy iAstrocytes were imaged by dual-colour STORM after 24 h incubation with 0.5 µM ATTO647N-PolyGA oligomers or fibrils (magenta) and anti-LAMP1 staining (green). Clus-DoC colocalization analysis for Poly-GA relative to LAMP1 (magenta graph), and LAMP1 relative to Poly-GA (green graph) shows the respective %colocalized molecules (among total molecules detected). Bar graphs of mean ± SEM; graphs are indicative of 30 regions-of-interest (4 × 4 μm) per condition chosen only in artefact-free regions. Unpaired two-tailed t test with Welch’s correction. ***P ≤ 0.001. Scale bar = 5 μm. The data were collected from three independent biological replicates.
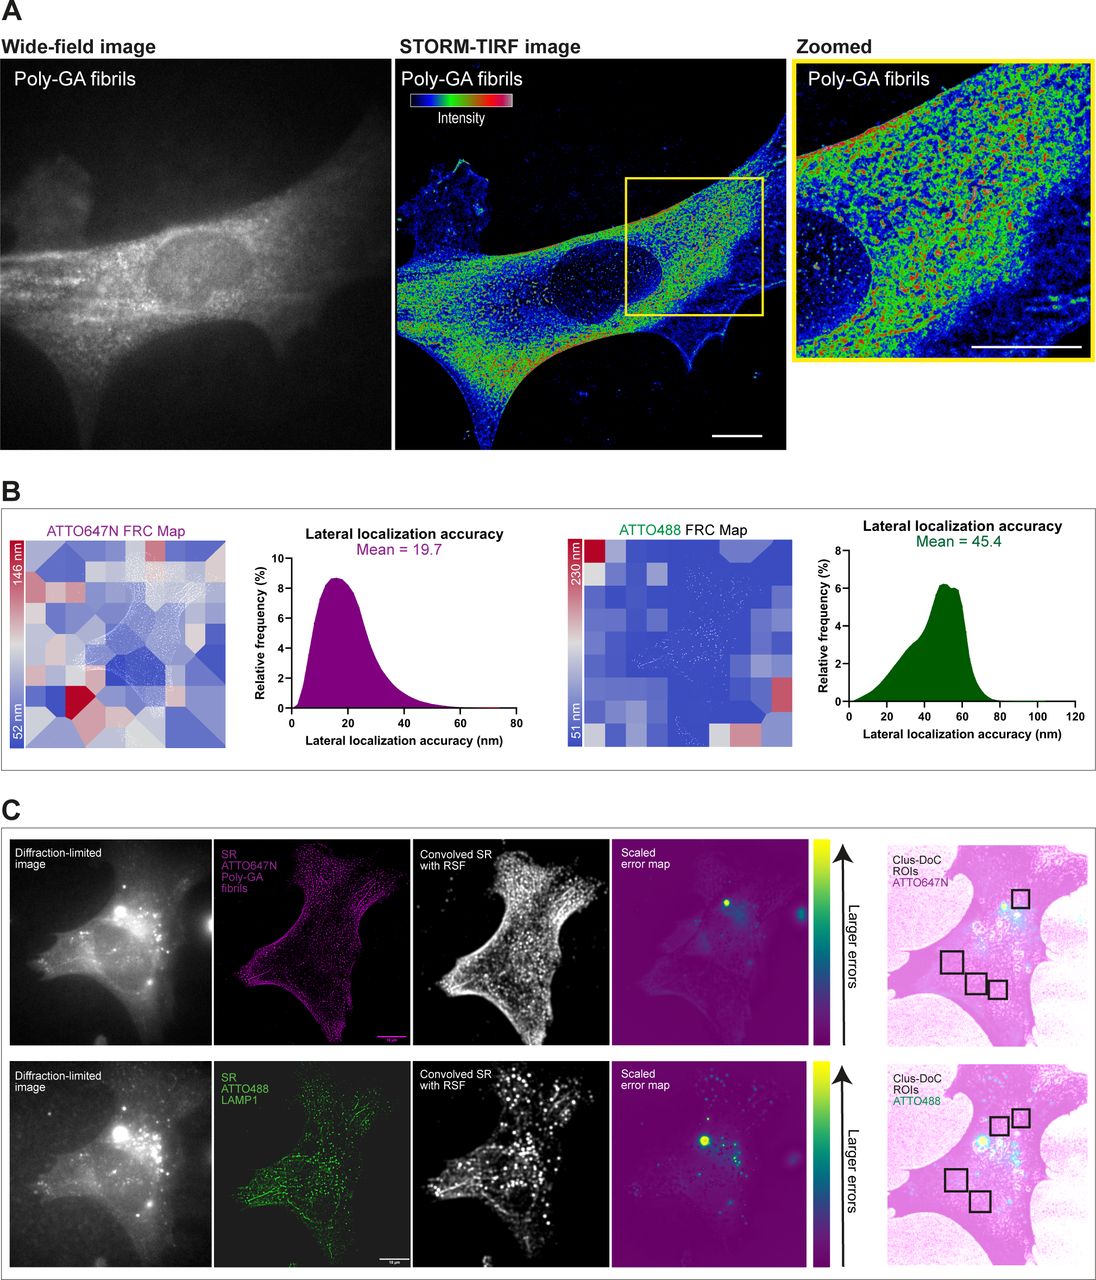
- Figure S5. dSTORM resolution estimation and analysis of super-resolution artefacts by NanoJ-Squirrel.
(A) Wide-field diffraction-limited image shows the diffuse presence of 0.5 µM ATTO647N poly-GA fibrils across the cell with no distinguishable aggregate structures. SMLM-TIRF super-resolved image (8,000 frames, dSTORM) shows sub-diffractive clusters of poly-GA fibrils with colour-coded intensity (red = maximum, blue = minimum) wherein major aggregate structures can now be discerned, as shown in the zoomed region-of-interest and in Video 9. (B) The lateral resolution of dSTORM images was measured implementing block-wise Fourier Ring Correlation (FRC) resolution mapping in NanoJ-SQUIRREL (Culley et al, 2018). As the resolution is anisotropic, the maps represent specific colour-coded regions of estimated resolution for each channel. The lateral resolution achieved, on average, is ∼50–60 nm for both ATTO647N and ATTO488 channels. We also show the estimations of the lateral localization accuracy of both channels based on the Thompson equation (Thompson et al, 2002) (calculated with NIS-Elements software). (C) For lysosomes-Poly-GA fibrils colocalization analysis, diffraction-limited images of each channel were acquired. These images were used as a reference for subsequent NanoJ-SQUIRREL analysis of image artefacts in super-resolution dSTORM images. Each panel (upper and bottom) shows (from left to right): single iAstrocyte cell imaged in TIRF (reference image), super-resolution reconstruction of dSTORM data set on that same cell (“SR”), super-resolution image convolved with appropriate Resolution Scale Function (“Convolved SR with RSF”), and a quantitative map of errors between reference and convolved SR images (“Scaled error map”; colour scale indicates the magnitude of the error). Based on NanoJ-Squirrel analysis of artefacts, specific regions-of-interest for all the colocalization analysis performed in our work were chosen in artefact-free regions of the cell.
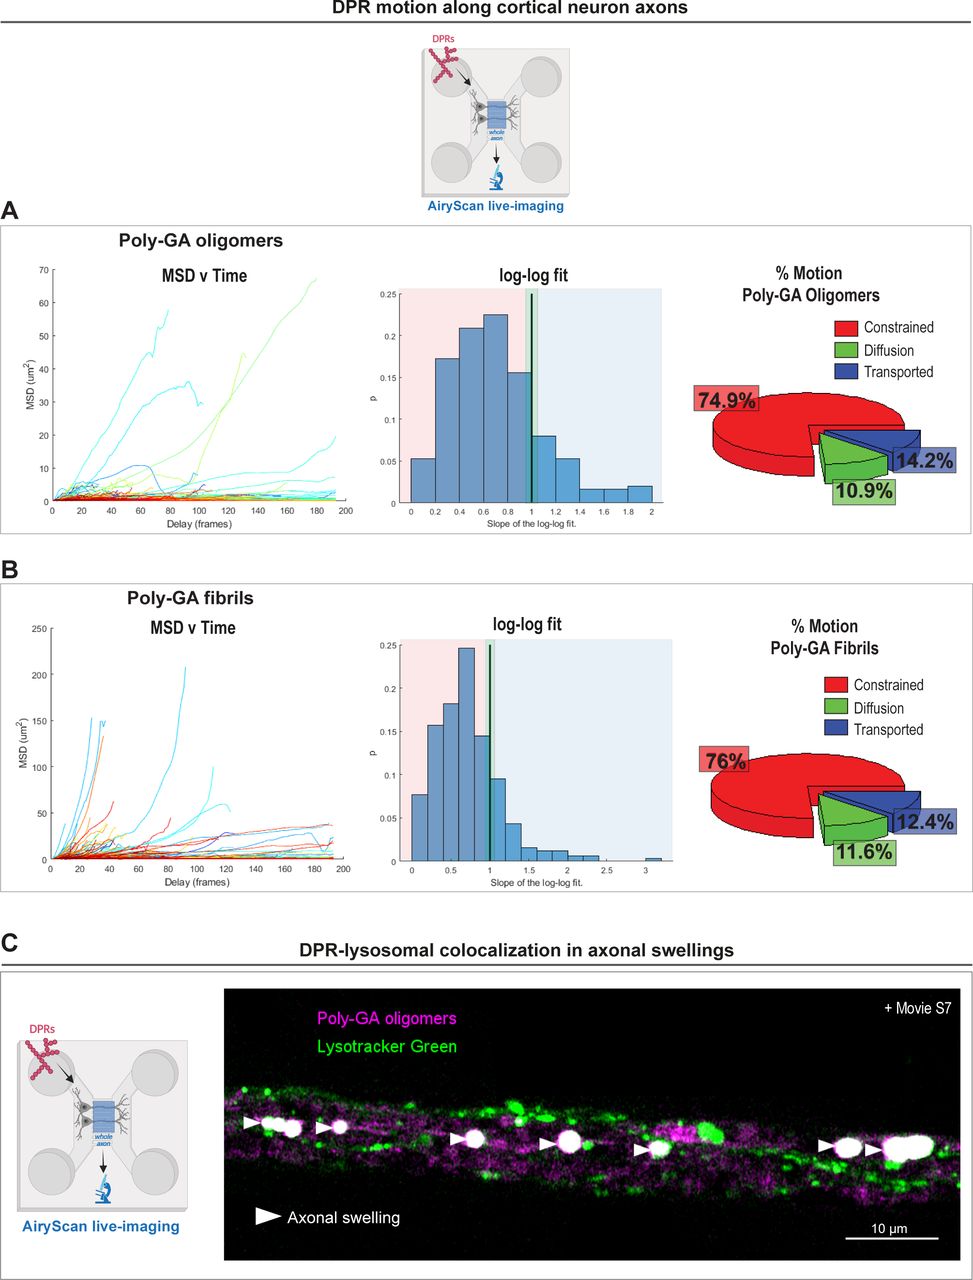
- Figure S6. Dipeptide repeat motion after uptake in primary cortical neurons and subsequent accumulation in lysosomal-enriched axonal swellings.
(A, B) Mean square displacement (MSD) analysis of the trajectories of 1 µM poly-GA oligomers (A) or 1 µM poly-GA fibrils (B) after AiryScan live-imaging in cortical neuron axons. The plots of MSD values vs time delay are shown; alongside with the plots showing the Log–Log Fit of the MSD. In a Log–Log Fit plot, the MSD curves can be approximated by straight lines of: slope 1 for diffusion motion, slope 2 for transported motion, and less than 1 for constrained motion; these types of motion are quantified and shown in the respective pie charts. ≥1,000 tracks/condition. The data were collected from three independent replicates. (C) Confocal images showing accumulation of 1 µM poly-GA assemblies in large axonal swellings along the axons of primary mouse cortical neurons. Upon the application of the lysosomal dye LysoTracker Green, we show that some of these axonal swellings contain poly-GA dipeptide repeats that colocalize with lysosomal organelles (head arrows); corresponding movie is shown in Video 7. The data were collected from three independent biological replicates.
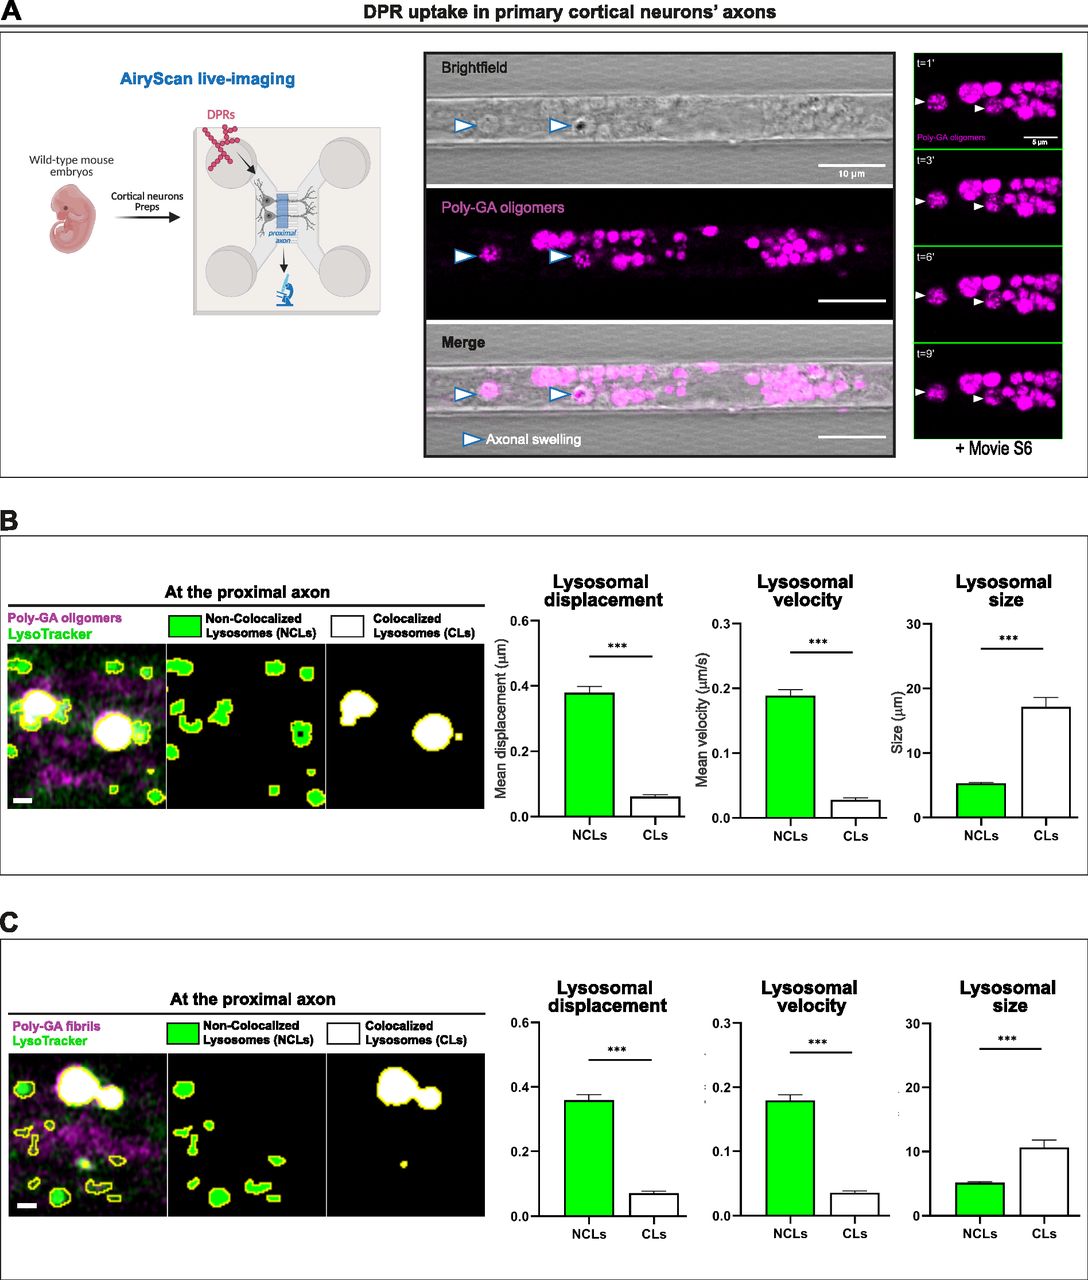
- Figure 5. Poly-GA aggregates colocalize with aberrantly enlarged endolysosomal organelles after uptake in neurons.
(A) Confocal images showing accumulation of 1 µM poly-GA assemblies in large axonal swellings (arrow heads) along the axons of primary mouse cortical neurons. A combination of bright-field imaging and fluorescence detection of the ATTO550-labelled poly-GAs was used to detect these swellings specifically in the axons residing in the microfluidic chamber microgrooves (scale bar = 10 μm). By zooming into few axonal swellings with higher resolution (AiryScan mode), during live-imaging, we report the presence of small poly-GA assemblies’ particles erratically moving within each axonal swelling overtime (right panel, scale bar = 5 μm); corresponding movie is shown in Video 6. (B, C) Colocalization analysis between all the poly-GA oligomers (B) or the poly-GA fibrils (C) and the lysosomes contained in the cortical neurons’ proximal axons. By colour deconvolution we separated “non-colocalized lysosomes” (NCLs) and “colocalized lysosomes” (CLs) to analyse displacement, speed and size. Scale bars = 1 μm. Bar graphs of mean ± SEM. Unpaired two-tailed t test with Welch’s correction. ***P ≤ 0.001. The data were collected from three independent biological replicates. (A) Figure on the left of panel (A) was created with BioRender.com under academic license.
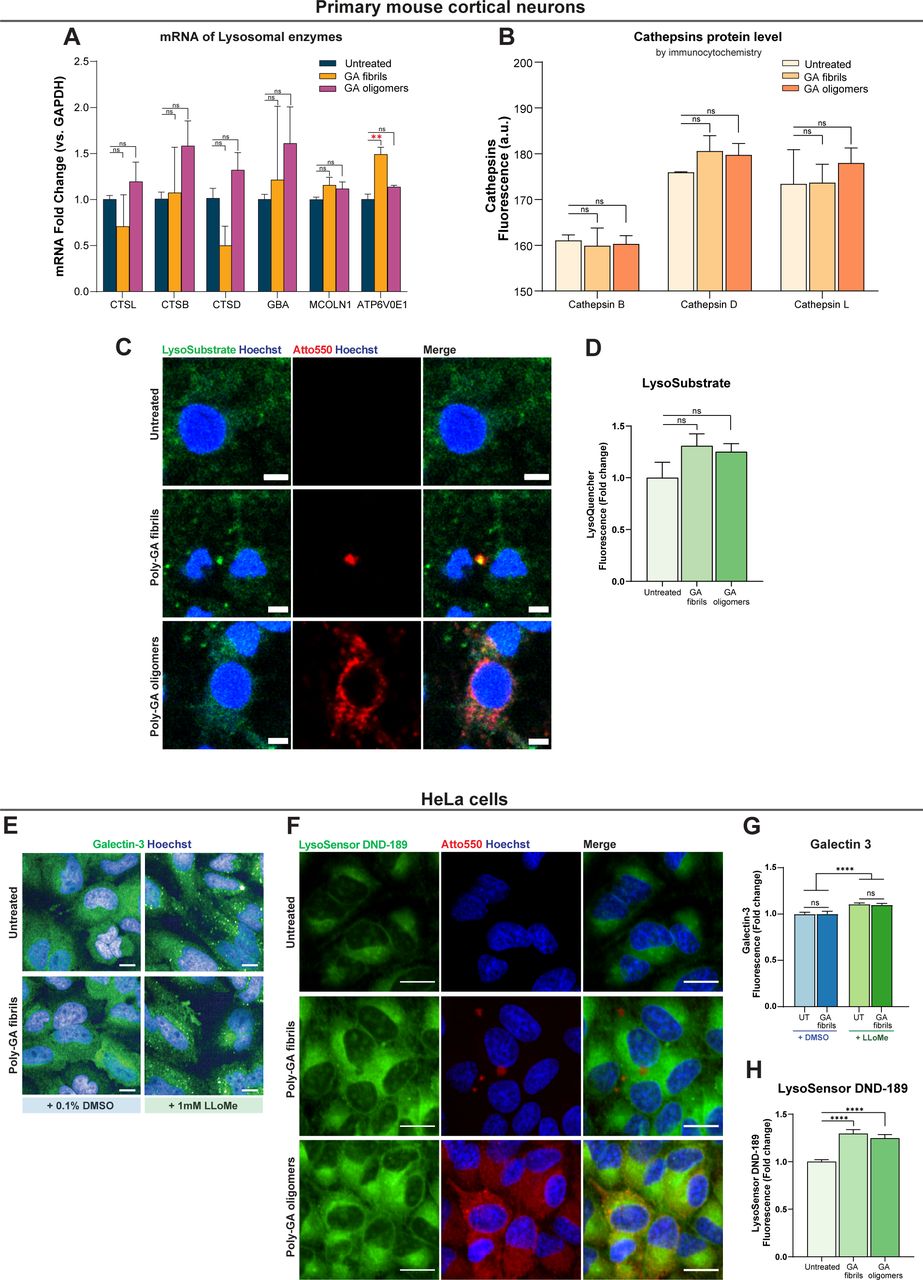
- Figure S7. Poly-GA exposure does not lead to major lysosomal damage but alters lysosomal acidification.
(A) Quantification of relative expression levels after RT-qPCR for genes involved in lysosomal metabolism. RNA was isolated from primary mouse cortical neurons (10 d in culture) exposed or not to 1 µM poly-GA oligomers or 1 µM poly-GA fibrils for 24 h, retrotranscribed and subjected to quantitative real-time PCR. Only the transcriptional levels of ATP6V0E1 (a component of the V-ATPase) were increased upon treatment with poly-GA fibrils compared with control untreated neurons. One-way ANOVA with Tukey’s multiple-comparisons test. **P ≤ 0.01. The data were collected from three independent biological replicates. (B) Immunofluorescence assays were used to compare the protein levels of cathepsins L, B, and D in primary mouse cortical neurons exposed to 1 µM dipeptide repeats (DPRs) for 24 h vs untreated neurons. The cathepsin levels in DPR-treated and untreated cells were comparable. One-way ANOVA with Tukey’s multiple-comparisons test. ns = P > 0.05. The data were collected from two independent biological replicates. (C) Primary mouse cortical neurons were exposed to 1 µM poly-GA DPRs for 24 h (or were left untreated), and Lysosome-Specific Self-Quenched Substrate (#ab234622; Abcam) was added during the final 1 h of the 24-h period to measure lysosomal in situ enzyme activity. Scale bars = 5 µm. (D) Mean fluorescence intensity of Lysosome-Specific Self-Quenched Substrate was quantified per neuronal cell. Bar graphs of mean ± SEM. One-way ANOVA with Tukey’s multiple-comparisons test. ns = P > 0.05. The data were collected from three independent biological replicates. (E) The galectin-3 immunofluorescence assay was used to compare galectin-3 protein levels in HeLa cells exposed or not exposed to 1 µM poly-GA fibrils for 24 h. During the last 1 h of the 24-h span, the lysosomotropic drug LLoMe (at 1 mM) was used to induce lysosomal damage, which is visible by galectin-3 puncta formation (positive control). Scale bars = 10 µm. (F) HeLa cells were exposed to 1 µM poly-GA DPRs for 24 h (or were left untreated), and LysoSensor Green DND-189 was added during the final 1 h of the 24-h period to measure changes in lysosomal pH (this dye exhibits increasing fluorescence as pH decreases). Scale bars = 20 µm. (G) Regardless of LLoME treatment, the levels of galectin-3 did not differ between HeLa cells exposed or not exposed to poly-GA fibrils. Bar graphs of mean ± SEM. Unpaired two-tailed t test with Welch’s correction. ns = P > 0.05. The data were collected from three independent biological replicates. (H) Mean fluorescence intensity of LysoSensor was quantified in live HeLa cells. Bar graphs of mean ± SEM. One-way ANOVA with Tukey’s multiple-comparisons test. ****P ≤ 0.0001. The data were collected from three independent biological replicates.
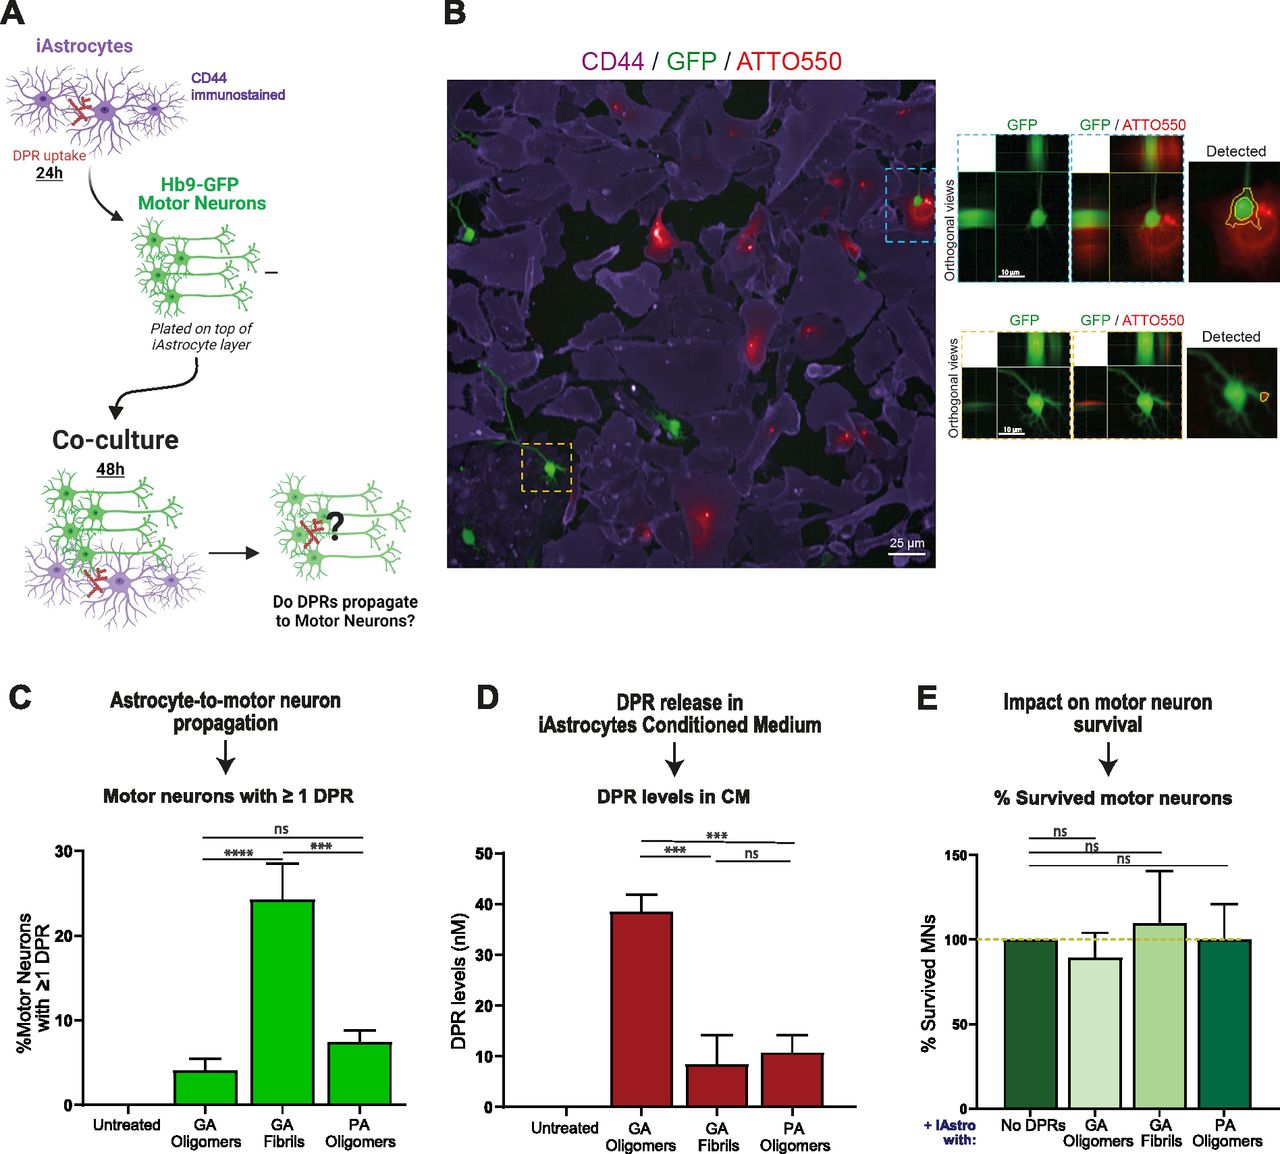
- Figure 6. Alanine-rich dipeptide repeats (DPRs) undergo astrocyte-to-motor neuron propagation.
(A) Schematic representation of the iAstrocytes-MNs co-culture system; the figure was created with BioRender.com under academic license. (B) Orthogonal views from confocal images show the presence of 1 µM ATTO550 DPRs (red) in the GFP-positive MNs (green); CD44 is shown in violet as the astrocytic marker. (C) Quantification of the percentage of motor neurons containing at least one DPR aggregate in the various 48 h co-culture systems. Bar graphs of mean ± SEM. One-way ANOVA with Tukey’s multiple-comparisons test. ∼120 neurons/condition. ns = P > 0.05, ***P ≤ 0.001, and ****P ≤ 0.0001. The data were collected from three independent biological replicates. (D) Quantification of DPR levels present in the conditioned medium of healthy iAstrocytes, via spectrophotometric analysis. Bar graphs of mean ± SEM. One-way ANOVA with Tukey’s multiple-comparisons test. ns = P > 0.05, and ***P ≤ 0.001. The data were collected from four independent biological replicates. (E) Quantification of motor neuron survival upon 48 h co-culture with iAstrocytes containing and transmitting DPRs. Bar graphs of mean ± SEM. One-way ANOVA with Tukey’s multiple-comparisons test. ∼120 neurons/condition. ns = P > 0.05. The data were collected from three independent biological replicates.
- Figure S8. Apolipoprotein J (APOJ) ELISA.
APOJ protein levels were measured in three distinct healthy lines of iAstrocytes’ conditioned medium. (A) Regression analysis with the Four-parameter logistic curve-fit (4-PL) method was used to determine the best-fit standard curve based on twofold serial dilutions of APOJ standards and absorbance at 450 nm. (B) iAstrocytes were either left untreated or treated for 24 h with various recombinant DPRs at 1 µM (poly-GA34 fibrils, poly-GA34 oligomers, poly-PA50 oligomers, and poly-GP24 oligomers), and then APOJ protein levels in their conditioned medium were measured and calculated using the previously generated 4-PL standard curve. Bar graphs of mean ± SEM. One-way ANOVA with Tukey’s multiple-comparisons test (control group is “untreated”). *P ≤ 0.05, **P ≤ 0.01, ***P ≤ 0.001, and ****P ≤ 0.0001.


Tables
Patient sample Cell type Gender Ethnicity Age at biopsy collection (years) 155v2 Healthy control Male Caucasian 40 161 Healthy control Male Caucasian 31 CS14 Healthy control Female Caucasian 52 - Table 2.
DNA sequences of RT-qPCR primers (Mus musculus) as they were ordered from Sigma-Aldrich.
Gene symbol Primer forward (5′-3′) Primer reverse (5′-3′) ATP6V0E1 GGGTCCTAACCGGGGAGTTA ACAGAGGATTGAGCTGTGCC CTSB GCTCTTGTTGGGCATTTGGG ACTCGGCCATTGGTGTGAAT CTSD CTTGGGCATGGGCTACCCTC TTGCCCTTCTGGGTCCCTGTT CTSL CGCCTTCGGTGACATGACCA TCTTGTGCTTCTGGTGGCGG GAPDH GGTCATGAGCCCTTCCACAA TGAAGGGTGGAGCCAAAAG GBA GGGCAGCAAACTCCCTAGCAG GGATGCAGGGTTGGGCACCATA MCOLN1 TGCTGTGGACCAGTACCTGA GTAGTACCGCTGGCAGAGAG
- Video 1
3D-volume and -surface rendering of poly-GA phase-separated oligomers at 20 µM and 24 h in low salt solution in the test tube. After deconvolution, 3D-surface rendering algorithms were applied to better visualize the massive and compact structure of the assemblies, along with concavity features. Deconvolution and 3D-rendering criteria are explained in the section Materials and Methods Details_Coalescence measurements. Download video
- Video 2
3D-volume and surface rendering of poly-PA phase-separated oligomers at 20 µM and 24 h in low salt solution in the test tube. The application of 3D-rendering algorithms on deconvolved data enables to better appreciate the presence of extremely circular poly-PA droplets (average circularity = 0.95) coalescing in the test tube. The 3D-reconstructions exhibit a bulk loss of sphericity of the assemblies in the three-dimensional space concomitant with elongation along the z-axis; this is due to poor Z-axis resolution. Deconvolution and 3D-rendering criteria are explained in the section Materials and Methods Details_Coalescence measurements. Download video
- Video 3
3D-volume and surface rendering of iAstrocyte-mediated uptake of poly-GA fibrils. The movie illustrates the presence of the aggregates in the perinuclear region of the cell, by showing the lateral view of the cell along the XZ axes. Red = ATTO550 poly-GA fibrils; Green = Vimentin-stained cell. Download video
- Video 4
The iAstrocyte-mediated uptake of poly-GA fibrils (same of Video 3) is further presented as dynamic orthogonal views (XZ, YZ) moving along the Z-stack planes. Download video
- Video 5
Poly-GA fibrils undergo a mixture of Brownian motion, directed motion, and constrained motion after 24-h uptake in a healthy iAstrocyte cell. Poly-GA fibrils are colour-coded by the signal intensity (blue = min; red = max). 60 frames were imaged at 1 Hz at ∼190 nm lateral resolution in Airyscan mode. Deconvolution was applied to each frame, and the movie was generated as reported in the section Materials and Methods Details. Fibrils were, by approximation, treated as single particles and their trajectories were analysed by mean square displacement (MSD(Δt) analysis). Download video
- Video 6
Accumulation of poly-GA dipeptide repeats (magenta) in large axonal swellings (arrow heads) along the axons of primary mouse cortical neurons. By zooming into few axonal swellings with higher resolution (AiryScan mode), during live-imaging, we report the presence of small poly-GA proteins (by ATTO550 fluorescence) erratically moving within each axonal swelling overtime. Download video
- Video 7
Poly-GA dipeptide repeats (magenta) and LysoTracker Green (green) in large axonal swellings (arrow heads) along the axons of primary mouse cortical neurons. The time-lapse shows that axonal swellings contain Poly-GA dipeptide repeats that strongly colocalize with lysosomal organelles. Download video
- Video 8
The movie shows a three-dimensional view of colocalization between all the dipeptide repeats (magenta) and the lysosomes (green) contained in the proximal axons of mouse cortical neurons. Each region-of-interest is delimited by a white square. On the right panel of the movie, each region-of-interest is presented in a zoomed view moving through the Z-planes of the Z-stack dataset. This shows that colocalization between dipeptide repeats and lysosomes is consistent throughout the three-dimensional space. Download video
- Video 9
The movie compares wide-field imaging to dSTORM imaging. Both imaging modalities were used on the same iAstrocyte cell that had been previously exposed to ATTO647N-polyGA fibrils. The comparison is explained in terms of a few technical aspects, such as xy resolution achieved, laser power used, and imaging principles used. Download video


In this Issue
Related Articles
Cited By...
- No citing articles found.