


Article Figures & Data
Figures
- Figure 1. DUSP4 deficiency leads to an impaired cell proliferation and cell death in mutant melanoma cells.
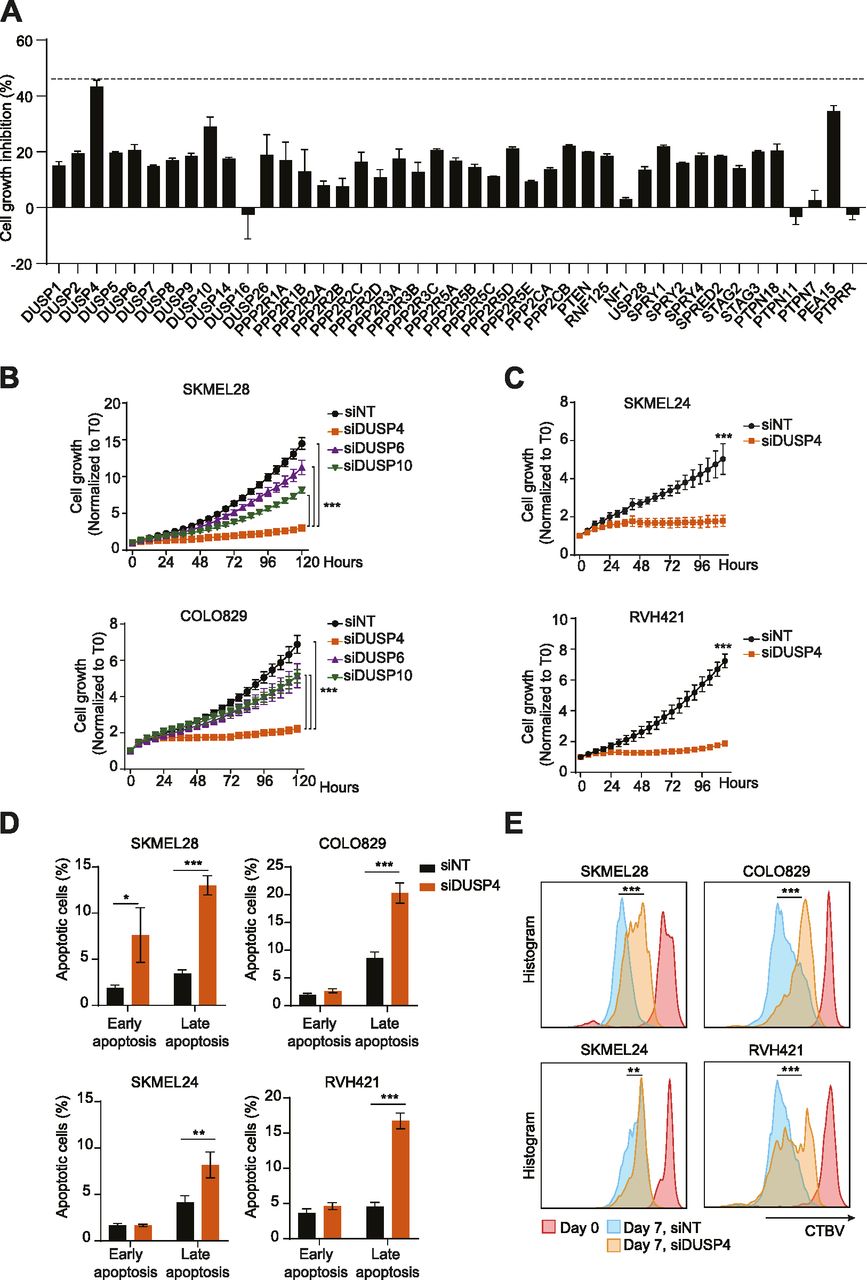
(A) SKMEL28 cells were transfected with a customized siRNA library targeting the most known MAPK negative or crosstalk regulators as well as nontargeting control. The graph represents the percentage of cell growth inhibition normalized against nontargeting transfected cells, which were given the value of 0. The dashed line indicates the highest cell growth inhibition (up to 43%) observed upon DUSP4 down-regulation. Data represent mean ± SEM of three technical replicates. (B, C) SKMEL28, COLO829 (B), SKMEL24, and RVH421 (C) melanoma cells were transfected with indicated siRNAs against DUSP4, DUSP6, DUSP10, or with a nontargeting control. Graphs show the growth curves of transfected cells by measuring cell confluence over time. Cell growth values were normalized against time 0. Data are mean ± SEM, n = 3. (B, C) Statistical significance was calculated between siDUSP4 cells and the other conditions either at 120 (B) or 102 (C) h. (D) Transfected cells were collected after 7 d and were stained with Annexin V and Zombie dyes to analyze cell death by FACS. Early apoptosis displays the percentage of Annexin V+/Zombie− cells, whereas late apoptosis shows the percentage of Annexin V+/Zombie+ cells. Graphs show the quantification of three independent experiments. Statistical significance was calculated between the siNT and siDUSP4 conditions. (E) Transfected cells were stained with Cell Tracer Brilliant Violet (CTBV) and analyzed by CTBV incorporation after 15 min (day 0) or after 7 d (day 7). Different times and conditions are shown by different colors. Data are mean ± SEM, n = 3. Statistical significance was calculated between siNT and siDUSP4 cells at day 7.
- Figure S1. siRNA-based screening led to the identification of DUSP4 as the major oncogene overdose regulator in melanoma cells.
SKMEL28 cells were transfected with a customized siRNA library targeting the most known MAPK negative regulators and nontargeting control (Table S4). Graphs show the growth curves of transfected cells by measuring cell confluence over time. Cell growth values were normalized against time 0. Data represent mean ± SEM of four technical replicates.
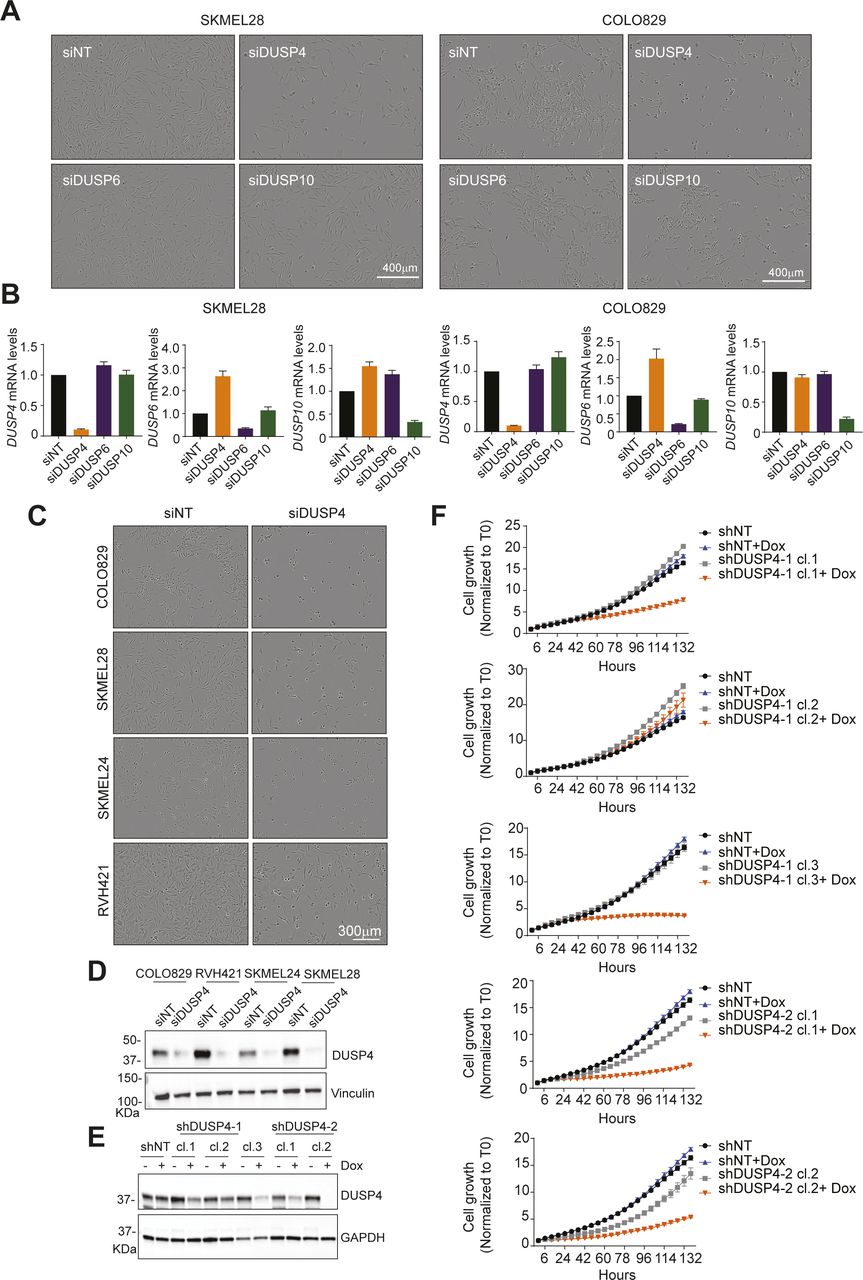
- Figure S2. DUSP4 knockdown shows an impaired cell growth in melanoma cells.
(A) SKMEL28 and COLO829 melanoma cells were transfected with siRNAs against DUSP4, DUSP6, DUSP10, or with a nontargeting control. The panels show representative images of the cell growth after 5 d of transfection. (A, B) Cells were treated as in (A). mRNA levels of DUSP4, DUSP6, and DUSP10 were determined by RT–qPCR and were referred to the expression level of siNT cells. Data are normalized to GAPDH and represent mean of three independent experiments. (A, C) Cells were transfected with siRNAs against DUSP4 or with a nontargeting control as in (A). The panels show representative images of the cell growth after 5 d of transfection. (D) Lysates from siNT and siDUSP4 transfected melanoma cells were analyzed by immunoblotting at 48-h post-transfection. (E) Dox-inducible shDUSP4 (shDUSP4-1 and shDUSP4-2) and nontargeting control (shNT) SKMEL28 cell clones were treated with or without doxycycline (0.5 μg/ml). After 48 h, cell lysates were analyzed by Western Blot. (F) Cell growth from Dox-inducible shDUSP4 (shDUSP4-1 and shDUSP4-2) and nontargeting control (shNT) SKMEL28 cell clones was analyzed by Incucyte over time.
- Figure 2. ERK activation state modulates cell vulnerability upon DUSP4 knockdown.
(A) Mutant melanoma cells (COLO829 and SKMEL28) were transfected with siRNA against DUSP4 or nontargeting control. 48 h later, cell lysates were analyzed by Western blot. (B) Transfected cells were treated with trametinib (Tram) at the indicated concentrations or with DMSO as a vehicle (0 nM). Lysates of the two melanoma cells were analyzed by immunoblot after 48 h of treatment. Band intensities were analyzed by ImageJ software, and the P-ERK/vinculin ratio is indicated. (C) Cells were treated as in (B), and the cell growth was analyzed by measuring cell confluence over time. Cell growth values were normalized against time 0. Data are mean ± SEM, n = 3. In the first two conditions (Tram 0.25 nM and Tram 0.5 nM), statistical significance was calculated between siDUSP4 versus siDUSP4+ Tram at 138 h. Samples treated with Tram 1 nM; the significance was calculated between siDUSP4 versus siDUSP4+ Tram or siNT versus siNT+Tram at 138 h. (D) Transfected cells treated with or without Tram (0.25 nM) were stained with Cell Tracer Brilliant Violet (CTBV) and analyzed by CTBV incorporation the same day of the staining (day 0) or after 7 d (day 7). Different times are shown by different colors. Data are mean ± SEM, n = 3. Statistical significance was calculated between siDUSP4 versus siDUSP4+ Tram at day 7. (E) Transfected cells were treated with or without Tram (0.25 nM), and cell death was assayed by Annexin V and Zombie stainings. Early apoptosis indicates the percentage of Annexin V+/Zombie− cells, whereas late apoptosis shows the percentage of Annexin V+/Zombie+ cells. Data are mean ± SEM, n = 3. Statistical significance was calculated between siDUSP4 versus siNT or siDUSP4+ Tram.
- Figure S3. DUSP4-induced ERK hyperactivation is the major event leading to oncogenic overdose phenotype.
(A) SKMEL28 was transfected with siRNA against DUSP4 and nontargeting control and treated with trametinib at the indicated concentrations or with DMSO as a vehicle. Representative images after 5 d post-transfection are shown. (B) SKMEL28 and COLO829 were transfected cells as in (A) and were treated with cobimetinib at the indicated concentrations. The cell growth was analyzed by measuring cell confluence over time. Cell growth values were normalized against time 0. Data are mean ± SEM, n = 2. (C) SKMEL28 and COLO829 were transfected cells as in (A) and were treated with cobimetinib (Cobi) at the indicated concentrations or with DMSO as a vehicle (0 nM). Forty-eight hours later, lysates of the two melanoma cell lines were analyzed by immunoblot. Band intensities were analyzed by ImageJ software, and the P-ERK/GAPDH ratios are indicated in the histograms. Data represent mean ± SEM of three independent experiments. Statistical significance was calculated against siNT or siDUSP4. (D) Cells were transfected cells as in (A) and were treated with a p38i (Skepinone-L) at the indicated concentrations or with DMSO as a vehicle (0 nM). The cell growth was analyzed by measuring cell confluence over time. Cell growth values were normalized against time 0. Data are mean ± SEM, n = 2. (E) Cells were treated with a p38i (Skepinone-L) at the indicated concentrations or with DMSO as a vehicle (0 nM). One hour later, cells were treated for 1 h with 100 μM H2O2, and cell lysates of both COLO829 and SKMEL28 were analyzed by immunoblot. Band intensities were analyzed by ImageJ software, and the P-HPS27/GAPDH ratios are indicated in the histograms. Data represent mean ± SEM of three independent experiments. Statistical significance was calculated against untreated cells or H2O2 treated cells.
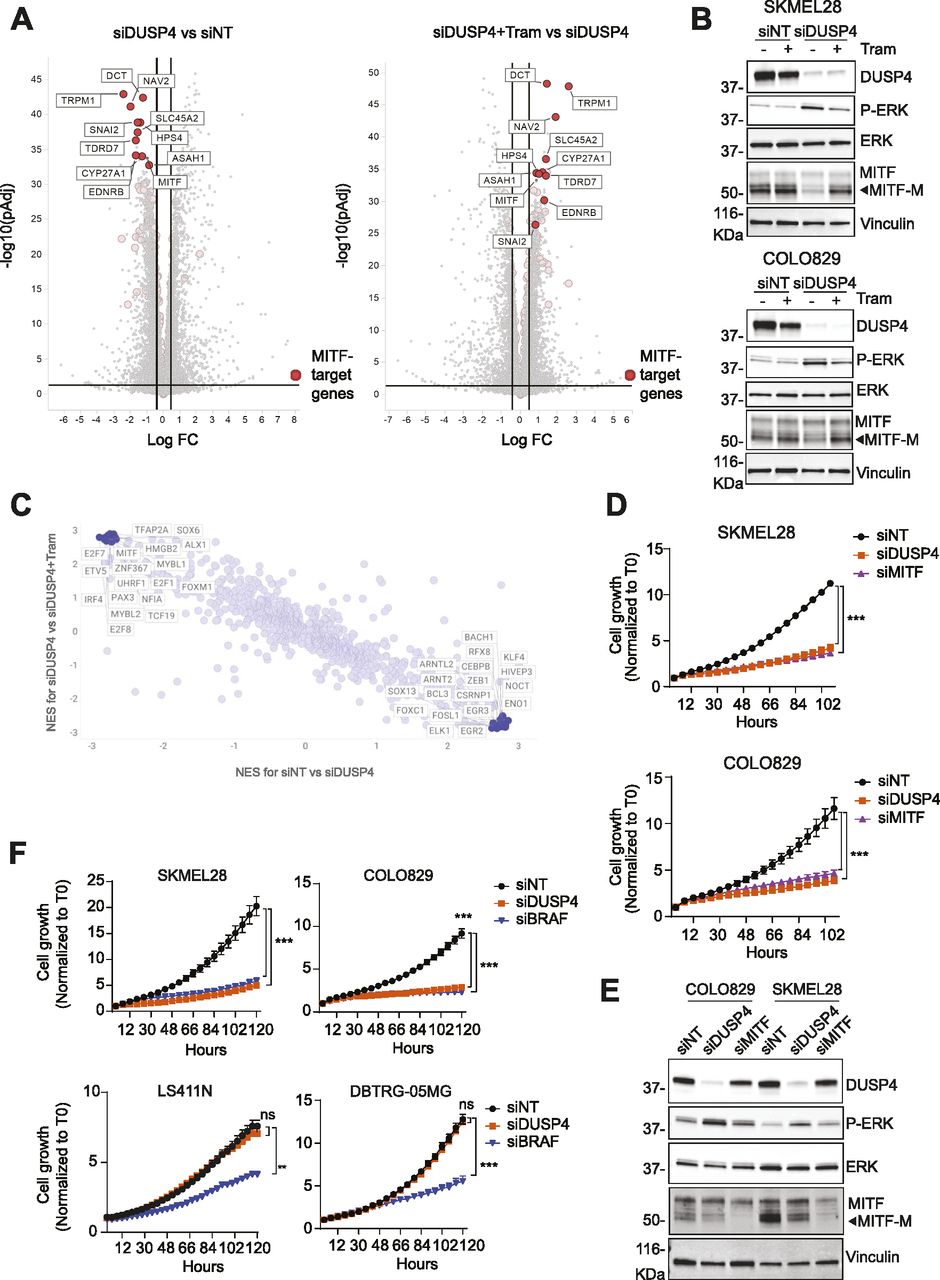
- Figure 3. DUSP4-dependent ERK activation leads to the suppression of the MITF pathway in mutant melanoma.
(A) SKMEL28 cells were transfected with siRNA against DUSP4 or nontargeting control with or without trametinib (Tram) at 0.25 nM. After 48 h, cells were collected, and RNA-seq experiments were performed. Volcano plots display differentially expressed genes from the RNA-seq analysis between siDUSP4 and siNT or between siDUSP4+ Tram and siDUSP4 (right panel). The vertical axis (y-axis) corresponds to the mean expression value of log10 (q-value), and the horizontal axis (x-axis) displays the log2 fold change value. Positive x-values represent up-regulated genes, and negative x-values represent down-regulated genes. MITF target genes are labeled in red (23). (B) Cells were treated as in (A), and 48 h later, lysates were analyzed by immunoblot. (C) Transcription factor activities were inferred based on the RNA-seq data using the msviper (Virtual Inference of Protein-Activity by Enriched Regulon analysis) algorithm. The activity of transcription factors was analyzed comparing y-axis: NES for siDUSP4 versus siDUSP4+ Tram or x-axis: NES for siNT versus siDUSP4. Positive values in both axes represent increased activity, whereas negative values represent decreased activity. (D) Cells were transfected with siRNA against DUSP4, MITF, and nontargeting as the control. The cell growth was analyzed by measuring cell confluence over time. Cell growth values were normalized against time 0. Data are mean ± SEM, n = 3. Statistical significance was calculated between siNT versus siDUSP4 and siMITF conditions at 108 h. (E) Lysates from transfected cells were also analyzed by immunoblotting. (F) BRAFV600E cells from melanoma (SKMEL28 and COLO829), colorectal cancer (LS411N), and glioblastoma (DBTRG-05MG) were transfected with siRNA against BRAF and DUSP4. The cell growth was analyzed by measuring cell confluence over time. Cell growth values were normalized against time 0. Data are mean ± SEM, n = 3. Statistical significance was calculated between siNT versus siDUSP4 and siBRAF conditions at 120 h.
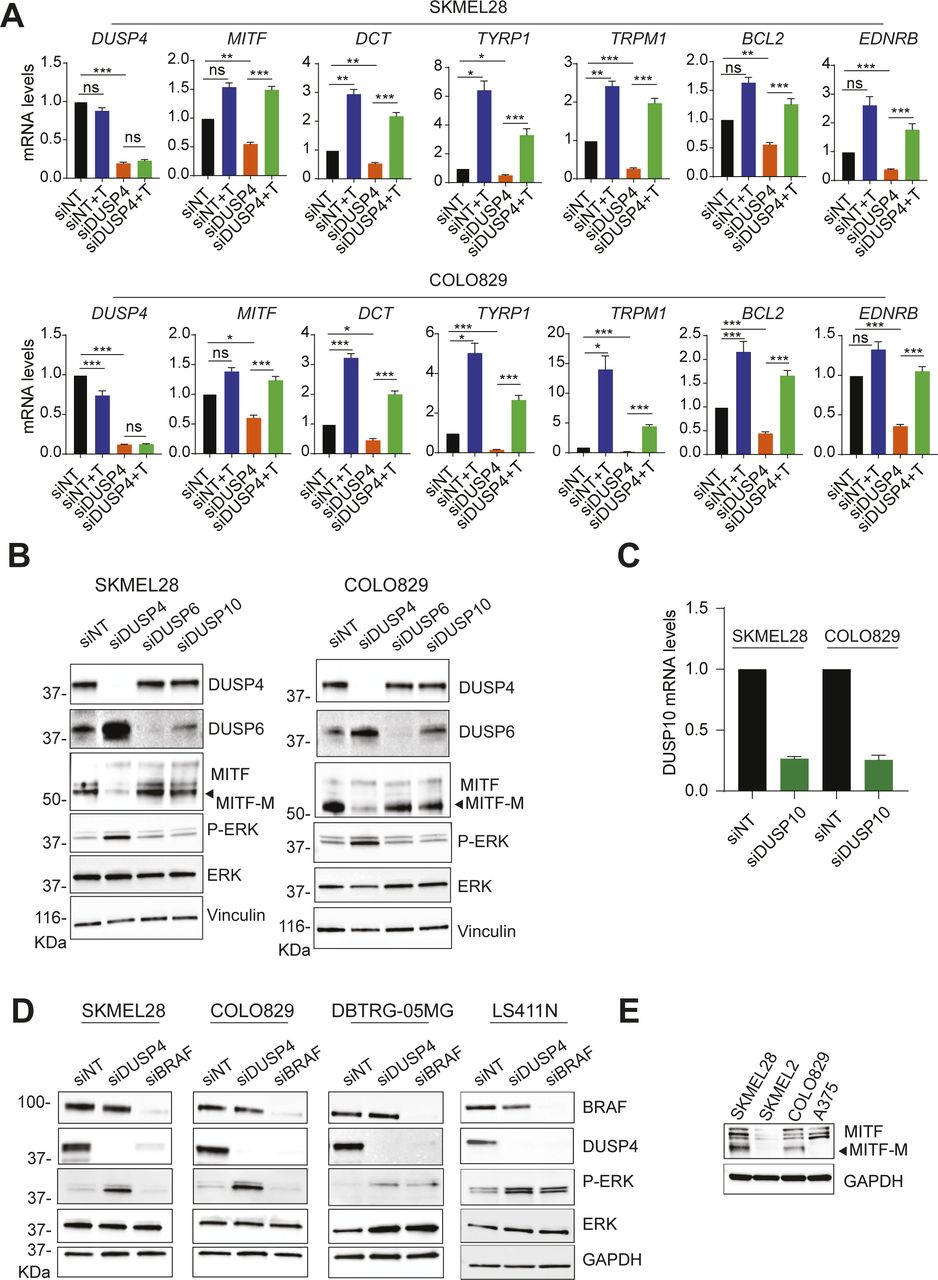
- Figure S4. DUSP KD leads to a suppression of MITF-dependent gene expression.
(A) mRNA levels of MITF and its related genes were analyzed by RT–qPCR 48-h post-transfection and were referred to the expression level of siNT cells. Data are normalized to GAPDH and represent mean of three independent experiments. Statistical significance was calculated between siNT versus NT+T and siDUSP4 and siDUSP4 versus siDUSP4+ Tram. (B, C) Cells were transfected with siRNA against nontargeting control and DUSP4, DUSP6, DUSP10. (B, C) Forty-eight hours later, cell lysates were analyzed by Western blot (B), and DUSP10 mRNA levels were measured by RT–qPCR (C). Data are mean ± SEM, n = 2. (D) BRAF-mutant cell lines from different tissues were transfected with siRNA against DUSP4 and BRAF. After 48 h, cell lysates were analyzed by immunoblot. (E) MITF protein levels were assessed in the indicated BRAF-mutant cell lines by immunoblot.
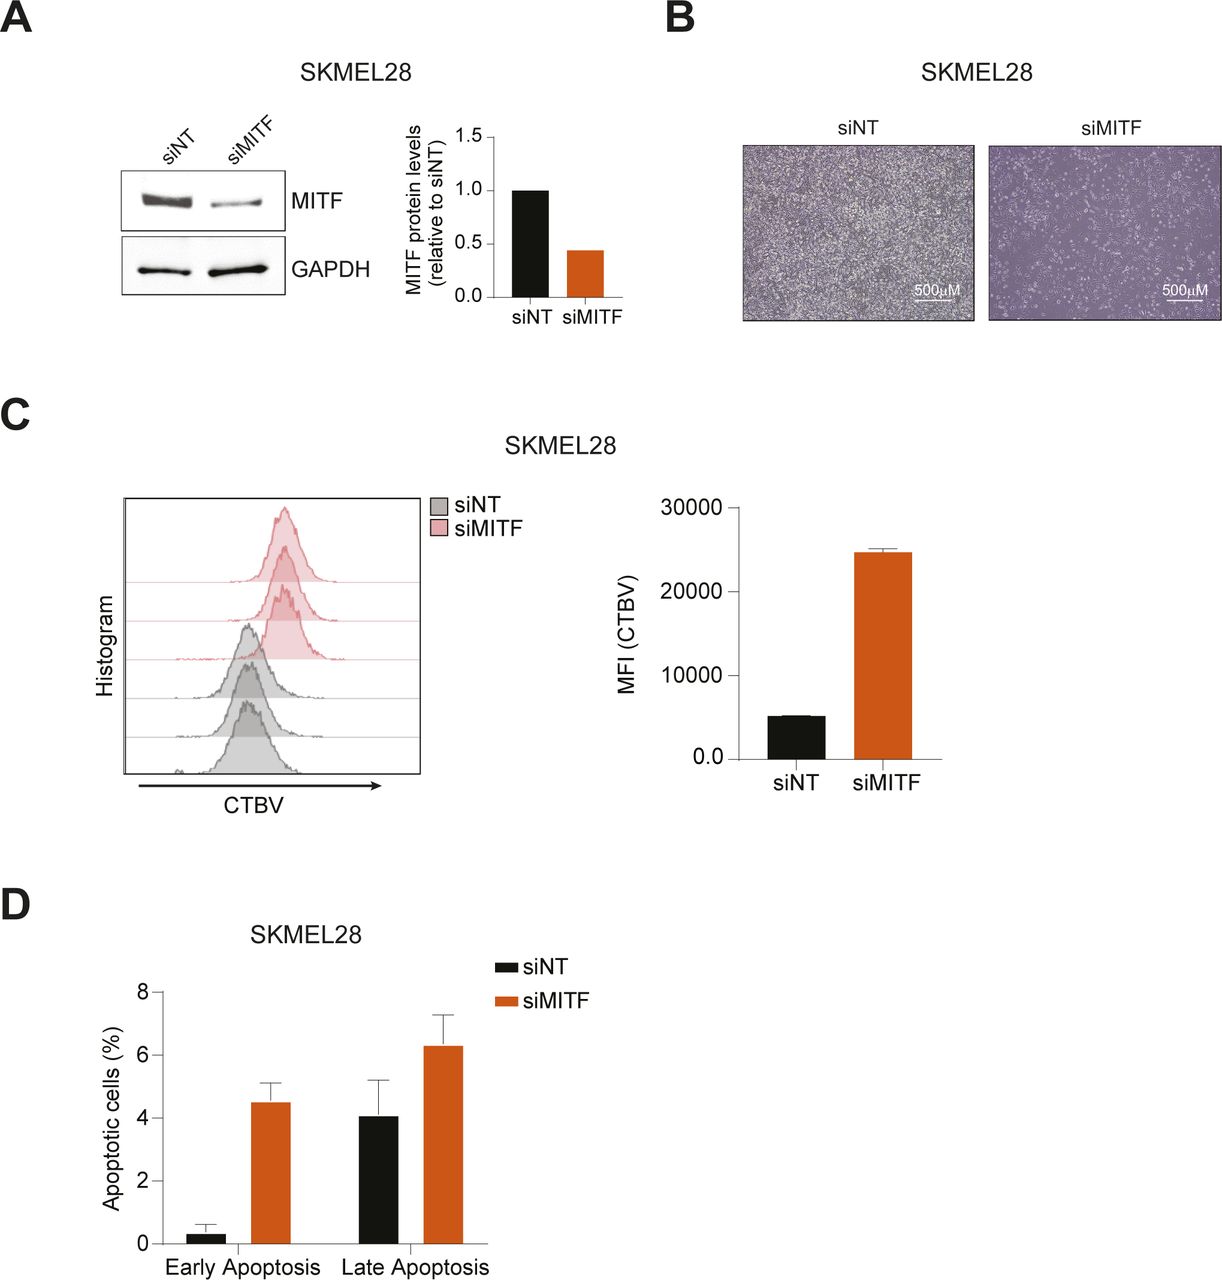
- Figure S5. Analysis of cell proliferation and cell death upon MITF knockdown.
(A) SKMEL28 was transfected with siRNA against MITF (siMITF) or nontargeting control (siNT). After 48 h, cell lysates were analyzed by Western blot. Band intensities were quantified by ImageJ software, and the MITF/GAPDH ratio is indicated of the blot shown. (B) Phase-contrast images are shown depicting cell confluence and morphology 7 d after the transfection. (C) Transfected cells were stained with Cell Tracer Violet (CTBV) and analyzed by CTBV incorporation the same day of the staining (day 0) or after 7 d (day 7). The CTBV incorporation at day 7 is shown. Histogram indicates mean fluorescence intensity (MFI) of siNT and siMITF transfected cells at day 7. Data represent mean ± SEM of four technical replicates. (D) Cell death was assayed by Annexin V and Zombie stainings. Early apoptosis indicates the percentage of Annexin V+/Zombie− cells, whereas late apoptosis shows the percentage of Annexin V+/Zombie+ cells. Data represent mean ± SEM of four technical replicates.
Source data are available for this figure.
Source Data for Figure S5[LSA-2021-01235_SdataF4_FS5.pdf]
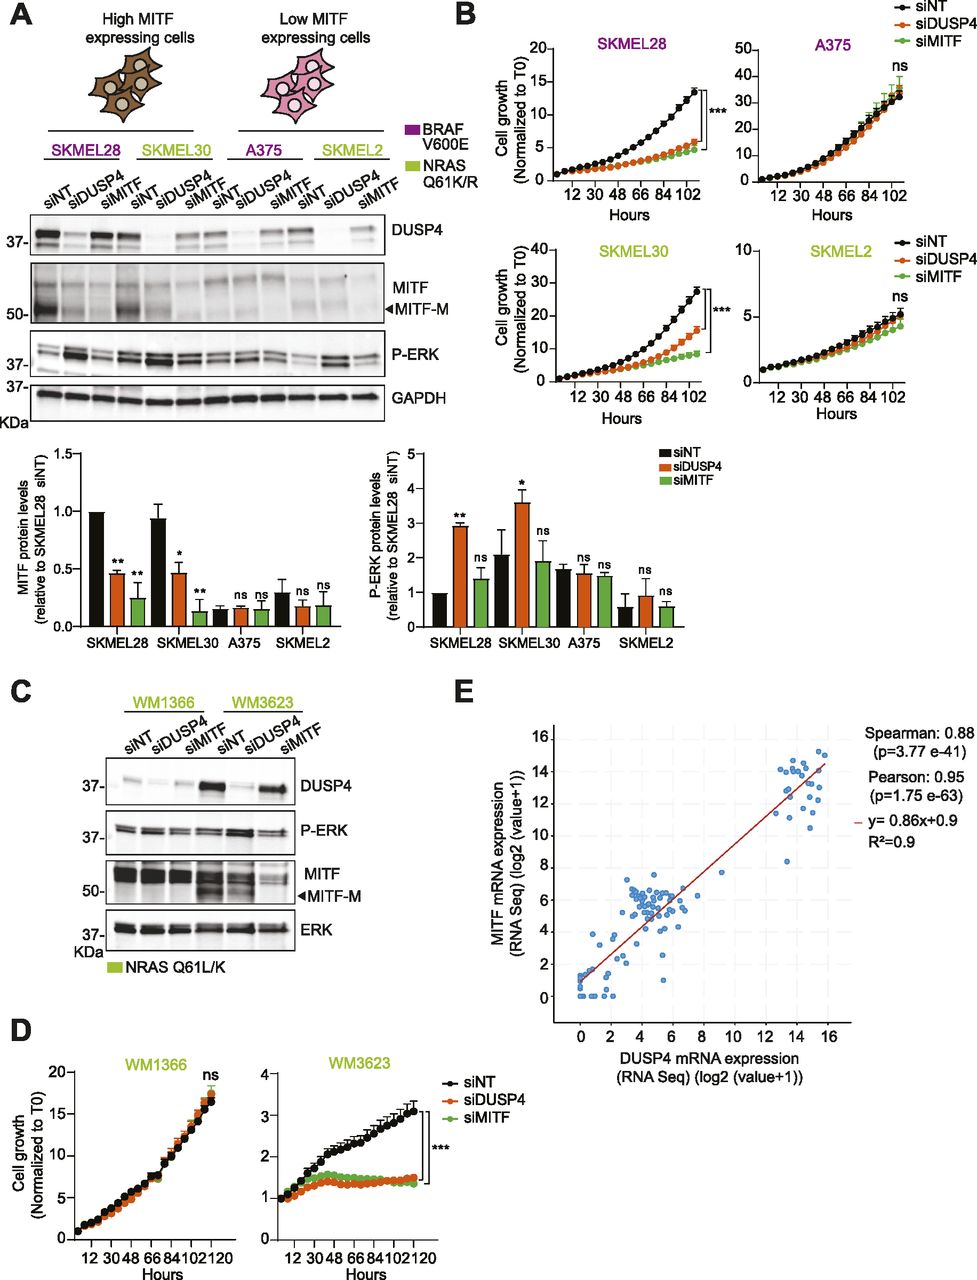
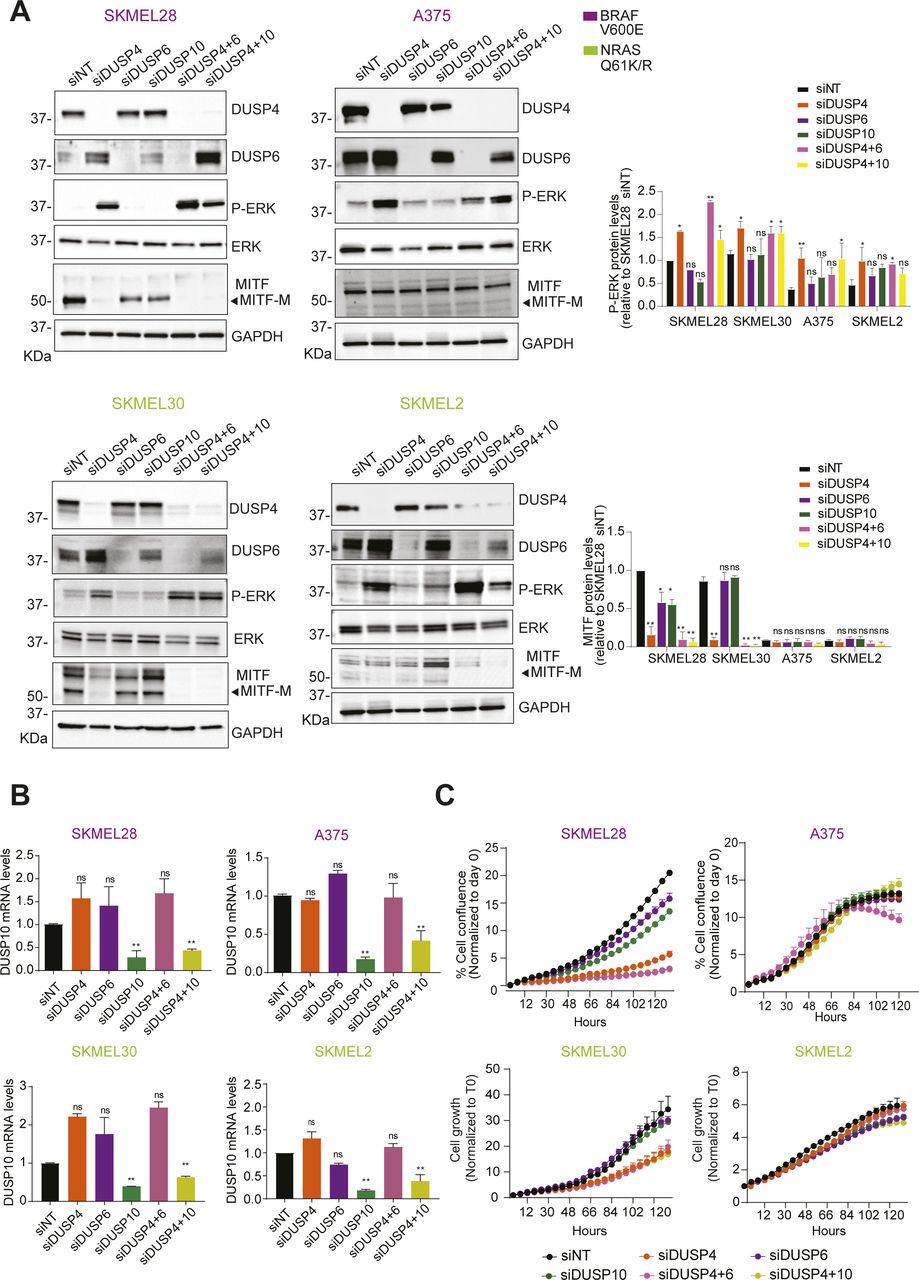
- Figure 4. Intracellular MITF levels determine the essential role of DUSP4 in melanoma independently of the oncodriver mutation.
(A) BRAFV600E cells labeled in purple (SKMEL28, A375) and NRAS Q61K/R cells labeled in green (SKMEL30, SKMEL2, respectively) were transfected with siRNA against DUSP4, MITF, and nontargeting control. After 48 h, cell lysates were analyzed by Western blot. The upper cartoons classify melanoma cells according on their MITF expression levels. High levels of MITF are shown in brown, whereas low levels of MITF are labeled in pink. Band intensities were analyzed by ImageJ software, and the P-ERK/GAPDH and MITF/GAPDH ratios are indicated in the histogram. Data represent mean ± SEM of three independent experiments. Statistical significance was calculated against siNT for each different cell line. (B) Cells were treated as in (A), and cell growth was analyzed by measuring cell confluence over time. Graphs show cell growth curves normalized against time 0. Data are mean ± SEM, n = 3. Statistical significance was calculated between siNT versus siDUSP4 condition at 102 h. (C) Patient-derived cell lines containing NRAS Q61L/K mutation (WM1366 and WM3623, respectively) were transfected as in (A). After 48 h, cell lysates were analyzed by Western blot. (D) WM1366 and WM3623 cells were treated as in (A), and cell growth was analyzed by measuring cell confluence over time. Graphs show cell growth curves normalized against time 0. Data are mean ± SEM, n = 3. Statistical significance was calculated between siNT versus siDUSP4 condition at 120 h. (E) Co-expression analysis of DUSP4 and MITF in human melanoma. Bivariate and rank correlation analysis of combined gene expression data (n = 124) from four separate studies available through cBioportal (33).
Source data are available for this figure.
Source Data for Figure 4[LSA-2021-01235_SdataF4_FS5.pdf]
- Figure S6. DUSP4 silencing–induced ERK overactivation plays an essential role in causing toxic effects of MITF-proficient melanoma cells independently of the oncodriver mutation.
(A, B) High-MITF–expressing cells (SKMEL28, SKMEL30) and low-MITF–expressing cells (A375 and SKMEL2) were transfected either with single siRNA against nontargeting control, DUSP4, and DUSP6 or co-transfected with siRNAs against DUSP4 and DUSP6 (siDUSP4+6) or DUSP4 and DUSP10 (DUSP4+10). (A, B) After 48 h, cell lysates were analyzed by Western blot (A), and DUSP10 mRNA levels were measured by RT–qPCR (B). Band intensities (A) were analyzed by ImageJ software, and the P-ERK/GAPDH and MITF/GAPDH ratios are indicated in the histogram. Data represent mean ± SEM of three independent experiments. Statistical significance was calculated against siNT for each different cell line. (A, C) Cells were treated as in (A), and cell growth was analyzed by measuring cell confluence over time. Graphs show cell growth curves normalized against time 0. Data are mean ± SEM, n = 2.
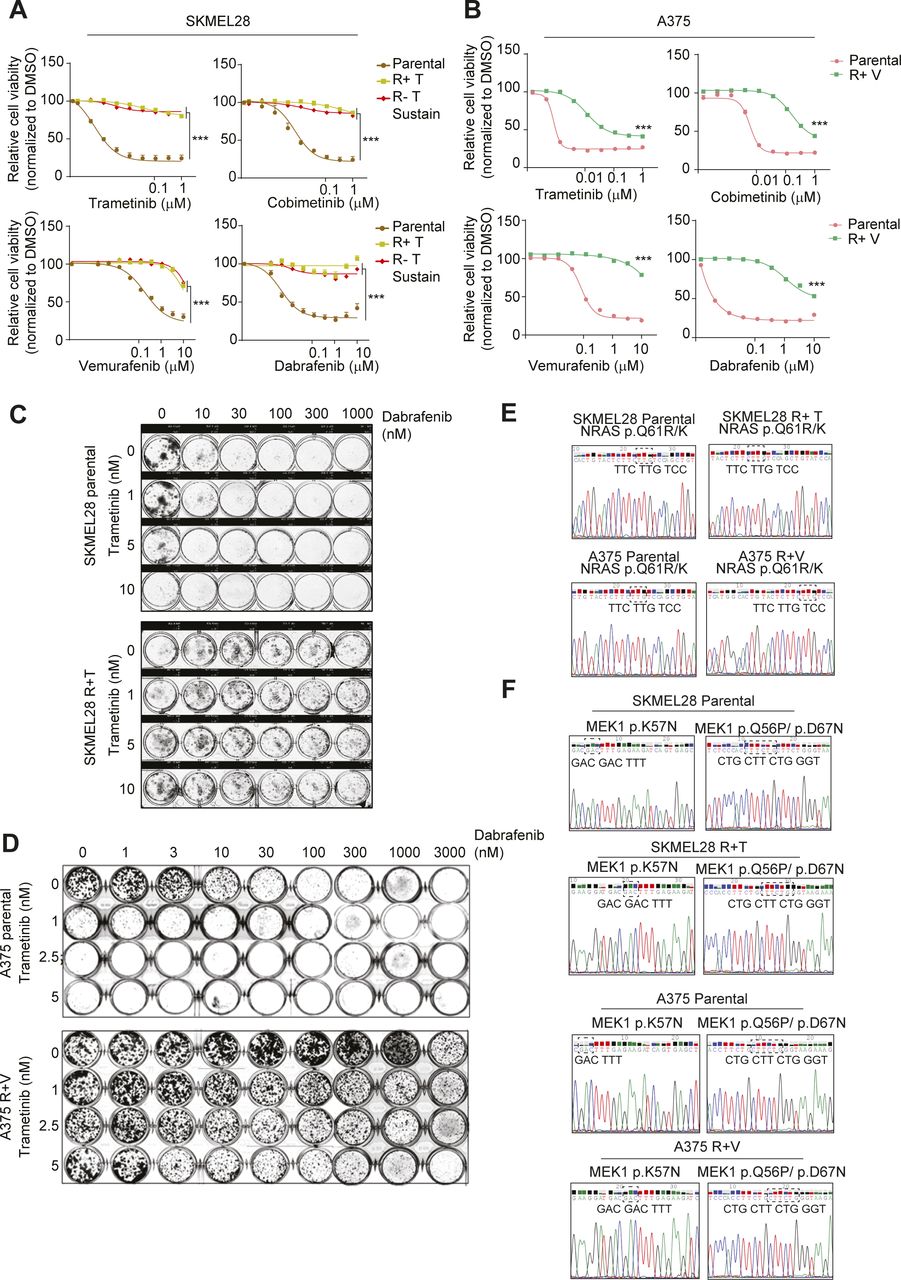
- Figure S7. SKMEL28 and A375 MAPKi resistance profile.
(A, B) SKMEL28 (A) and A375 (B) cells were seeded in the absence of MAPKi and 24 h later were treated with the different MAPKi at increasing concentrations for 72 h before assessment of viability by CellTiter-Glo 2.0. Data are normalized to DMSO and represents mean of three independent experiments. Statistical significance denotes difference between the highest concentration of resistant cells versus parental cells. (C, D) SKMEL28 (C) and A375 (D) cells were seeded and 24 h later treated with increasing concentrations of trametinib and dabrafenib. Cell viability was analyzed by colony formation assay. (E, F) Genomic DNA was isolated from SKMEL28 and A375 parental and resistant cells. (C) NRAS exon 3 was sequenced and analyzed for Q61R/K mutation (c.182A > G). (D) MEK1 exon 2 was sequenced and analyzed for K57N (c. 171 G>T), Q56P (c.167A > C) and D67N (c.199 G>A) mutations. WT sequences are shown in all panels.
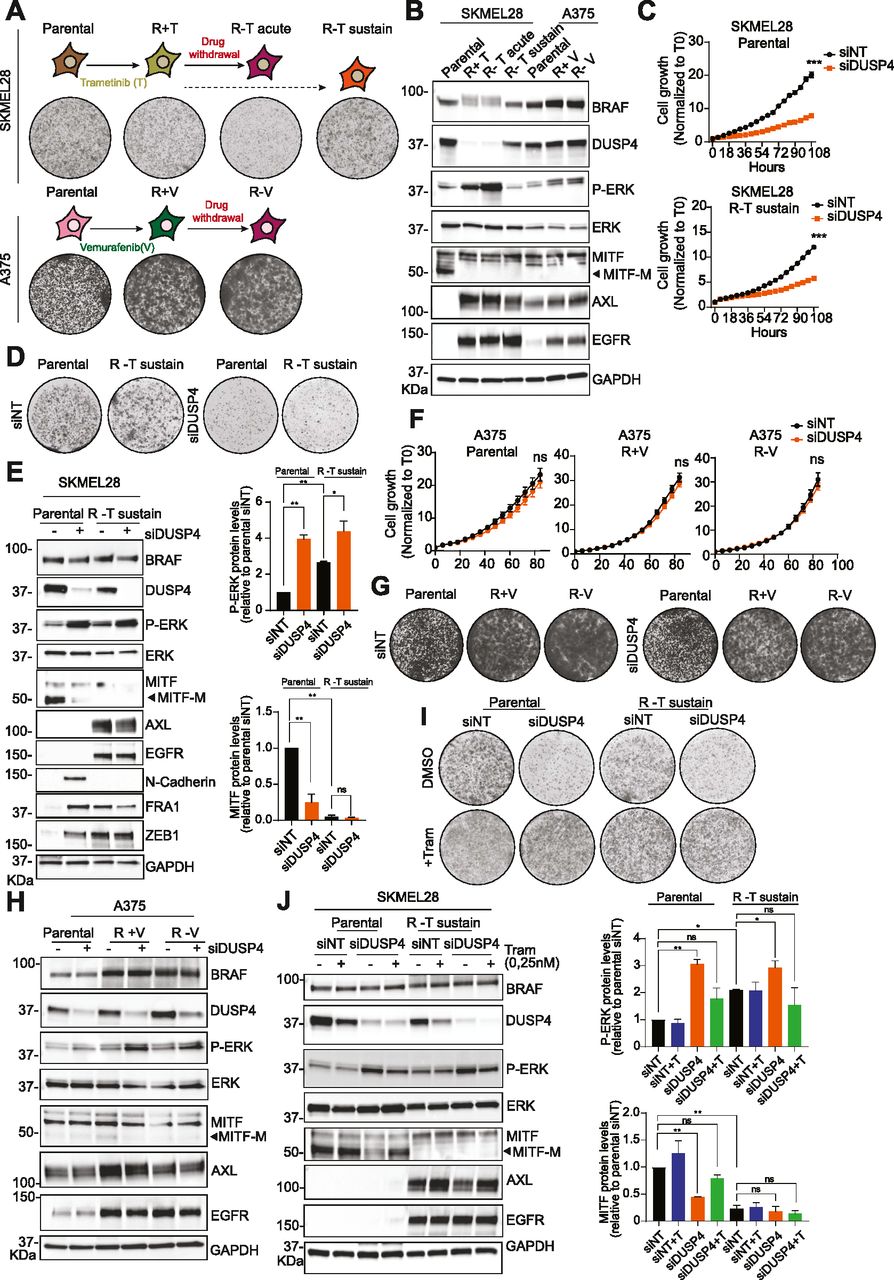
- Figure 5. The critical role of DUSP4 in MAPKi-resistant cells is strictly linked to the MITF expression levels in parental melanoma cells.
(A) Schematic representation of the generation of SKMEL28- and A375-resistant cells. Parental SKMEL28 cells were treated with increasing doses of trametinib (up to 20 nM) until they acquired resistance (R+T cells). Trametinib was removed from R+T in an acute (R−T acute) or sustain (R−T sustain) manner. Parental A375 cells were treated with increasing doses of vemurafenib (up to 2.5 μM) until they acquired resistance (R+V cells). Vemurafenib was removed from R+V cells in an acute way (up to 6 d, R−V cells). Clonogenic growth of parental and resistant cells is shown. (B) Lysates of SKMEL28 and A375 parental and resistant cells were analyzed by immunoblot. (C) SKMEL28 parental and resistant cells with a sustain drug withdrawal (R−T sustain) were transfected with siRNA against DUSP4 and nontargeting as the control, and the cell growth was analyzed by measuring cell confluence over time. Cell growth values were normalized against time 0. Data are mean ± SEM, n = 3. Statistical significance was calculated between siDUSP4 versus siNT condition at 108 h (D) SKMEL28 parental and resistant cells were treated as in C, and cell growth was analyzed by a colony formation assay. Representative images are shown from three independent experiments. (E) SKMEL28 parental and resistant cells were treated as in (C) and after 48 h, and cell lysates were analyzed by Western blot. Band intensities were analyzed by ImageJ software, and the P-ERK/GAPDH and MITF/GAPDH ratios are indicated in the histogram. Data represent mean ± SEM of three independent experiments. Statistical significance was calculated against siNT. (F) A375 parental and resistant cells were transfected with siRNA against DUSP4 and nontargeting as the control, and the cell growth was analyzed by measuring cell confluence over time. Cell growth values were normalized against time 0. Data are mean ± SEM, n = 3. Statistical significance was calculated between siDUSP4 versus siNT conditions at 84 h. (F, G) A375 parental and resistant cells were treated as in (F), and cell growth was analyzed by a colony formation assay. Representative images are shown from three independent experiments. (H) A375 parental and resistant cells were treated as in F, and after 48 h, cell lysates were analyzed by Western blot. (I) SKMEL28 parental and R−T sustain cells were transfected with siRNA against DUSP4 and nontargeting control in the presence or absence of trametinib (0.25 nM). Cells were plated to form colonies and analyzed 7 d later. Representative images are shown from three independent experiments. (J) SKMEL28 parental and R−T sustain cells were treated as in (I) and cell lysates were analyzed by Western blot after 48 h post-transfection. Band intensities were analyzed by ImageJ software, and the P-ERK/GAPDH and MITF/GAPDH ratios are indicated in the histograms. Data represent mean ± SEM of three independent experiments. Statistical significance was calculated against siNT.
- Figure S8. Sensitivity profile to MAPKi in different tumor cell lines.
(A) DBTRG-05MG and LS411N cells were seeded in the absence of MAPKi and 24 h later, were treated either with dabrafenib in single-agent or in combination with different concentrations of trametinib (10 or 50 nM). Cell lysates were analyzed by immunoblot after 2 h of treatment. (B) DBTRG-05MG and LS411N cells were seeded in the absence of MAPKi and 24 h later, were treated with the different MAPKi at increasing concentrations for 72 h before assessment of viability by CellTiter-Glo 2.0. Data are normalized to DMSO and represent mean of two independent experiments.


Supplementary Materials
Table S1. Differential expression analysis results from mRNA sequencing of SKMEL28 cells. [LSA-2021-01235_TableS1.xlsx]
Table S2. Estimated transcription factor activity changes from mRNA sequencing of SKMEL28 cells. [LSA-2021-01235_TableS2.xlsx]


In this Issue
Subjects
Related Articles
Cited By...
- No citing articles found.