


Article Figures & Data
Figures
- Figure 1. A novel gain-of-function IFITM3 mutant induces secretory pathway defects that affect glycoproteins trafficking.
(A) Genomic structure of IFITM3 with a highlight on amino acids of the cytoplasmic intracellular loop. In mutant 85-90, red residues have been mutated to alanine. (B) Schematic representation of HIV-1 virion assembly. PM stands for plasma membrane. (C) HEK293T cells were transfected with DNAs coding for the HIV-1 proviral clone NL4-3 along with control, WT or 85-90 mutant IFITM3. Cells were lysed 48 h after transfection, whereas virion particles released in the supernatant were first purified by ultracentrifugation through a 25% sucrose cushion. Both cellular and viral lysates were analyzed by WB. (D) HEK293T cells were ectopically transfected with DNAs coding for the indicated IFITM3s along with the G protein of the Vesicular Stomatitis virus fused to the mEmerald fluorescent reporter (mEm.-VSV-G), before confocal microscopy analysis 24 h later. Representative confocal microscopy images and graph presenting the proportion of double-positive cells displaying perinuclear accumulation of mEm.-VSV-G (binary scoring; three independent experiments; between 50 and 100 cells scored per sample). *P-value < 0.0001 following a one-way ANOVA, Tukey’s multiple comparisons test; non-statistically significant differences, not shown. (E) Lysates obtained from cells expressing VSV-G along with control, WT and mutant IFITM3 were either untreated or treated with EndoH or PNGaseF before WB and densitometry quantification of the EndoH-sensitive and -resistant VSV-G forms. The scheme presents a simplified view of the trafficking and the modifications of glycoproteins during their transit through the ER–Golgi system. As EndoH is able to digest simple oligosaccharides added by enzymes resident in the ER and cis-Golgi, but not complex ones added later in the medial/trans Golgi compartment, differential susceptibility to EndoH provides a robust biochemical method to assess glycoproteins progression through the ER–Golgi. Panels present representative results, whereas the graph presents the proportions of EndoH-sensitive and -resistant VSV-G obtained in five independent experiments. *P-value of 0.0021 following a one-way ANOVA, Tukey’s multiple comparisons test over control. Uncropped blots and source data are provided in the relevant section.
Source data are available for this figure.
Source Data for Figure 1[LSA-2021-01174_SdataF1_F6.pptx][LSA-2021-01174_SdataF1_F2_F3_F4_F5_F6_F7.xlsx]
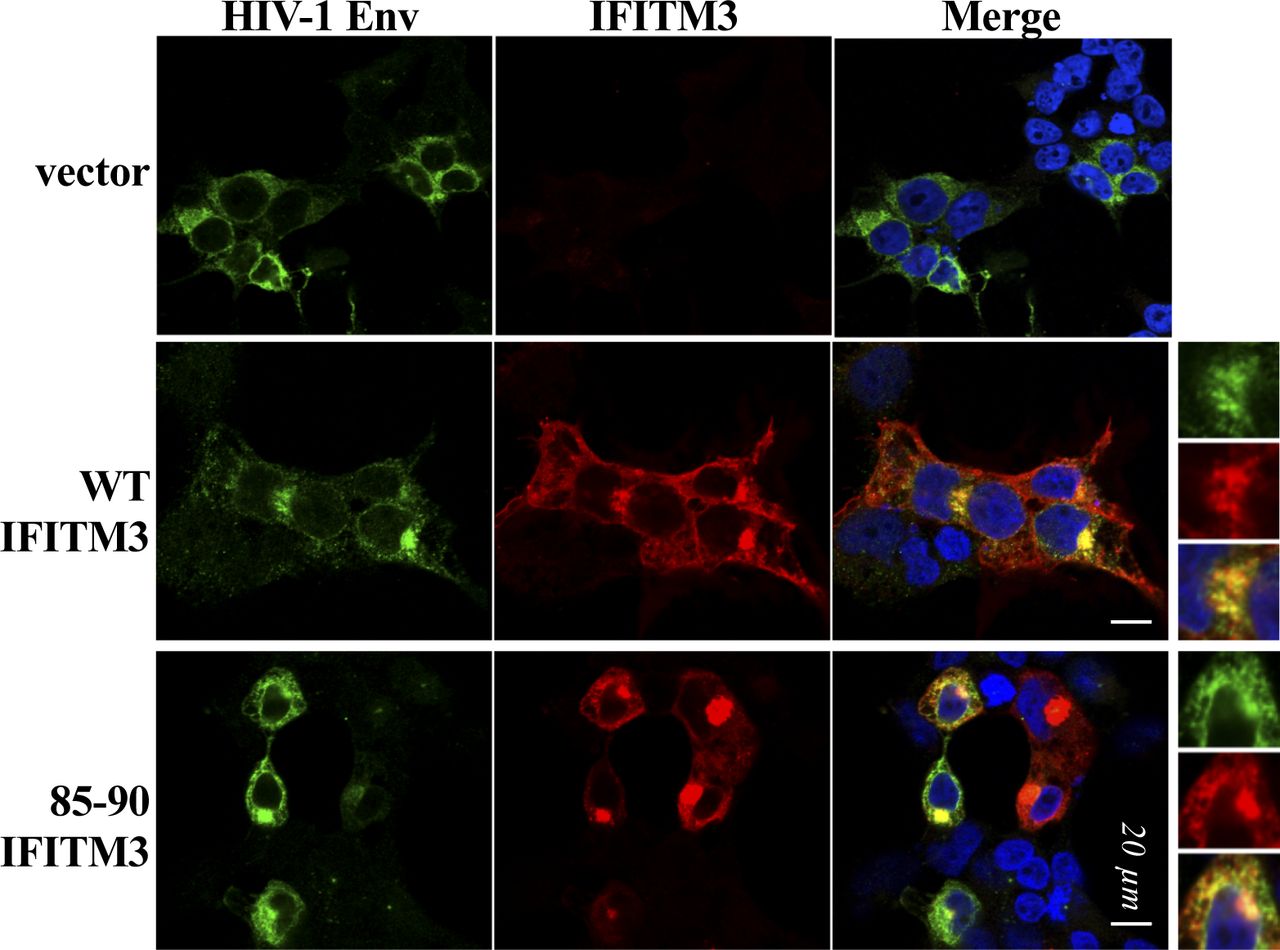
- Figure S1. Qualitative analysis of the distribution of HIV-1 envelope in the presence of WT and mutant IFITM3.
HEK293T cells were transfected with DNAs coding for the indicated IFITM3 proteins along with an HIV-1 envelope (NL4-3) before analysis by confocal microscopy. Representative pictures of this qualitative analysis are provided.
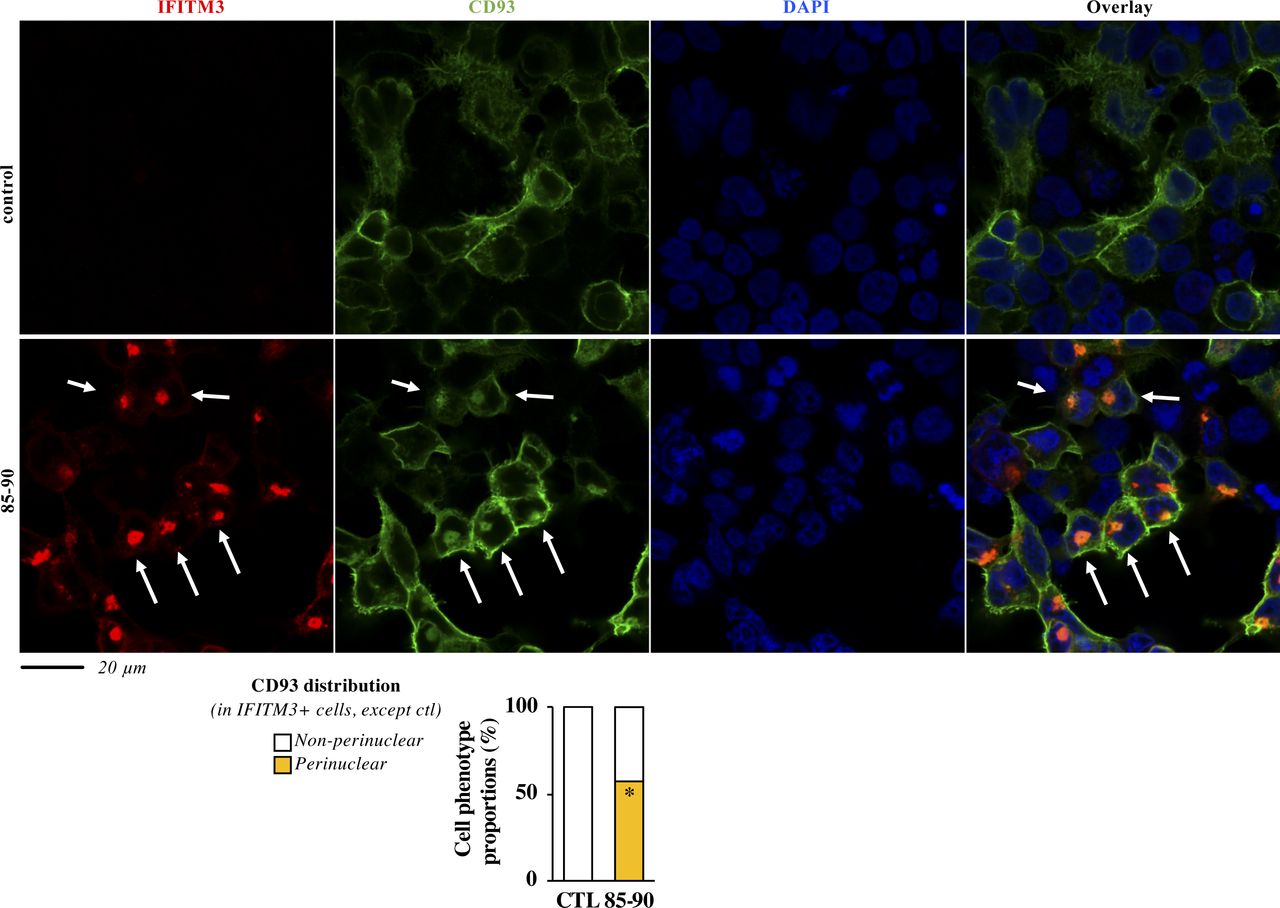
- Figure S2. The defect imposed by the 85-90 IFITM3 mutant is also apparent on cellular glycoproteins.
HEK293T cells were transfected with DNAs coding for the 85-90 IFITM3 mutant along with an HA tagged version of CD93. Cells were then fixed and analyzed by confocal microscopy. Representative pictures and cumulative analyses of the distributions of CD93 in the presence or absence of the IFITM3 mutant (more than 60 cells per condition in two independent experiments). P-value < 0.0001 after a two-tailed t test between control and 85-90 IFITM3–expressing cells. Source data are provided in the relevant section.
- Figure S3. The 85-90 IFITM3 mutant does not colocalize with CD63, LAMP2, nor with the ER.
HEK293T cells ectopically expressing the indicated IFITM3s, or co-transfected with the ER reporter D1ER were analyzed by confocal microscopy with the indicated markers. Whiskers and boxes plot of the Pearson’s colocalization coefficients (25–75 percentiles with individual cells represented as dots; n = 16 to 38 per condition in three independent experiments). A one-way ANOVA with Tukey’s multiple comparisons test was applied for each marker to evaluate differences in localization between WT and 85-90 IFITM3 mutant (nonstatistical significant differences are represented by white boxes; P < 0.0001 by colored ones). Source data are provided in the relevant section.
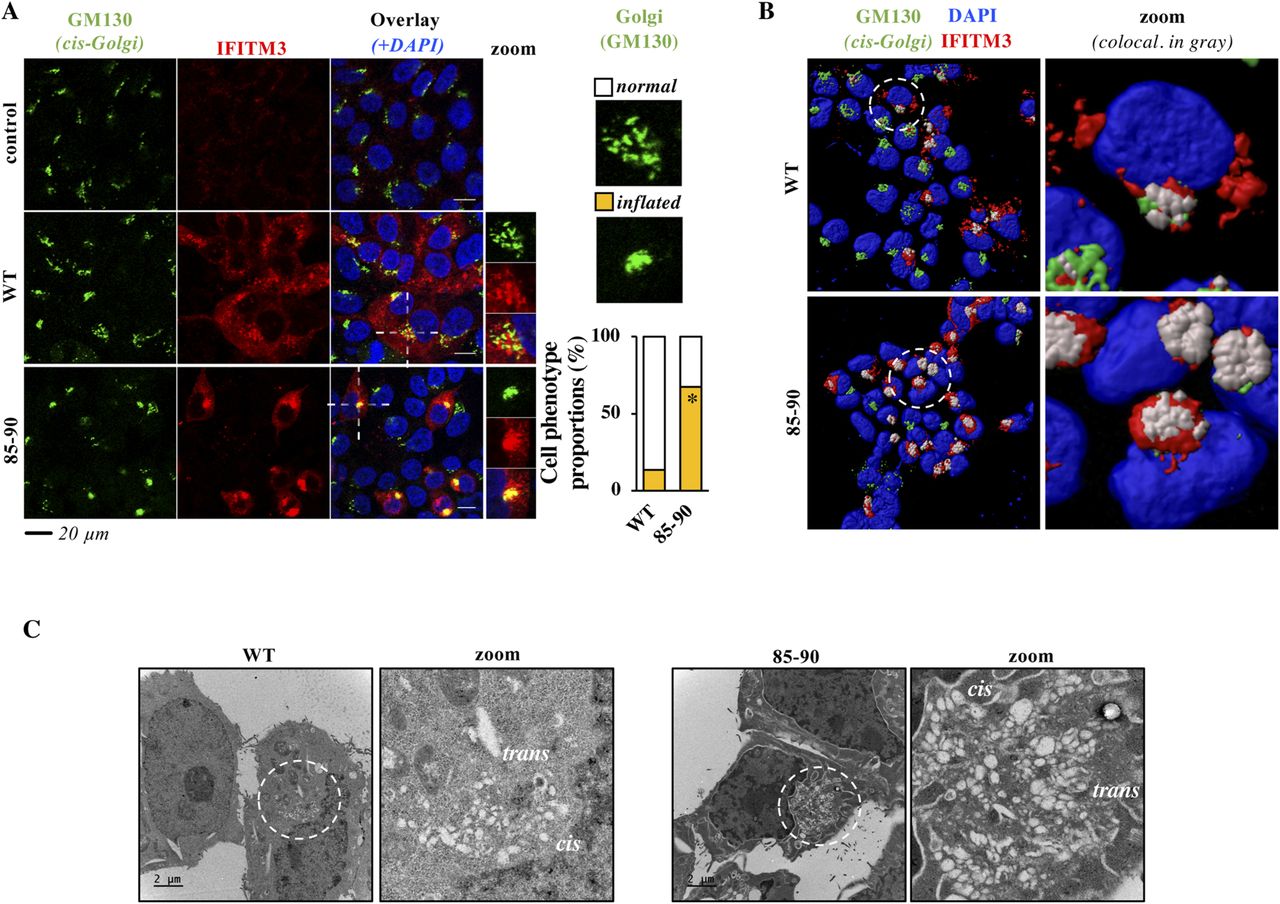
- Figure 2. The 85-90 IFITM3 mutant colocalizes with and induces gross morphological changes in the Golgi.
(A, B) Confocal microscopy analysis and 3D-reconstruction of cells expressing the indicated IFITM3 proteins. Colocalization of GM130 and IFITM3 is shown in yellow and grey, respectively. Representative images and graph presenting phenotype proportions in at least 100 cells scored per condition (binary scoring: inflated or normal Golgi, three independent experiments). *P = 8.3 × 10⁻⁹ following an unpaired, two-tailed t test. (C) Representative electron microscopy analyses of HEK293T cells expressing WT or 85-90 IFITM3 proteins. The region enlarged at the right of each panel corresponds to the red inset; cis and trans regions of Golgi marked. Source data are provided in the relevant section.
Source data are available for this figure.
Source Data for Figure 2[LSA-2021-01174_SdataF1_F2_F3_F4_F5_F6_F7.xlsx]
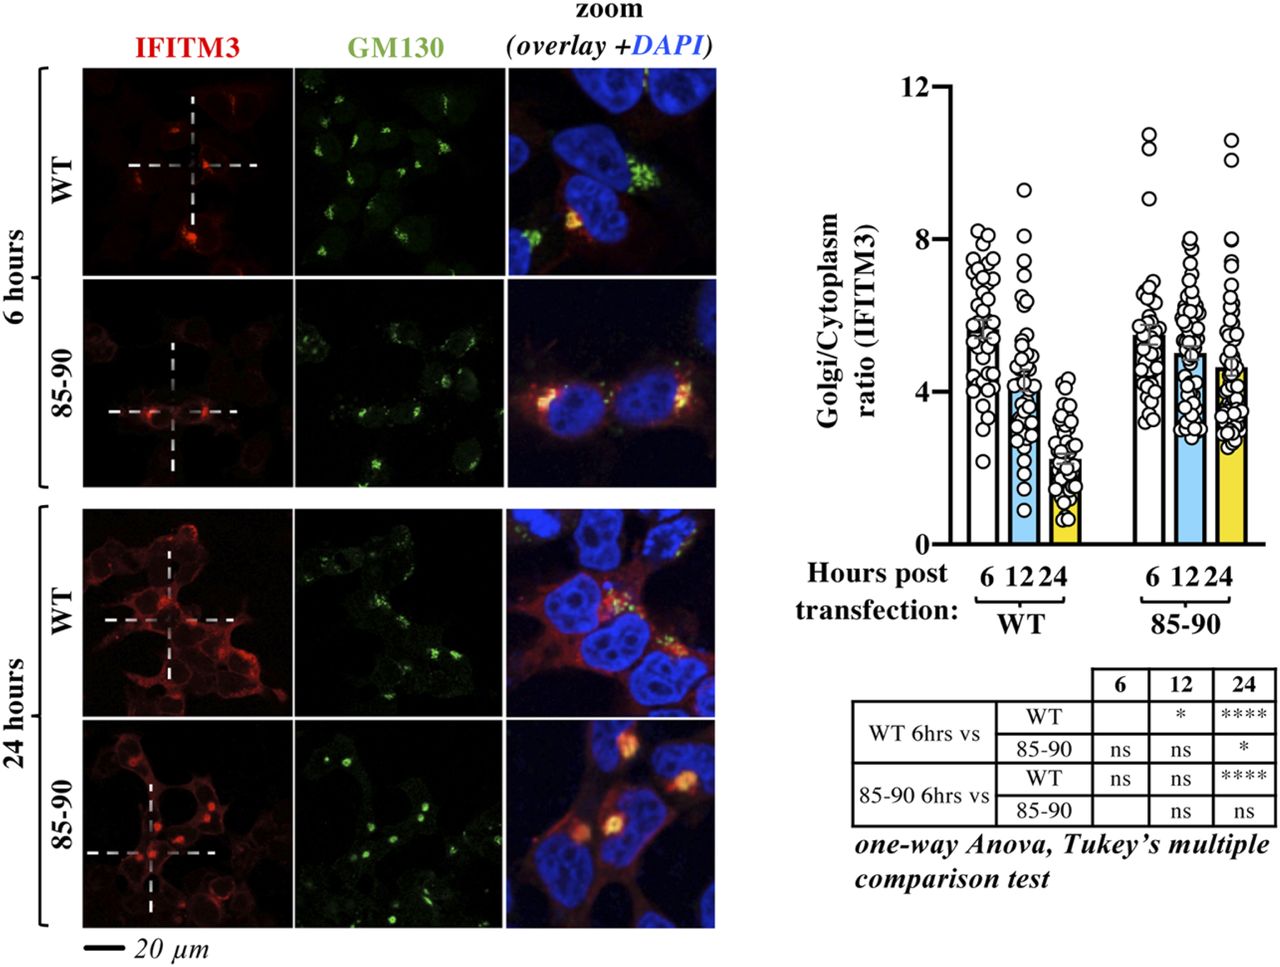
- Figure 3. Time-course confocal microscopy analysis indicates that the 85-90 IFITM3 mutation affects the normal egress of IFITM3 from the Golgi.
HEK293T cells were examined by confocal microscopy at different times post ectopic DNA transfection to determine the localization of IFITM3 proteins over time. Representative pictures and graph presenting the distribution of IFITM3 in the Golgi (calculated as a Golgi/cytoplasm ratio on 39 to 62 cells per time point and per condition in two independent experiments, AVG, SEM and individual values). The table presents P-values obtained after a one-way ANOVA, Tukey’s multiple comparisons test between the indicated conditions: ns, nonsignificant; *P-value < 0.05; ****P-value < 0.0001. Source data are provided in the relevant section.
Source data are available for this figure.
Source Data for Figure 3[LSA-2021-01174_SdataF1_F2_F3_F4_F5_F6_F7.xlsx]
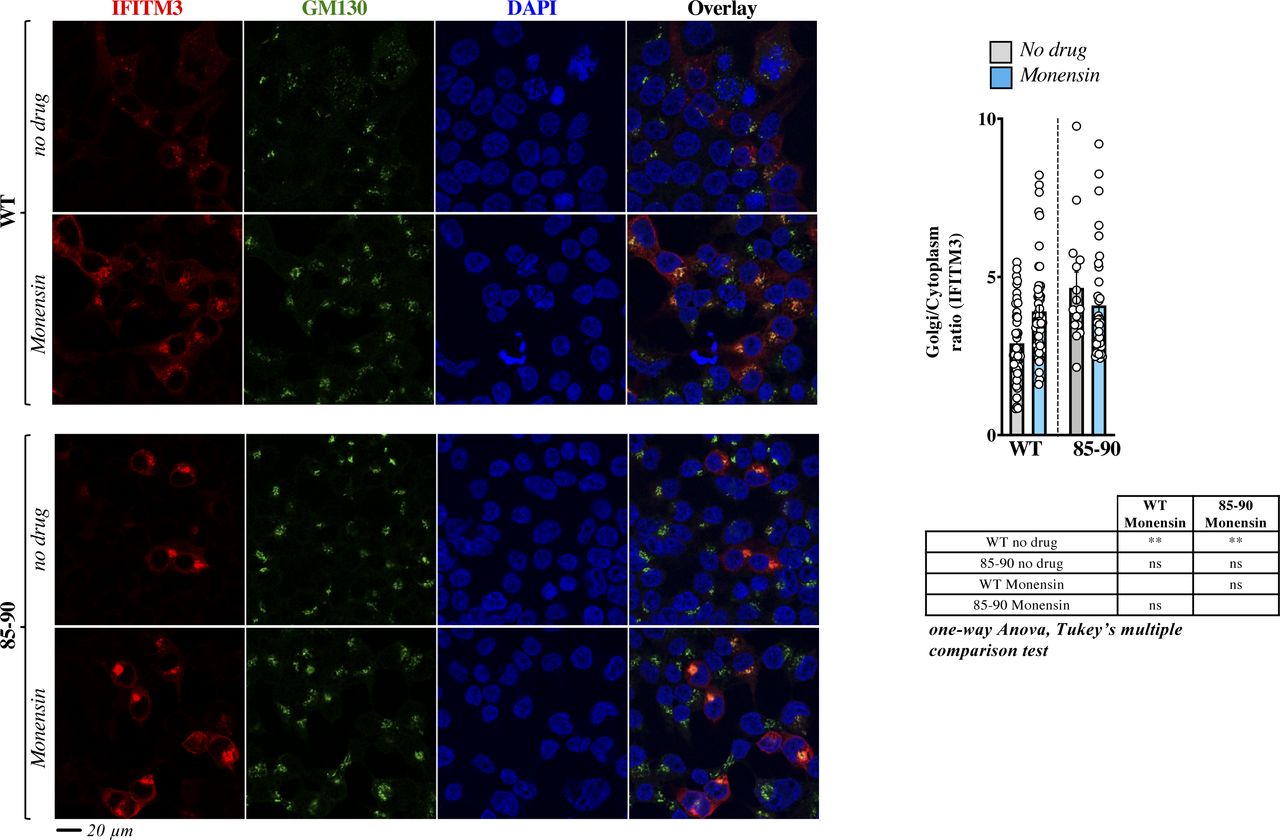
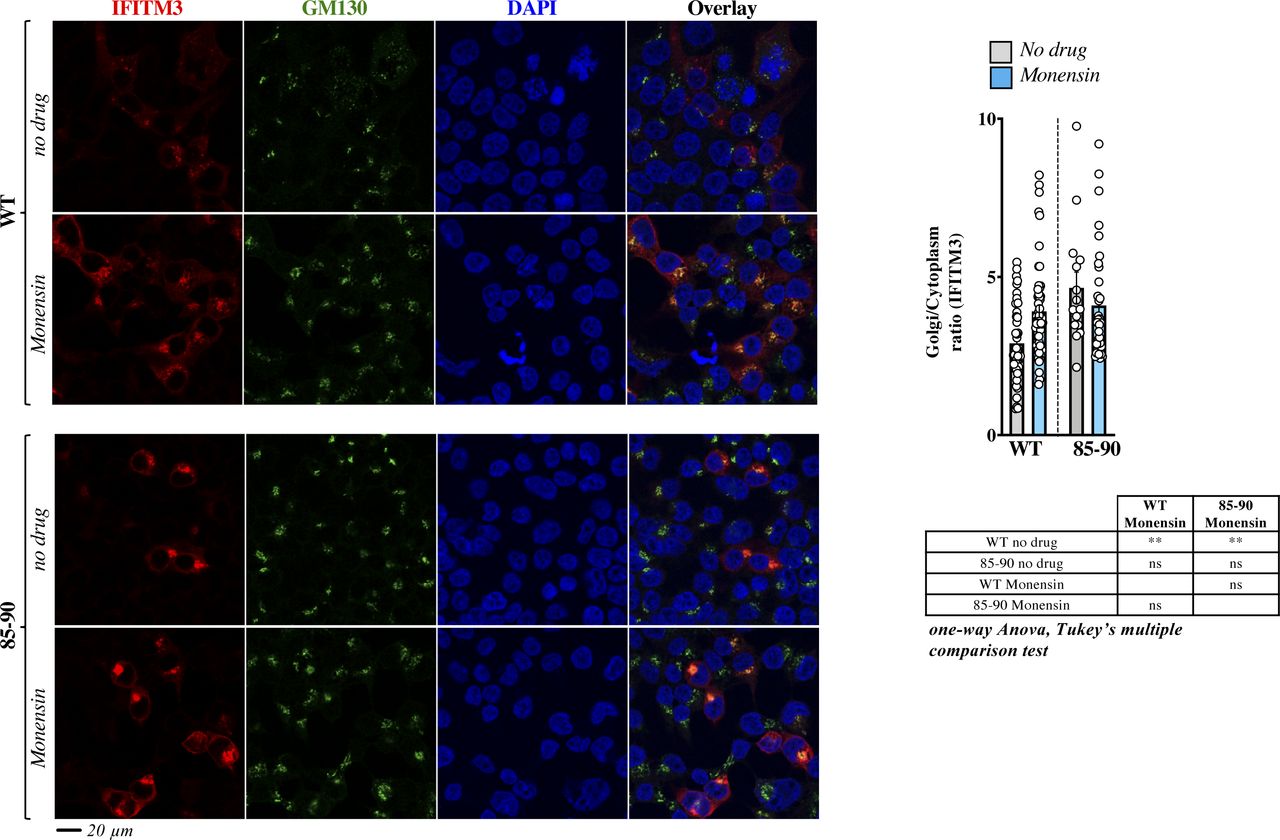
- Figure S4. The broad trafficking inhibitor Monensin affects the egress from the Golgi of WT IFITM3, but not of the 85-90 mutant.
Cells expressing the indicated IFITM3 protein were either treated or untreated with Monensin for 3 h at 0.2 mM, before confocal microscopy analysis. Panels present typical staining, whereas the graph presents the proportion of IFITM3 in the Golgi as an IFITM3 Golgi/cytoplasmic ratio (AVG = lines and individual values displayed as dots). The lower table presents the result of the indicated statistical analyses: ns, nonsignificant; **P-values ≤ 0.006. Source data are provided in the relevant section.
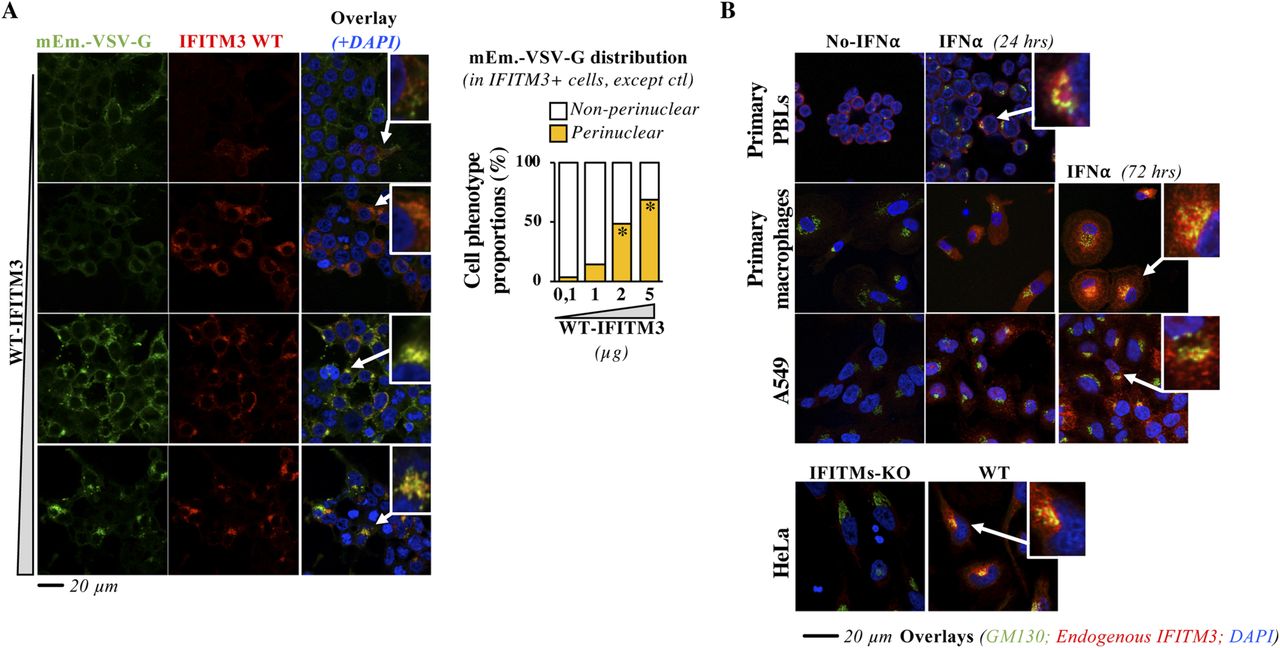
- Figure 4. WT IFITM3 also accumulates in the cis-Golgi upon high levels of expression or prolonged IFN stimulation.
(A) HEK293T cells were transfected with a constant amount of DNA coding mEm.-VSV-G and increasing levels of DNA coding WT IFITM3, prior confocal microscopy 24 h later. Representative pictures and graph presenting the proportion of IFITM3-positive cells exhibiting normal or perinuclear accumulation of mEm.-VSV-G (binary scoring; two independent experiments; between 44 and 167 cells scored per sample). A magnified view of the indicated cells is provided in the inset. *P-value < 0.0001 following a one-way ANOVA, Dunnett’s multiple comparisons test against the lowest dose of WT IFITM3 (0,1). (B) Purified primary blood lymphocytes were stimulated for 24 h with anti-CD3 and anti-CD28 antibodies plus 150 U/ml of IL2, whereas primary monocytes were differentiated into macrophages upon incubation with M-CSF for 4 d. Both primary blood lymphocytes and macrophages were then stimulated for the indicated times with 1,000 U/ml of IFNα2 to stimulate IFITMs expression, before confocal microscopy analysis. Representative pictures from experiments carried out with cells of three different donors. A549 cells were similarly treated, whereas HeLa cells that express IFITMs constitutively were directly analyzed. Pearson’s coefficients were determined for primary macrophages and A549 cells and are provided in extended data section, Fig 4.
Source data are available for this figure.
Source Data for Figure 4[LSA-2021-01174_SdataF1_F2_F3_F4_F5_F6_F7.xlsx]
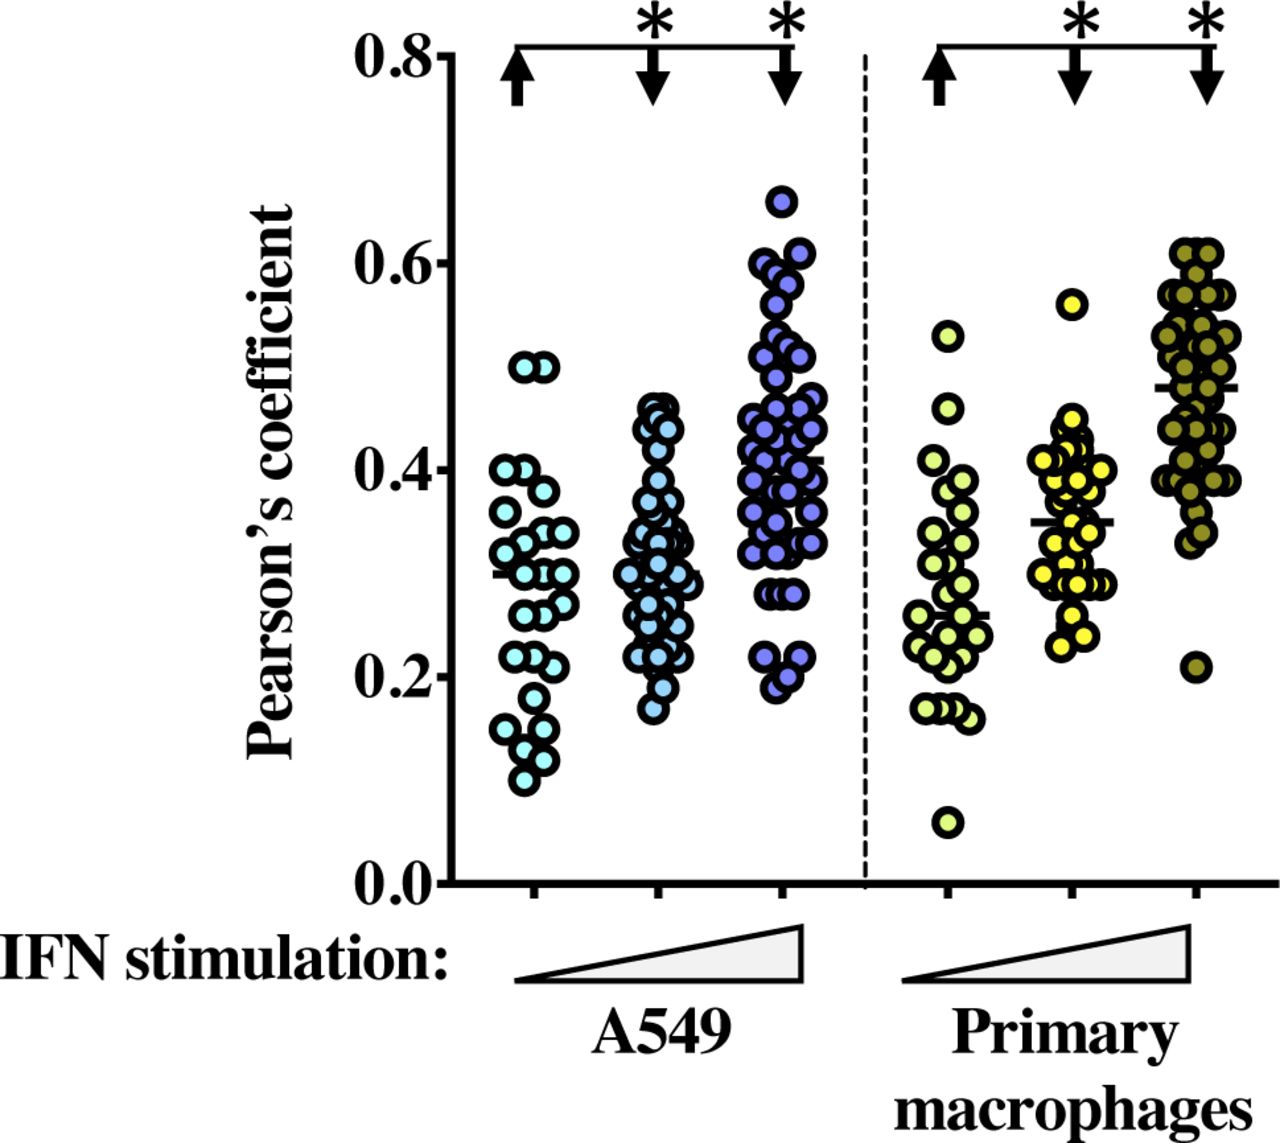
- Figure S5. Partial relocalization of IFITM3 with GM130 upon prolonged IFN stimulation.
Pearson’s colocalization coefficient plot on primary macrophages and A549 stimulated for different times with IFN (from 25 to 45 cells per condition). *, significant P-values (<0.0001), as determined after a one-way ANOVA with Tukey’s multiple comparisons test.
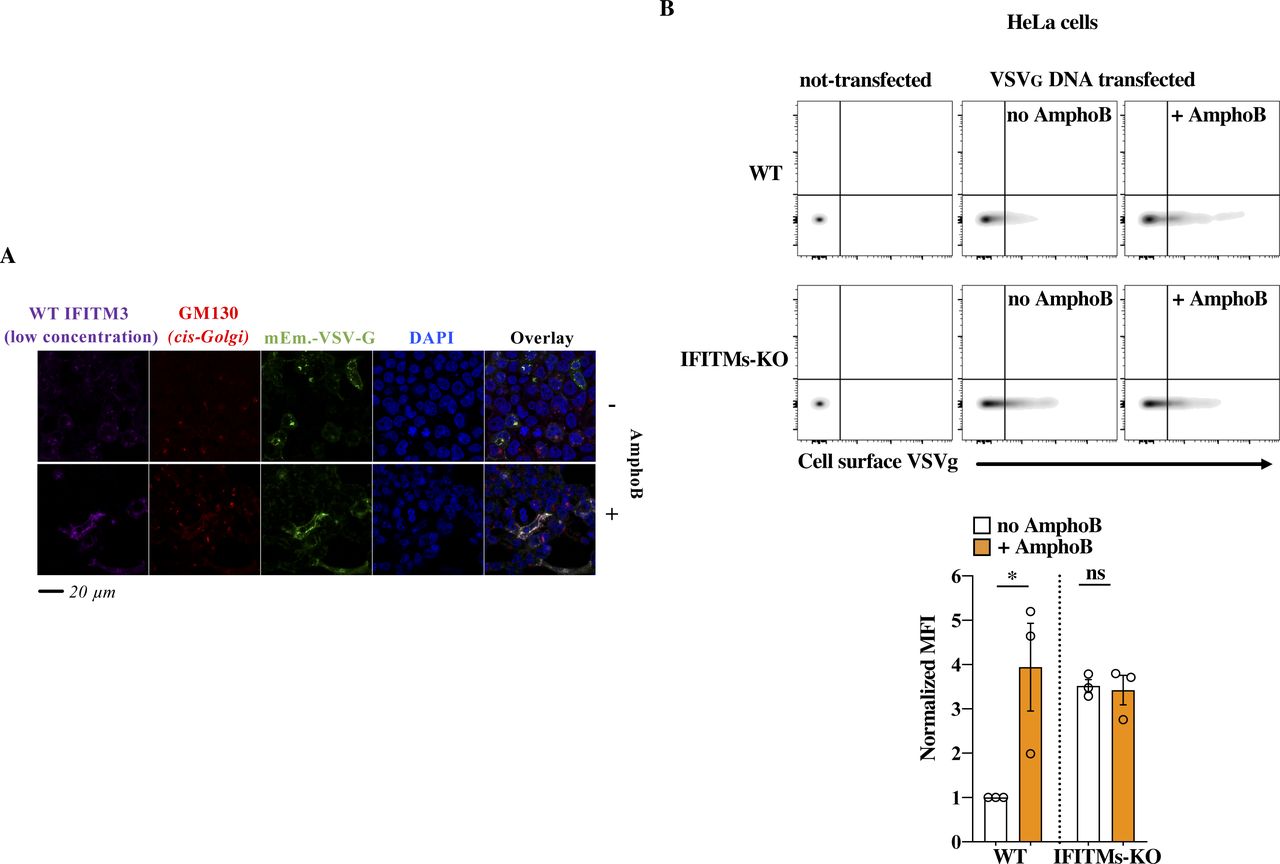
- Figure 5. WT IFITM3 accumulation in the cis-Golgi alters glycoproteins trafficking.
(A) WT and IFITM1, 2, 3 KO cells were transfected with DNA coding for VSVg before confocal microscopy analysis (qualitative analysis and representative pictures obtained). (B) HeLa WT and IFITMs-KO cells were either transfected with DNA coding for a GFP marker or for VSVg before flow cytometry analysis. To quantify the amount of VSVg arriving at the plasma membrane, cells were labeled with an anti-VSVg antibody, before fixation and analysis. Typical panels obtained and overall changes in the median fluorescent intensity (MFI) in the different conditions. * and ns, statistically significant and nonsignificant P-values after unpaired two-tailed t tests between the indicated conditions. Source data are provided in the relevant section.
Source data are available for this figure.
Source Data for Figure 5[LSA-2021-01174_SdataF1_F2_F3_F4_F5_F6_F7.xlsx]
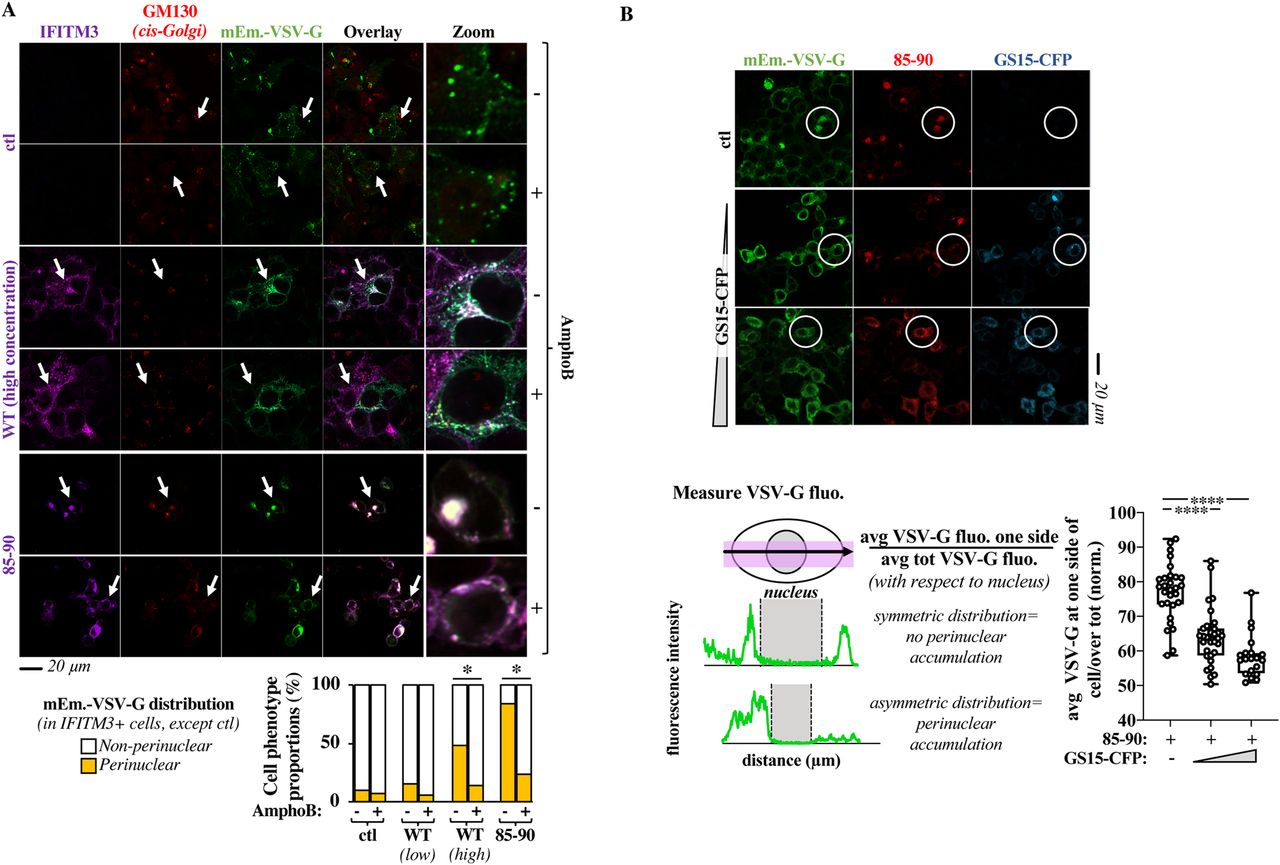
- Figure 6. The Golgi trafficking defect observed in the presence of the 85-90 IFITM3 mutant or of high levels of WT IFITM3 is relieved by Amphotericin B and v-SNARE overexpression.
(A) HEK293T cells transfected with mEm.-VSV-G and 85-90 IFITM3 (or of WT IFITM3 expressed at low or high levels: 1 and 4 μg, representative pictures of WT IFITM3 at low concentrations are provided in the Fig S6A) coding DNAs were either mock treated or treated with AmphoB at 1 μM for 18 h before confocal microscopy analysis. Representative images along with the cumulative analysis of the proportion of cells presenting the indicated VSV-G distributions (from 40 to 100 cells scored per condition in three independent experiments). *P-values of 0.002 and <0.0001 for WT-high and 85-90, respectively, after unpaired two-tailed t tests between the indicated conditions. (B) HEK293T cells expressing constant amounts of 85-90 IFITM3 and mEm.-VSV-G were co-transfected with increasing amounts of GS15-CFP coding DNA, before confocal microscopy analysis (GS15/85-90 ratios of 0.2 and 0.5). Given that VSV-G accumulation in the Golgi leads to its asymmetrical perinuclear distribution in the cell, VSV-G fluorescence was determined for each cell according to the presented scheme. The fluorescence measured over distance in the cell was used to calculate the proportion of VSV-G protein present at one side (the left side was set as the side with higher protein accumulation). Representative pictures and graph presenting the distribution of VSV-G at one side of the cell in triple-positive cells (n = 2 with 20–31 cells analyzed per condition). White circles highlight examples of phenotypic differences in the perinuclear accumulation of VSV-G. ****P-value of <0.0001 following a one-way ANOVA, Tukey’s multiple comparisons test over 85-90 IFITM3 condition with no GS15-CFP. Source data are provided in the relevant section.
Source data are available for this figure.
Source Data for Figure 6[LSA-2021-01174_SdataF1_F6.pptx][LSA-2021-01174_SdataF1_F2_F3_F4_F5_F6_F7.xlsx]
- Figure S6. Effects of AmphoB on WT IFITM3–driven trafficking defects.
(A) Representative picture obtained in the presence of low concentrations of WT IFITM3. This picture is in complement to the results presented in Fig 5A and has been included in the graph of the same Figure. (B) WT and IFITMs-KO HeLa cells were transfected with DNA coding VSVg and treated for 18 h with 1 μM of AmphoB before analysis of the cell surface expression levels of VSVg by flow cytometry. The picture presents representative results, as well as the quantification of the MFI obtained in three experiments. *P-value < 0.041 and nonsignificant (ns) after a two-tailed t test between the indicated conditions. Source data are provided in the relevant section.
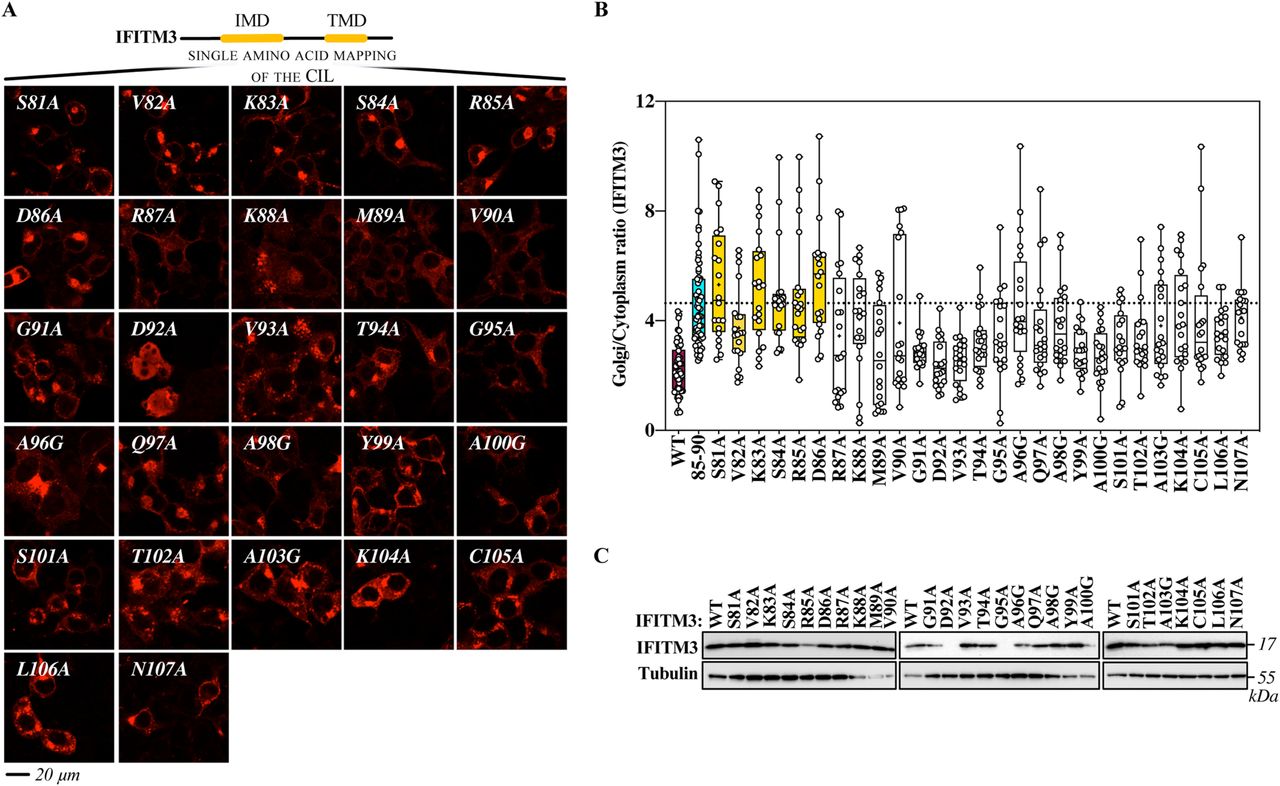
- Figure 7. Mutagenesis of the entire cytoplasmic intracellular loop of IFITM3 finely maps the domain involved in the egress of IFITM3 from the Golgi.
(A) Individual amino acid of the cytoplasmic intracellular loop were changed to alanine or to glycine when alanine residues were present, before confocal microscopy analysis. Representative pictures are shown here (IFITM3 only), whereas their colocalization with the cis-Golgi marker GM130 is shown in the extended data Fig 3. (B) Quantification of the IFITM3 proportion in Golgi is provided as a Golgi/cytoplasm ratio in the box and whisker plot (20 cells per mutant in two to three independent experiments analyzed). Asterisks and lines within the box indicate averages and median values, respectively. Yellow boxes indicate mutants with Golgi/cytoplasm IFITM3 ratios equivalent to the 85-90 IFITM3 mutant and non-statistically significant when compared with 85-90 following an ordinary one-way ANOVA, Dunnett’s multiple comparisons test. (C) Representative WB analysis of mutant proteins. Uncropped blots and source data are provided in the relevant section.
Source data are available for this figure.
Source Data for Figure 7[LSA-2021-01174_SdataF1_F2_F3_F4_F5_F6_F7.xlsx]
- Figure S7. Complete confocal microscopy analyses of the individual point mutants of the cytoplasmic intracellular loop of IFITM3.
This figure presents the entire panel of confocal microscopy analyses (i.e., IFITM3, GM130, and DAPI staining) of the mutants presented in Fig 5, which for lack of space presents only IFITM3 staining panels. Source data are provided in the relevant section of Fig 2.
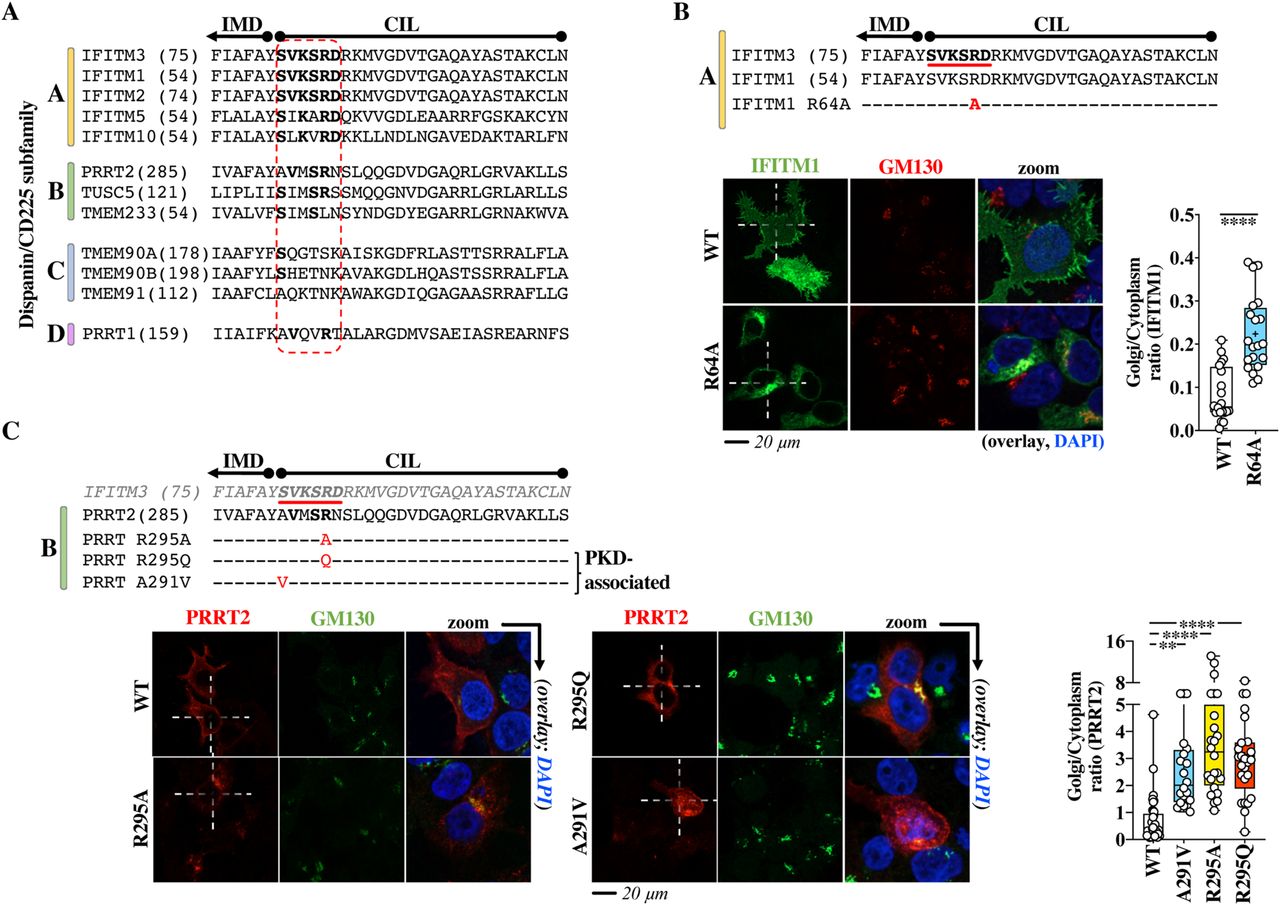
- Figure 8. The Golgi egress domain of IFITM3 is conserved across vertebrate members of the dispanin/CD225 subfamily A and is functionally conserved in PRRT2, a member of the B subfamily as shown by genetic mutations associated with paroxysmal kinesigenic dyskinesia.
(A) Alignment of the indicated portions of human members of the different dispanin/CD225 subfamilies. The relevant domain is circled in red. Bold indicates conserved residues. The position of the first amino acid of each sequence is shown within parentheses. (B) Single point mutation and confocal microscopy analysis of the Golgi egress domain of IFITM1. (C) Point mutations and confocal microscopy analysis of PRRT2 mutants in the region corresponding to the Golgi egress domain of IFITM3. R295Q and A291V are genetic mutations associated to paroxysmal kinesigenic dyskinesia. Representative pictures are shown for each protein. Whiskers and boxes plots of the quantification of the proportion of each protein in the Golgi as a Golgi/cytoplasm ratio (25–75 percentiles with individual cells represented as dots; group average indicated by an asterisk, n = 20 in three independent experiments). Colored boxes represent statistical significant differences after a two-tailed t test or a one-way ANOVA, Dunnett’s multiple comparisons test (B and C, respectively) of the examined mutant over WT. **P-value of 0.0019; ****P-value < 0.0001. Source data are provided in the relevant section.


In this Issue
Related Articles
Cited By...
- No citing articles found.