Advertisement

Main menu

  • Home
  • Articles
    • Newest Articles
    • Current Issue
    • Methods & Resources
    • Archive
    • Subjects
  • Collections
  • Submit
    • Submit a Manuscript
    • Author Guidelines
    • License, Copyright, Fee
    • FAQ
    • Why Submit
  • About
    • About Us
    • Editors & Staff
    • Board Members
    • Licensing and Reuse
    • Reviewer Guidelines
    • Privacy Policy
    • Advertise
    • Contact Us
    • LSA LLC
  • Alerts
  • Other Publications
    • EMBO Press
    • The EMBO Journal
    • EMBO reports
    • EMBO Molecular Medicine
    • Molecular Systems Biology
    • Rockefeller University Press
    • Journal of Cell Biology
    • Journal of Experimental Medicine
    • Journal of General Physiology
    • Cold Spring Harbor Laboratory Press
    • Genes & Development
    • Genome Research

User menu

  • My alerts

Search

  • Advanced search
Life Science Alliance
  • Other Publications
    • EMBO Press
    • The EMBO Journal
    • EMBO reports
    • EMBO Molecular Medicine
    • Molecular Systems Biology
    • Rockefeller University Press
    • Journal of Cell Biology
    • Journal of Experimental Medicine
    • Journal of General Physiology
    • Cold Spring Harbor Laboratory Press
    • Genes & Development
    • Genome Research
  • My alerts
Life Science Alliance

Advanced Search

  • Home
  • Articles
    • Newest Articles
    • Current Issue
    • Methods & Resources
    • Archive
    • Subjects
  • Collections
  • Submit
    • Submit a Manuscript
    • Author Guidelines
    • License, Copyright, Fee
    • FAQ
    • Why Submit
  • About
    • About Us
    • Editors & Staff
    • Board Members
    • Licensing and Reuse
    • Reviewer Guidelines
    • Privacy Policy
    • Advertise
    • Contact Us
    • LSA LLC
  • Alerts
  • Follow lsa Template on Twitter
Research Article
Source Data
Transparent Process
Open Access

Cap analysis of gene expression reveals alternative promoter usage in a rat model of hypertension

Sonal Dahale, Jorge Ruiz-Orera, Jan Silhavy, Norbert Hübner, View ORCID ProfileSebastiaan van Heesch, Michal Pravenec, View ORCID ProfileSantosh S Atanur  Correspondence email
Sonal Dahale
1Department of Metabolism, Digestion, and Reproduction, Faculty of Medicine, Imperial College London, London, UK
2Department of Microbial Sciences, Faculty of Health and Medical Sciences, University of Surrey, Guildford, UK
Roles: Software, Formal analysis
  • Find this author on Google Scholar
  • Find this author on PubMed
  • Search for this author on this site
Jorge Ruiz-Orera
3Cardiovascular and Metabolic Sciences, Max Delbrück Center for Molecular Medicine in the Helmholtz Association (MDC), Berlin, Germany
Roles: Validation (promoter shift in Insr gene)
  • Find this author on Google Scholar
  • Find this author on PubMed
  • Search for this author on this site
Jan Silhavy
4Institute of Physiology of the Czech Academy of Sciences, Prague, Czech Republic
Roles: Resources
  • Find this author on Google Scholar
  • Find this author on PubMed
  • Search for this author on this site
Norbert Hübner
3Cardiovascular and Metabolic Sciences, Max Delbrück Center for Molecular Medicine in the Helmholtz Association (MDC), Berlin, Germany
5Charité -Universitätsmedizin, Berlin, Germany
6DZHK (German Centre for Cardiovascular Research), Partner Site Berlin, Berlin, Germany
Roles: Validation (promoter shift in Insr gene)
  • Find this author on Google Scholar
  • Find this author on PubMed
  • Search for this author on this site
Sebastiaan van Heesch
7Princess Máxima Center for Pediatric Oncology, Utrecht, Netherlands
Roles: Validation (promoter shift in Insr gene)
  • Find this author on Google Scholar
  • Find this author on PubMed
  • Search for this author on this site
  • ORCID record for Sebastiaan van Heesch
Michal Pravenec
4Institute of Physiology of the Czech Academy of Sciences, Prague, Czech Republic
Roles: Resources, Writing—review and editing
  • Find this author on Google Scholar
  • Find this author on PubMed
  • Search for this author on this site
Santosh S Atanur
1Department of Metabolism, Digestion, and Reproduction, Faculty of Medicine, Imperial College London, London, UK
8The National Institute for Health Research, Imperial Biomedical Research Centre, ITMAT Data Science Group, Imperial College London, London, UK
Roles: Conceptualization, Software, Formal analysis, Supervision, Funding acquisition, Investigation, Visualization, Methodology, Project administration, Writing—original draft, review, and editing
  • Find this author on Google Scholar
  • Find this author on PubMed
  • Search for this author on this site
  • ORCID record for Santosh S Atanur
  • For correspondence: santosh.atanur@imperial.ac.uk
Published 7 January 2022. DOI: 10.26508/lsa.202101234
  • Article
  • Figures & Data
  • Info
  • Metrics
  • Reviewer Comments
  • PDF
Loading

Article Figures & Data

Figures

  • Supplementary Materials
  • Figure S1.
    • Download figure
    • Open in new tab
    • Download powerpoint
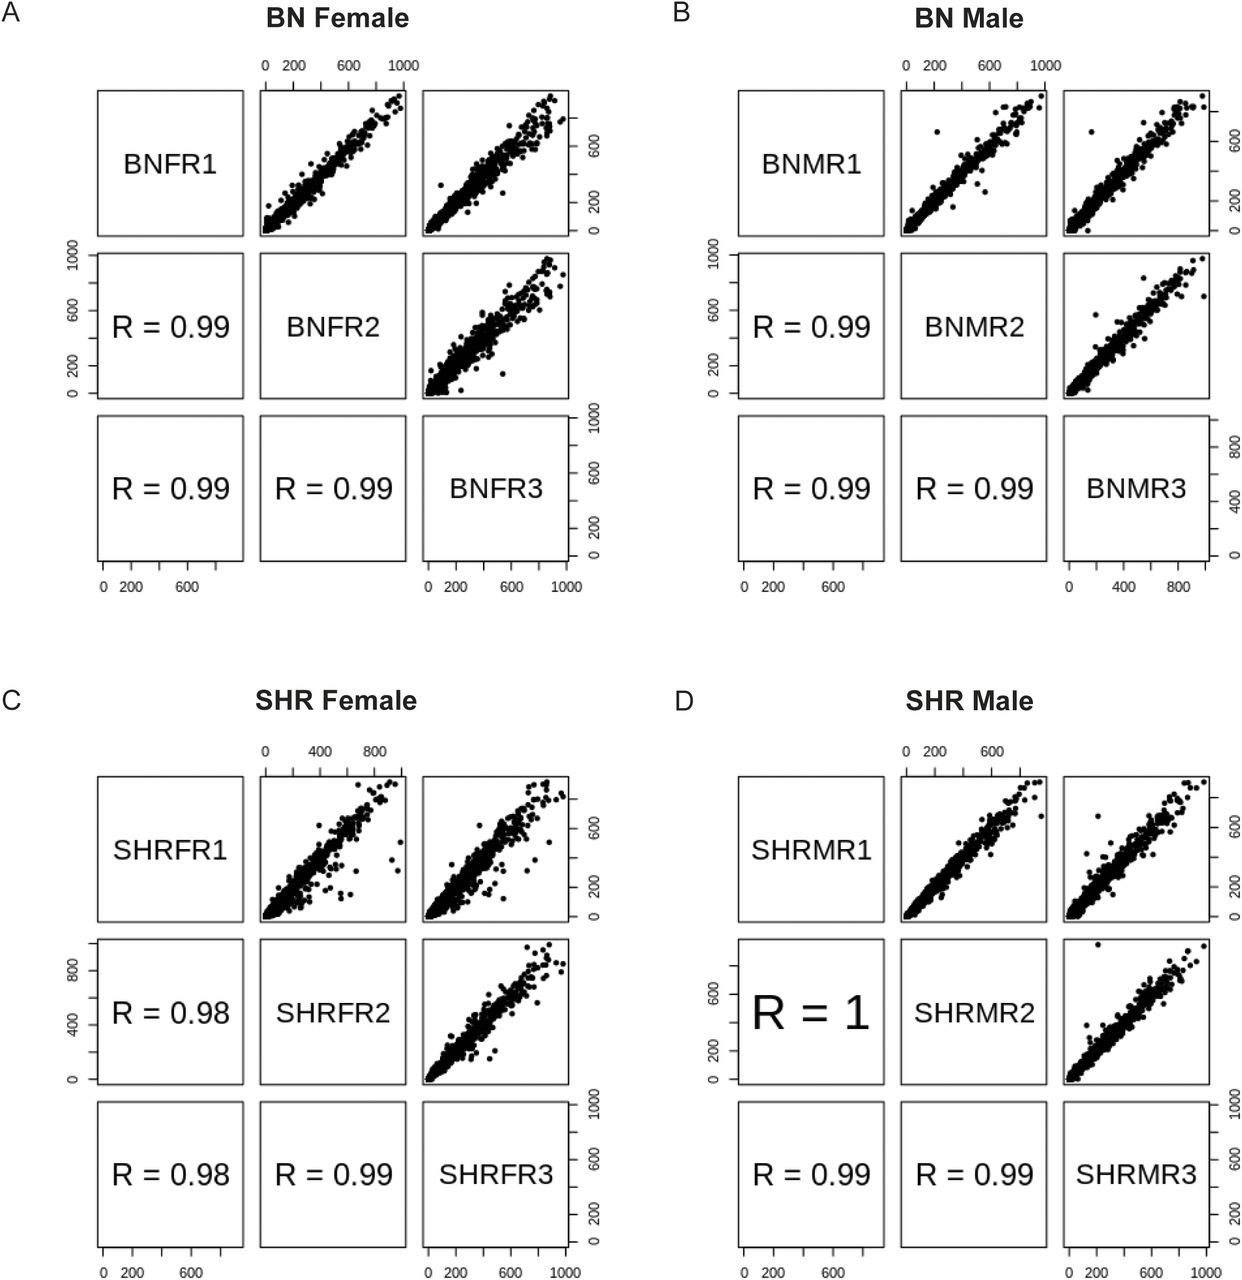
    Figure S1. Reproducibility of the data.

    (A, B, C, D) All possible pairwise correlation between biological replicates for sample (A) Brown Norway (BN) female, (B) BN male, (C) spontaneously hypertensive rat (SHR) female, and (D) SHR male. BN, Brown Norway; SHR, spontaneously hypertensive rat.

  • Figure 1.
    • Download figure
    • Open in new tab
    • Download powerpoint
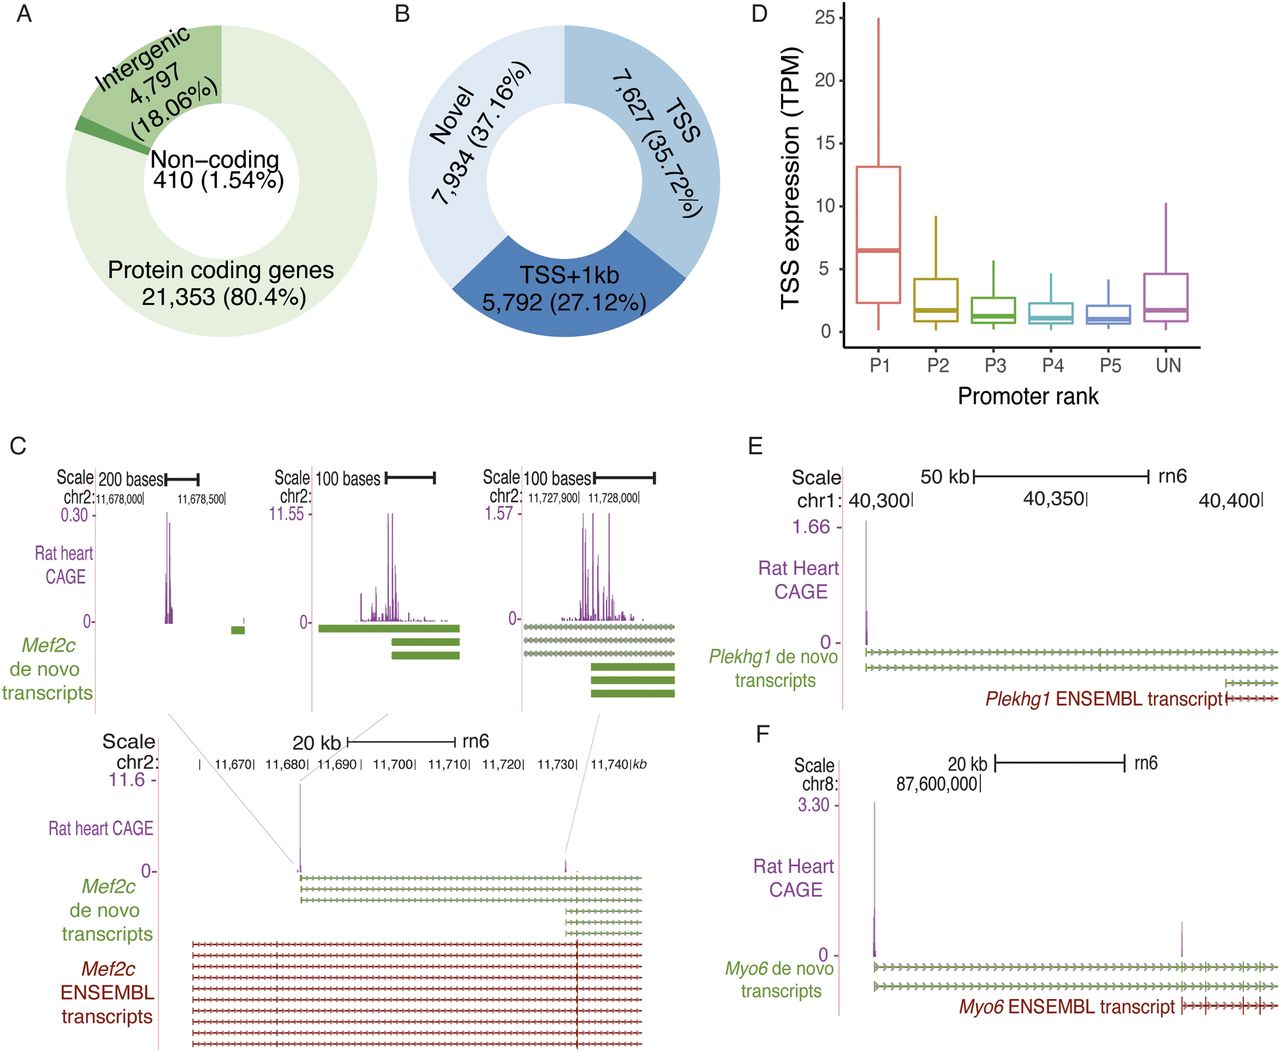
    Figure 1. CAGE tag sequencing identifies promoters from rat left ventricle.

    (A) Annotations of the CAGE-defined promoters to genomic features. (B) Classification of CAGE-defined transcription start site located in the gene regions, defined as the region between transcription start and end of the longest transcript of the gene plus 1 kb upstream region, on the same strand as that of the gene. (C) Example of novel heart-specific transcripts for identified using CAGE tag sequencing for gene Mef2c. (D) Distribution of expression levels at promoters by promoter rank including the promoters that are unassigned to any protein-coding gene. (E, F) Examples of novel transcription start site annotations for gene Plekhg1 and Myo6, respectively.

    Source data are available for this figure.

    Source Data for Figure 1[LSA-2021-01234_SdataF1.xlsx]

  • Figure S2.
    • Download figure
    • Open in new tab
    • Download powerpoint
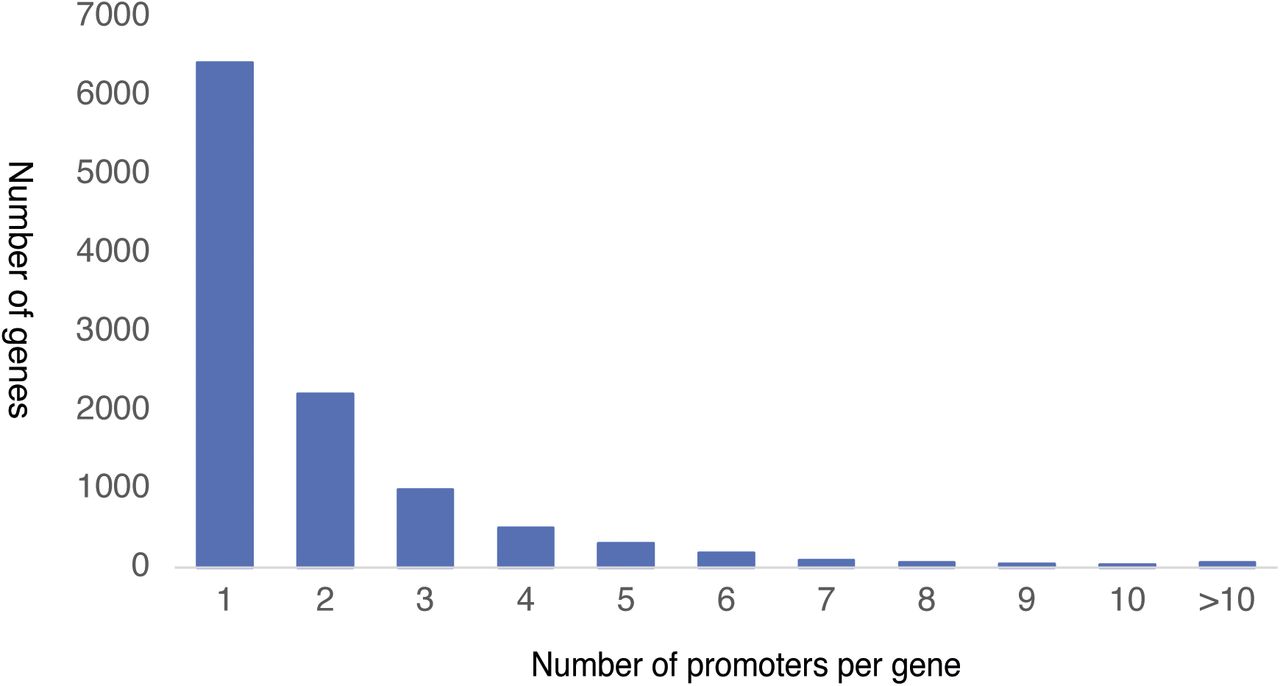
    Figure S2. Number of promoters per gene.
  • Figure S3.
    • Download figure
    • Open in new tab
    • Download powerpoint
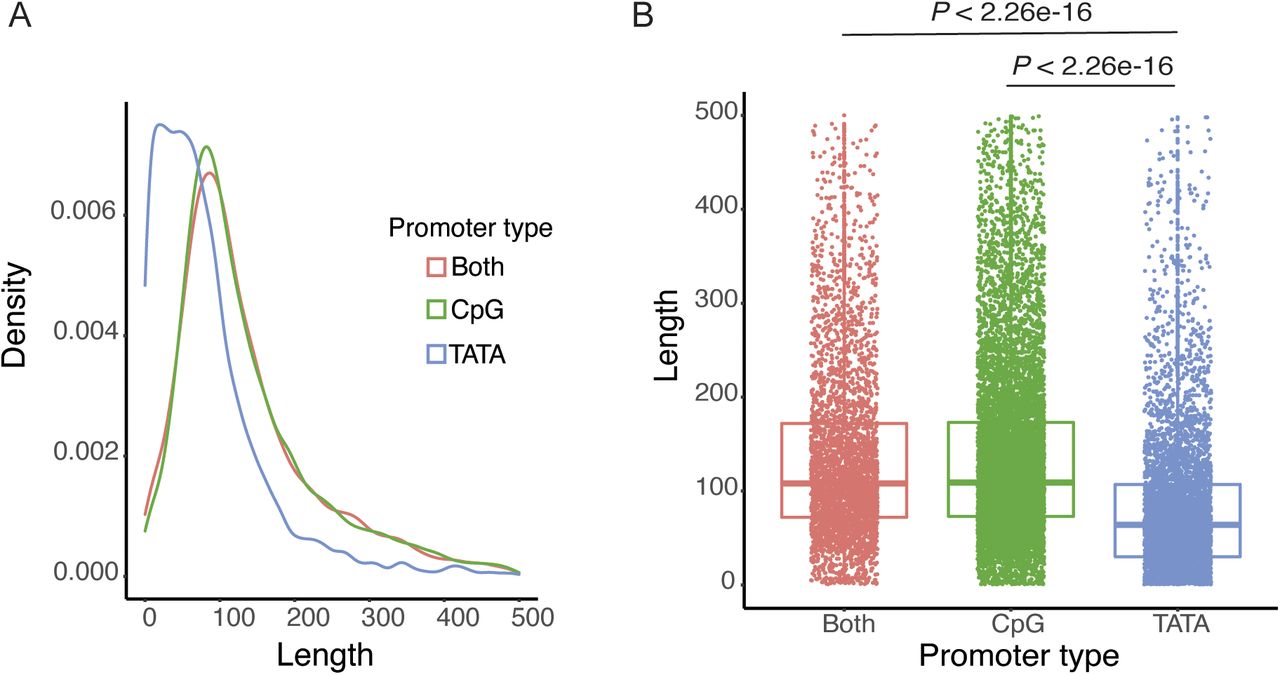
    Figure S3. Characterisation of CAGE-defined tag clusters.

    The CAGE-defined tag clusters (TCs) were categorised into three categories: CpG rich, TATA box rich and TCs containing both TTA box and CpG. (A) Length distribution of CpG-rich TCs, TATA box–rich TCs, and the TCs containing both TATA box and CpG. (B) Box plot showing difference in sizes of CpG-rich TCs, TATA box–rich TCs, and the TCs containing both TATA box and CpG.

  • Figure 2.
    • Download figure
    • Open in new tab
    • Download powerpoint
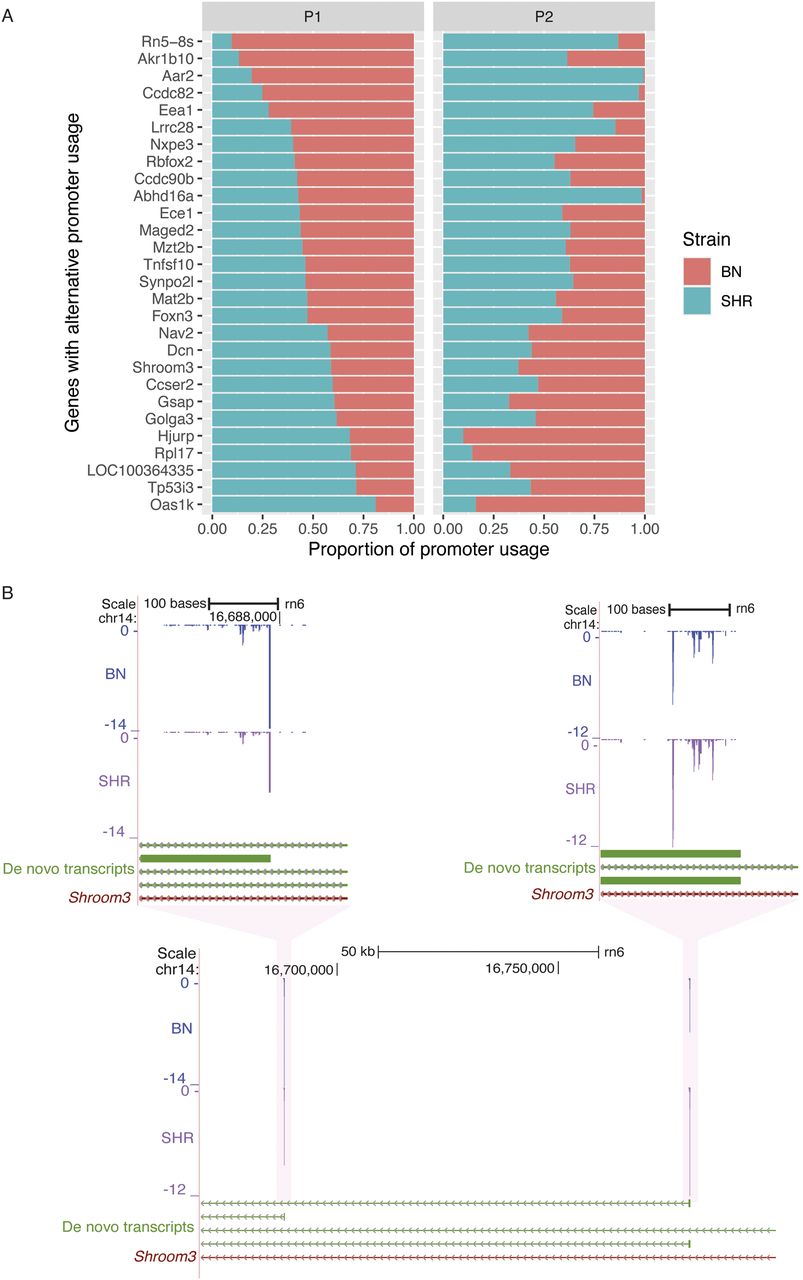
    Figure 2. Alternative promoter usage between spontaneously hypertensive rat (SHR) and Brown Norway (BN).

    (A) List of genes with alternative promoter usage between SHR and BN. The P1 panel represents the first promoter, whereas the P2 panel represents the second promoter. The x-axis represents the proportion of the promoter used in SHR (green) and the BN (orange). (B) Example of alternative promoter usage between SHR and BN in Shroom3 gene. In SHR Shroom3 is predominantly transcribed from the first promoter, whereas in BN it is predominantly transcribed from the second promoter. The gene Shroom3 is located on a negative-strand hence promoter expression levels have negative values.

    Source data are available for this figure.

    Source Data for Figure 2[LSA-2021-01234_SdataF2.xlsx]

  • Figure 3.
    • Download figure
    • Open in new tab
    • Download powerpoint
    Figure 3. Shifting promoters between spontaneously hypertensive rat (SHR) and Brown Norway (BN).

    (A) Shift in transcription start site usage within the same promoter happens in both directions with respect to reference BN strain. (B) Allelic imbalance in F1 crosses obtained by crossing SHR and BN. The x-axis represents allelic imbalance. The center (zero) indicates no allelic imbalance between SHR and BN allele in F1. Positive values indicate allelic imbalance towards in reference (BN) allele, whereas negative values indicate allelic imbalance towards SHR allele. The horizontal blue dotted line corresponds to a P-value equal to 0.05, whereas the vertical blue dotted line corresponds to the allelic imbalance of 0.25 and −0.25. The red dots represent variants located in shifting promoters, whereas green dots represent variants in promoters that show differential expression between parental strains (SHR and BN). Black dots represent genomic variants in CAGE-defined promoters that are neither shifting promoters nor differentially expressed between parental strains. (C) Box plot showing the distribution of allelic imbalance in F1 crosses in shifting promoters, differentially expressed promoters, and remaining CAGE-defined promoter regions. Shifting promoters (red box) show significantly (Mann–Whitney test) higher proportion variants with allelic imbalance as compared to non-shifting and non-differentially expressed promoters (black box). Shift Prom: shifting promoters, Diff Exp: differentially expressed promoters in parental strains (SHR and BN), Other: CAGE-defined promoters that are neither shifting promoters nor differentially expressed in parental strains.

    Source data are available for this figure.

    Source Data for Figure 3[LSA-2021-01234_SdataF3.xlsx]

  • Figure S4.
    • Download figure
    • Open in new tab
    • Download powerpoint
    Figure S4. Intermediate expression in F1s.

    The genes that show shift in transcription start site show intermediate expression at both spontaneously hypertensive rat and Brown Norway promoter. (A, B, C) Illustration of expression in F1 for three genes (A) Insr, (B) Trnau1ap, and (C) Vnn1 that showed promoter shift between spontaneously hypertensive rat and Brown Norway.

  • Figure 4.
    • Download figure
    • Open in new tab
    • Download powerpoint
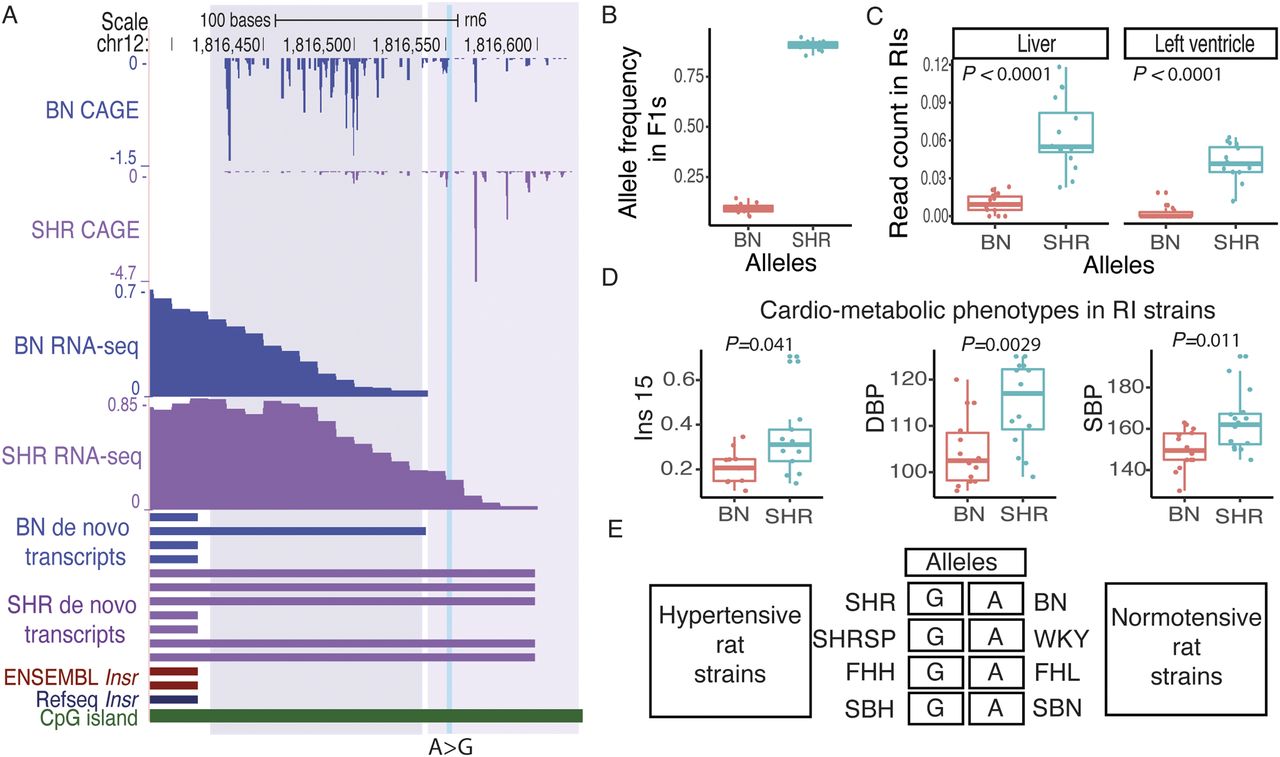
    Figure 4. Shifting promoter in insulin receptor (Insr) gene.

    (A) Shifting promoter in Insr. The GAGE tag sequencing identified promoter shift between spontaneously hypertensive rat (SHR) and Brown Norway (BN) strain for Insr gene which leads to longer Insr transcript in SHR as compared with BN. Finding from CAGE was confirmed by RNA-seq data from rat left ventricle (LV) as well as de novo transcript assembly generated using rat LV RNA-seq data. (B) The variant g.1816552:A>G located in SHR specific Insr transcript region shows significant allelic imbalance in F1 crosses with most reads showing the SHR allele in F1s. (C) Based on the genotype at g.1816552:A>G recombinant inbred (RI) strains were grouped into two groups, where AA represents RI strains inheriting BN allele, whereas GG represents RI strains inheriting SHR allele. RNA-seq read count in SHR specific Insr transcript region was normalised to the read count from the first exon of Insr gene using publicly available RNA-seq data from left ventricle and liver in RI strains. Both in the LV and liver, RI strains that inherited SHR allele showed higher normalised reads count suggesting that they harbor longer transcript for Insr gene, whereas RI strains that inherited BN allele use the shorter transcript. (D) RI strains that harbor SHR allele showed significantly higher levels of insulin, systolic, and diastolic blood pressure. (E) Genotype in rat models of hypertension and their control strains at variant (g.1816552:A>G) located in SHR specific Insr transcript region. All hypertensive rat strain contains GG allele, same as SHR, whereas all the normotensive rat strains contain AA allele, same as BN. SHR, spontaneously hypertensive rat; BN, Brown Norway; ins15, insulin concentrations in 10-wk-old male rats fed a diet with 60% fructose from 8 wk to 10 wk (15 d), SBP, systolic blood pressure; DBP, diastolic blood pressure.

    Source data are available for this figure.

    Source Data for Figure 4[LSA-2021-01234_SdataF4.xlsx]

Supplementary Materials

  • Figures
  • Table S1 List of CAGE-defined tag clusters located in gene body win no ENSEMBL transcription start site annotation but supported by de novo transcript assembly.

  • Table S2 List of intergenic CAGE-defined tag clusters with supported by de novo transcript transcription start site.

PreviousNext
Back to top
Download PDF
Article Alerts
Sign In to Email Alerts with your Email Address
Email Article

Thank you for your interest in spreading the word on Life Science Alliance.

NOTE: We only request your email address so that the person you are recommending the page to knows that you wanted them to see it, and that it is not junk mail. We do not capture any email address.

Enter multiple addresses on separate lines or separate them with commas.
Cap analysis of gene expression reveals alternative promoter usage in a rat model of hypertension
(Your Name) has sent you a message from Life Science Alliance
(Your Name) thought you would like to see the Life Science Alliance web site.
CAPTCHA
This question is for testing whether or not you are a human visitor and to prevent automated spam submissions.
Citation Tools
Alternative promoter usage in a rat model of hypertension
Sonal Dahale, Jorge Ruiz-Orera, Jan Silhavy, Norbert Hübner, Sebastiaan van Heesch, Michal Pravenec, Santosh S Atanur
Life Science Alliance Jan 2022, 5 (4) e202101234; DOI: 10.26508/lsa.202101234

Citation Manager Formats

  • BibTeX
  • Bookends
  • EasyBib
  • EndNote (tagged)
  • EndNote 8 (xml)
  • Medlars
  • Mendeley
  • Papers
  • RefWorks Tagged
  • Ref Manager
  • RIS
  • Zotero
Share
Alternative promoter usage in a rat model of hypertension
Sonal Dahale, Jorge Ruiz-Orera, Jan Silhavy, Norbert Hübner, Sebastiaan van Heesch, Michal Pravenec, Santosh S Atanur
Life Science Alliance Jan 2022, 5 (4) e202101234; DOI: 10.26508/lsa.202101234
del.icio.us logo Digg logo Reddit logo Twitter logo CiteULike logo Facebook logo Google logo Mendeley logo
  • Tweet Widget
  • Facebook Like
Issue Cover

In this Issue

Volume 5, No. 4
April 2022
  • Table of Contents
  • Cover (PDF)
  • About the Cover
  • Masthead (PDF)
Advertisement

Jump to section

  • Article
    • Abstract
    • Introduction
    • Results
    • Discussion
    • Materials and Methods
    • Data Availability
    • Acknowledgements
    • References
  • Figures & Data
  • Info
  • Metrics
  • Reviewer Comments
  • PDF

Subjects

  • Genomics & Functional Genomics
  • Metabolism
  • Systems & Computational Biology

Related Articles

  • No related articles found.

Cited By...

  • No citing articles found.
  • Google Scholar

More in this TOC Section

  • Crosstalk between HIF and AHR
  • The human phagocytosis molecular machinery
  • iTAP/Frmd8 modulates inflammation and tumor growth
Show more Research Article

Similar Articles

EMBO Press LogoRockefeller University Press LogoCold Spring Harbor Logo

Content

  • Home
  • Newest Articles
  • Current Issue
  • Archive
  • Subject Collections

For Authors

  • Submit a Manuscript
  • Author Guidelines
  • License, copyright, Fee

Other Services

  • Alerts
  • Twitter
  • RSS Feeds

More Information

  • Editors & Staff
  • Reviewer Guidelines
  • Feedback
  • Licensing and Reuse
  • Privacy Policy

ISSN: 2575-1077
© 2023 Life Science Alliance LLC

Life Science Alliance is registered as a trademark in the U.S. Patent and Trade Mark Office and in the European Union Intellectual Property Office.