


Article Figures & Data
Figures
- Figure S1. Survival of PCNA[KR] cells following treatment with various genotoxic agents and illudin S survival of various cells.
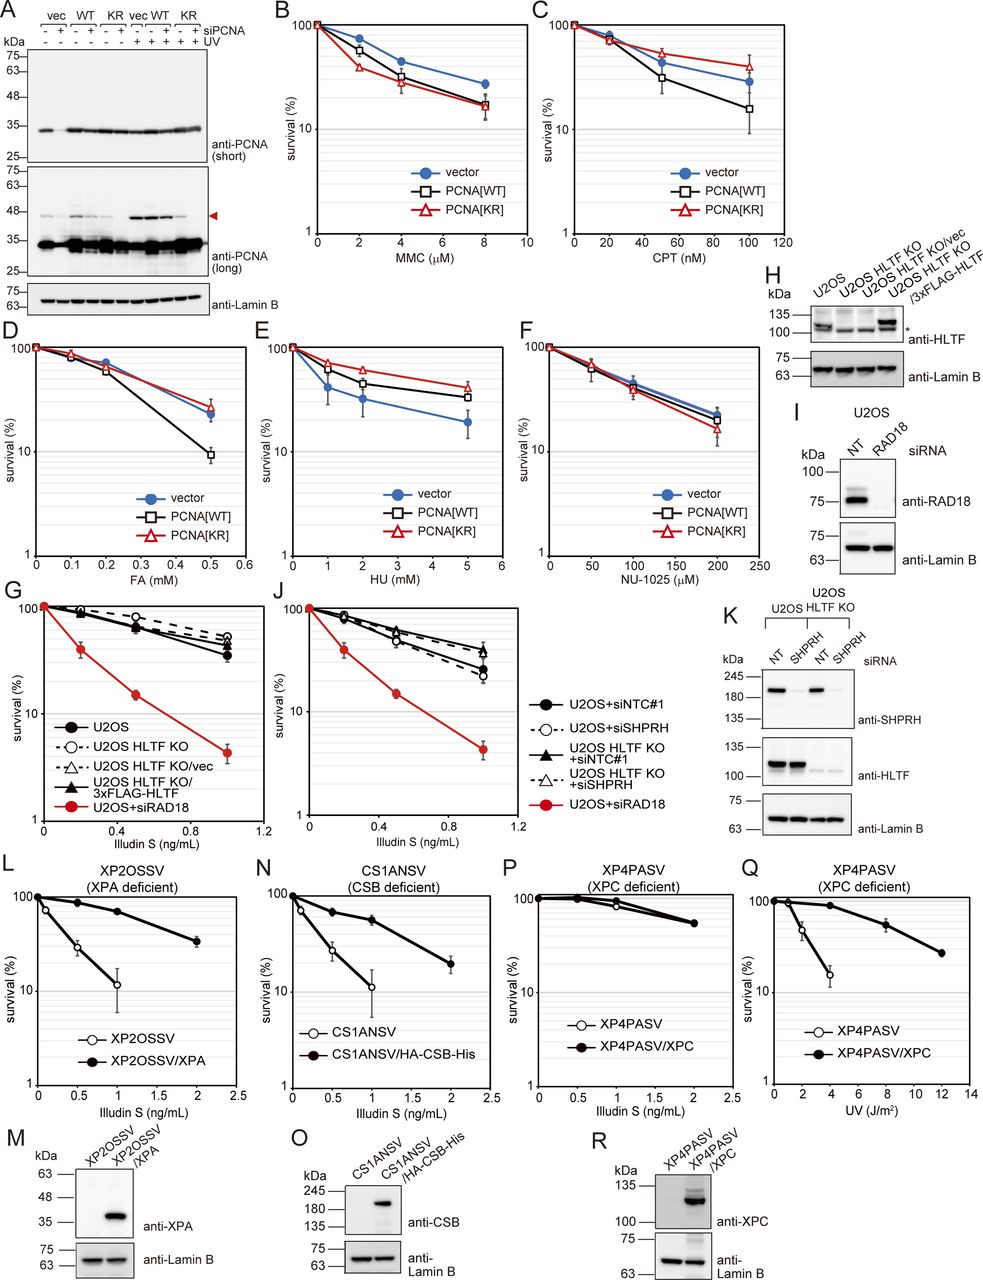
(A) WI38VA13-derived proliferating cell nuclear antigen (PCNA)-expressing cells or cells harboring control empty vectors (vector) were transfected with siPCNA. 4 d after transfection, cells were irradiated with 10 J/m2 UV light and incubated for 3 h. Whole-cell lysates were prepared and analyzed by immunoblotting using anti-PCNA and anti-Lamin B1 antibodies. The red arrowhead shows mono-ubiquitinated PCNA. (B, C, D, E, F) PCNA[WT], PCNA[KR] cells, and control cells harboring the empty vector (vector) were exposed to the indicated dose of mitomycin C (MMC) for 1 h (B), camptothecin (CPT) for 1 h (C), formaldehyde (FA) for 3 h (D), hydroxyurea (HU) for 24 h (E), or NU-1025 for 2 wk (F). Cell viabilities were determined by MTS assays (B, C, D) or by colony formation assays (E, F). Data are represented as means ± SD of n = 3 independent experiments. (G) U2OS, U2OS helicase-like transcription factor (HLTF) KO, U2OS HLTF KO/vec, and U2OS HLTF KO/3xFLAG-HLTF cells were exposed to illudin S for 4 d and cellular survival was evaluated by MTS assays. U2OS cells were transfected with siRNA against RAD18 (siRAD18). Illudin S sensitivity of transfected cells was evaluated as described above. Data are represented as mean ± SD of n = 3 independent experiments. (H, I) Whole-cell lysates were prepared from the cells used in (G) and analyzed by immunoblotting with anti-HLTF (H), anti-RAD18 (I), and anti-Lamin B antibodies. The asterisk shows a cross-reactive band. (J) U2OS and U2OS HLTF KO cells were transfected with siRNA against SHPRH (siSHPRH) or non-targeting control siRNA (siNTC#1). Transfected cells were exposed to illudin S for 4 d and cellular survival was evaluated by MTS assay. Data are represented as means ± SD of n = 3 independent experiments. U2OS+siRAD18 data are replotted from (G). (K) Whole-cell lysates were prepared from the cells used in (J) and analyzed by immunoblotting with anti-HLTF and anti-Lamin B antibodies. (L) XP2OSSV and XP2OSSV/XPA cells were exposed to the indicated doses of illudin S for 4 d. Cellular survival was evaluated by MTS assay. Data are represented as means ± SD of n = 3 independent experiments. (M) Whole-cell lysates were prepared from the cells used in (L) and analyzed by immunoblotting with anti-XPA and anti-Lamin B antibodies. (N) CS1ANSV and CS1ANSV/HA-CSB-His cells were exposed to the indicated doses of illudin S for 4 d. Cellular survival was evaluated by MTS assay. Data are represented as means ± SD of n = 3 independent experiments. (O) Whole-cell lysates were prepared from the cells used in (N) and analyzed by immunoblotting using anti-CSB and anti-Lamin B antibodies. (P, Q) XP4PASV and XP4PASV/XPC cells were exposed to the indicated doses of illudin S for 4 d (P) or irradiated with the indicated doses of UV-C and incubated for 4 d (Q). Cellular survival was evaluated by MTS assay. Data are represented as means ± SD of n = 3 independent experiments. (R) Whole-cell lysates were prepared from the cells used in (P) and (Q) and analyzed by immunoblotting using anti-XPC and anti-Lamin B antibodies.
Source data are available for this figure.
Source Data for Figure S1[LSA-2022-01584_SdataFS1_FS3_FS4_FS5.pdf]
- Figure 1. PCNA ubiquitination is required for cell survival after illudin S and irofulven treatment independently of TC-NER.
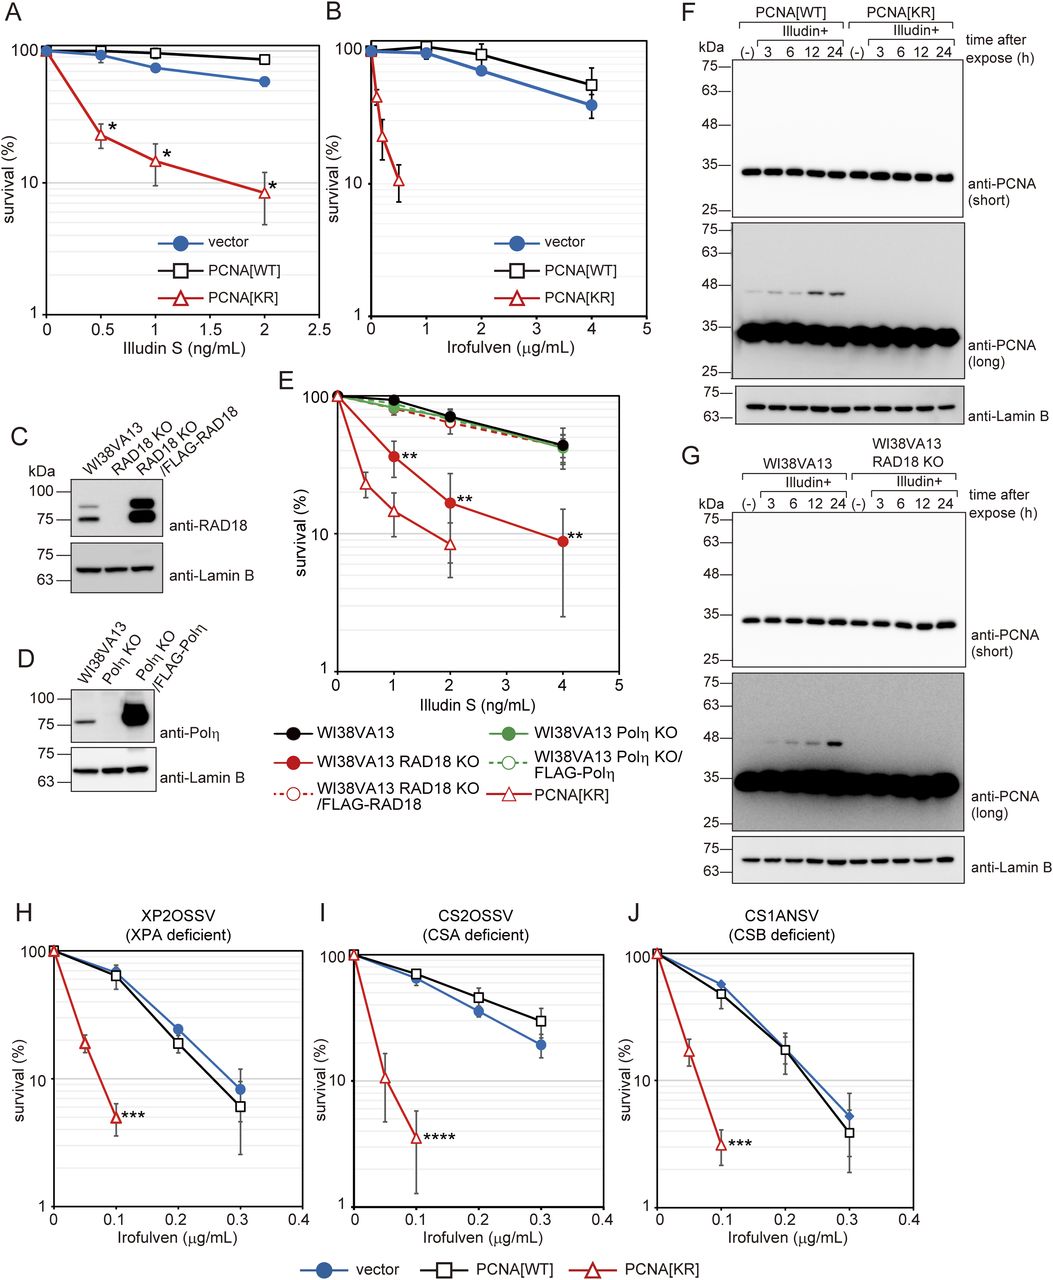
(A, B) WI38VA13-derived PCNA-replaced cells (PCNA[WT] or PCNA[KR]), formed by siPCNA transfection to ectopic PCNA-expressing cells, or cells harboring control empty vector (vector) were exposed to the indicated doses of illudin S for 4 d (A) or the indicated dose of irofulven for 1 h and subsequently incubated without the drug for 4 d (B). Cellular survival was evaluated by MTS assay. Data are represented as means ± SD of n = 4 (PCNA[WT] and PCNA[KR] in (A)) or n = 3 (vector in (A) and all samples in (B)) independent experiments. *P < 0.001 versus PCNA[WT]. (C, D) Whole-cell lysates were prepared from the cells used in (E) and analyzed by immunoblotting using anti-RAD18 and anti-Lamin B (C) or anti-Polη and anti-Lamin B1 (D) antibodies. (E) WI38VA13, WI38VA13 Polη KO, WI38VA13 Polη KO/FLAG-Polη, WI38VA13 RAD18 KO, and WI38VA13 RAD18 KO/FLAG-RAD18 cells were exposed to illudin S for 4 d and cellular survival was evaluated by MTS assays. Data are represented as means ± SD of n = 6 (WI38VA13), n = 4 (WI38VA13 Polη KO, WI38VA13 Polη KO/FLAG-Polη, or WI38VA13 RAD18 KO), or n = 3 (WI38VA13 RAD18 KO/FLAG-RAD18) independent experiments. **P < 0.01 versus WI38VA13. (F, G) WI38VA13/PCNA[WT] and PCNA[KR] cells (F), and WI38VA13 and RAD18 KO cells (G) were exposed to 50 ng/ml illudin S for 1 h and incubated for the indicated periods without the drug. (−), untreated with illudin S. Whole-cell lysates were prepared and analyzed by immunoblotting using anti-PCNA and anti-Lamin B antibodies. (H, I, J) Empty-vector–introduced (vector) and PCNA-replaced XP2OSSV (H), CS2OSSV (I), and CS1ANSV (J) cells (PCNA[WT] or PCNA[KR]) were exposed to the indicated doses of irofulven for 1 h. After 4 d, cellular survival was evaluated by MTS assays. Data are represented as means ± SD of n = 3 independent experiments. ***P < 0.005 versus PCNA[WT]; ****P < 0.001 versus PCNA[WT]. The statistical significance was evaluated by two-tailed t tests.
Source data are available for this figure.
Source Data for Figure 1[LSA-2022-01584_SdataF1_F2_F3_F4_F5.pdf]
- Figure 2. PCNA modifications are required for the progression of DNA replication after illudin S treatment.
(A, B) WI38VA13/PCNA[WT] or [KR] cells were exposed to 25 ng/ml illudin S (Illudin S +) or mock medium (Illudin S −) with 20 μM BrdU for 1 h and subsequently incubated for the indicated periods without drugs. BrdU was stained with Alexa Fluor 488-conjugated anti-BrdU antibody. DNA was stained with 7-amino-actinomycin D (7-AAD). Stained cells were analyzed by fluorescence-assisted cell sorting (FACS). (A) FACS profiles. (B) The proportion of BrdU-positive S-phase cells was calculated, and data are represented as mean ± SD of n = 3 independent experiments. (C) WI38VA13/PCNA[WT] or PCNA[KR] cells were exposed to 25 ng/ml illudin S for 1 h and subsequently incubated for the indicated periods without the drug. Cells were treated with 20 μM BrdU for 1 h at the indicated time points, harvested, and fixed. FACS analyses were performed as described above. (−), untreated with illudin S. Dotted lines show the median intensity of incorporated BrdU in the untreated cells. (D, E) WI38VA13/PCNA[WT] or [KR] cells were labeled with 25 μM CldU for 30 min, exposed to 50 ng/ml illudin S for 1 h, incubated for 0, 1, or 3 h without the drug, and then labeled with 250 μM IdU for 30 min. Incorporated CldU and IdU were stained with anti-BrdU antibodies. (D) Labeling scheme of the DNA fiber assay with representative images. Scale bar, 5 μm. (E) Quantified CldU (red) and IdU (green) track length. At least 80 tracks from two independent experiments were evaluated. The line represents the median; boxes are the 25th and 75th percentiles; whiskers are the minimum and the maximum values. ns, not significant. (F, G, H) WI38VA13/PCNA[WT] or [KR] cells were exposed to 25 ng/ml illudin S for 1 h and incubated for 6 or 18 h without the drug. After eliminating the detergent-soluble fraction, the cells were fixed and stained with anti-RPA2 and anti-γH2AX antibodies. Nuclei were visualized with Hoechst 33342. (F) Representative images. Scale bar, 20 μm. (G, H) Quantified RPA2 (G) or γH2AX (H) intensities in each nucleus. At least 130 nuclei were evaluated. (−), untreated with illudin S. (I) WI38VA13/PCNA[WT] and PCNA[KR] cells were exposed to 25 ng/ml illudin S for 1 h and incubated for the indicated periods without the drug. (−), untreated with illudin S. Whole-cell lysates were prepared and analyzed by immunoblotting using anti-phospho RPA2 (S4/S8), anti-RPA2, anti-γH2AX, and anti-H2AX antibodies. The statistical significance was evaluated by Welch’s t test (two-tailed, unpaired).
Source data are available for this figure.
Source Data for Figure 2[LSA-2022-01584_SdataF1_F2_F3_F4_F5.pdf]
- Figure S2. Changes in DNA replication after illudin S treatment.
(A) Two-dimensional dot plots (DNA content and BrdU signal) and cell cycle profiles of Fig 2C. Proportions of BrdU-positive cells were calculated. (B, C) PCNA[WT] or PCNA[KR] cells were subjected to DNA fiber assay without illudin S treatment, as described in Fig 2D and E. (B) Representative images. Scale bar, 5 μm. (C) Quantified CldU (red) and IdU (green) track length. At least 80 tracks from two independent experiments were evaluated. The line represents the median; boxes are the 25th and 75th percentiles; whiskers are the minimum and the maximum. (D) siNTC#2, siRFWD3#1, siPolκ#2, or siRFWD3#1+siPolκ#2 transfected cells were subjected to DNA fiber assay without illudin S treatment, as described in Fig 3K. Quantified CldU (red) and IdU (green) track length. At least 100 tracks from two independent experiments were evaluated. The line represents the median; boxes are the 25th and 75th percentiles; whiskers are the minimum and the maximum. (E) Two-dimensional dot plots (DNA content and BrdU signal) and cell cycle profiles of Fig 3J. Proportions of BrdU-positive cells were calculated.
- Figure 3. Polκ and RFWD3 contribute to cellular survival and efficient DNA replication progression after illudin S and irofulven treatment.
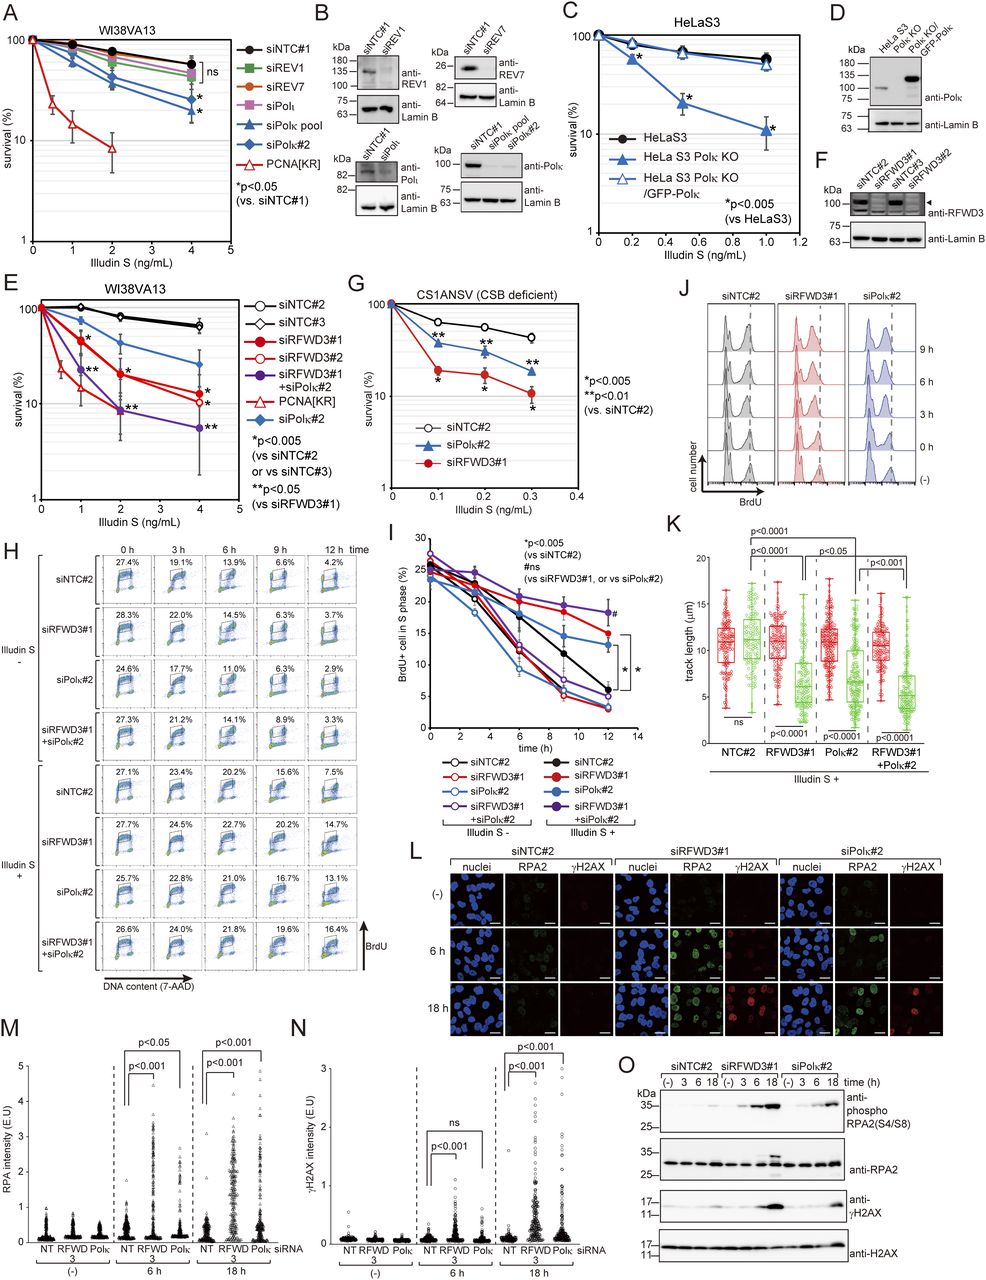
(A) WI38VA13 cells were transfected with siRNA against REV1 (siREV1), REV7 (siREV7), Polκ (siPolκ pool or siPolκ#2), Polι (siPolι), or non-targeting control siRNA (siNTC#1). Transfected cells were exposed to the indicated doses of illudin S for 4 d. Cellular survival was evaluated by MTS assay. Data are represented as means ± SD of n = 6 (siNTC#1 and siREV1), n = 4 (siPolκ pool and siPolκ#2), or n = 3 (siREV7, and siPolι) independent experiments. The data for PCNA[KR] are replotted from Fig 1C. (B) Whole-cell lysates were prepared from the cells used in (A) and analyzed by immunoblotting using anti-REV1, anti-REV7, anti-Polι, anti-Polκ, and anti-Lamin B antibodies. (C) HeLaS3, HeLaS3 Polκ KO, and HeLaS3 Polκ KO/GFP-Polκ cells were exposed to illudin S for 4 d. Cellular survival was evaluated by MTS assay. Data are represented as means ± SD of n = 7 (HeLaS3) or n = 3 (HeLaS3 Polκ KO and HeLaS3 Polκ KO/GFP-Polκ) independent experiments. (D) Whole-cell lysates were prepared from the cells used in (C) and analyzed by immunoblotting using anti-Polκ and anti-Lamin B antibodies. (E) WI38VA13 cells were transfected with siRNAs against RFWD3 (siRFWD3#1 or siRFWD3#2), siRFWD3#1+siPolκ#2, or non-targeting control siRNA (siNTC#2 or siNTC#3). Transfected cells were exposed to illudin S for 4 d and cellular survival was evaluated by MTS assay. Data are represented as means ± SD of n = 7 (siRFWD3#1), n = 6 (siNTC#2), or n = 3 (siNTC#3 and siRFWD3#2) independent experiments. The data for PCNA[KR] and siPolκ#2 are replotted from Figs 1A and 3A, respectively. (F) Whole-cell lysates were prepared from the cells used in (E) and analyzed by immunoblotting using anti-RFWD3 and anti-Lamin B antibodies. The arrowhead shows the RFWD3 signal. (G) CS1ANSV cells were transfected with siNTC#2, siRFWD3#1, or siPolκ#2. Transfected cells were exposed to illudin S for 4 d and cellular survival was evaluated by MTS assay. Data are represented as means ± SD of n = 3 independent experiments. (H, I) WI38VA13 cells were transfected with siRFWD3#1, Polκ#2, siRFWD3#1+siPolκ#2, or NTC#2. Cells were exposed to 25 ng/ml illudin S and 20 μM BrdU for 1 h and incubated for indicated periods without the drugs. Cells were analyzed as described in Fig 2A and B. (H) FACS profiles. (I) The proportion of BrdU-positive S-phase cells was calculated. Data are represented as mean ± SD of n = 3 independent experiments. (J) WI38VA13 cells were transfected with siRFWD3#1, siPolκ#2, or siNTC#2. Cells were exposed to 25 ng/ml illudin S for 1 h and then incubated for the indicated periods without the drug. Cells were treated with 20 μM BrdU for 1 h at the indicated time points, harvested, and fixed. FACS analyses were performed as described in Fig 2C. BrdU intensities are shown. (−), untreated sample. Dotted lines show the median intensity of incorporated BrdU in untreated cells. (K) WI38VA13 cells were transfected with siRFWD3#1, Polκ#2, siRFWD3#1+siPolκ#2, or NTC#2. Cells were labeled with 25 μM CldU for 30 min, exposed to 50 ng/ml illudin S for 1 h, incubated for 3 h without the drug, and labeled with 250 μM IdU for 30 min. Incorporated CldU and IdU were stained with anti-BrdU antibodies. Quantified CldU (red) and IdU (green) track length were shown. At least 100 tracks from two independent experiments were evaluated. The line represents the median; boxes are the 25th and 75th percentiles; whiskers are the minimum and the maximum values. (L, M, N) siRFWD3#1, siPolκ#2, or siNTC#2-transfected WI38VA13 cells were exposed to 25 ng/ml illudin S for 1 h and incubated for 6 or 18 h without the drug. RPA and γH2AX were detected and quantified as described in Fig 3D–F. (L) Representative images. Scale bar represents 20 μm. (M, N) Quantified RPA (M) or γH2AX (N) intensities in each nucleus. At least 150 nuclei were evaluated. (O) WI38VA13 cells were transfected with siRFWD3#1, siPolκ#2, or siNTC#2, exposed to 25 ng/ml illudin S for 1 h, and incubated for the indicated periods without the drug. (−), untreated with illudin S. Whole-cell lysates were prepared and analyzed by immunoblotting using anti-phospho RPA2 (S4/S8), anti-RPA2, anti-γH2AX, and anti-H2AX antibodies. The statistical significance was evaluated by two-tailed t tests. ns, not significant.
Source data are available for this figure.
Source Data for Figure 3[LSA-2022-01584_SdataF1_F2_F3_F4_F5.pdf]
- Figure S3. Effects of RFWD3 knockdown on RPA ubiquitination after illudin S treatment and effects of ICL-repair factors deficiency or knockdown on illudin S or irofulven survival and DNA synthesis.
(A) WI38VA13 cells were transfected with siNTC#2 or siRFWD3#1 and cultured for 2 d. Cells were then transfected with siRNAs and the FLAG-ubiquitin expression plasmid. 24 h after transfection, cell extracts were prepared and immunoprecipitated using anti-FLAG. Precipitated proteins were analyzed by immunoblotting with anti-RPA2, anti-RAD51, and anti-FLAG antibodies. (B) WI38VA13[WT] and [KR] cells were transfected with the FLAG-ubiquitin expression plasmid. Immunoprecipitation and immunoblotting were performed as in (A). (C) BRCA1-deficient HCC1937 cells and BRCA1-expressing HCC1937 (HCC1937+BRCA1) cells were exposed to the indicated doses of illudin S for 4 d. Cellular survival was evaluated by MTS assay. Data are represented as means ± SD of n = 4 independent experiments. (D) Whole-cell lysates were prepared from the cells used in (C) and analyzed by immunoblotting with anti-BRCA1 and anti-Lamin B antibodies. (E) FANCD2-deficient PD20F, PD20F/vector, and PD20F/3xFLAG-FANCD2 cells were exposed to illudin S for 4 d and cellular survival was evaluated by MTS assay. Data are represented as means ± SD of n = 4 independent experiments. (F) Whole-cell lysates were prepared from the cells used in (E) and analyzed by immunoblotting using anti-FANCD2 and anti-Lamin B antibodies. (G, H) PD20F and PD20F/3xFLAG-FANCD2 cells were exposed to illudin S for 1 h (G) or irofulven for 24 h (H) and cultured without the drug until colonies formed. Data are represented as means ± SD of n = 3 independent experiments. (I) WI38VA13 siRNA against FANCD2 (siFANCD2) or BRCA1 (siBRCA1#2). Transfected cells were treated with irofulven for 1 h. After 4 d, cellular survival was evaluated by MTS assay. Data are represented as means ± SD of n = 3 independent experiments. (J) Whole-cell lysates were prepared from the cells used in (I) and analyzed by immunoblotting with anti-BRCA1, anti-FANCD2, and anti-Lamin B antibodies. (K) siNTC#3, siRFWD3#2, siRAD51, or siBRCA1#2 transfected cells were subjected to DNA fiber assay as described in Fig 3K. Quantified CldU and IdU track length. At least 100 tracks from two independent experiments were evaluated. The line represents the median; boxes are the 25th and 75th percentiles; whiskers are the minimum and the maximum. Statistical significance was evaluated by unpaired t test (two-tailed). (L) Whole-cell lysates were prepared from the cells used in (K) and analyzed by immunoblotting with anti-RFWD3, anti-BRCA1, anti-RAD51, and anti-Lamin B antibodies.
Source data are available for this figure.
Source Data for Figure S3[LSA-2022-01584_SdataFS1_FS3_FS4_FS5.pdf]
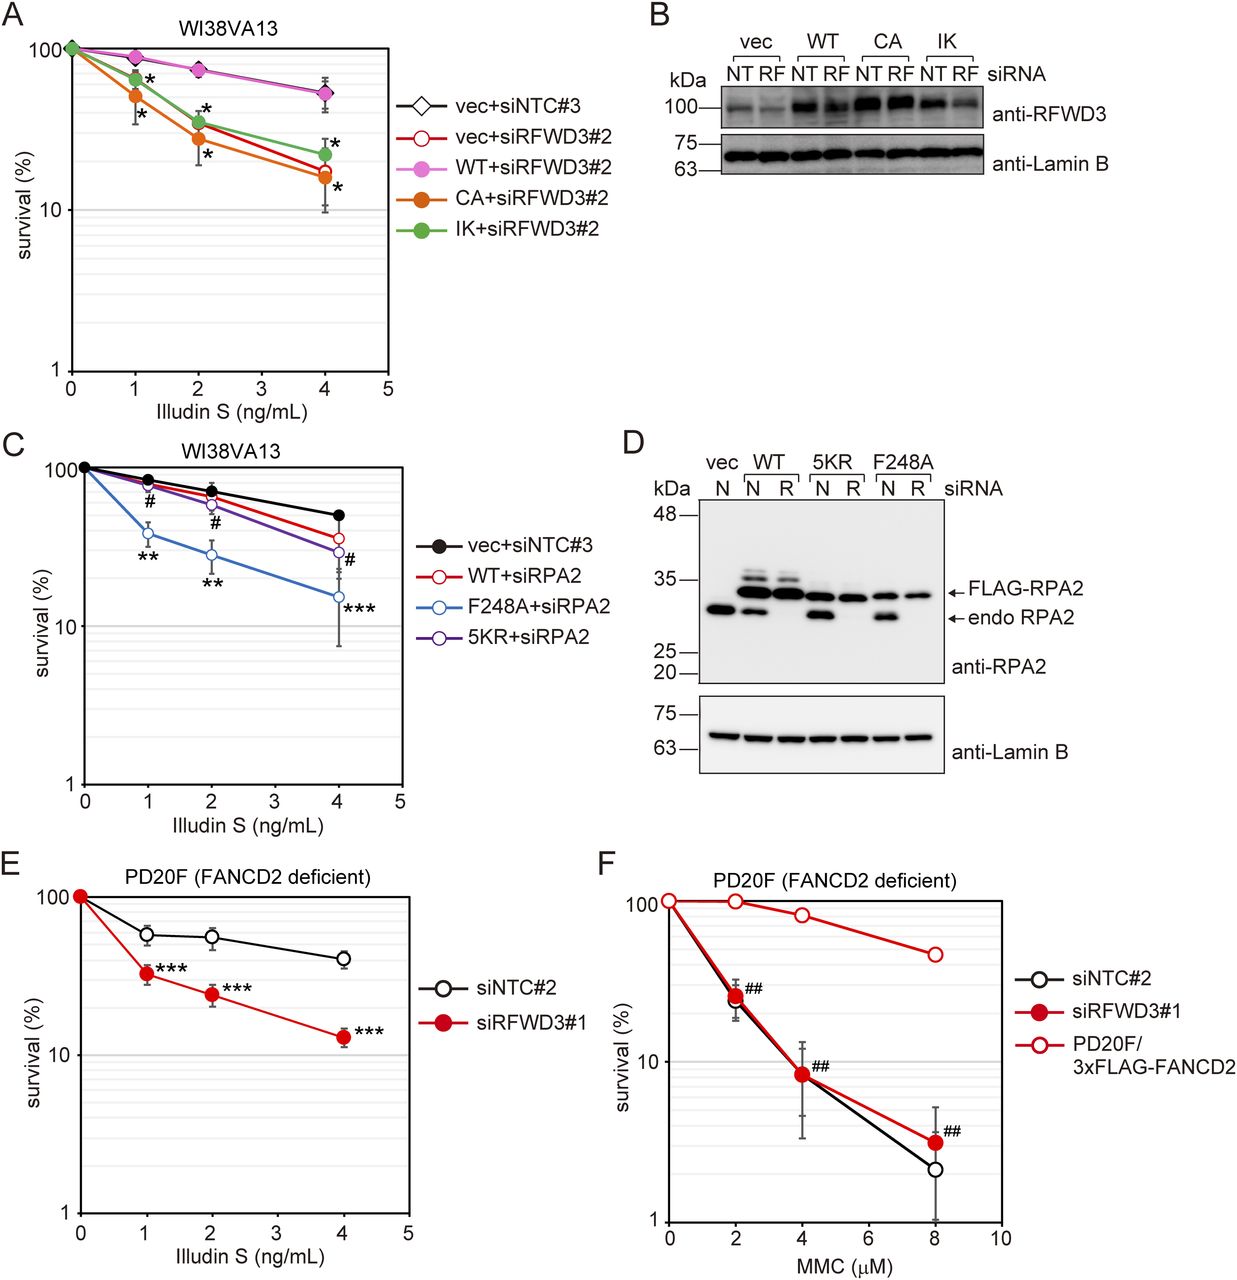
- Figure 4. RFWD3 contributes to cellular survival after illudin S treatment independently of the FANC-pathway.
(A) WI38VA13 cells stably expressing wild-type (WT) or mutant FLAG-RFWD3 were transfected with siRNA targeting the 3ʹ-UTR of RFWD3 (siRFWD3#2). Cells harboring empty vector (vec) were transfected with siRFWD3#2 or non-targeting control siRNA (siNTC#3). Transfected cells were exposed to illudin S for 4 d. Cellular survival was evaluated by MTS assay. Data are represented as means ± SD of n = 4 independent experiments. CA: C315A; IK: I639K. *P < 0.01 versus WT+siRFWD3#2. (B) WI38VA13 cells stably expressing wild-type (WT), mutant FLAG-RFWD3, or harboring the empty vector were transfected with siRFWD3#2 or siNTC#3. Whole-cell lysates were prepared and analyzed by immunoblotting using anti-RFWD3 and anti-Lamin B antibodies. NT: siNTC#3, RF: siRFWD3#2. (C) WI38VA13 cells stably expressing wild-type (WT) or mutant FLAG-RPA2 were transfected with siRNA targeting the 3ʹ-UTR of RPA2 (siRPA2). Cells harboring empty vector (vec) were transfected with non-targeting control siRNA (siNTC#3). Transfected cells were exposed to illudin S for 4 d. Cellular survival was evaluated by MTS assay. Data are represented as means ± SD of n = 3 (vec) or n = 4 (others) independent experiments. 5KR: K37R/K38R/K85R/K127R/K171R. **P < 0.01 versus WT+siRPA2; ***P = 0.09 versus WT+siRPA2; #, not significant versus WT+siRPA2. (D) WI38VA13 cells stably expressing wild-type (WT), mutant FLAG-RPA2, or harboring the empty vector were transfected with siRPA2 or siNTC#3. Whole-cell lysates were prepared and analyzed by immunoblotting using anti-RPA2 and anti-Lamin B antibodies. N: siNTC#3, R: siRPA2. (E, F) PD20F cells were transfected with siRFWD3#1 or siNTC#2. Transfected cells were exposed to the indicated doses of illudin S for 4 d (E) or the indicated doses of MMC for 1 h and subsequently incubated without the drug for 4 d (F). Cellular survival was evaluated by MTS assay. Data are represented as means ± SD of n = 3 independent experiments. ***P < 0.05 versus siNTC#2; ##, not significant versus siNTC#2. Statistical significance was evaluated by two-tailed t test.
Source data are available for this figure.
Source Data for Figure 4[LSA-2022-01584_SdataF1_F2_F3_F4_F5.pdf]
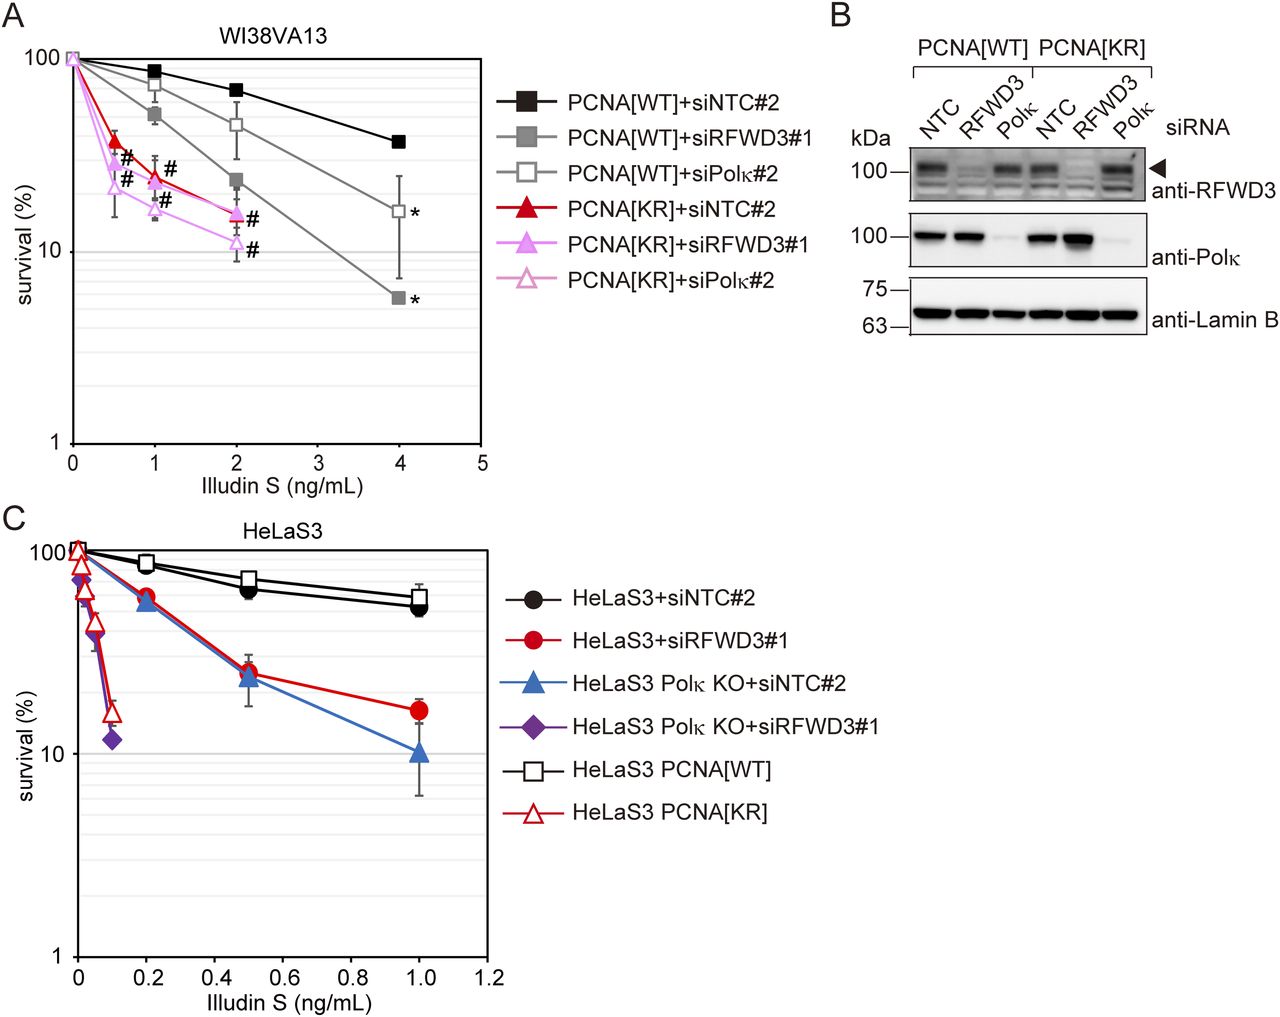
- Figure 5. RFWD3- and Polκ-mediated DNA damage tolerance pathways are independent of each other, but both are dependent on PCNA modifications at K164.
(A) PCNA[WT] and [KR] cells were transfected with siRFWD3#1, siPolκ#2, or siNTC#2. Cells were exposed to illudin S for 4 d and analyzed by MTS assay. Data are represented as means ± SD of n = 4 independent experiments. *P < 0.05 versus siNTC#2; #, not significant versus siNTC#2. (B) Whole-cell lysates from the cells using (A) were prepared and analyzed by immunoblotting using anti-RFWD3, anti-Polκ, and anti-Lamin B1 antibodies. The arrowhead shows the RFWD3 signal. (C) HeLaS3 and HeLaS3 Polκ KO cells were transfected with siRFWD3#1 or siNTC#2 and exposed to illudin S for 4 d. HeLaS3 PCNA[WT] or PCNA[KR] cells were exposed to illudin S for 4 d. Cellular survival was evaluated by MTS assay. Data are represented as means ± SD of n = 4 (HeLaS3+siNTC#2, HeLaS3+siRFWD3#2, and HeLaS3 Polκ KO+siNTC#2) or n = 3 (HeLaS3 Polκ KO+siRFWD3#1, HeLaS3 PCNA[WT], and PCNA[KR]) independent experiments. Statistical significance was evaluated by two-tailed t test.
Source data are available for this figure.
Source Data for Figure 5[LSA-2022-01584_SdataF1_F2_F3_F4_F5.pdf]
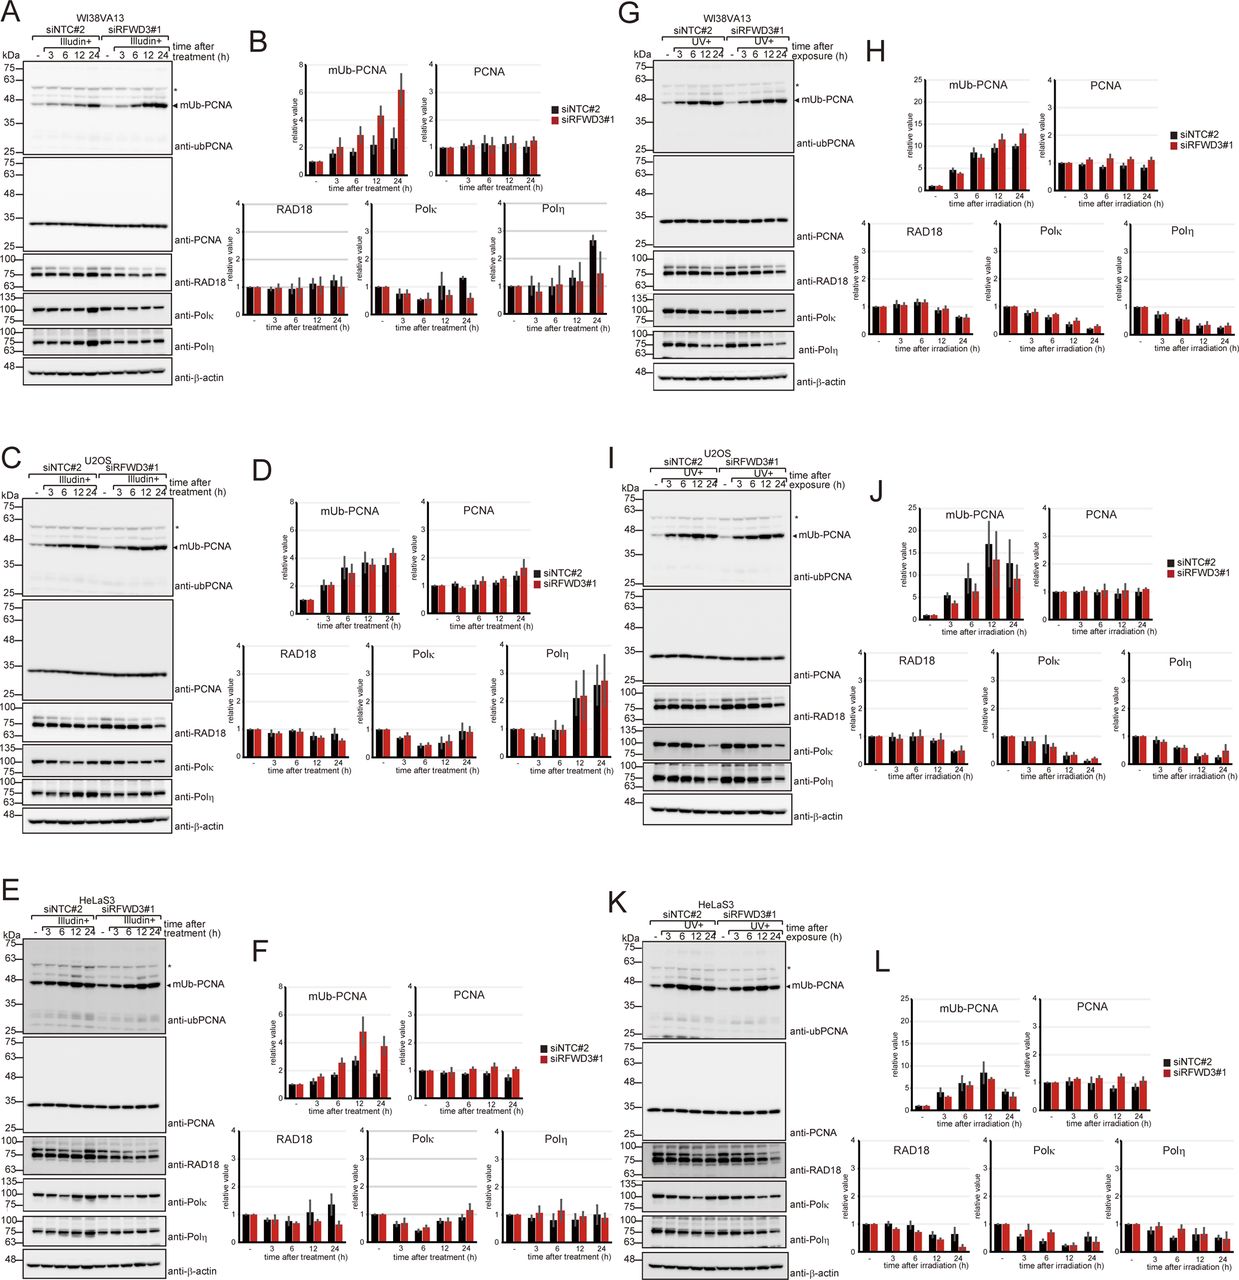
- Figure S4. Effects of RFWD3 knockdown on proliferating cell nuclear antigen (PCNA) ubiquitination.
(A, B, C, D, E, F, G, H, I, J, K, L) WI38VA13 (A, B, G, H), U2OS (C, D, I, J), or HeLaS3 (E, F, K, L) cells were transfected with siRFWD3#1 or siNTC#2. Cells were exposed to 50 ng/ml (A, B) or 25 ng/ml (C, D, E, F) illudin S for 1 h or irradiated with 20 J/m2 UV light (G, H, I, J, K, L) and subsequently incubated for the indicated periods without the drug. Whole-cell lysates were prepared and analyzed by immunoblotting with anti-ubiquityl PCNA, anti-PCNA, anti-RAD18, anti-Polκ, anti-Polη, and anti-β-actin antibodies. Representative images (A, C, E, G, I, K). Signal intensity was normalized to those from PCNA (mUb-PCNA) or β-actin (others) were quantified. The average values ± SD relative to untreated samples from n = 3 independent experiments were represented (B, D, F, H, J, L). mUb-PCNA; mono-ubiquitinated PCNA. The asterisk denotes a cross-reactive band.
Source data are available for this figure.
Source Data for Figure S4[LSA-2022-01584_SdataFS1_FS3_FS4_FS5.pdf]
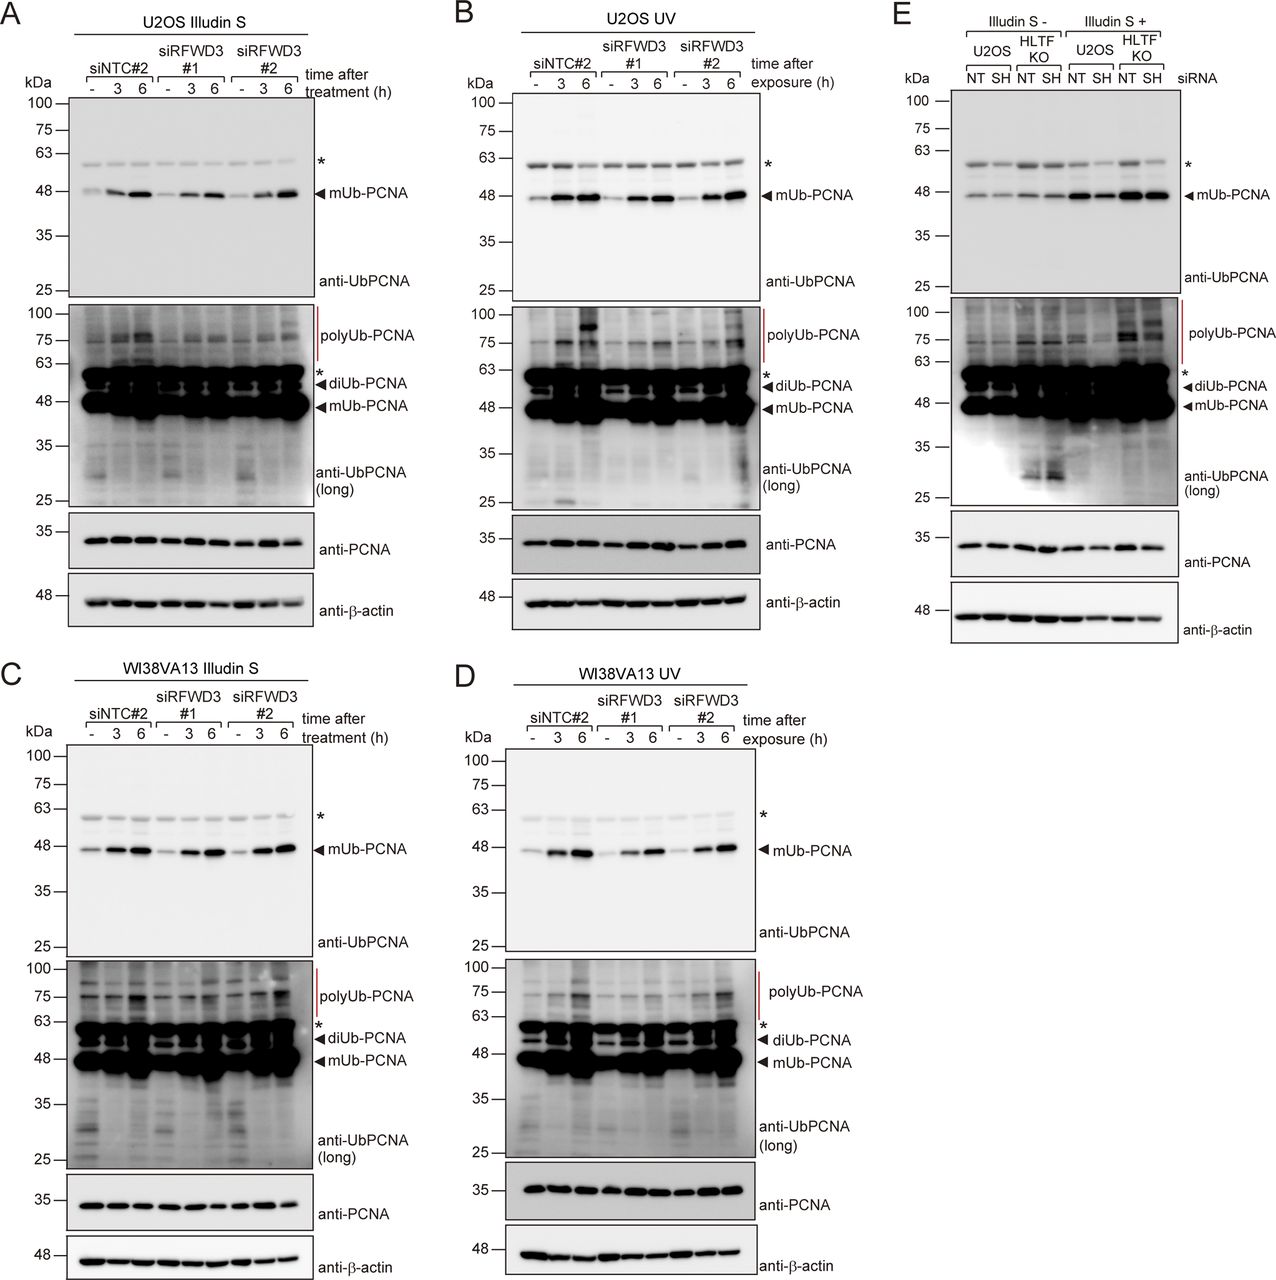
- Figure S5. Effects of RFWD3 knockdown on proliferating cell nuclear antigen (PCNA) poly-ubiquitination.
(A, B, C, D) U2OS (A, B) or WI38VA13 (C, D) cells were transfected with siNTC#2, siRFWD3#1, or siRFWD3#2. Cells were exposed to 100 ng/ml (A) 200 ng/ml (C) illudin S for 1 h or irradiated with 20 J/m2 UV light (B, D) and subsequently incubated for the indicated periods without the drug. Chromatin fractions were prepared and analyzed by immunoblotting with anti-ubiquityl PCNA, anti-PCNA, and anti-β-actin antibodies. (E) U2OS or HLTF KO cells were transfected with siSHPRH (SH) or siNTC#1 (NT). Cells were exposed to 100 ng/ml illudin S for 1 h and incubated for 6 h without the drug. Chromatin fractions were prepared and analyzed by immunoblotting with anti-ubiquityl PCNA, anti-PCNA, and anti-β-actin antibodies. The asterisk shows a cross-reactive band.
Source data are available for this figure.
Source Data for Figure S5[LSA-2022-01584_SdataFS1_FS3_FS4_FS5.pdf]
- Figure 6. RFWD3 participates in DNA damage tolerance of UV-induced DNA damage dependent on PCNA modifications at K164.
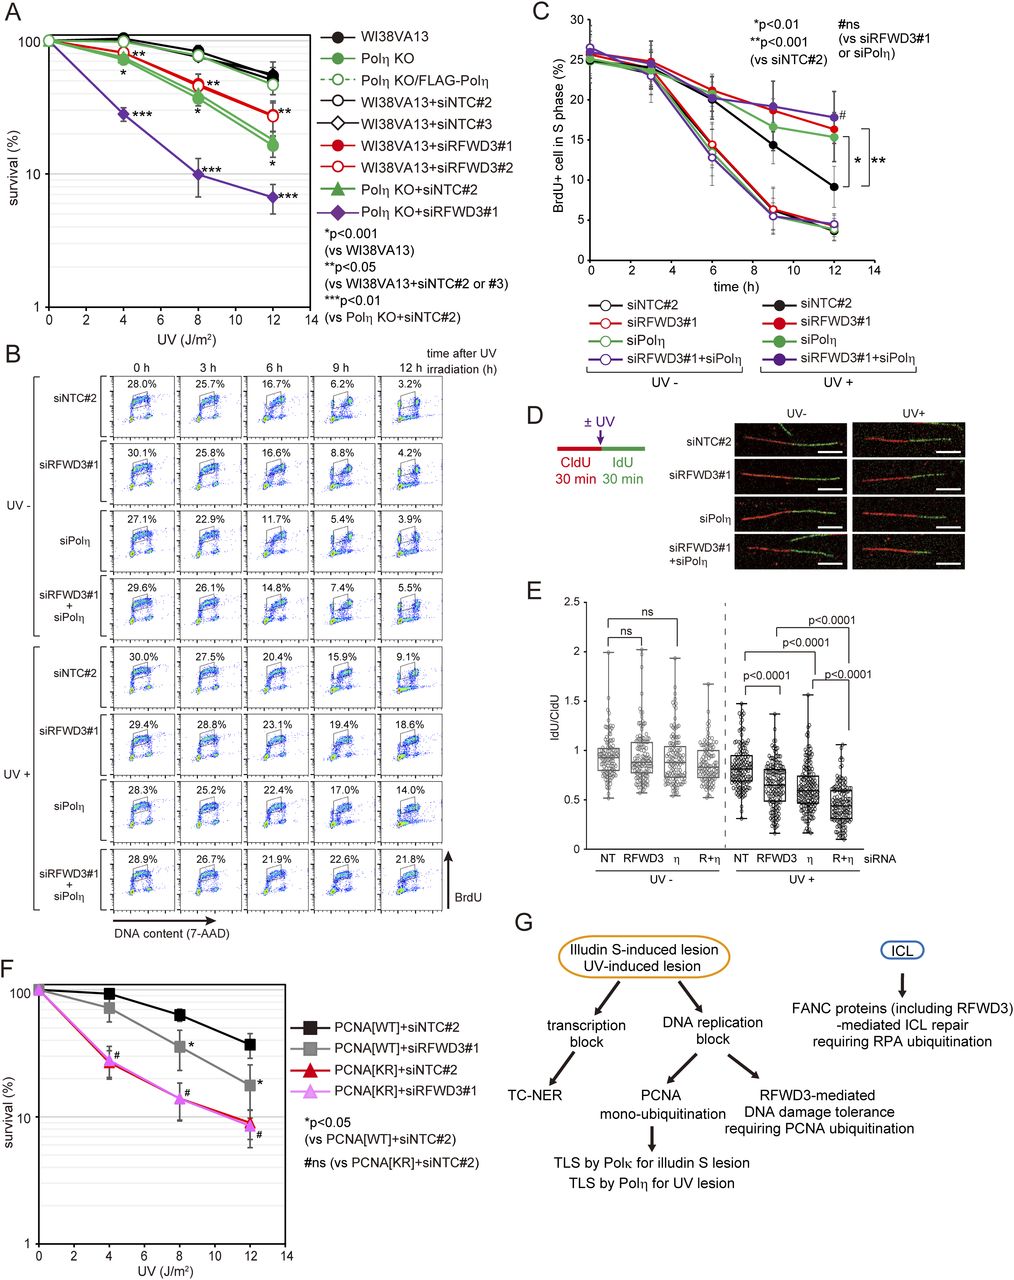
(A) WI38VA13 cells were transfected with siNTC#2, siNTC#3, siRFWD3#1, or siRFWD3#2. WI38VA13 Polη KO cells were transfected with siNTC#2 or siRFWD3#1. The transfected cells and WI38VA13, WI38VA13 Polη KO, or WI38VA13 Polη KO/FLAG-Polη cells were irradiated with the indicated dose of UV-C and subsequently incubated for 4 d. Cellular survival was evaluated by MTS assay. Data are represented as means ± SD of n = 5 (WI38VA13), n = 4 (Polη KO, Polη KO/FLAG-Polη, and WI38VA13+siNTC#3), or n = 3 (WI38VA13+siNTC#2, WI38VA13+siRFWD3#1, WI38VA13+siRFWD3#2, Polη KO+siNTC#2, and Polη KO+siRFWD3#1) independent experiments. (B, C) WI38VA13 cells were transfected with siRFWD3#1, siPolη, siRFWD3#1+siPolη, or siNTC#2. Cells were irradiated with 4 J/m2 UV light, exposed to 20 μM BrdU for 1 h, and incubated for the indicated periods. The cells were analyzed as described in Fig 3A and B. (B) FACS profiles. (C) The proportion of BrdU-positive S-phase cells was calculated. Data are represented as means ± SD of n = 3 independent experiments. (D, E) WI38VA13 cells were transfected with siRFWD3#1, siPolη, siRFWD3#1+siPolη, or siNTC#2. Cells were labeled with 25 μM CldU for 30 min, irradiated with 8 J/m2 UV light, and labeled with 250 μM IdU for 30 min. Incorporated CldU and IdU were stained with anti-BrdU antibodies. (D) Labeling scheme of DNA fiber assay and representative images. Scale bar, 5 μm. (E) The ratio between CldU and IdU track length are shown. At least 100 tracks from two independent experiments were evaluated. The line represents the median; boxes are the 25th and 75th percentiles; whiskers are the minimum and the maximum. η; Polη, R+η; RFWD3+Polη. (F) PCNA[WT] and [KR] cells were transfected with siRFWD3#1 or siNTC#2. The cells were irradiated with the indicated dose of UV-C and subsequently incubated for 4 d. Cellular survival was evaluated by MTS assay. Data are represented as the mean ± SD of n = 4 (PCNA[WT]+siRFWD3#1 and PCNA[KR]+siRFWD3#1) or n = 3 (PCNA[WT]+siNTC#2 and PCNA[KR]+siNTC#2) independent experiments. (G) Model of DNA damage tolerance pathways for illudin S–induced, UV-induced, and ICL DNA lesions. Blockage of DNA replicative polymerases is resolved by two pathways for DNA damage tolerance. One pathway involves TLS, in which lesion-specific DNA polymerases, Polη for UV- and Polκ for illudin S lesions, respectively, resolve the blocked DNA replication. The other pathway is mediated by RFWD3 and is distinct from FANC pathway. Statistical significance was evaluated by two-tailed t test. ns, not significant.


Supplementary Materials
Table S1. The list of genes in the DNA repair siRNA library and the summary of results of the screening assay. [LSA-2022-01584_TableS1.xlsx]


In this Issue
Subjects
Related Articles
Cited By...
- No citing articles found.