


Article Figures & Data
Figures
- Figure S1. Depletion of RSC increases divergent transcript accumulation at Rap1-regulated genes.
(A) Rpb3-FLAG immunoprecipitation as detected by Western blot. Rpb3-FLAG was immunoprecipitated from WT (FW7228) cells or cells harbouring AID-tagged alleles for Sth1, Rap1, and Sth1 + Rap1 (STH1-AID, RAP1-AID, RAP1-AID + STH1-AID) (FW7238, FW7220, and FW7232). AID-tagged cells were either treated with IAA (Sth1 depletion) or DMSO (control). Samples corresponding to input (I), flow-through (FT), FLAG elution (E), and boiling in sample buffer from FLAG beads (B) are shown. For each condition, three biological repeats were generated, and a representative experiment is shown. (B) Principal component analysis of the most variable genes in nascent RNA and mRNA-seq. (A) Samples as described in (A). Each open circle represents a single repeat experiment. (C) Differential expression (log2FC) of 141 Rap1-regulated genes mRNA-seq IAA-treated cells compared with wild-type cells. Each dot represents one coding gene transcript, average of biological repeats (n = 3). (D) Nascent RNA-seq and mRNA-seq signals for RPL40B (coding sense direction, grey) and iMLP1 (divergent coding direction, purple), as in Fig 1C and D. (E) Heatmap representing changes in RNA expression levels in the divergent noncoding direction in controls. Similar to Fig 1E, but differences between DMSO and WT for each AID-tagged strain are displayed.
Source data are available for this figure.
Source Data for Figure S1[LSA-2022-01394_SdataFS1.pdf]
- Figure 1. Depletion of RSC increases divergent transcript accumulation at Rap1-regulated genes.
(A) Top: Rap1 and Sth1 depletions using AID-tagged strains (RAP1-AID, STH1-AID, RAP1-AID/STH1-AID) (FW7238, FW7220, and FW7232) together with WT control (FW7228). Cells were grown until the exponential growth phase and treated with IAA (0.5 mM) for 2 h. AID-tagged proteins were detected by Western blot using anti-V5 antibodies. Hxk1 was used as a loading control, detected using anti-Hxk1 antibodies. One representative biological replicate is shown. Bottom: scheme for nascent RNA-seq and mRNA-seq experiment of Rap1 and Sth1 depletion (dpl). To control for global changes in RNA expression, we added Schizosaccharomyces pombe cells as spike-in controls (see the Materials and Methods section) and performed mRNA-seq analysis using S. pombe (sp) normalisation. (B) Differential expression (log2 fold change, FC) of 141 Rap1-regulated genes according to nascent RNA-seq and mRNA-seq, in IAA-treated cells compared with mock-treated cells (DMSO). Each dot represents one coding gene transcript, average values of biological repeats (n = 3). (C) Nascent RNA-seq and mRNA-seq signals at the RPL43B locus (coding sense direction, grey) and IRT2 (divergent coding direction, purple). The data of a representative replicate are shown. (D) Similar as C, except that, the RPS10A locus and the corresponding divergent transcripts are shown. (E) Heatmap representing changes in expression levels in the divergent noncoding direction (antisense strand). Promoters were clustered based on antisense strand signal using k-means clustering (k = 3, [c1, c2, and c3]) based on previous analysis for Rap1-regulated gene promoters (Wu et al, 2018). Differences between IAA and DMSO treatment (log2FC) are displayed for each depletion strain, in one representative replicate.
Source data are available for this figure.
Source Data for Figure 1[LSA-2022-01394_SdataF1.pdf]
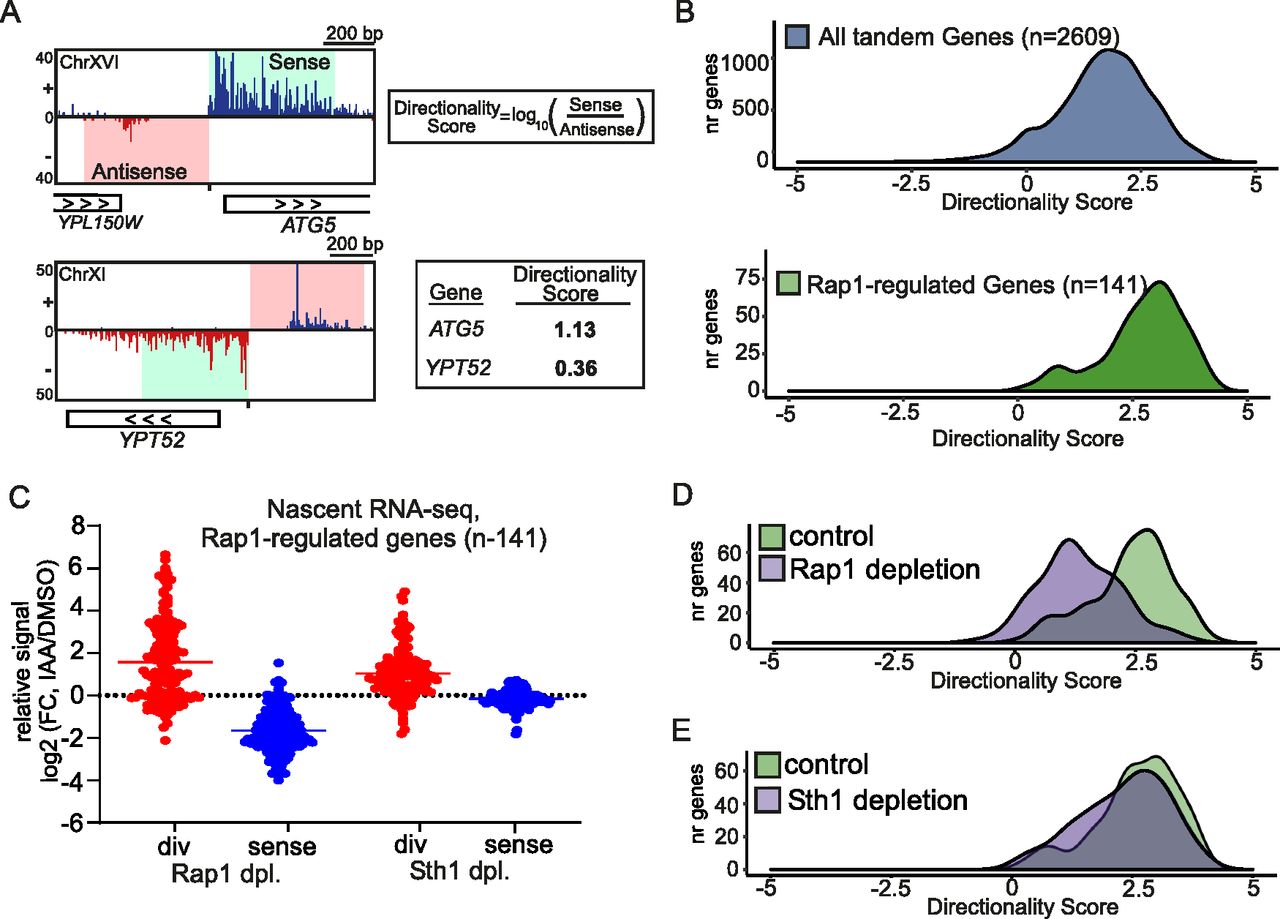
- Figure 2. Depletion of RSC increases divergent transcription and alters promoter directionality.
(A) Approach for calculating directionality score for each promoter. In short, the nascent RNA-seq signals 500 bp upstream (antisense strand) and 500 bp downstream (sense strand) of the coding gene transcription start site were taken. Subsequently, the ratio of sense over antisense signals (log10) was computed, which was defined as the directionality score. Another approach was also described in Jin et al (2017). (B) Density plots of directionality scores for tandem non-overlapping genes (n = 2,609) and Rap1-regulated genes (n = 141). (C) Relative changes in divergent (red) or sense (blue) transcription levels in cells depleted (dpl) for Rap1 or Sth1 (RAP1-AID or STH1-AID) in comparison to the corresponding mock-treated cells (IAA/DMSO) for Rap1-regulated gene promoters (n = 141). The nascent RNA-seq signals in the regions upstream (500 bp on the antisense strand, red) and 500 bp downstream (sense strand, blue) of the transcription start site were quantified and compared. Each dot represents one gene, for which the average log2(FC) value between replicates is shown. (D) Density plot representing promoter directionality of control (RAP1-AID +DMSO) and Rap1-depleted cells (RAP1-AID + IAA) for Rap1-regulated genes (n = 141). Average values between biological replicates (n = 3) are shown. (E) Similar as (D), except comparing control (STH1-AID + DMSO) and Sth1-depleted (STH1-AID + IAA) cells.
- Figure 3. RSC depletion affects promoter directionality genome-wide.
(A) Volcano plots of nascent RNA-seq data comparing Sth1-depleted to control cells (log2(FC) IAA/DMSO) for different classes of transcription units. Displayed are plots for protein-coding genes and noncoding transcripts: CUTs, SUTs, XUTs, and NUTs. Numbers of loci with significantly increased (UP) or decreased (DOWN) levels of transcription are displayed (Padj < 0.05 and log2(FC) > 1). Average values between biological replicates (n = 3) are shown. (B) Violin plots displaying the relative changes in divergent (red) or sense (blue) nascent RNA-seq signal of tandem non-overlapping protein-coding genes (n = 2,609). Comparisons between Sth1 depletion (STH1-AID + IAA) and control (STH1-AID + DMSO) or control versus WT are shown. The nascent RNA-seq signals in the regions upstream (500 bp on the antisense strand, red) and 500 bp downstream (sense strand, blue) of the transcription start site were quantified and compared. Average log2(FC) values between replicates (n = 3) are shown. (C) Promoter directionality score of tandem non-overlapping protein-coding genes (n = 2,609) in WT, control (STH1-AID + DMSO), and Sth1-depleted (STH1-AID +IAA) cells. Average values between replicates (n = 3) are represented.
- Figure 4. RSC acts on highly directional promoters.
(A) Violin plots representing the distribution of changes in divergent transcription (left), sense transcription (centre), and directionality score (right) in Sth1-depleted versus control cells (log2(FC) IAA/DMSO), in sets of tandem genes stratified according to their directionality in WT cells (x-axis, Q1 to Q5). The range for directionality scores for each group are the following: Q1(−3.11–0.85), Q2(0.86–1.49), Q3(1.50–1.97), Q4(1.98–2.48), Q5(2.49–4.20). Average values between replicates (n = 3) are represented. (B) Examples of loci that display increased divergent transcription and changes in chromatin structure upon Sth1 depletion. The data of a representative replicate of the nascent RNA-seq, mRNA-seq, and MNase-seq are shown. (A, C) Metagene analysis of MNase-seq data for Q1 and Q5 (directionality in WT cells) obtained as described in (A). Plots are centred on annotated gene transcription start site, and they display MNase-seq signals for chromatin extracts treated with low MNase or high MNase concentrations, obtained from Kubik et al (2015, 2018) (n = 1). Marked are the regions representing the +1, −1 nucleosome, and −2 nucleosome positions. (C, D) Heatmap of MNase-seq data represented in (C), centred on the annotated gene transcription start site.
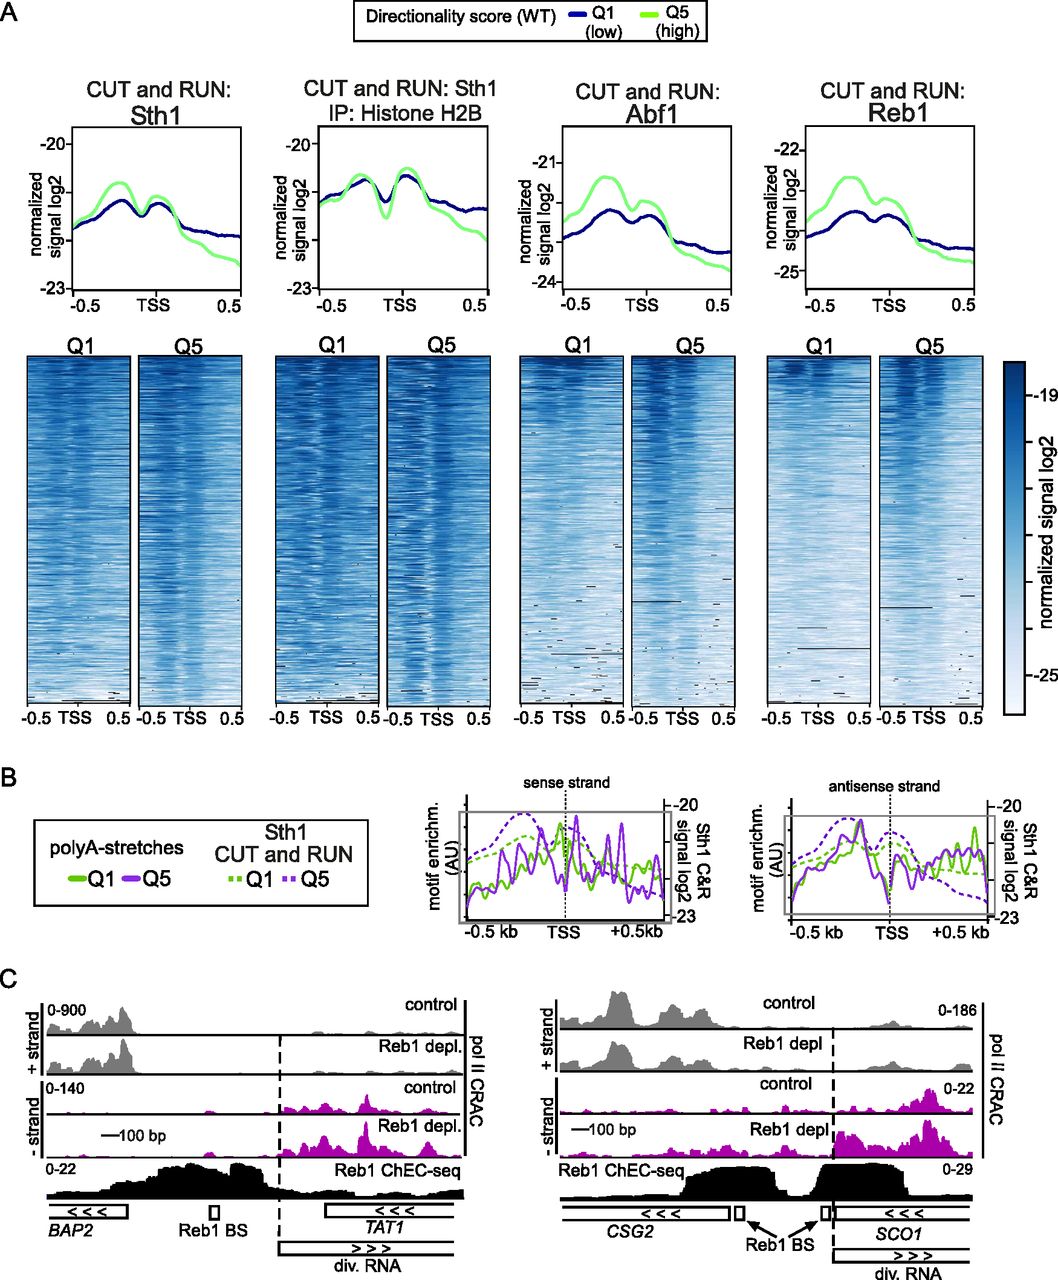
- Figure 5. RSC and general regulatory factors are enriched upstream in promoters with a high directional score.
(A) Metagene analysis and heatmaps of CUT&RUN data of Sth1 (RSC) and the general regulatory factors Abf1 and Reb1. In addition, signals of Sth1 CUT&RUN followed by histone H2B immunoprecipitation are displayed. Data from Brahma and Henikoff (2019). A comparison between genes belonging to directionality Q1 (purple), the group of gene promoters with lowest directionality score, and Q5 (green), the group with the highest directionality score, is shown. The data represent one of n = 2 biological repeats. (A, B) Distribution of the RSC-associated A-track motif for both the sense and antisense strand for Q1 and Q5 overlaid with the RSC CUT&RUN data from panel (A). (C) Data from RNA Pol II CRAC and Reb1-ChEC-seq datasets described previously (Zentner et al, 2015; Candelli et al, 2018), representing RNA Pol II transcription in the presence or absence of Reb1 (top) and binding of Reb1 (bottom), respectively. Displayed are the BAP2 and SCO1 loci, which show increased divergent transcription upon Reb1 depletion. The positions of the Reb1-binding sites (BS) are indicated.
- Figure S2. Density plots of promoter directionality scores.
(A) Density plots representing promoter directionality scores in WT cells for all genes (n = 6,646) and tandem genes (n = 2,609). Average values between replicates (n = 3) are shown. (B) Relative changes in mRNA levels in cells depleted for Rap1 (RAP1-AID + IAA), Sth1 (STH1-AID + IAA), or both (RAP1-AID/STH1-AID + IAA) in comparison to the mock-treated cells (IAA/DMSO) for 141 Rap1-regulated genes. The mRNA-seq signals in the regions upstream (500 bp on the antisense strand, red) and 500 bp downstream (sense strand, blue) of the transcription start site were quantified and compared. Each dot represents one gene, for which the average log2(FC) value between replicates is shown.
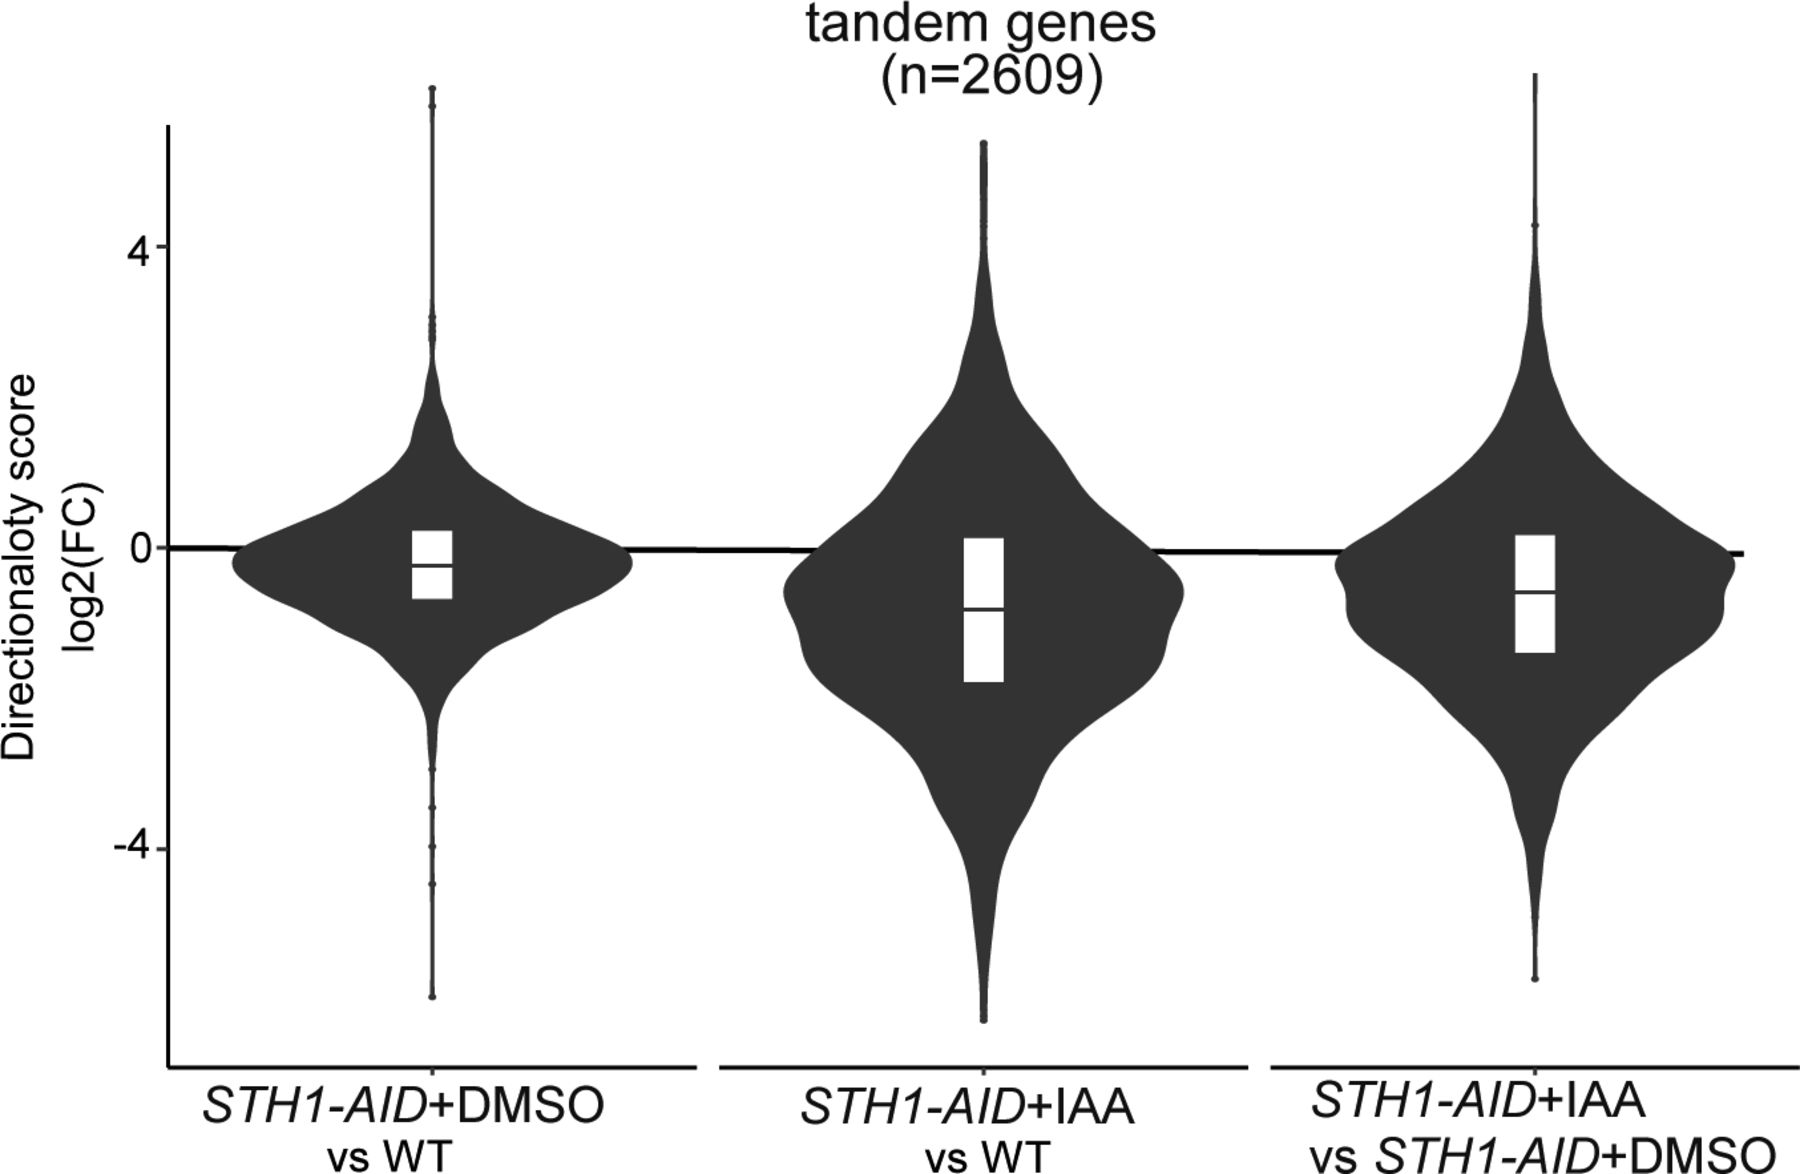
- Figure S3. RSC depletion affects promoter directionality genome-wide.
Violin plots representing the changes in promoter directionality scores. Average log2(FC) value between replicates is shown.
- Figure S4. RSC acts at highly directional promoters.
(A) Violin plots displaying the distribution of changes in divergent transcription (left), sense transcription (centre), and directionality score (right) in Sth1-depleted versus WT cells (log2(FC) IAA/WT), in sets of tandem genes stratified according to their directionality in WT cells (x-axis, Q1 to Q5). Q1 and Q5, respectively, show the group of gene promoters with lowest and highest directionality score in WT cells. The range for directionality scores for each group are the following: Q1(−3.11–0.85), Q2(0.86–1.49), Q3(1.50–1.97), Q4(1.98–2.48), Q5(2.49–4.20). (B) Violin plots displaying the distribution of changes in divergent transcription (left), sense transcription (centre), and directionality score (right) in Sth1-depleted versus control cells (log2(FC) IAA/DMSO), in sets of tandem genes stratified according to their sense signal in WT cells (x-axis, Q1 to Q5). Q1 and Q5, respectively, show the group of gene promoters with lowest and highest directionality score in WT cells. The range for directionality scores for each group are the following: Q1(0.99–239), Q2(240–746), Q3(747–1,440), Q4(1,441–2,848), Q5(2,849–105.685). Average values between replicates (n = 3) are represented. (C) Violin plots showing the distribution of changes in divergent transcription (log2(FC) IAA/DMSO) in either the set of gene promoters with the highest transcription (Q5 sense WT, as in Fig S4B) or the set of gene promoters with the highest directionality scores (Q5 directionality WT, as in Fig 4A). (D) Similar as (A), but displayed is the comparison of control versus WT (DMSO/WT) sorted on directionality score. (E) Same data as in Fig 4A (left panel), but the data are represented by a scatter plot. (F) Same data as in Fig S4B (left panel), but the data are represented by a scatter plot. (G) Metagene and heatmap analysis of MNase-seq data obtained from Klein-Brill et al (2019) for genes belonging to directionality Q1 and Q5. Plots are centred on coding gene transcription start site as in Fig 4C and D, and replicates (n = 2) are shown separately. Marked are the regions representing the +1, −1, and −2 nucleosome positions.
- Figure S5. RSC and general regulatory factors are enriched upstream in promoters with a high directionality score.
(A) Same analysis as in Fig 5A, except that the two biological repeats are displayed. Metagene analysis and heatmaps of CUT&RUN data of Sth1 (RSC) and the general regulatory factors Abf1 and Reb1. Data obtained from Brahma and Henikoff (2019). (B) Distribution of the RSC-associated GC-track motif for both the sense and antisense strand for Q1 and Q5. The RSC CUT&RUN data were overlaid with the RSC binding motif sequences.
- Figure 6. Targeting general regulatory factors or dCas9 to divergent core promoters is sufficient to repress divergent noncoding transcription.
(A) Schematic overview of the reporter construct. The transcription factor binding sites were cloned 20 nucleotides upstream of the YFP (SUT129) transcription start site (TSS). (B) YFP, noncoding, signal for constructs harbouring binding sites for Gal4, Gcn4, Cat8, Gcr1, Cbf1, Abf1, and Reb1 cloned into the WT PPT1 promoter (FW6407). The YFP activity was determined in WT control cells and in gene deletion strains of matching transcription factor binding site reporter constructs (FW6404, FW6306, FW6401, FW6300, FW6402, FW6302, FW6403, FW6424, FW6405, and FW6315). For Abf1 and Reb1 reporter constructs, Abf1 and Reb1 were depleted using the auxin-inducible degron (ABF1-AID and REB1-AID) (FW6415 and FW6411). Cells were treated for 2 h with IAA or DMSO. Displayed is the mean signal of at least 50 cells. The error bars represent 95% confidence intervals. (C) Same analysis as B except that coding direction is shown. (B, D) Same analysis as (B) except that directionality was calculated by taking the ratio of coding over noncoding. (E) Scheme depicting the targeting of dCas9 to repress the divergent transcript IRT2. (F) Design of gRNAs targeting the IRT2 TSS. Displayed are TSS-seq data from after Rap1 depletion (Wu et al, 2018). (G) Western blot of Rap1 and dCas9 detected with anti-V5 and anti-FLAG antibodies, respectively. Cells harbouring RAP1-AID were treated with IAA to deplete Rap1 and induce IRT2 expression in either cells with empty vector (EV) or cells harbouring a dCas9 construct and a construct expressing the gRNA targeted to the Rap1-binding site (FW8477, FW8531). Hxk1 was used as a loading control, detected using anti-Hxk1 antibodies. (E, H) IRT2 expression detected by Northern blot for strains and treatments described in (E). As a loading control, the membrane was re-probed for SNR190. (D, I) IRT2 expression as detected in by qRT-PCR of as described in (D). A control gRNA was included in the analysis targeted to the TSS of TEF1 (FW8527). Displayed are the mean signals of n = 3 biological repeats and SEM. (J) Model for promoter directionality.
Source data are available for this figure.
Source Data for Figure 6[LSA-2022-01394_SdataF6.pdf]
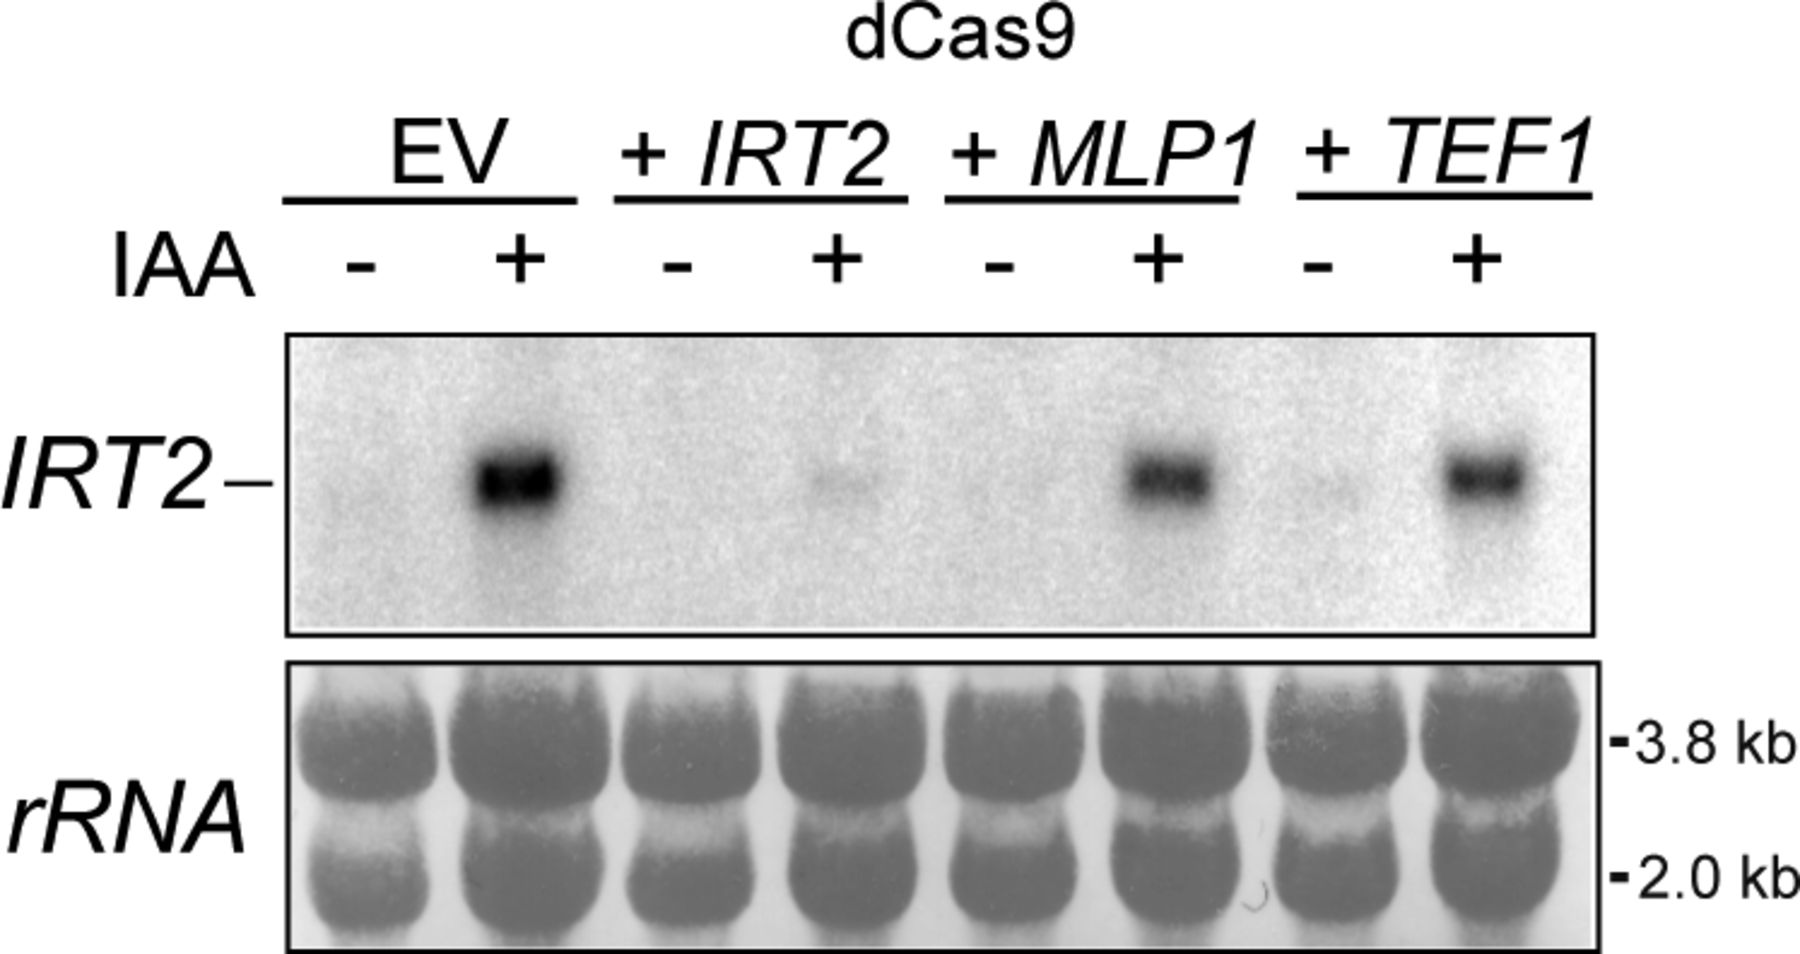
- Figure S6. Targeting general regulatory factors or dCas9 to divergent core promoters is sufficient to repress divergent noncoding transcription.
Northern blot of IRT2 expression in the Rap1 depletion of samples strains described below. Cells harbouring RAP1-AID were treated IAA to deplete Rap1 and induce IRT2 and expressing dCas9 were used for the analysis. Empty vector (EV) and gRNAs targeting IRT2, including control gRNAs targeting iMLP1 and TEF1, were used (FW8477, FW8531, FW8529, and FW8535). As a loading control, rRNA staining is shown.
Source data are available for this figure.
Source Data for Figure S6[LSA-2022-01394_SdataFS6.pdf]


Tables
The following antibodies were used for Western blotting.
Antibody Dilution Source Reference Anti-hexokinase rabbit IgG 1:8,000 US Biological H2035 Anti-FLAG mouse monoclonal IgG1, clone M2 1:2,000 Sigma-Aldrich (Merck) F3165 Amersham ECL anti-mouse IgG, HRP-linked whole antibody (from sheep) 1:10,000 GE Life Sciences NA931V5 Amersham ECL anti-rabbit IgG, HRP-linked whole antibody (from donkey) 1:10,000 GE Life Sciences NA934V


In this Issue
Subjects
Related Articles
Cited By...
- No citing articles found.