


Article Figures & Data
Figures
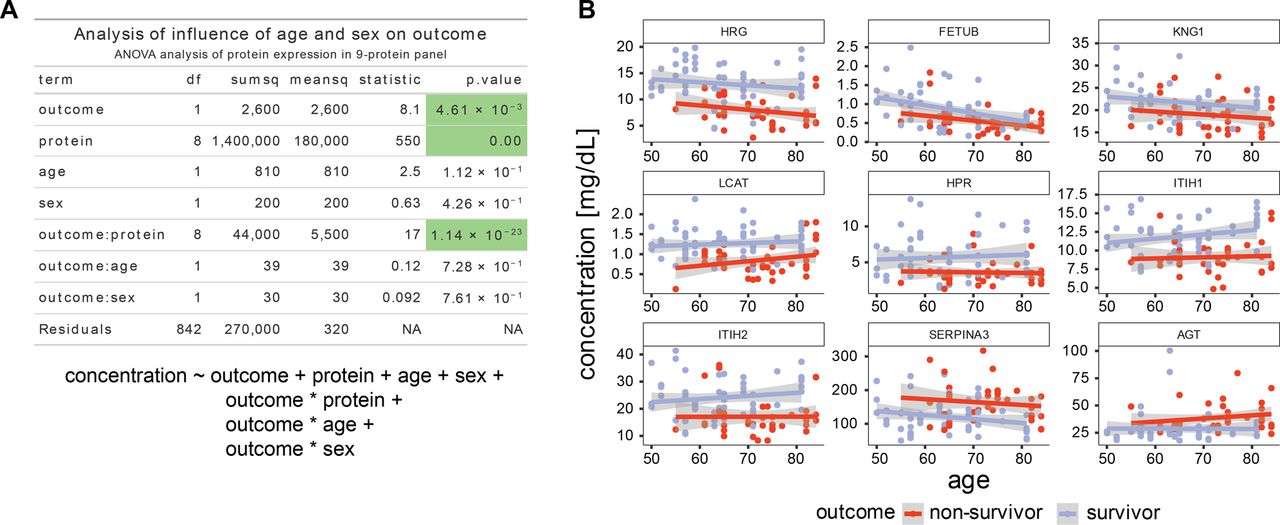
- Figure S1. Age and gender do not substantially affect the outcome.
(A) ANOVA table. The variance of the observed protein levels is analyzed for the influence of the identity of the protein, the outcome (survivor/non-survivor), age, and sex. In this analysis, we also included interaction terms between outcome and protein ID, outcome and sex, and outcome and age. The significant terms are outcome, protein ID and the interaction between protein ID and outcome, supporting the claim that the chosen protein IDs (i.e., the 9-protein panel) and the outcomes are not independent and can be used to classify outcome by levels of the selected proteins. Underneath is the formula used to fit the linear model. (B) Illustrations of the lack of interaction between age and outcome. A plot of the dependence of protein levels on age split up between different outcome groups, in blue are survivors and in red are non-survivors. Even though there are protein concentration trends that depend on age, the outcome has a more pronounced influence, whereas the age-dependent slope is not significantly different between the two outcome groups.
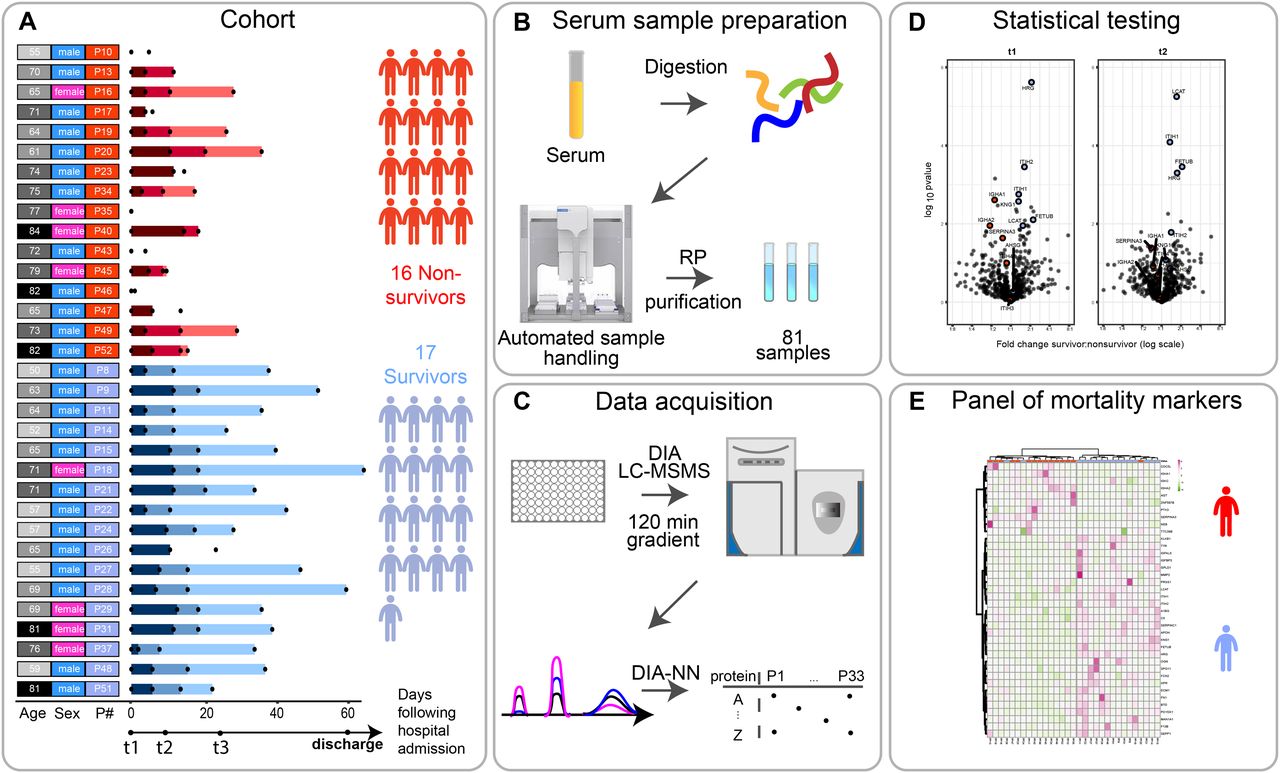
- Figure 1. Scheme of the cohort and timing of the blood sample collection, based on each patient’s admission to the hospitalization.
(A) Serum samples were collected from 33 individuals (17 survivors, 16 deceased) diagnosed with SARS-CoV-2 infection, at one, two, or three time points after their admission to the clinic (t0). The time points t1, t2, and t3 represent blood collections at 96 h, 14 d, and later than 14 d after they arrived at the ICU of the hospital. The date of discharge from the hospital is recorded here, although no blood was collected at that moment. The numbers represent the elapsed number of days starting from t1 for each patient. These are represented by color gradients ranging from dark to light the longer the duration of the stay in the clinic. Patients where no color timeline is represented, indicate cases for which no consecutive temporal collection points were available. Patient descriptors including age and gender as well as indexes used throughout this report are provided to the right of the timelines and color coded. Patient’s age is binned (10 yr/bin) and the darker the greyscale in column 1 the older the patient. The gender of each patient is marked in column 2 as blue and pink. Patient indexes are color-coded for patient outcomes, with survivors in blue and deceased SARS-CoV-2 patients in red in column 3. (B) Serum samples were proteolytically digested and the resulting tryptic peptides were purified using reverse-phase cartridges on an autosampler robot. (C) The samples were analyzed by liquid chromatography tandem mass spectrometry (LC-MS/MS) applying a data-independent acquisition strategy. Spectra were extracted using DIA-NN yielding as a measure abundance for each protein. (D) Two-sided t tests were performed to determine significantly regulated proteins comparing survivors and non-survivors. (E) These differentially regulated proteins were found to be largely functionally related, and define a potential panel of mortality markers, by which we can stratify patients that might ultimately overcome or succumb from the infection, which can be diagnosed already at an early time point in the clinic.
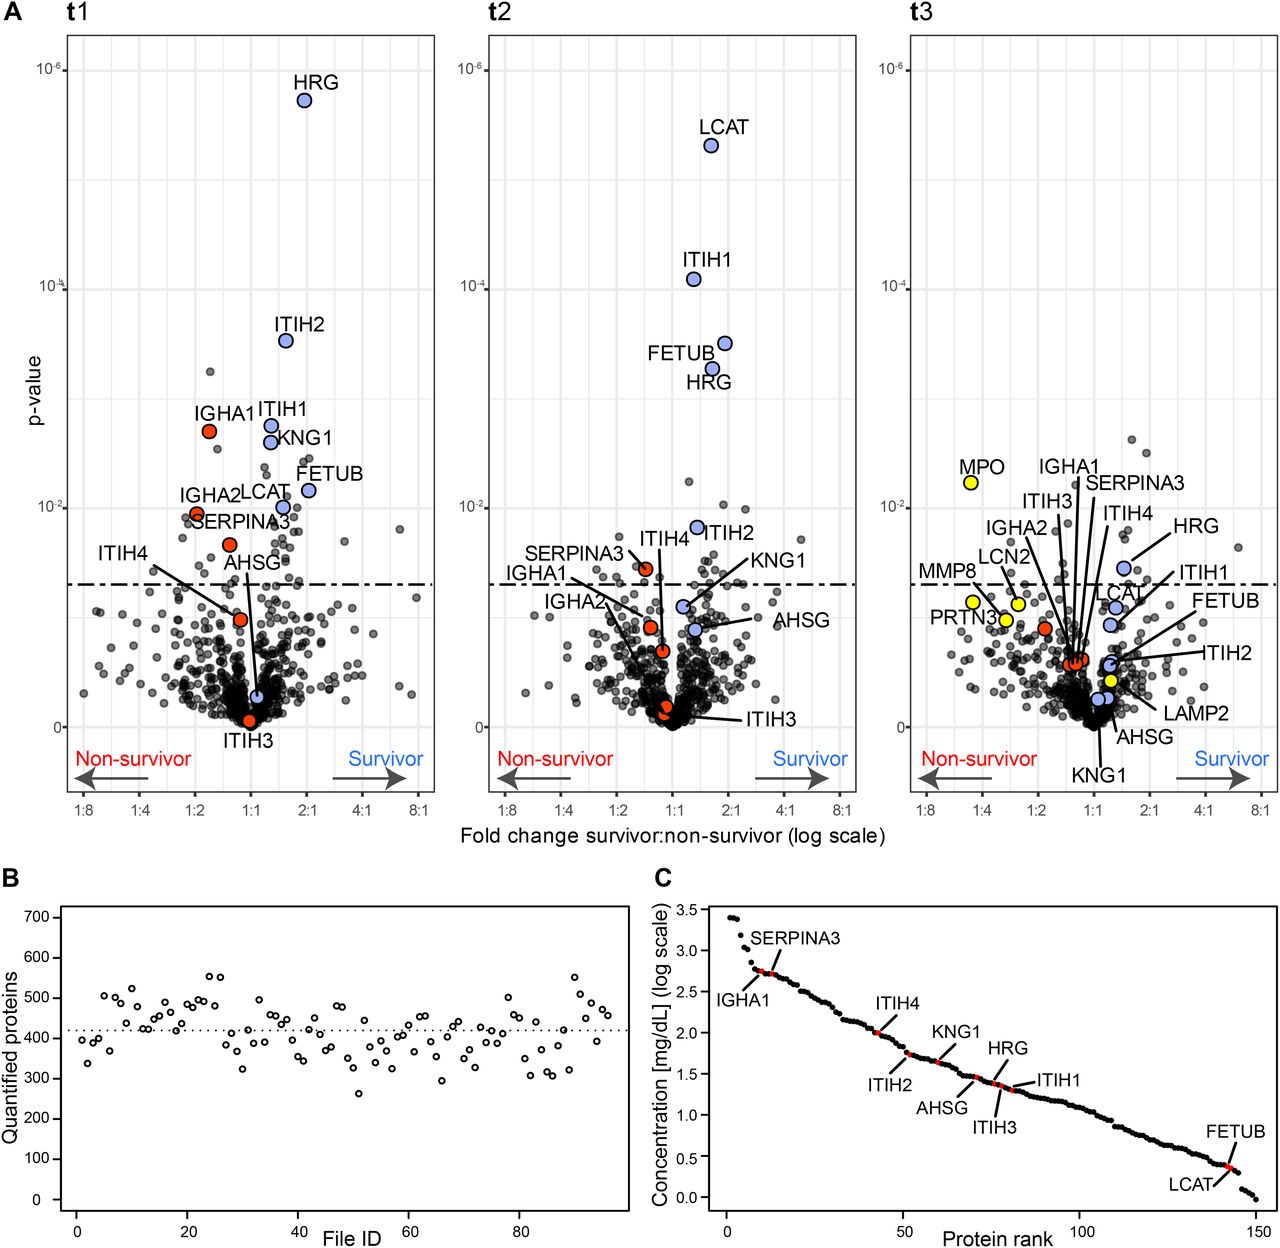
- Figure 2. Serum proteins that are differentially abundant in survivors and non-survivors per time point.
(A) Volcano plots showing the fold change and associated P-values. For each time point t1, t2, and t3, a two-sided t test was performed to identify the significance of the differentially abundant serum proteins (significance threshold at P-value 0.05 indicated as dashed line). Proteins discussed here are represented in red if higher in deceased patients and in blue if showing an increase in surviving patients. In the Volcano plot of t3, some proteins of neutrophil origin are highlighted in yellow. (B) The number of quantified proteins per sample, with the dotted line indicating the mean (452 proteins quantified on average). (C) The quantitative MS-based data converted to the concentration scale for the 150 abundant serum proteins that are identified and quantified in all samples. Proteins we discuss as potentially stratifying survivors and non-survivors are marked in red (AHSG, FETUB, KNG1, HRG, ITIH1, ITIH2, LCAT, SERPINA3, IGHA1, IGHA2, ITIH3, and ITIH4) and thus span the entire covered dynamic range.
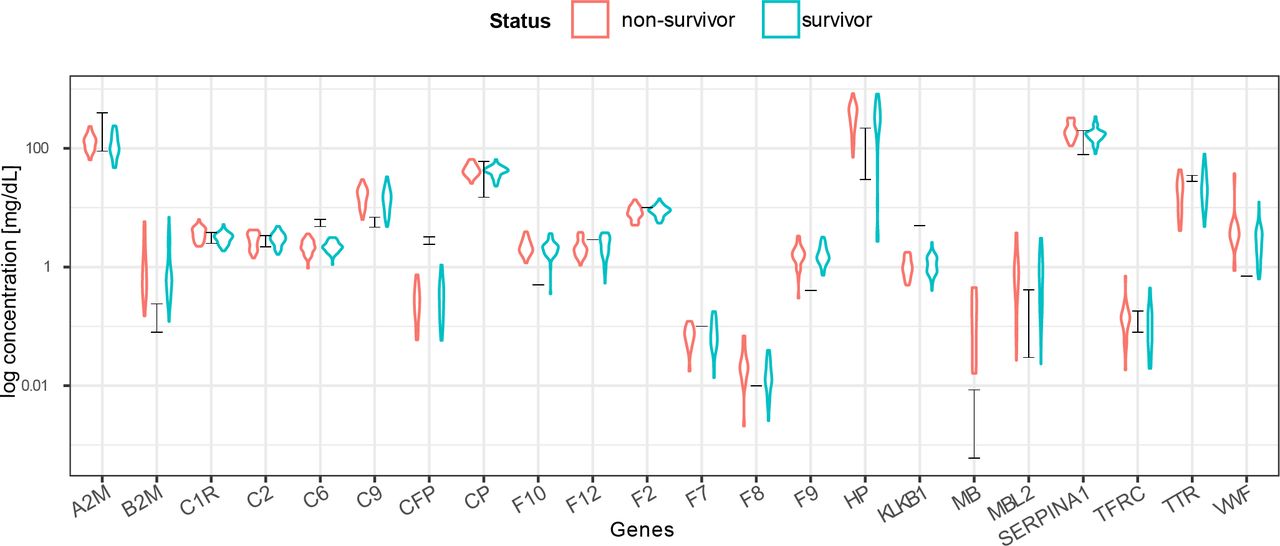
- Figure S2. Concentration estimates based on MS-based label-free quantification correlate well with reported plasma concentration data.
MS label-free quantified intensities were converted to a clinical concentration scale (expressed in mg/dl) based on measurements of 22 reference proteins (18). The black bars indicate the ranges from the reference concentrations. Individual protein measurements correlate well with the reference concentrations, whereas the red and blue violin plots indicate the estimated concentrations for the non-survivor and survivor groups.
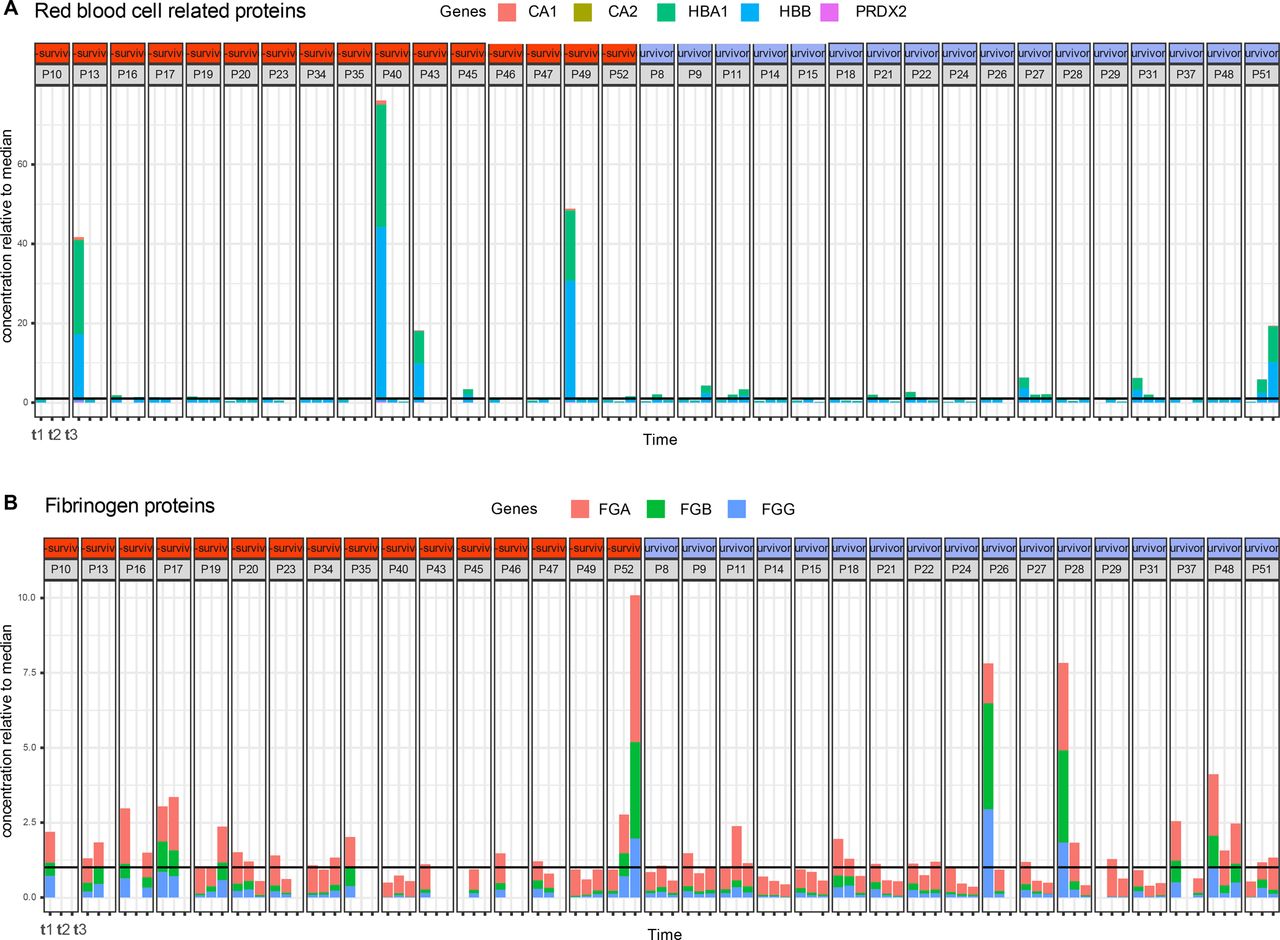
- Figure S3. High abundant outlier proteins in plasma originate from red blood cells or fibrinogen.
(A) Abundance of a selection of (A) red blood cell related contaminants displaying high variability and outliers, mainly at time point 1 of patients P13, P40, and P49. (B) Fibrinogen-related contaminants. The black horizontal line indicates the median concentration, which has been normalized to the value “1,” so for instance at time point t1, patient P13 red blood cell protein concentration is about 40 times what is expected in plasma.
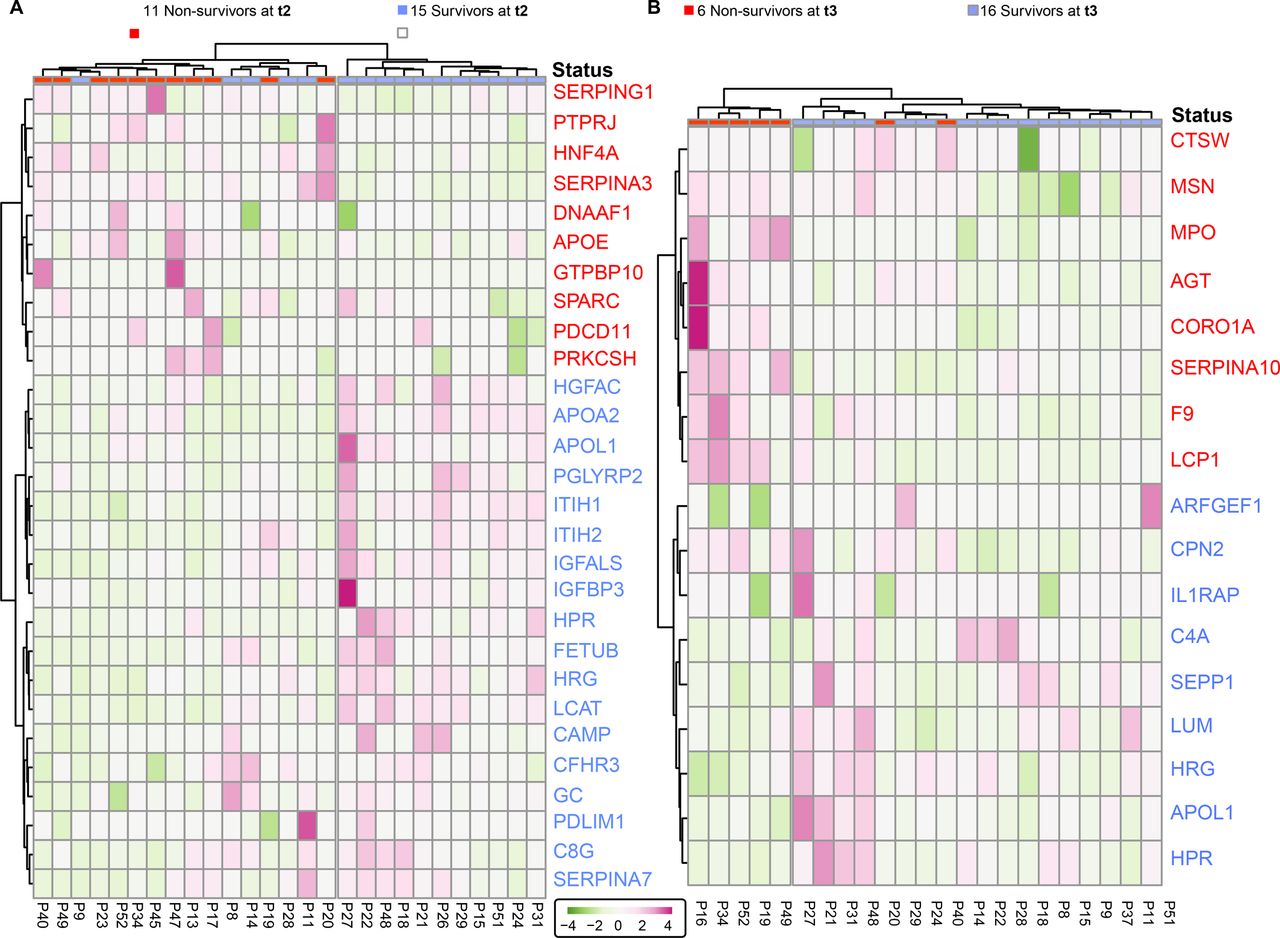
- Figure S4. Surviving and deceased SARS-CoV-2 patients can be reasonably well distinguished by a small panel of statistically significant serum proteins, at t2 and t3.
(A) Proteins identified as differentially abundant at time point are shown here to cluster samples with respect to patient outcome (15 survivors versus 11 non-survivors at t2). Proteins are annotated by their gene names, and those indicated in blue show higher concentrations in survivors whereas proteins in red show higher concentration in non-survivors. (B) The differentially abundant proteins at time point 3 cluster the 16 survivors from 11 non-survivors at t3. Although the full cohort consisted of 17 survivors and 16 non-survivors, at each time point, we missed for a few patients a blood sampling point, which then also could not be included in the clustering and is indicated at the top of the dendrograms.
- Figure 3. Surviving and non-surviving SARS-CoV-2 patients can be distinguished by a small panel of abundant serum proteins, already at t1.
(A) Proteins identified as differentially abundant at time point 1 are shown here to completely cluster samples with respect to patient outcome (16 survivors versus 15 non-survivors at time point 1). Proteins are annotated by their gene names, and those indicated in blue show higher concentrations in survivors, whereas proteins in red show higher concentration in non-survivors. (A, B) The differentially abundant proteins at time point 1 (as shown in (A)) are used to distinguish the 15 survivors from 11 non-survivors at time point 2. (B) Underlined proteins in (B) designate the proteins that were found to be regulated at both time points. Although the cohort consisted of 17 survivors and 16 non-survivors, at each time point, we missed for a few patients a blood sampling point, which then also could not be included in the clustering and is indicated at the top of the dendrograms.
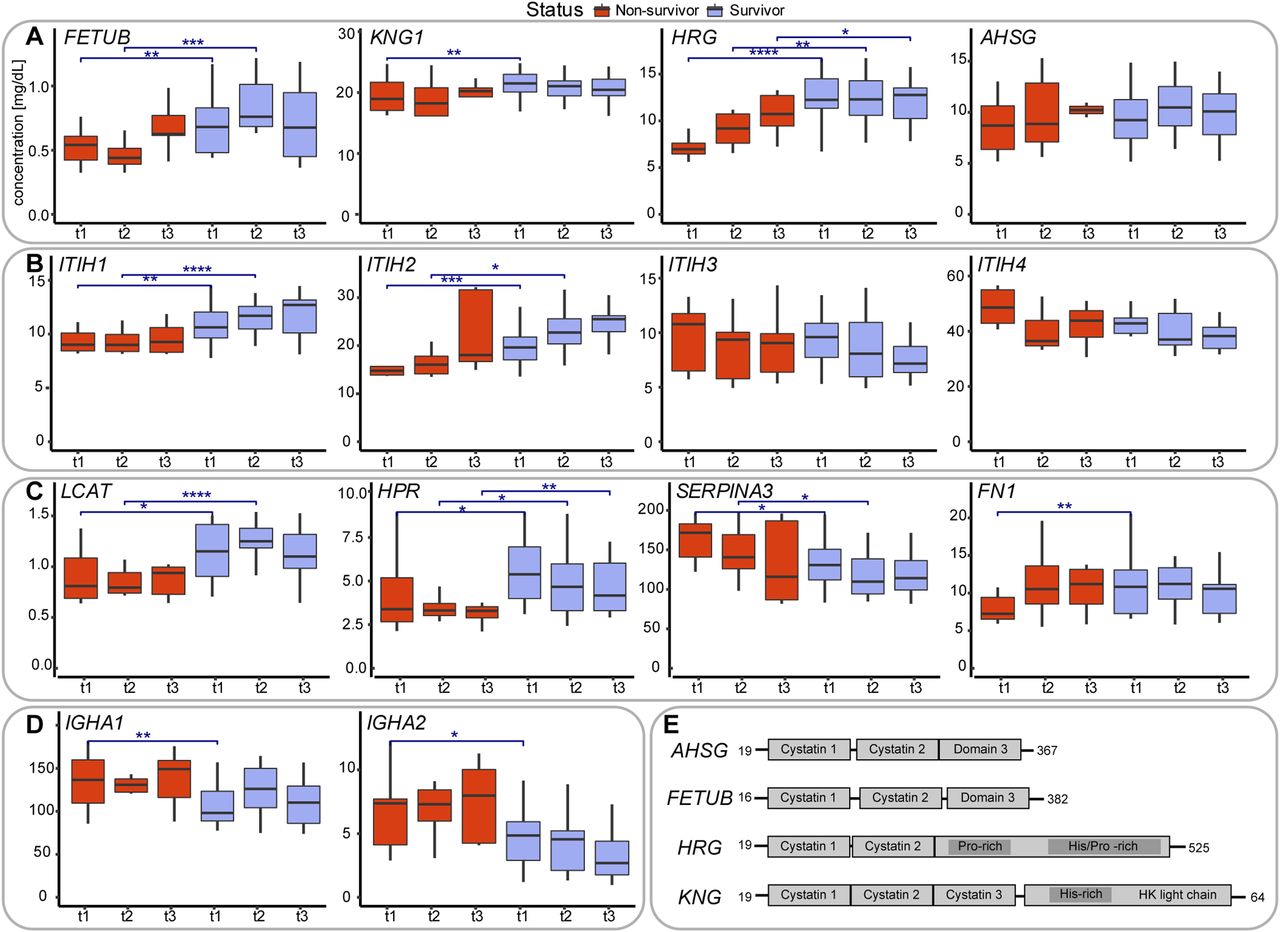
- Figure 4. Serum abundance and structural and functional description of proteins being differentially abundant in survivors versus non-survivors.
(A) Serum abundance estimates, based on MS-based label-free quantification (Fig S2), of the four type-3 cystatins, comparing survivors (blue) with non-survivors (red). At each time point the abundance of these cystatins is higher in the survivors compared to the non-survivors. Comparisons between survivors and non-survivors at respective time points are denoted as significant using asterisks: *P ≤ 0.05, **P ≤ 0.01, ***P ≤ 0.001, and ****P ≤ 0.0001. (B) Serum abundance of the four abundant inter-α-trypsin inhibitors (IαI), with clear opposing trends between ITIH1 and ITIH2 as well as between ITIH3 and ITIH4. At each time point the abundance of ITIH1 and ITIH2 is higher in the survivors compared to the non-survivors, whereas for ITIH3 and ITIH4 the opposite holds. (C) Serum abundance of other putative mortality indicators: phosphatidylcholine-sterol acyltransferase (LCAT), HPR, alpha-1-antichymotrypsin (SERPINA3), and fibronectin (FN1). (D) Profiles of the IgA immunoglobulin variants IgA1, IgA2, both less abundant in survivors. (E) Schematic domain-structures of the type-3 cystatins showing their sequence homology. Cystatin domains as well as His/Gly and His/Pro domains are depicted as boxes.
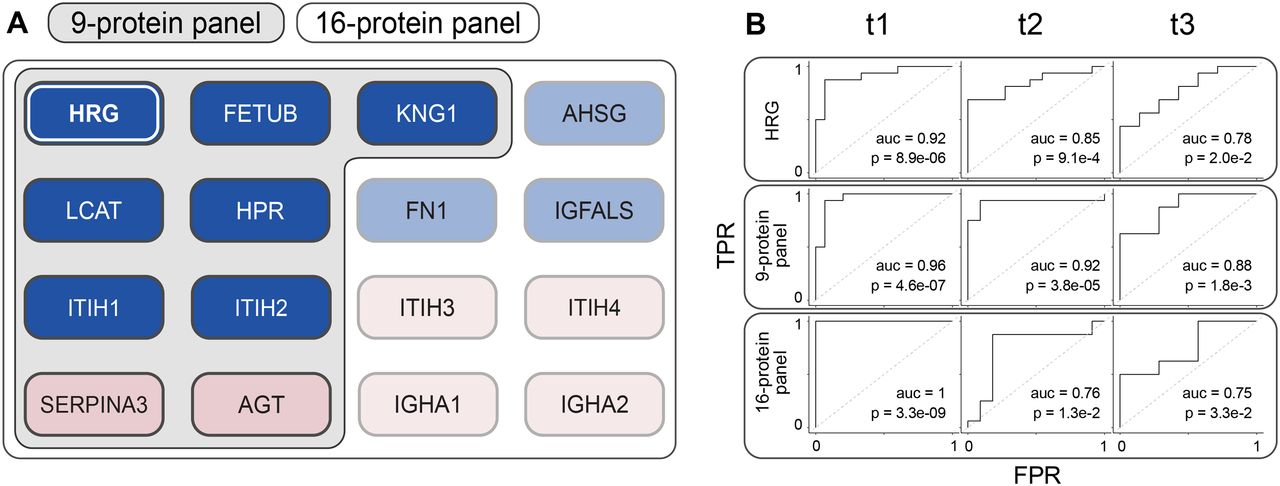
- Figure 5. Performance of different multi-protein panels in predicting mortality.
(A) Definition of the different panels of protein mortality markers (1) histidine-rich glycoprotein (HRG) as a single protein biomarker performs best at time point 1. (2) Nine-protein panel consisting of the type-3 cystatins FETUB, KNG1, and HRG, the Inter-α-trypsin inhibitors ITIH1, ITIH2, and LCAT, HPR, SERPINA3, and AGT. (3) Sixteen-protein panel that includes next to the proteins of panel 2 also the type-3 cystatin AHSG, the Inter-α-trypsin inhibitors ITIH3, ITIH4, the immunoglobulins A1 and A2, fibronectin FN1, IGFALS, and AGT. (B) Performance of the different multi-protein panels in our Ferrara cohort at time points 1, 2, and 3, depicted by using ROC curve analysis, revealing that the multi-protein panels outperform the single protein HRG as a mortality predictor. The 9-protein panel performs best, especially at the earliest time points just shortly after critically ill patients have entered the ICU.
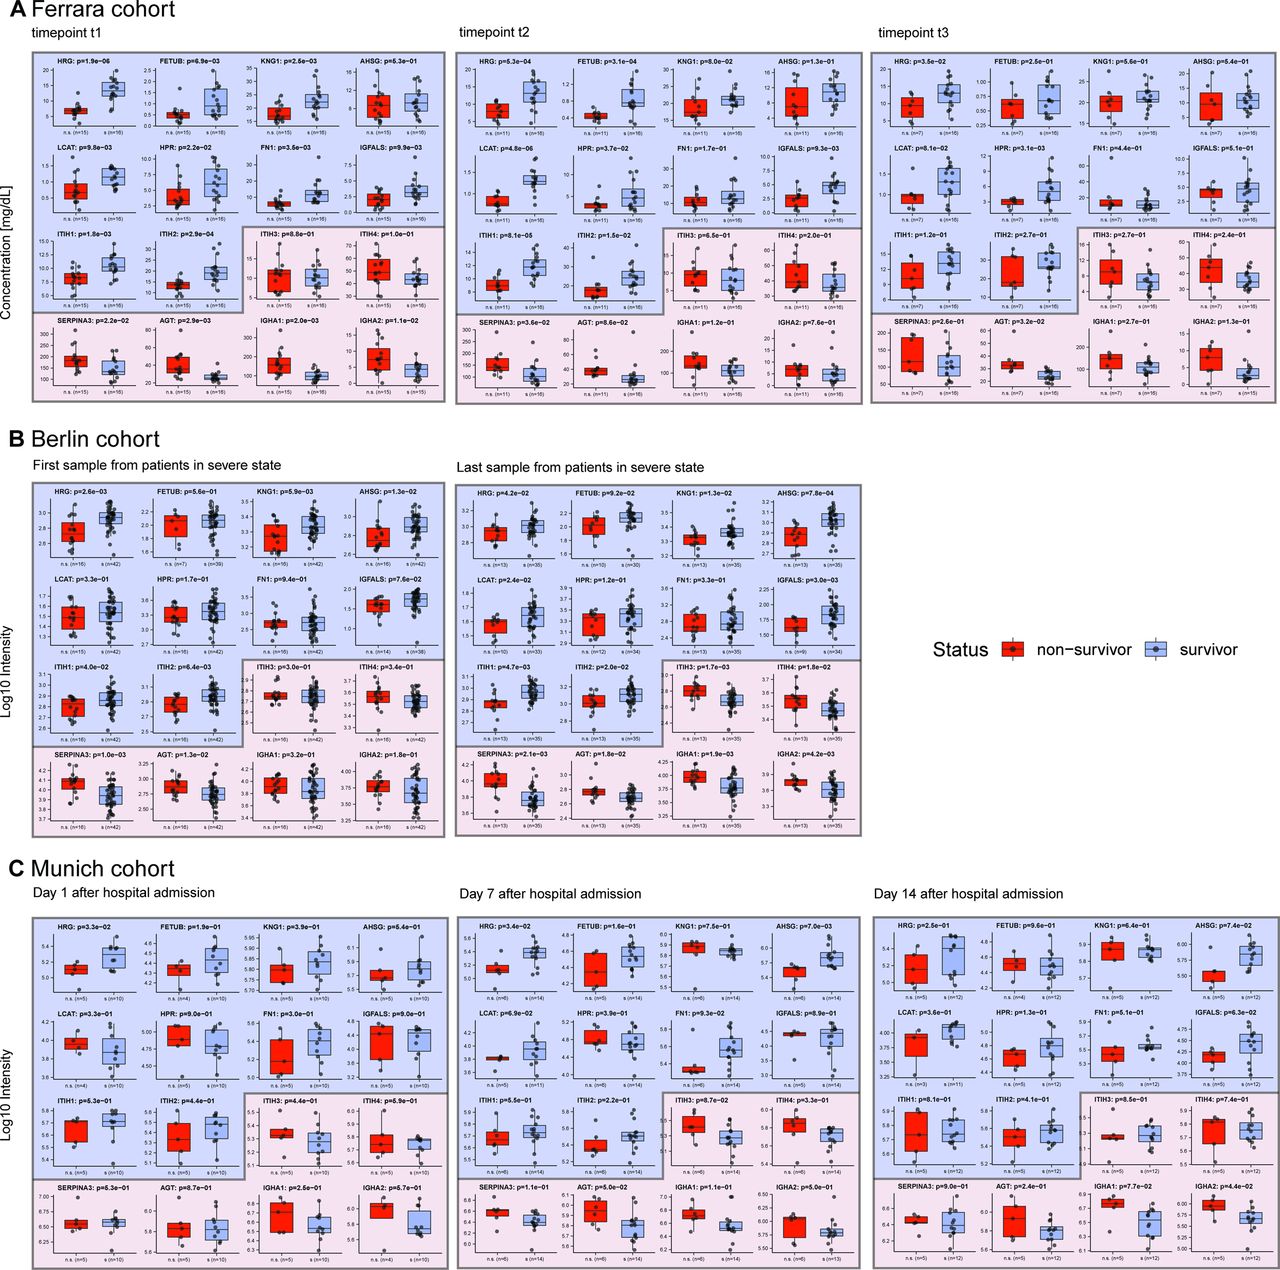
- Figure S5. Comparison of the abundance of 16 protein in the serum from survivors versus non-survivors in our Ferrara cohort, as well as in two independent cohorts; Berlin and Munich.
(A) Protein abundance in survivors versus non-survivors from the data generated in this study shown side-by-side, at time points t1, t2, and t3, respectively. (B) Serum protein abundances in survivors and non-survivors in a cohort of patients in Berlin analyzed by Demichev et al. To make a proper comparison with our data, we selected from this cohort patients at WHO ≥ 6 (invasive mechanical ventilation) and data from the first and last time point. The last time point is the day of death for some of the patients. (C) For the Munich-based cohort (data from Geyer et al) we selected the data from patients that were tested positive for COVID-19, and chose to include time points corresponding to 1, 7, and 14 d after admission to the hospital. (C) The result of our re-analysis of already published data results in slightly different values, due to a different subset of patients retained for significance testing and therefore a different test setup. Indeed, for the data depicted in (C), the number of non-survivors is rather small in comparison with the number of survivors, resulting in weaker significance. Despite these shortcomings, we observe that using data taken at a single time point it is already feasible to predict mortality with a small panel of proteins in all these three different cohorts.
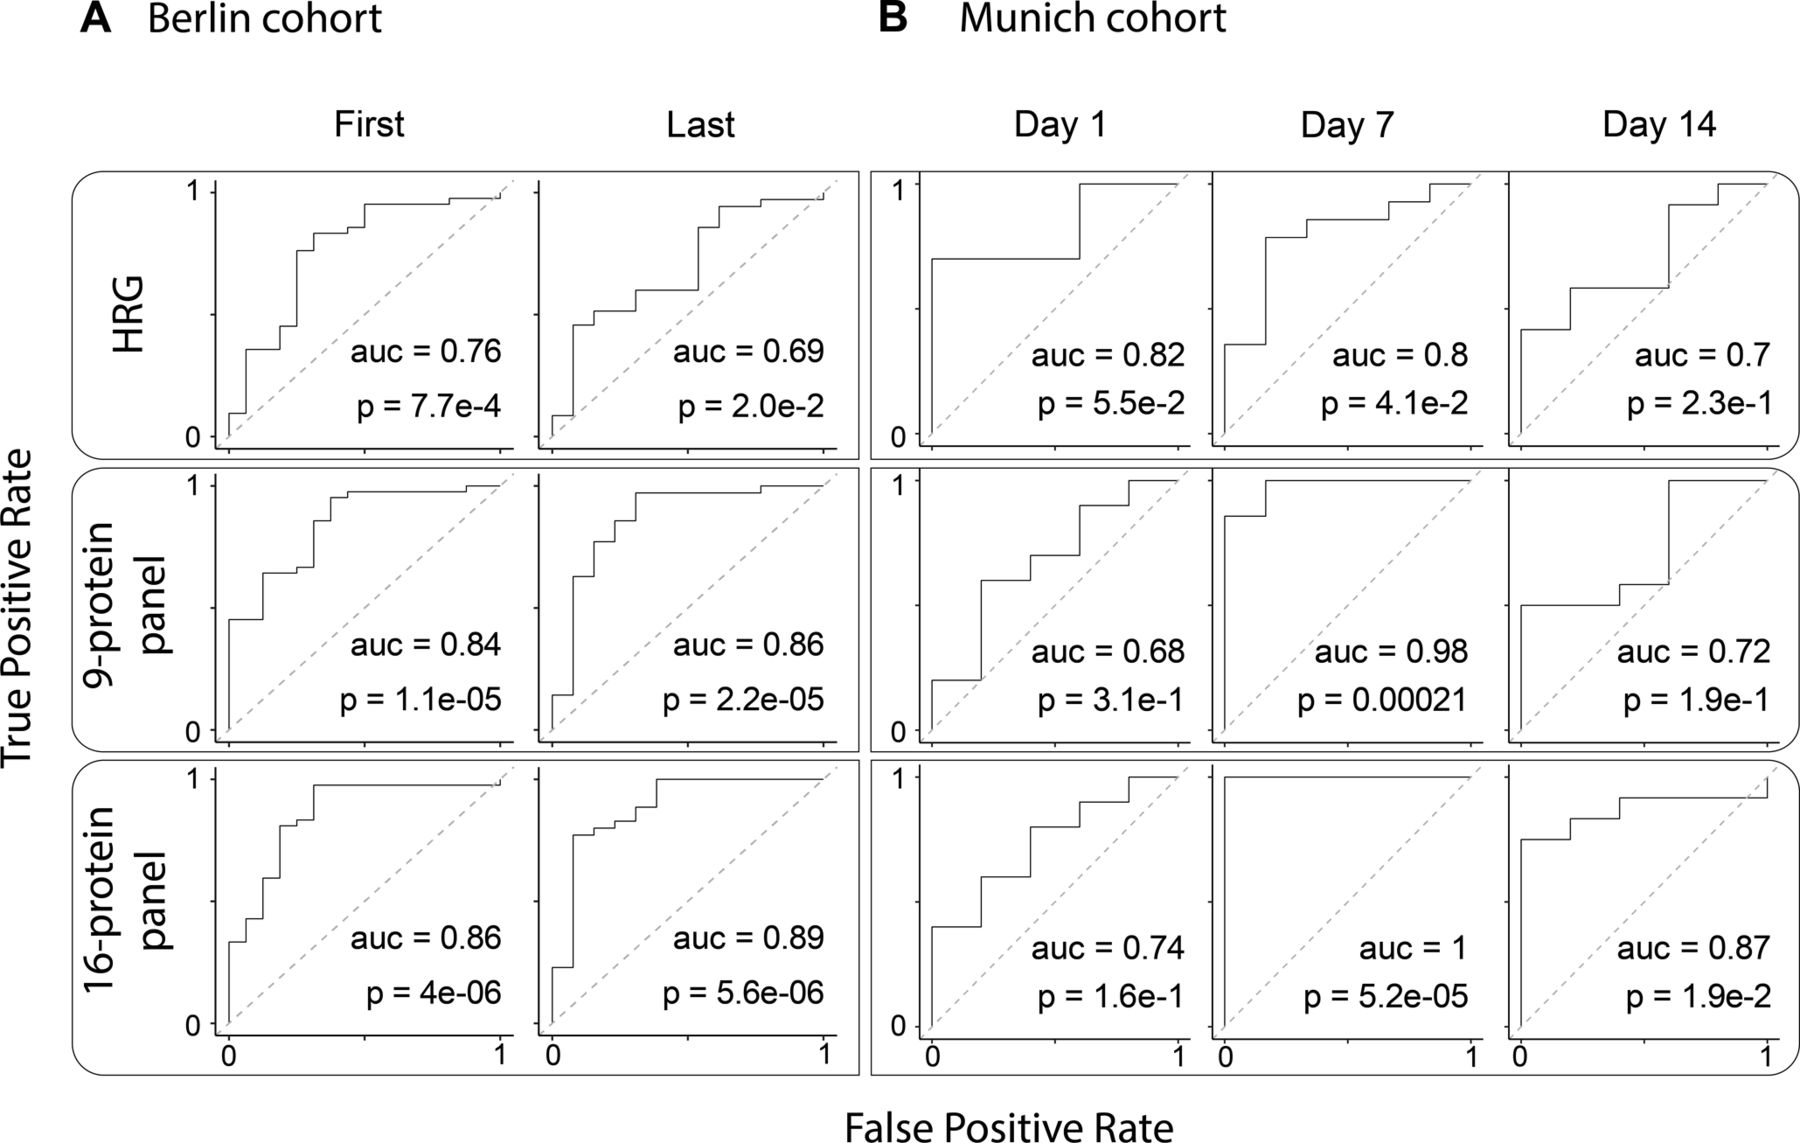
- Figure S6. Performance of the different multi-protein panels in the Berlin and Munich cohorts.
(A) ROC Curves for the Berlin cohort. First samples are taken for each patient when their severity level reached 6 or 7 on the WHO scale, whereas the last sample was taken before discharge or death. Here, the single histidine-rich glycoprotein protein has reasonable performance, whereas the multi-protein panels have comparable and better performance. (B) ROC curves of the linear SVM trained on the Munich cohort as reported by Geyer et al.


Supplementary Materials
Table S1 Clinical metadata.
Table S2 Baseline characteristics.
Table S3 Removed variable immunoglobulins.
Table S4 Protein abundances.
Table S5 Contaminants.


In this Issue
Subjects
Related Articles
Cited By...
- Integrated multiomics implicates dysregulation of ECM and cell adhesion pathways as drivers of severe COVID-associated kidney injury
- Longitudinal fluctuations in protein concentrations and higher-order structures in the plasma proteome of kidney failure patients subjected to a kidney transplant
- COVIDpro: Database for mining protein dysregulation in patients with COVID-19
- The human host response to monkeypox infection: a proteomic case series study
- A multiplex protein panel assay determines disease severity and is prognostic about outcome in COVID-19 patients