


Article Figures & Data
Figures
- Figure 1. COX-2 expression is activated in the bladder urothelium during human recurrent urinary tract infection.
(A) Cohort 1 patient recruitment and procedure timeline. (B) Representative confocal micrographs (63×) of I1 and C1 regions of PNK006 and PNK011 with DNA (Hoechst) in blue, Mucin (WGA) in green, COX-2 in red and neutrophils (ELA-2) in magenta. Scale bar represents 10 μm. (C, D) Quantification of COX-2 expressing cells and (D) neutrophils within the urothelium of control (blue) and inflamed (red) region biopsies reported as percentage of total urothelial cells. 10 randomly sampled images were enumerated for each section. Bar graphs represent mean ± SEM. (E) Comparison of %COX-2–expressing cells and %neutrophils between control and inflamed regions. Whiskers drawn minimum to maximum, boxes represent interquartile range, and median denoted by horizontal line. P-values generated by Wilcoxon matched pairs signed-ranks test. (F) Linear regression with Spearman correlation between %neutrophils and %COX-2–positive cells.
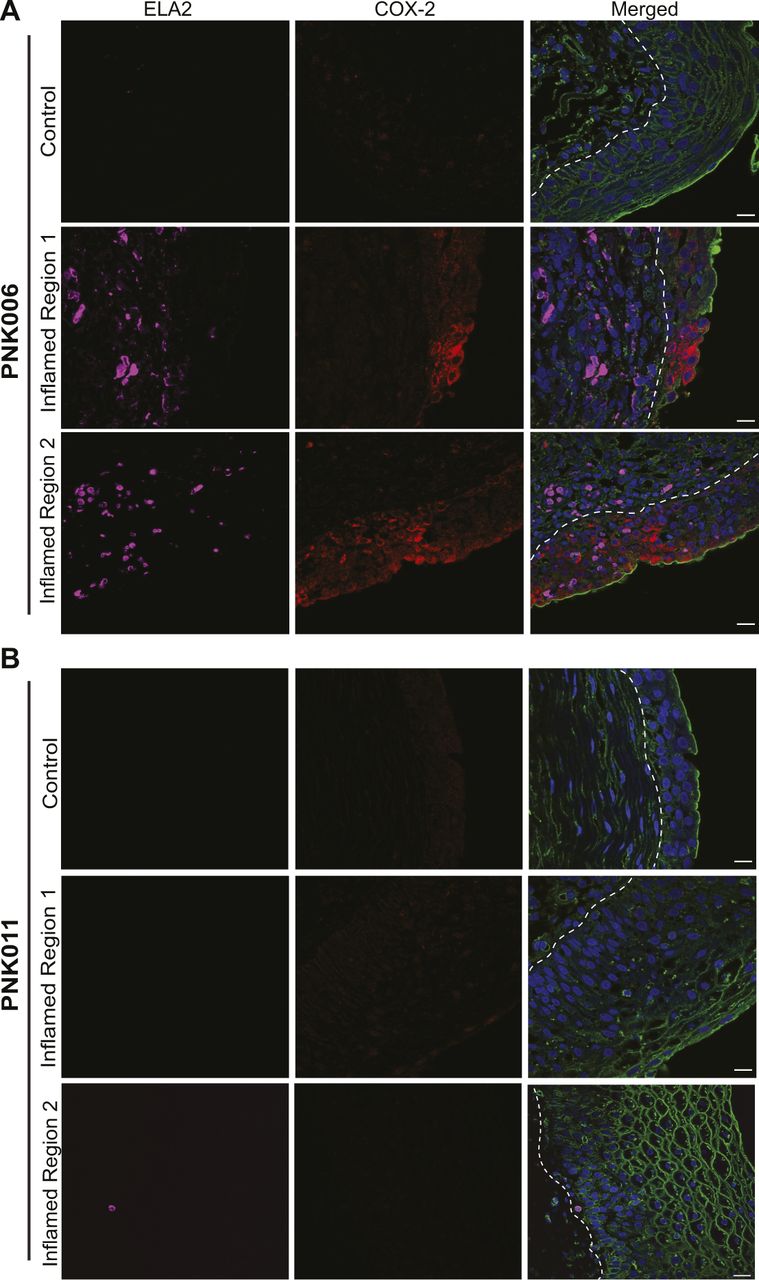
- Figure S1. COX-2 and ELA-2 detection in the bladder urothelium of patients PNK006 and PNK011.
(A, B) Confocal micrographs (63×) from Fig 1B with split channels for ease of interpretation (control and Inflamed Region 1) as well as an additional representative inflamed region micrograph (Inflamed Region 2) from (A) PNK006 and (B) PNK011 biopsies. Independent channels for COX-2 (red) and ELA-2 (magenta) as well as the merged channel are shown. Scale bar represents 10 μm. White dashed line delineates urothelium and suburothelium. DNA (Hoechst) in blue, Mucin (WGA) in green, COX-2 in red, and neutrophils (ELA-2) in magenta.
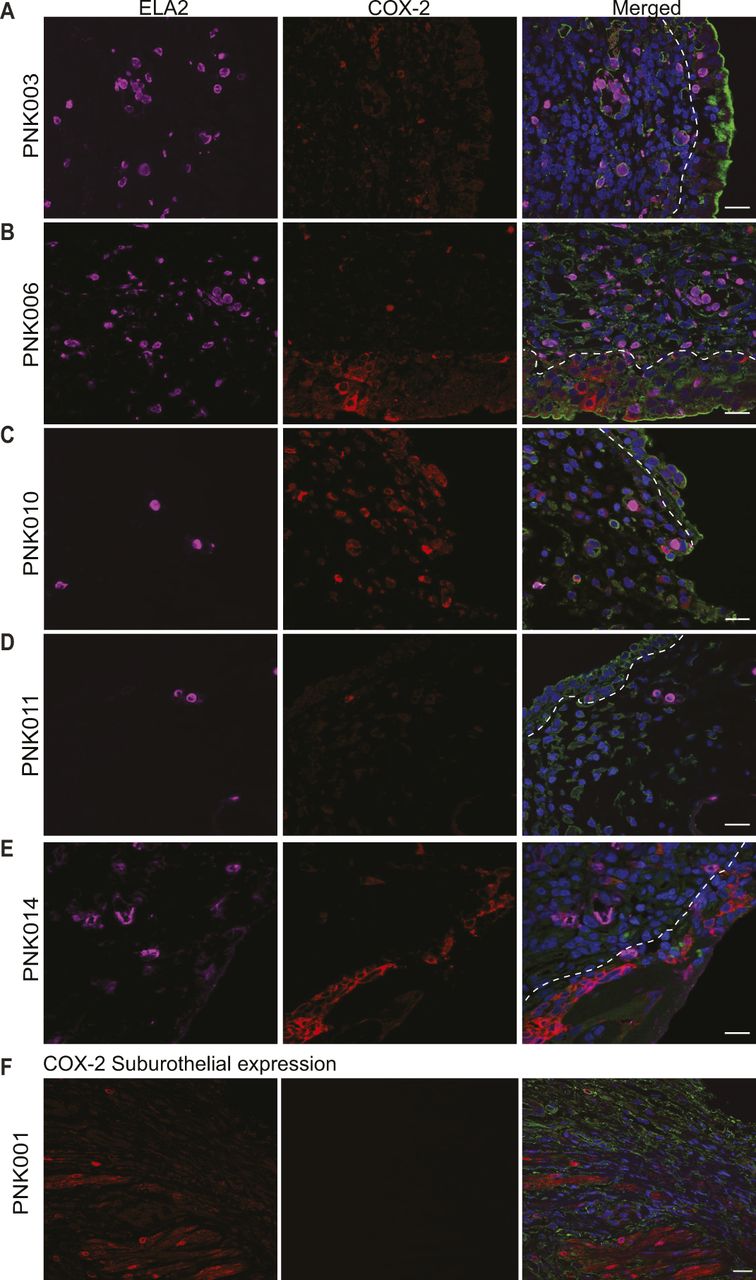
- Figure S2. Detection of COX-2–expressing cells and neutrophils in the bladder suburothelium.
Cohort 1 bladder biopsy sections were analyzed for the presence of suburothelial COX-2 expression and neutrophil accumulation. (A, B, C, D, E) Representative confocal micrograph (63×) of I1 bladder biopsy sections of patients PNK003, 006, 010, 011, and 014 with suburothelial COX-2 expression and neutrophils. (F) Representative confocal micrograph (63×) of I1 bladder biopsy of PNK001 with suburothelial COX-2 expression in the absence of neutrophils. DNA (Hoechst) in blue, Mucin (WGA) in green, COX-2 in red, and neutrophils (ELA-2) in magenta. White dashed line delineates urothelium and suburothelium. Scale bar represents 10 μm.
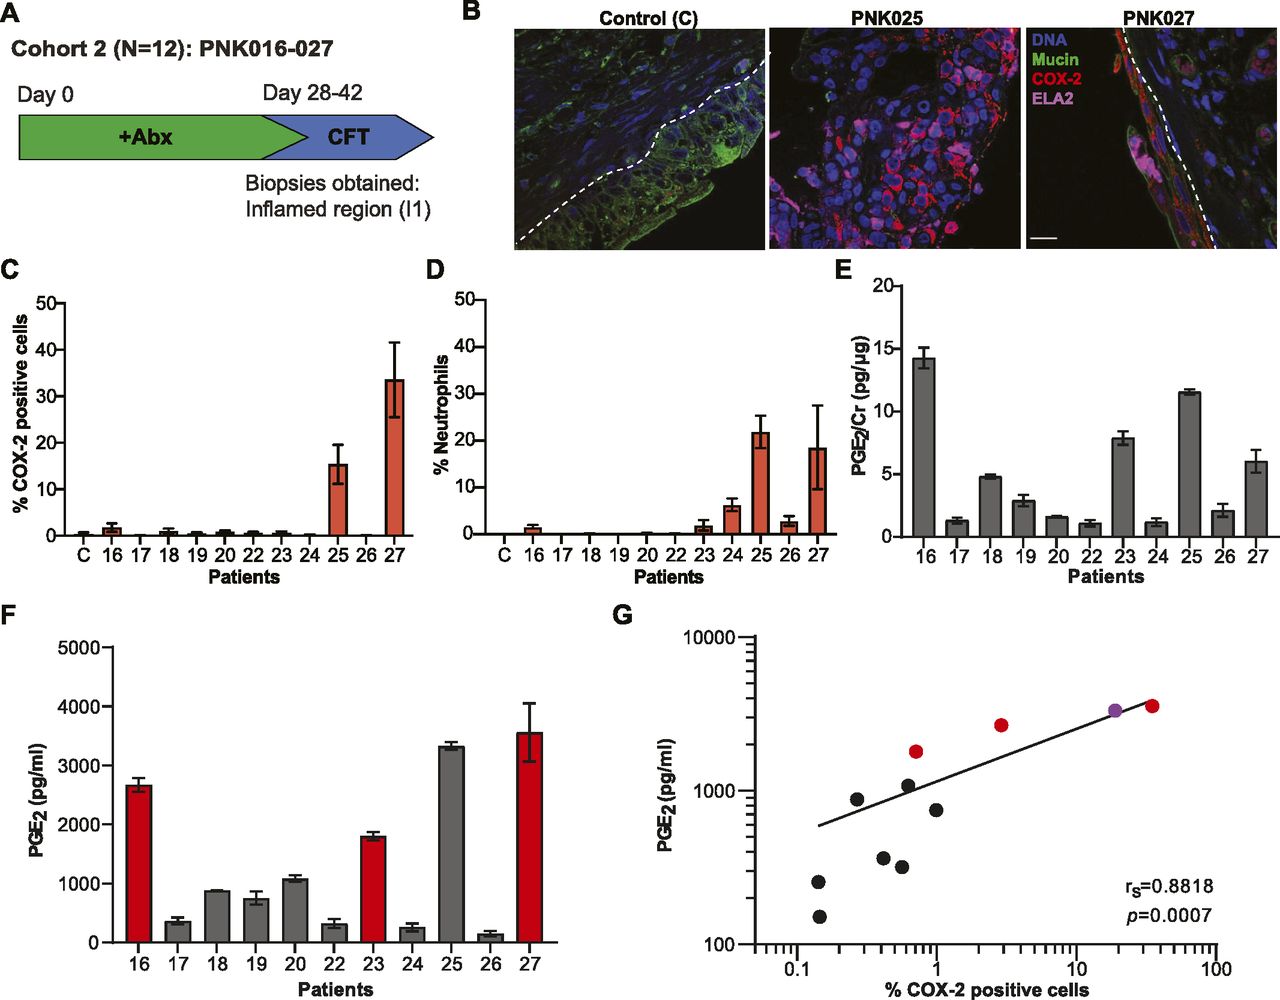
- Figure 2. Urinary PGE2 as a marker for COX-2–mediated bladder inflammation.
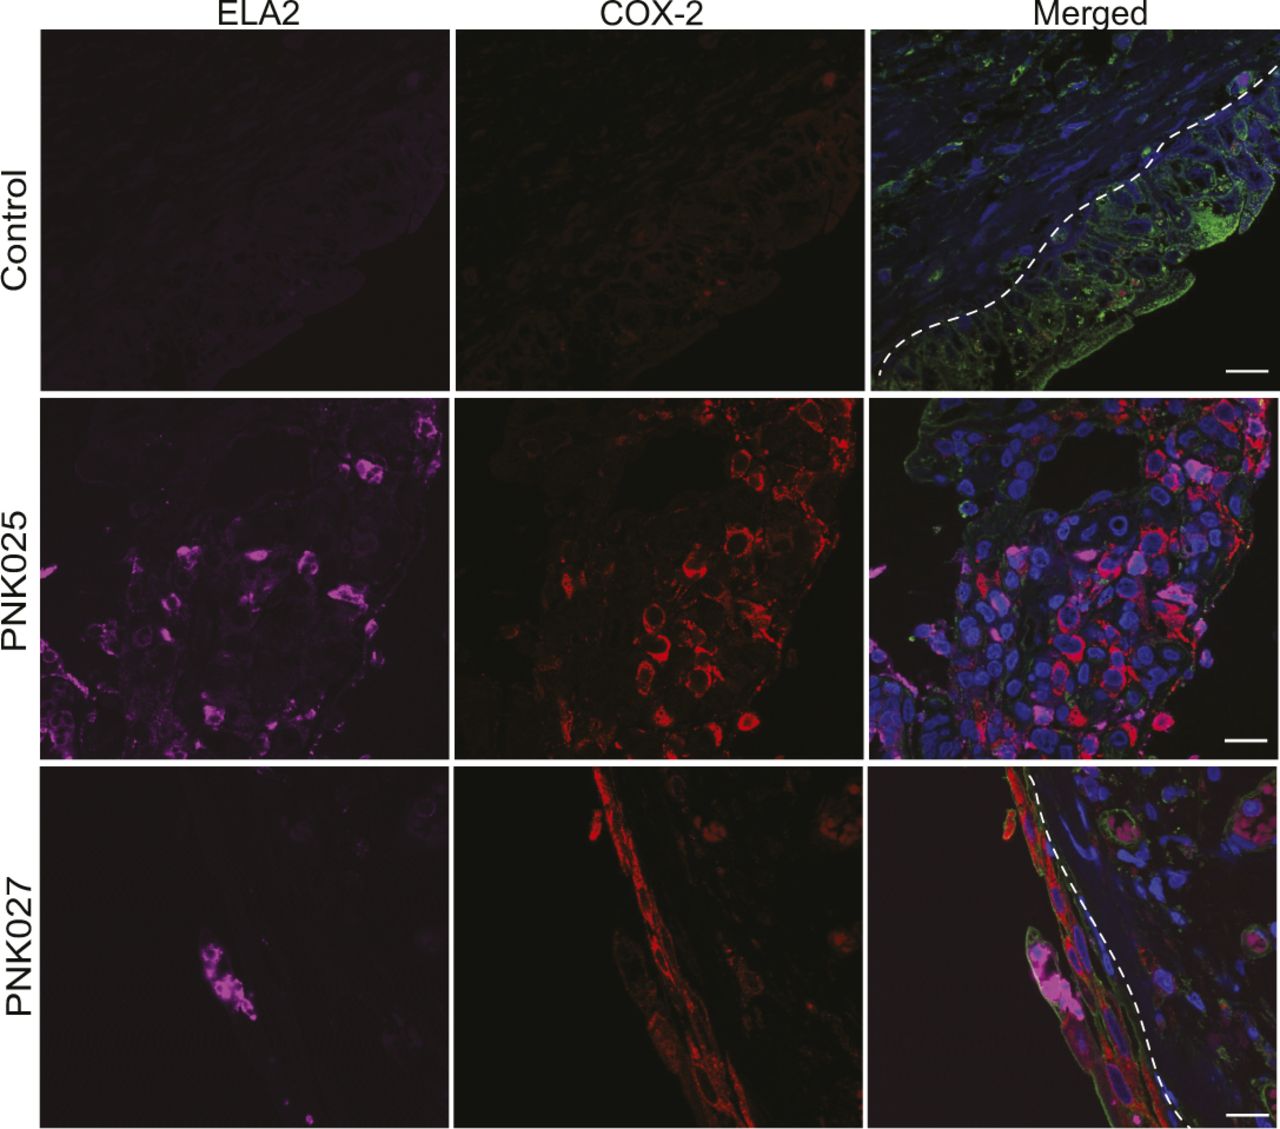
(A) Cohort 2 patient recruitment and procedure timeline. (B) Representative confocal micrographs for control and I1 region from patients PNK025 and PNK027 compared to commercially available human normal bladder section (control, US Biomax) with DNA in blue, Mucin in green, COX-2 in red and neutrophils in magenta. Scale bar represents 10 μm. (C, D) Quantification of COX-2 expressing cells and (D) neutrophils within the urothelium reported as percentage of total urothelial cells. 10 randomly sampled images taken with a 63× objective were enumerated for scoring. C denotes control. (E) Bar graphs represent mean ± SEM (E) Urinary PGE2 normalized to Cr. (F) Raw urinary PGE2 concentration. Bar graphs represent mean ± SD. (G) Linear regression with Spearman’s correlation between raw urinary PGE2 concentration and %COX-2–positive urothelial cells. Red circle denotes positive urine culture. Purple circle denotes PNK025.
- Figure S3. COX-2 and ELA-2 detection in the bladder urothelium of PNK025 and PNK027.
Confocal micrographs (63×) from Fig 2B with split channels for ease of interpretation. Independent channels for COX-2 (red) and ELA-2 (magenta) as well as the merged channel are shown for PNK025 and PNK027 versus Control (US Biomax) biopsy sections. Scale bar represents 10 μm. White dashed line delineates urothelium and suburothelium. DNA (Hoechst) in blue, Mucin (WGA) in green, COX-2 in red, and neutrophils (ELA-2) in magenta.
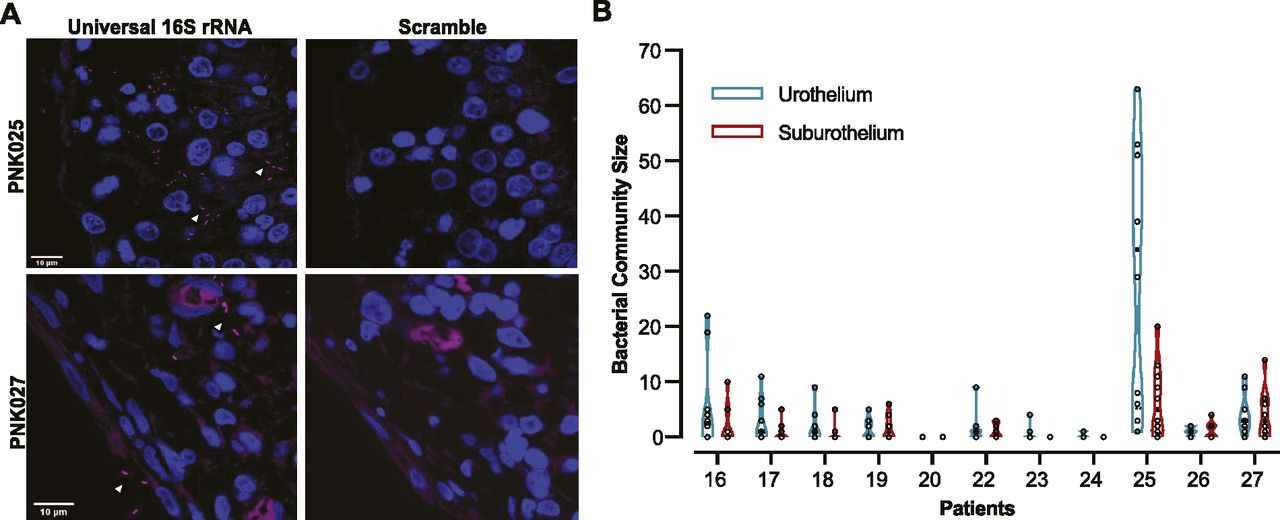
- Figure 3. FISH detects bladder-resident bacterial communities.
(A) Representative confocal micrograph of FISH performed on PNK025 and PNK027 I1 biopsies using universal 16S rRNA and scramble probes with bacteria in magenta and DNA in blue. White arrowheads point to bacteria. (B) Violin plot of urothelial and suburothelial bacterial community enumeration in each biopsy. 10 randomly sampled images were quantified per biopsy. Individual data points are open circles and black boxes depict the median.
- Figure S4. 16S rRNA FISH detection of suburothelial bladder-resident bacteria.
(A, B) Representative confocal micrographs (63×) of FISH performed on (A) PNK025 and (B) PNK027 bladder biopsy sections using scramble (left panels) and universal 16S rRNA probes (center and right panels). Two regions per biopsy are shown for patients PNK025 and PNK027. Right-most column of panels are zoomed-in views of the boxed regions in the center panel. Bacteria are in magenta (Alexa-647) and DNA (Hoechst) in blue. White arrowheads point to bacteria. White dashed line delineates urothelium and suburothelium. Scale bar represents 10 μm.
- Figure 4. Urinary PGE2 is a biomarker for active recurrent urinary tract infection (rUTI) and is the best model to predict rUTI relapse in postmenopausal women.
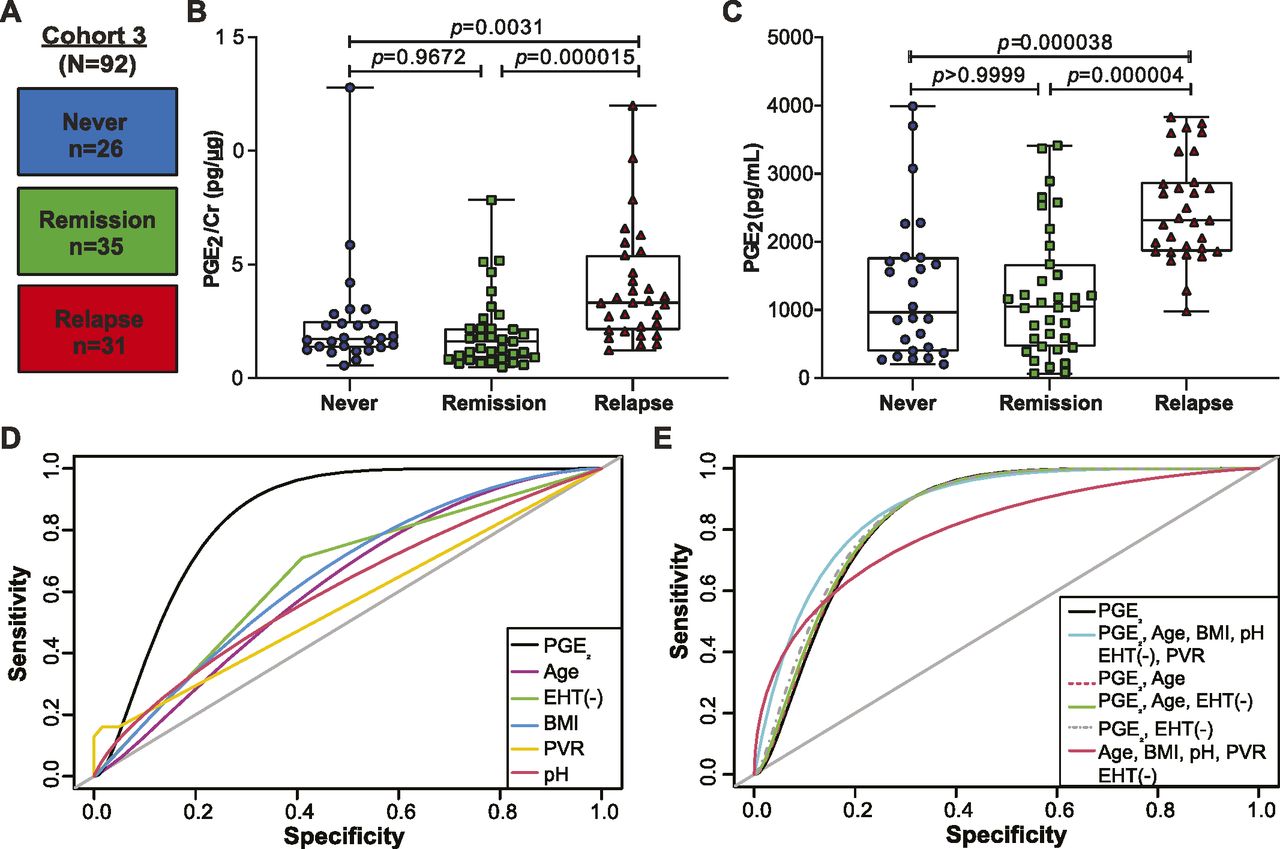
(A) Diagram depicting Cohort 3 design. Patients were stratified intro three cohorts: Never (no clinical history of urinary tract infection [UTI]), Remission (history of rUTI, no current UTI), and Relapse (history of rUTI, current UTI). (B, C) Urinary PGE2 normalized to creatinine and (C) raw urinary PGE2 concentration as measured by ELISA. P-values generated by Kruskal-Wallis test and Dunn’s multiple comparison test. Whiskers drawn to minimum and maximum, boxes represent interquartile range, and median is denoted by a horizontal line. (D) Receiver operating characteristic curves of single-variable logistic regression models illustrate the ability of each model to predict rUTI status. Area under the curve was calculated using leave-one-out cross validation. (E) Receiver operating characteristic curves comparing multivariable logistic regression models to a PGE2-only model for predicting rUTI. Area under the curve was calculated using leave-one-out cross validation.
- Figure S5. Significant Clinical Variables for Group and recurrent urinary tract infection comparisons in Cohort 3.
(A) Plots of statistically significant variables comparing Never, Remission, and Relapse groups within Cohort 3. (B) Plots of statistically significant variables comparing active recurrent urinary tract infection group versus Control (no active urinary tract infection). Significant numerical variables are displayed in boxplots and significant categorical variables in stacked bar plots.
- Figure S6. Predicted probabilities of recurrent urinary tract infection for Cohort 3 patients.
Prediction of recurrent urinary tract infection (red) and Control (blue) for each of the 92 samples of the logistic regression model containing PGE2 as the only explanatory variable.
- Figure 5. High urinary PGE2 is a prognostic marker for development of recurrent urinary tract infection relapse in a 12-mo follow-up study.
(A) Analysis of the urinary PGE2 concentrations between nondiabetic (filled) and diabetic (empty) No active urinary tract infection (blue circle) versus Active urinary tract infection (red triangle) patients. Mann–Whitney U test used to calculate P-values. (B) Kaplan–Meier analysis of time-to-relapse data for patients in the Relapse group dichotomized about the median PGE2 concentration. Red line depicts above median and blue line below median patients. Data were analyzed by log-rank (Mantel–Cox) test. HR, hazard ratio (below median/above median) and CI = 95% confidence interval.
- Figure S7. Correlation analysis between clinical variables and urinary PGE2 concentration.
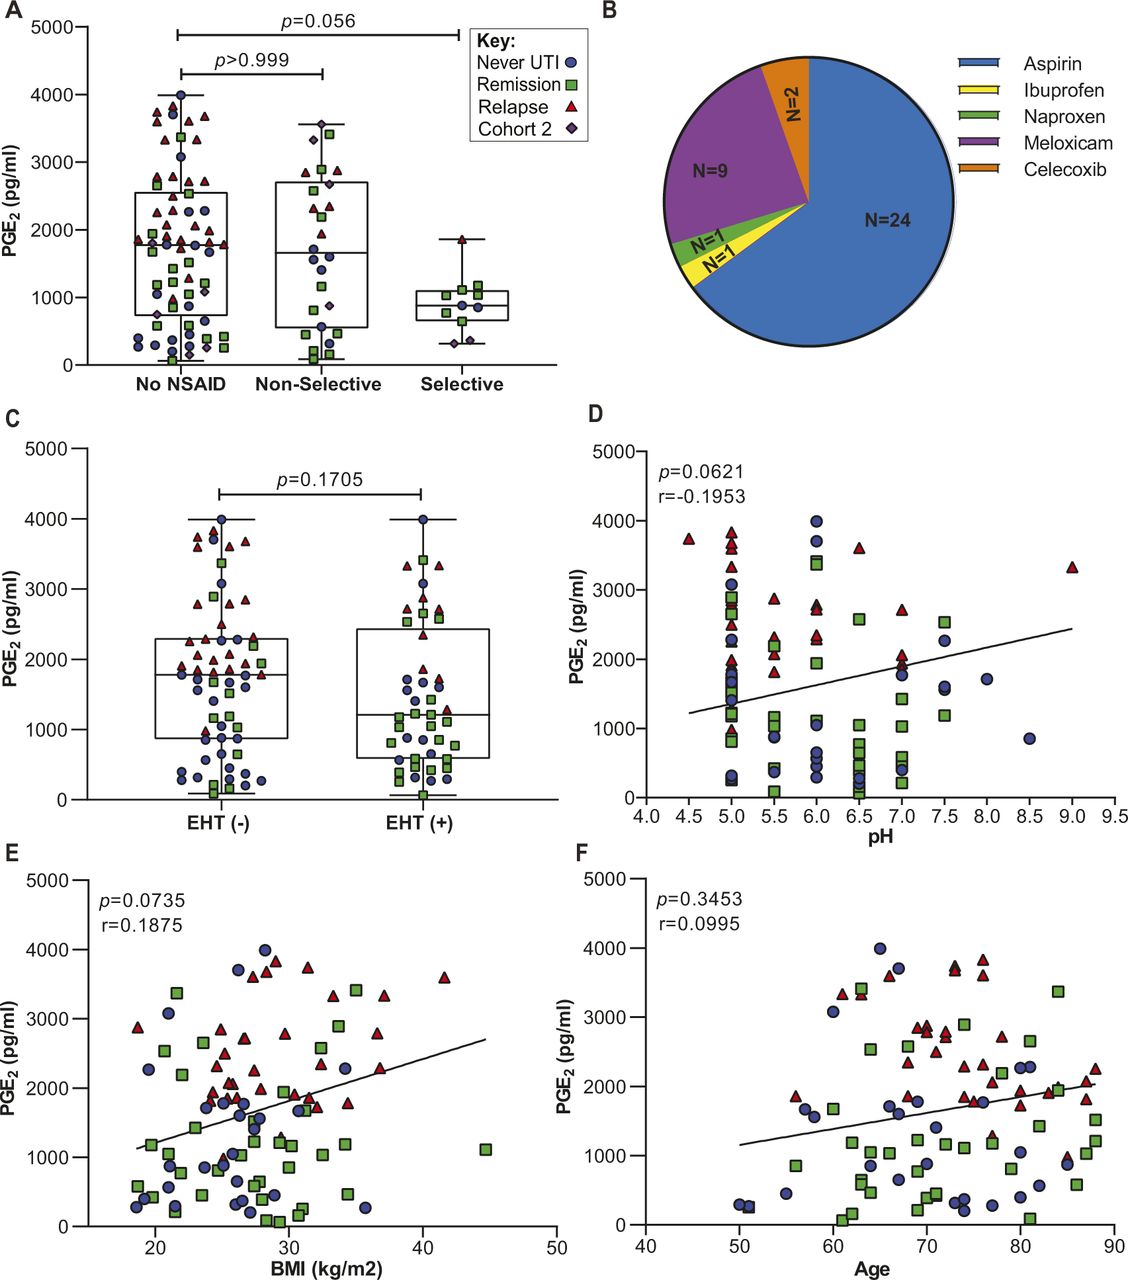
Clinical variables were assessed to determine extent of correlation with urinary PGE2 concentration. (A) Urinary PGE2 in three groups of patients from Cohort 2 and Cohort 3 using different types of NSAIDs: No NSAID, nonselective, and selective. P-values calculated by Kruskal-Wallis and Dunn’s multiple comparison test. (B) Pie chart representing distribution of NSAIDs used by patients in Cohorts 2 and 3. (C) Association between PGE2 and estrogen hormone therapy in Cohort 3. Modality of estrogen hormone therapy was either vaginal, transdermal patch, or oral. Whiskers drawn to minimum and maximum, boxes represent interquartile range, and median is denoted by a horizontal line. Data analyzed by Mann–Whitney U test. (D, E, F) Spearman’s correlation between raw urinary PGE2 and pH, BMI, and age in Cohort 3. The line depicts the linear regression. The color and shape of the data points indicate original group assignment: Never (Blue circle), Remission (Green square), Relapse (Red triangle), and Cohort 2 (Purple diamond).


Tables
Patients Age (yr) BMI (kg/m2) Diabetes Prior CFT Urine culture history Urine culture before CFT PNK016 58 32.2 IDDM No Pseudomonas aeruginosa and Proteus mirabilis Enterococcus faecalis (105) PNK017 65 25.3 No No P. aeruginosa, Escherichia coli, and E. faecalis No growth PNK018 62 24.0 No No Klebsiella pneumoniae, E. coli, and E. faecalis No growth PNK019 80 22.5 No No E. faecalis and K. pneumoniae No growth PNK020 51 31.9 No No E. coli No growth PNK022 88 27.5 No No E. coli No growth PNK023 82 20.7 No No K. pneumoniae K. pneumoniae (105) PNK024 58 30.9 AODM Yes K. pneumoniae No growth PNK025 66 41.2 No No E. coli No growth PNK026 65 35.0 AODM No E. coli No growth PNK027 77 22.0 No Yes E. coli and E. faecalis Enterococcus faecium (105), Aerococcus urinae (55–99,000) Relevant patient data recorded for the 11 study participants. BMI, body mass index. Diabetes: no, nondiabetic; IDDM, diabetes mellitus type 1; AODM, adult-onset diabetes mellitus type 2; CFT, cystoscopy with fulguration of trigonitis. Urine cultures performed in clinical laboratories with a 104 CFU/ml detection limit.
Never Remission Relapse Number of women (n) 26 35 31 Hx of fulguration 0 20 19 Median Age (IQR) (yr) 69.5 (63–77.75) 70 (63–81) 74 (70–80) Median BMI (IQR) (kg/m2) 26.05 (21.4–27.5) 27.8 (22–31) 27.9 (25.4–32.1) Median urine pH (IQR) 6 (5–7) 5.82 (5–6.74) 5.35 (5–6) AODM (%) 1 (3%) 7 (20%) 6 (19.35%) EHT (%) 14 (53%) 22 (62%) 9 (29%) NSAID Selective (%) 2 (7.69%) 5 (14.28%) 1 (3.22%) Nonselective (%) 6 (23.07%) 7 (20%) 2 (6.45%) Median and interquartile range (IQR) for age; (BMI) body mass index, and urinary pH. AODM, adult-onset diabetes mellitus; EHT, estrogen hormone therapy; NSAID, nonsteroidal anti-inflammatory drugs.
- Table 3.
Summary of cohort-associated clinical metadata analysis to assess the model prediction accuracy.
Model variables AUC F score Cutoff probability PGE2 0.843 0.778 0.317 Age 0.623 0.574 0.289 Estrogen 0.65 0.564 0.468 BMI 0.627 0.594 0.266 Post void residual (PVR) 0.56 0.504 0.299 pH 0.606 0.538 0.304 PGE2, age, BMI, estrogen, PVR, and pH 0.882 0.761 0.308 PGE2 and age 0.844 0.75 0.224 PGE2, age, and estrogen 0.848 0.737 0.268 PGE2, and estrogen 0.855 0.776 0.43 Age, BMI, estrogen, PVR, and pH 0.805 0.675 0.287 Leave-one-out cross-validation (LOOCV) procedure used to calculate the area under the ROC curve (AUC), F-score (predictive accuracy of the model), and the cutoff probability.


