


Article Figures & Data
Figures
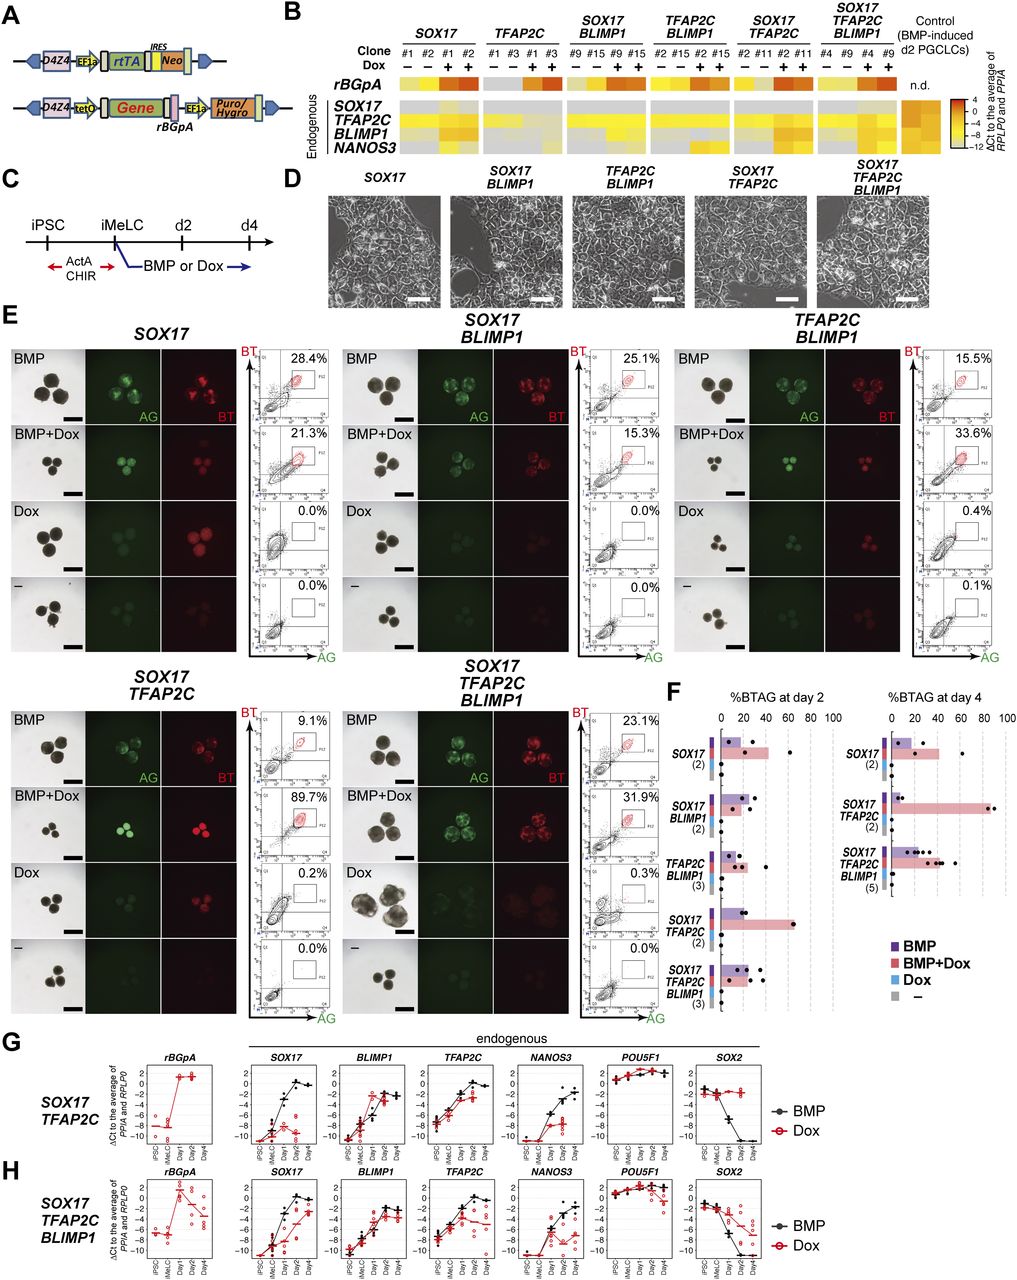
- Figure 1. SOX17, TFAP2C, and BLIMP1 do not create human primordial germ-cell-like cells (hPGCLCs).
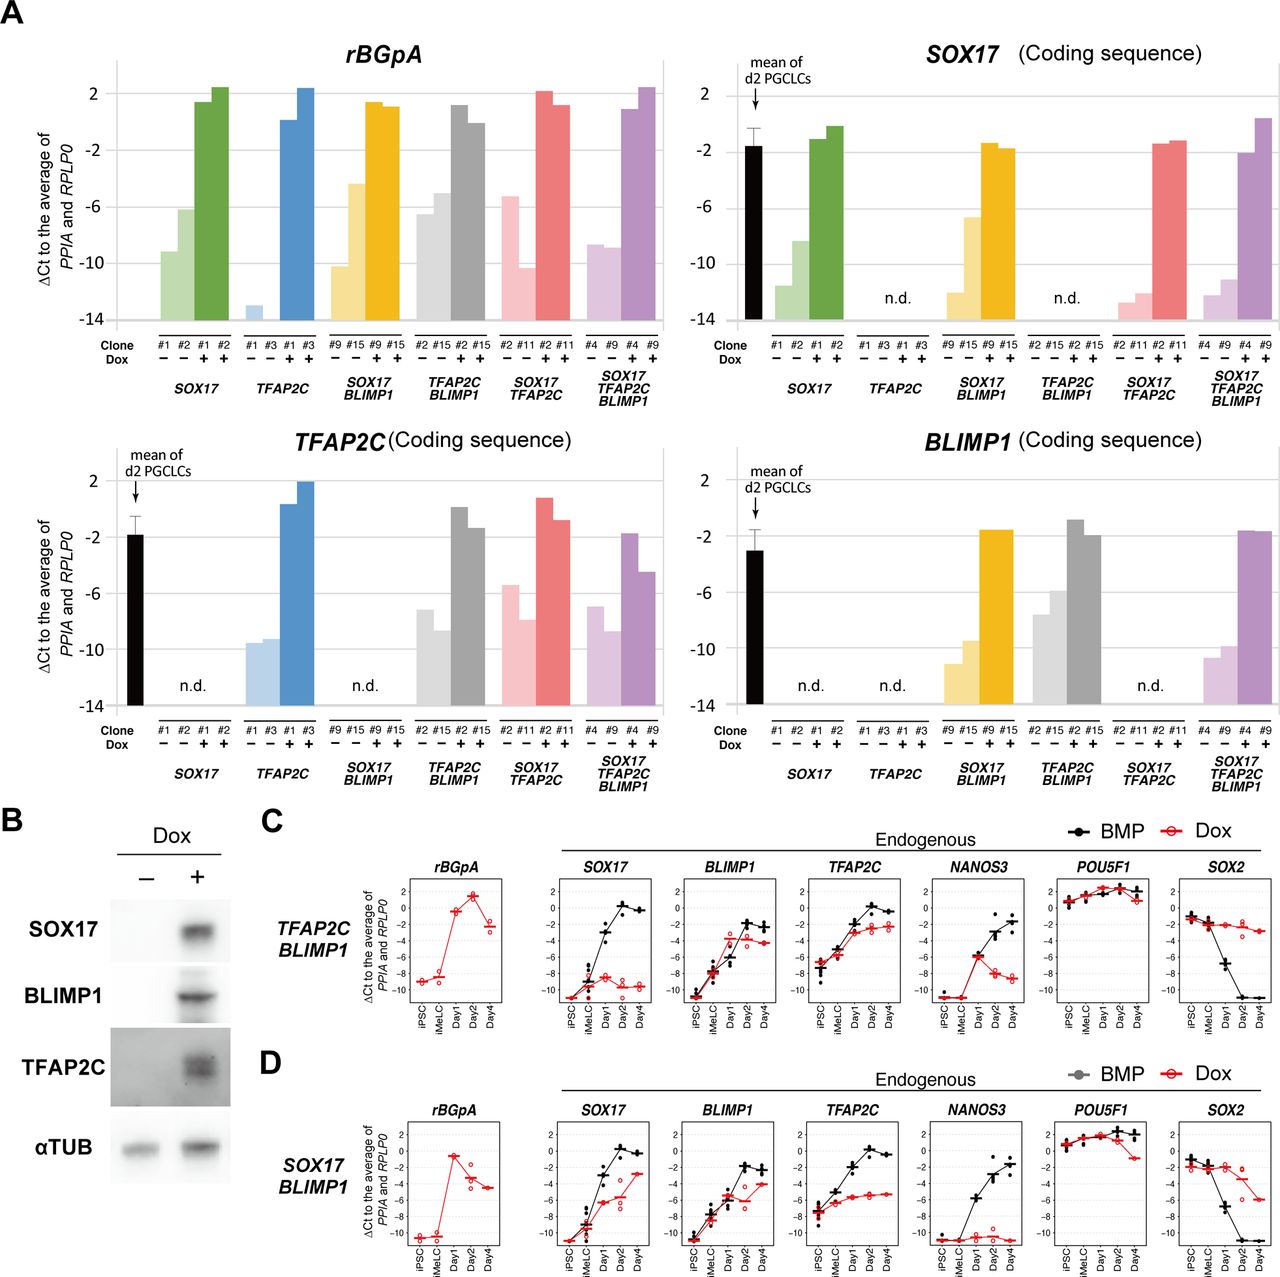
(A) A schematic of the vectors used for Dox-inducible expression. The coding sequence of each gene was cloned in the designated position. D4Z4: D4Z4 macrosatellite repeat insulator; EF1α: promoter sequence of human EEF1A1; rtTA: reverse tetracycline trans-activator; IRES: internal ribosome entry site; Neo: Neomycin resistance gene; tetO: Tet operator sequence; rBGpA: rabbit β-globin polyadenylation signal; Puro/Hygro: resistance gene for puromycin/hygromycin. (B) Heat map representation of the expression levels of the indicated genes in the designated hiPSC clones stimulated with (+) or without (−) Dox (1.0 μg/ml) for 24 h. Two clones were examined for each transgene combination. To quantify the expression levels of the transgenes or endogenous genes by qRT-PCR, primer pairs for the rBGpA or 3′ untranslated regions were used, respectively, and the ΔCt was calculated from the average Ct value of two housekeeping genes, RPLP0 and PPIA (set as 0). (C) The protocol for hPGCLC induction. iMeLC aggregates were induced for hPGCLC fate by bone morphogenetic protein 4 (BMP4) or Dox (1.0 μg/ml) in the presence of stem cell factor, EGF, and leukemia inhibitory factor. ActA: activin A; CHIR: CHIR99021. (D) Phase-contrast images of iMeLCs in the designated clones. No apparent morphological differences were seen among the clones. Representative images of at least two independent experiments are shown (shown in Fig 1F). Bar: 50 μm. (E) Bright-field and fluorescence (TFAP2C-EGFP [AG] and BLIMP1-tdTomato [BT]) images, and FACS analyses for BTAG expression in floating aggregates of the indicated transgene-expressing clones at day 4 of the indicated stimulation. (−): induction only with stem cell factor, EGF and leukemia inhibitory factor. Representative images of at least two independent experiments are shown (see Fig 1F). Bars, 200 μm. (F) Percentage of BT+AG+ cells of the indicated transgene-expressing clones with the indicated stimulations at day 2 (left) and day 4 (right). Dots represent values for each experiment and the bars represent their averages. The numbers of inductions performed are shown in parenthesis. (G, H) Expression dynamics of rBGpA (transgenes) and the indicated endogenous genes in the SOX17/TFAP2C (G) and SOX17/TFAP2C/BLIMP1 (H) clones induced by BMP4 (black) or Dox (red). d1: whole aggregates; d2/d4: BT+AG+ cells for induction by BMP4, BT+ cells for induction by Dox. For each gene, the ΔCt was calculated from the average Ct value of two housekeeping genes, RPLP0 and PPIA (set as 0). (G, H) Three independent experiments with two SOX17/TFAP2C clones (G) and three SOX17/TFAP2C/BLIMP1 clones (H) were performed.
- Figure S1. SOX17, TFAP2C, and BLIMP1 do not create human primordial germ-cell-like cells.
(A) The transgene expression levels in the designated hiPSC clones stimulated with (+) or without (−) Dox (1.0 μg/ml) for 24 h. Two clones were examined for each transgene combination. To quantify the transgene expression levels by qRT-PCR, primer pairs for the rabbit β-globin polyA sequence (rBGpA) or for the transgene coding sequences were used, and the ΔCt was calculated from the average Ct value of two housekeeping genes, RPLP0 and PPIA (set as 0). The expression levels of SOX17, TFAP2C and BLIMP1 in d2 human primordial germ-cell–like cells (BT+AG+ cells) measured by primer pairs for detecting their 3′ untranslated regions are shown as references. n.d., not determined. (B) Western blot analysis of the expression of SOX17, BLIMP1, and TFAP2C in the SOX17/TFAP2C/BLIMP1 hiPSC clone without (−) or with (+) 1.0 μg/ml of Dox for 24 h. α-TUBULIN was used as loading control. (C, D) Expression dynamics of rBGpA (transgenes) and the indicated endogenous genes in the TFAP2C/BLIMP1 (C) and SOX17/BLIMP1 (D) clones induced by bone morphogenetic protein 4 (black) or Dox (red). d1: whole aggregates; d2/d4: BT+AG+ cells for induction by bone morphogenetic protein 4, BT+ cells for induction by Dox. For each gene, the ΔCt was calculated from the average Ct value of two housekeeping genes, RPLP0 and PPIA (set as 0). The bars indicate the mean value of each time point. (C, D) Two independent experiments for the TFAP2C/BLIMP1 (C) and SOX17/BLIMP1 (D) clones were performed.
Source data are available for this figure.
Source Data for Figure S1[LSA-2020-00974_SdataFS1_FS4.pdf]
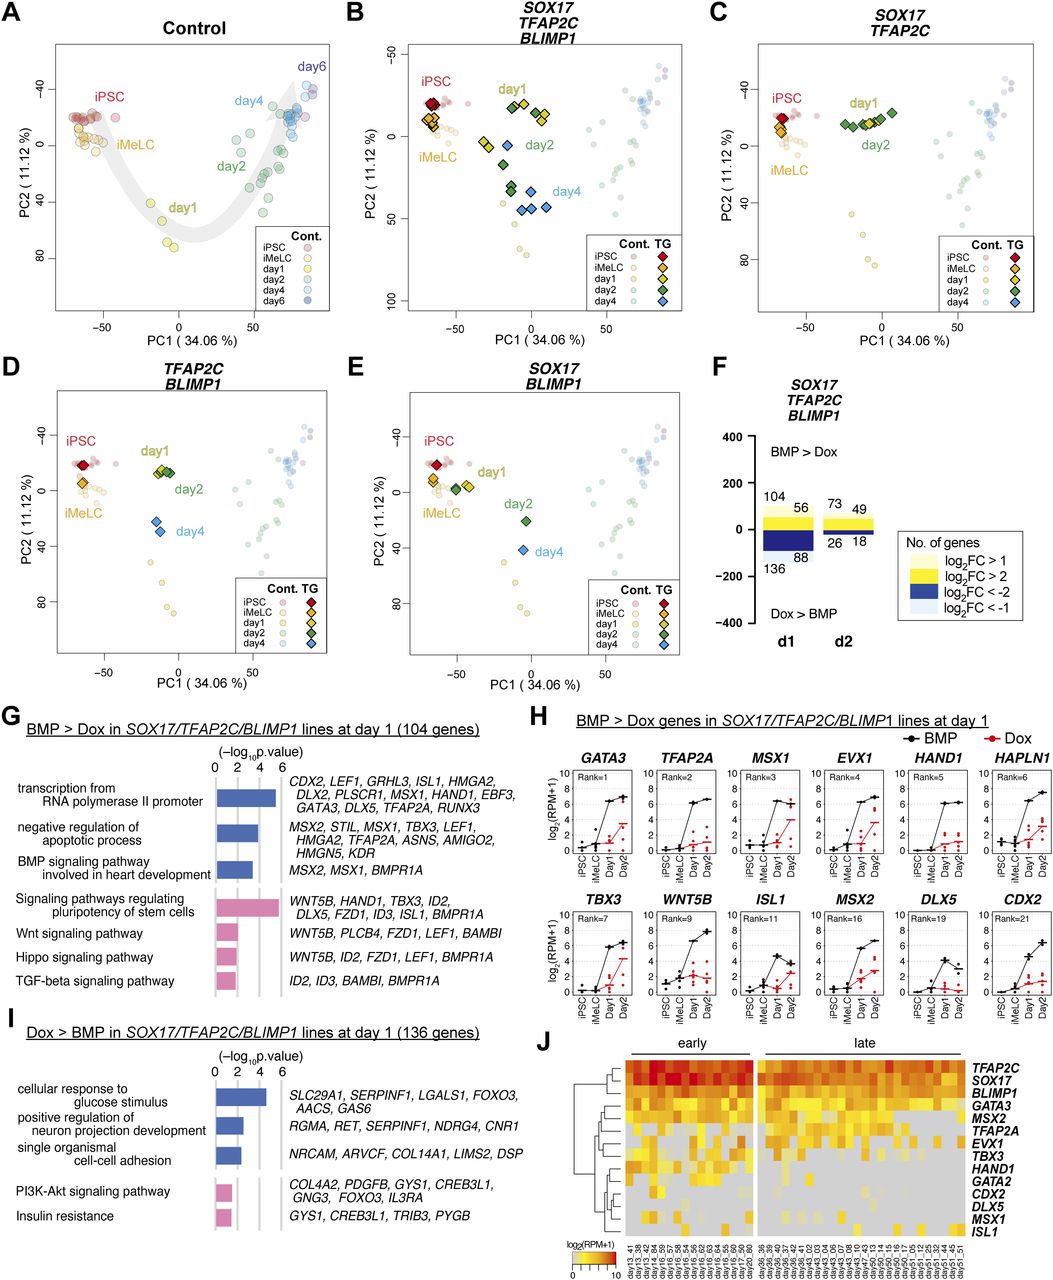
- Figure 2. Transcriptome analysis of the effects of the transcription factor expression.
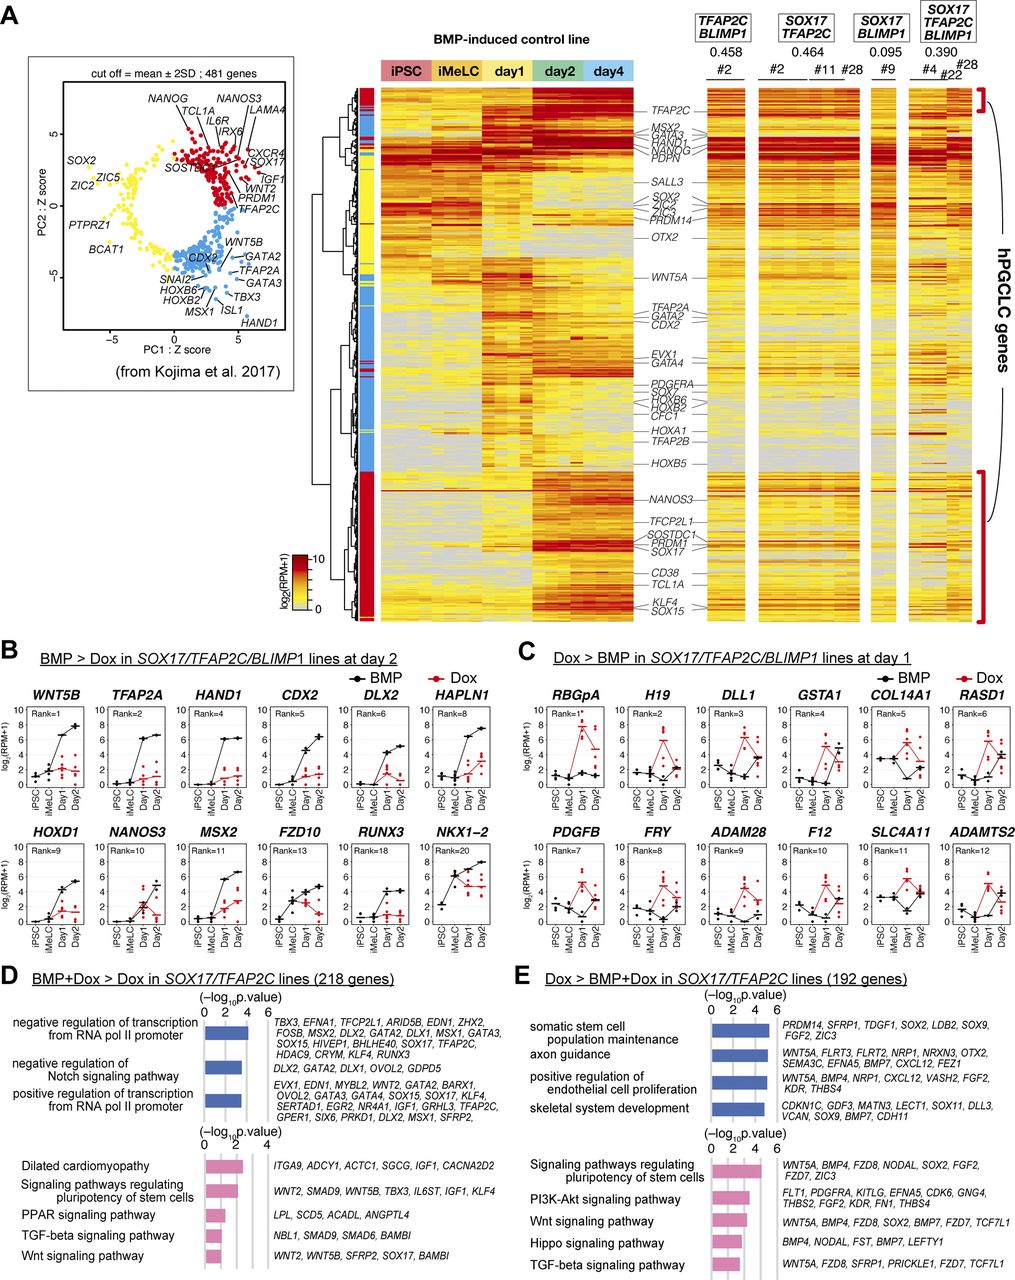
(A, B, C, D, E) Principal component analysis (PCA) of the effects of the transcription factor expression (see the Materials and Methods section for details). (A) The PCA plots of the cells (hiPSCs, iMeLCs, d1 whole aggregates, d2/d4/d6 BT+AG+ cells) derived from the parental clone (585B1 BTAG). The developmental progression is indicated by an arrow. (B, C, D, E) The PCA plots of the SOX17/TFAP2C/BLIMP1 (B), SOX17/TFAP2C (C), TFAP2C/BLIMP1 (D), and SOX17/BLIMP1 (E) clones (squares) are overlaid with those of the parental clone (circles with pale color). See Table S1 for the samples analyzed. The color coding is as indicated. (F) The numbers of the differentially expressed genes at d1/d2 between bone morphogenetic protein (BMP)– and Dox-stimulated cells of the SOX17/TFAP2C/BLIMP1 clones (P < 0.01 by Tukey–Kramer test, log2[RPM + 1] > 4 in cells with higher expression, log2[fold change: FC] >1 [up, pale yellow; down, pale blue] or 2 [up, yellow; down, blue]). d1: iMeLC whole aggregates; d2: BT+AG+ and BT+ cells for BMP- and Dox-stimulated cells, respectively. Note that the numbers of differentially expressed genes were smaller at d2, because the gene expression of the BT+ cells of the Dox-induced SOX17/TFAP2C/BLIMP1 clones was somewhat variable. (G, I) Gene ontology terms (blue) and KEGG pathways (pink) enriched in differentially expressed genes between BMP- and Dox-stimulated d1 SOX17/TFAP2C/BLIMP1 clone aggregates. (G, I) Representative genes up-regulated in BMP- (G) or Dox- (I) stimulations and P-values are shown. (F, H) Expression dynamics of the genes up-regulated at d1 (F) in BMP-stimulated (black) compared with Dox-stimulated (red) SOX17/TFAP2C/BLIMP1 clone-derived cells. The ranks of the genes ordered by the fold changes between BMP and Dox stimulation are shown. Note that TFAP2A, HAND1, HAPLN1, MSX2, and CDX2 were highly up-regulated in BMP-stimulated cells also at d2 (Fig S2B). See Table S1 for the samples analyzed. (E, H, J) Heat map representation of the expression of the genes in (H) in cynomolgus monkey fetal germ cells (early: embryonic day (E) 13-E17; late: E36-E51) (9, 18, 30, 31).
- Figure S2. Transcriptome analysis of the effects of the transcription factor expression.
(A) (left) Principal component analysis of the expression of the 481 genes characterizing human primordial germ-cell–like cell specification shown in reference 13. Red (first quadrant): genes for PGCLC specification; cyan (fourth quadrant): genes for endoderm/mesoderm specification; yellow (second and third quadrants): genes for pluripotency (right). Heat map representation of the expression of the 481 genes in the parental hiPSCs, iMeLCs, bone morphogenetic protein (BMP)4-induced d1 whole aggregates, and d2/d4 BT+AG+ cells, and in TFAP2C/BLIMP1, SOX17/TFAP2C, SOX17/BLIMP1, SOX17/TFAP2C/BLIMP1 clone-derived, Dox-induced d2 BT+ cells. Representative genes are annotated, and the correlation coefficient values of each induction with the d4 BT+AG+ cells are shown. The color coding is as indicated. (B, C) Expression dynamics of the genes up-regulated in BMP-stimulated (black, BT+AG+) compared with Dox-stimulated (red, BT+) d2 cells (B) (Note that TFAP2A, HAND1, CDX2, HAPLN1, and MSX2 were highly up-regulated also at d1 [Fig 2H]) or those up-regulated in Dox-stimulated (red) compared with BMP-stimulated (black) SOX17/TFAP2C/BLIMP1 clone-derived d1 iMeLC aggregates (C). The bars indicate the mean value of each time point, and the ranks of the genes ordered by the fold changes between BMP- and Dox-stimulation are shown. See Table S1 for the samples analyzed. (D, E) Gene ontology terms (blue) and KEGG pathways (pink) enriched in differentially expressed genes between BMP and Dox- and Dox-stimulated SOX17/TFAP2C clone-derived cells at d2 (BMP and Dox: BT+AG+; Dox: BT+). (D, E) Representative genes up-regulated in BMP and Dox- (D) or Dox- (E) stimulations and P-values are shown.
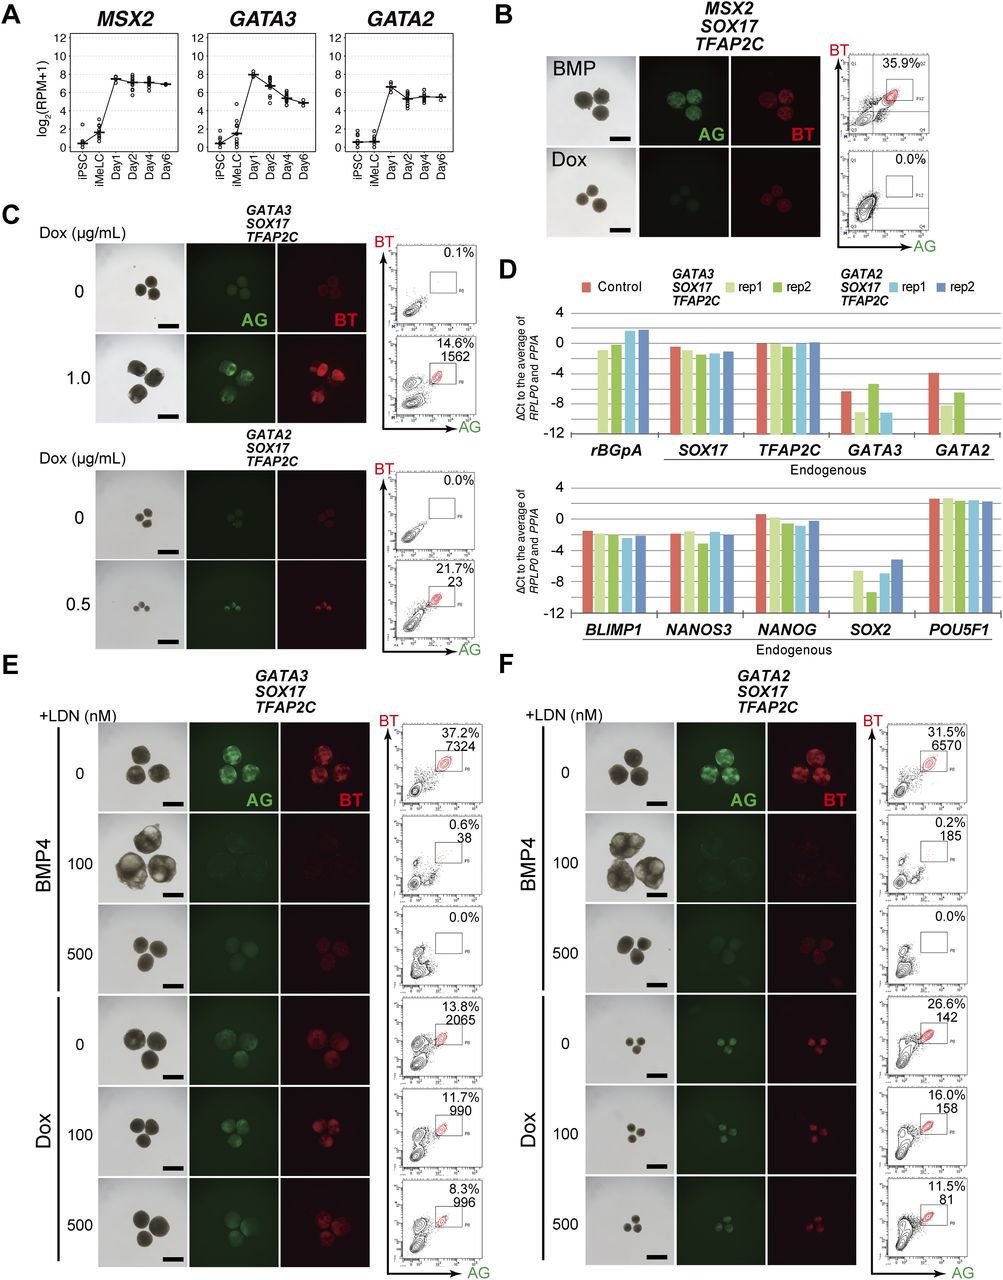
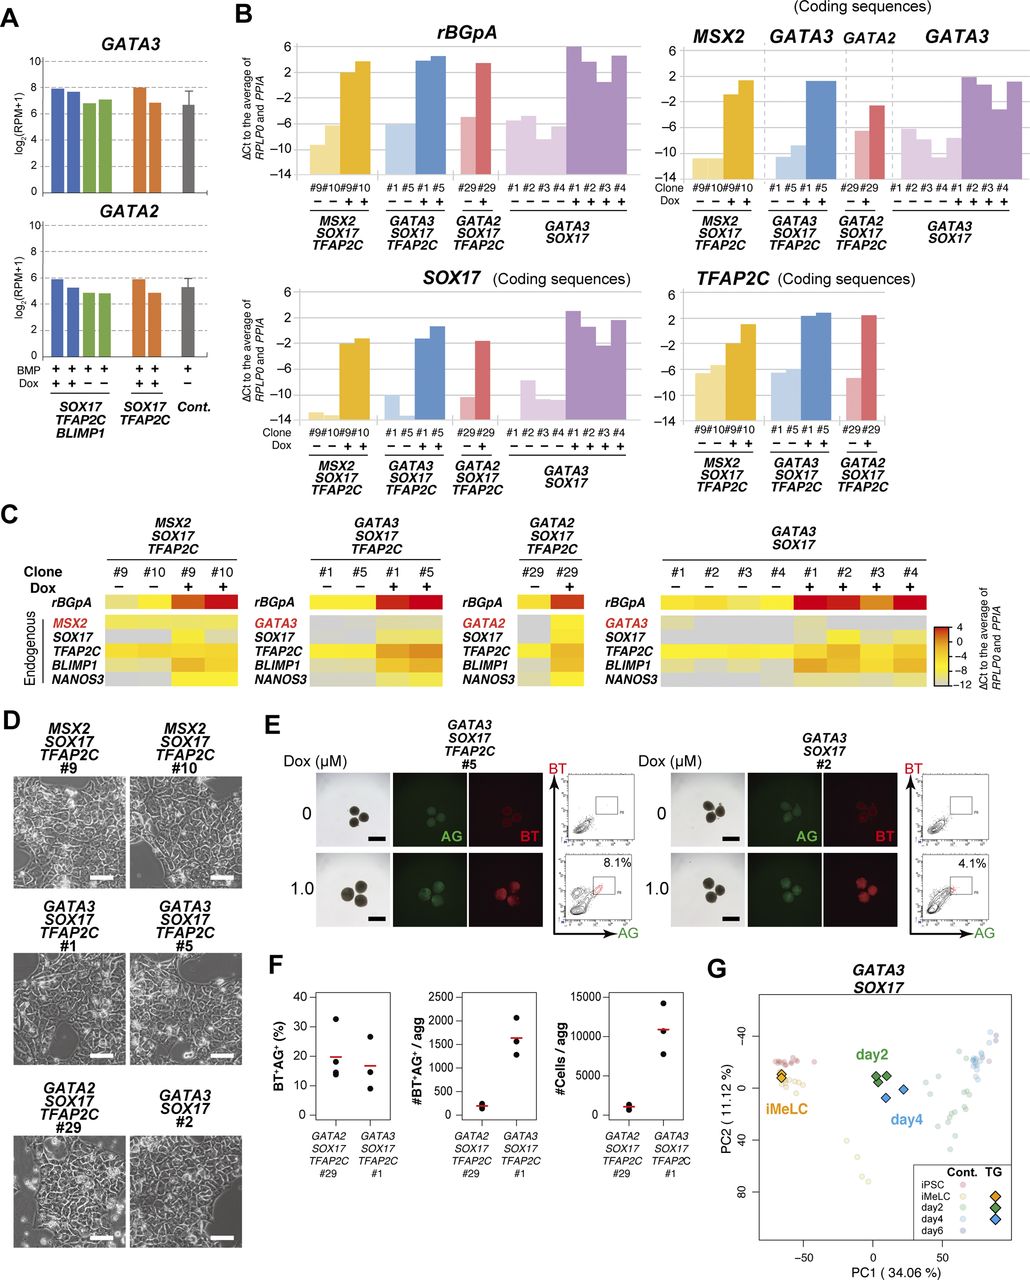
- Figure 3. GATA3/2, SOX17, and TFAP2C generate human primordial germ-cell-like cells.
(A) Expression dynamics of MSX2, GATA3, and GATA2 during bone morphogenetic protein (BMP)-driven human primordial germ-cell–like cell induction from the parental hiPSCs. Log2(RPM + 1) values are plotted and the bars indicate the mean value of each time point. See Table S1 for the samples analyzed. (B) Bright-field and fluorescence (AG/BT) images, and FACS analyses for BTAG expression in floating aggregates of the MSX2/SOX17/TFAP2C clone induced by BMP4 or Dox at d4. Representative images of three independent experiments are shown. Bars, 200 μm. (C) Bright-field and fluorescence (AG/BT) images, and FACS analyses for BTAG expression in floating aggregates of the GATA3/SOX17/TFAP2C clone (top) and GATA2/SOX17/TFAP2C clone (bottom) induced with or without Dox 1.0 μg/ml at d4. Representative images for 10 (GATA3/SOX17/TFAP2C) and six (GATA2/SOX17/TFAP2C) experiments are shown. Bars, 200 μm. (D) Expression of rBGpA (transgenes) and the indicated endogenous genes in BMP-induced parental clone-derived and Dox-induced GATA3/SOX17/TFAP2C clone- and GATA2/SOX17/TFAP2C clone-derived d4 BT+AG+ cells. Two replicates from independent experiments were analyzed. For each gene, the ΔCt was calculated from the average Ct value of two housekeeping genes, RPLP0 and PPIA (set as 0). (E, F) Bright-field and fluorescence (AG/BT) images, and FACS analyses for BTAG expression at d4 in floating aggregates of the GATA3/SOX17/TFAP2C (E) and GATA2/SOX17/TFAP2C (F) clones induced by BMP4 or Dox with 0, 100, 500 nM of LDN193189. Representative images of at least two independent experiments are shown. Bars, 200 μm.
- Figure S3. GATA3/2, SOX17, and TFAP2C generate human primordial germ-cell-like cells.
(A) Expression of GATA3 and GATA2 at d2 in bone morphogenetic protein (BMP) and Dox- or BMP-treated BT+ cells of the SOX17/TFAP2C/BLIMP1 clones, BMP and Dox-treated BT+ cells of the SOX17/TFAP2C clones, and BMP-treated BT+AG+ PGCLCs of the parental line. The transcriptome data were used and the values are shown in log2(RPM + 1). See Table S1 for the samples analyzed. (B) The transgene expression levels in the designated hiPSC clones stimulated with (+) or without (−) Dox (1.0 μg/ml) for 24 h. Two clones for MSX2/SOX17/TFAP2C and GATA3/SOX17/TFAP2C, one clone for GATA2/SOX17/TFAP2C, and four clones for GATA3/SOX17 expression were examined. To quantify the transgene expression levels by qRT-PCR, primer pairs for rabbit rBGpA or for the transgene coding sequences were used, and the ΔCt was calculated from the average Ct value of two housekeeping genes, RPLP0 and PPIA (set as 0). (C) Heat map representation of the expression levels of the indicated genes in the designated hiPSC clones stimulated with (+) or without (−) Dox (1.0 μg/ml) for 24 h. To quantify the expression levels of the transgenes or endogenous genes, primer pairs for rBGpA or the 3′ untranslated regions were used, respectively, and the ΔCt was calculated from the average Ct value of two housekeeping genes, RPLP0 and PPIA (set as 0). The color coding is as indicated. (D) Phase-contrast images of iMeLCs of the designated clones. No apparent morphological differences were seen among the clones. Representative images of at least two independent experiments are shown. Bars, 50 μm. (E) Bright-field and fluorescence (AG/BT) images, and FACS analyses for BTAG expression in d2/d4 floating aggregates of the GATA3/SOX17/TFAP2C (left) and GATA3/SOX17 (right) clones induced by 0 (top) or 1.0 μg/ml (bottom) of Dox. Representative data for six (GATA3/SOX17/TFAP2C) and two (GATA3/SOX17) experiments are shown. Bars, 200 μm. (F) BT+AG+ cell induction efficiency (%) (left), BT+AG+ cell numbers per aggregate (middle), and total cell numbers per aggregate (right) of the GATA2/SOX17/TFAP2C and GATA3/SOX17/TFAP2C clones. Mean values (n = 3 for each line) are shown as red bars. (G) The principal component analysis plots of the cells (iMeLCs, Dox-induced d2/d4 BT+ cells) derived from the GATA3/SOX17 clone (squares), overlaid with the indicated cells derived from the parental clone (circles with pale color). See Table S1 for the samples analyzed. The color coding is as indicated.
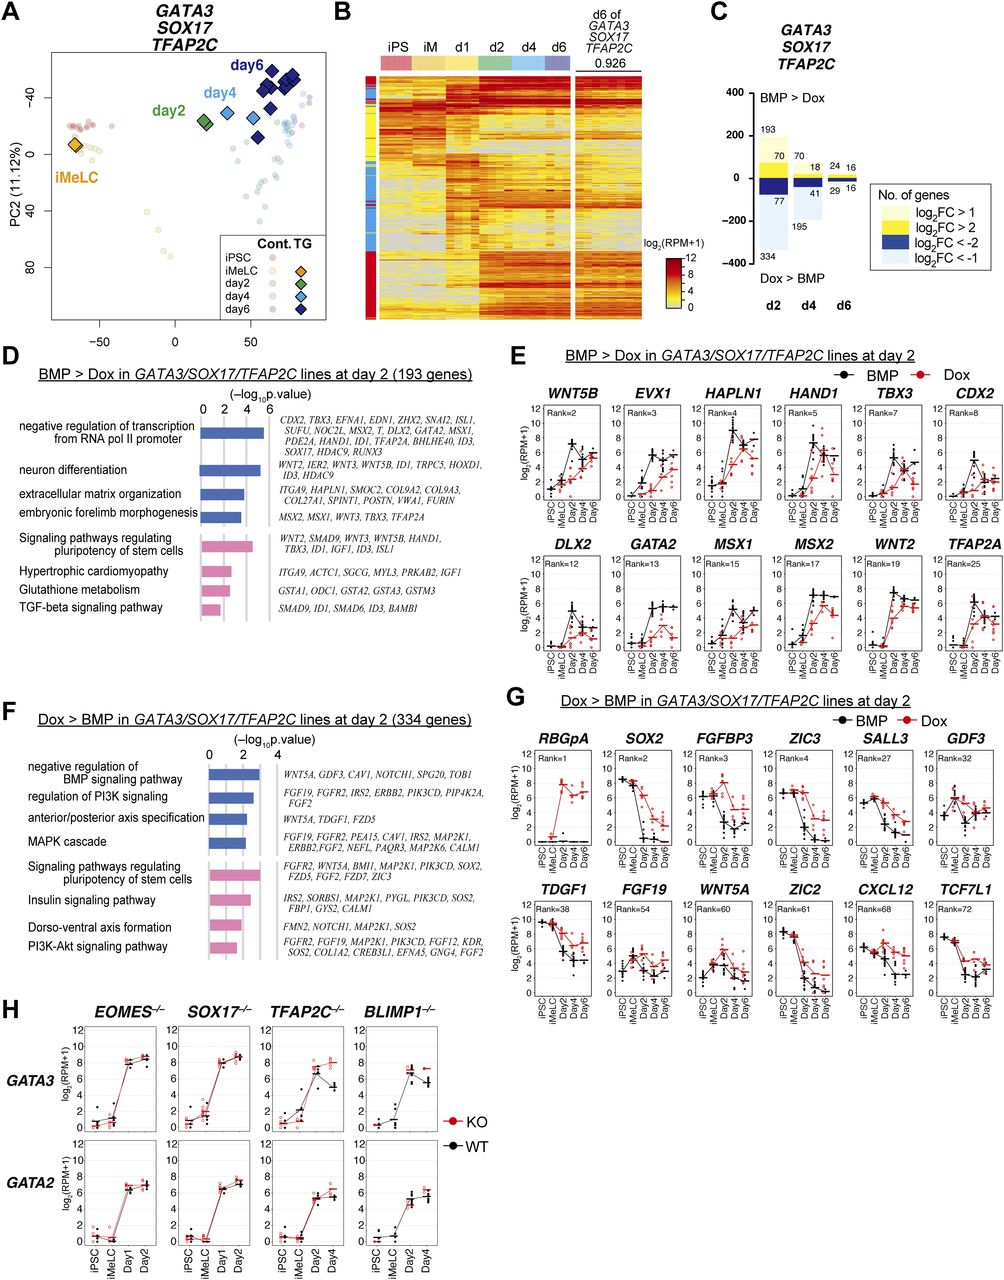
- Figure 4. The transcription factor-induced BT+AG+ cells directly acquire human primordial germ-cell-like cell (hPGCLC) transcriptome.
(A) The principal component analysis plots of the cells (iMeLCs, Dox-induced d2/d4/d6 BT+AG+ cells) derived from the GATA3/SOX17/TFAP2C clone (squares), overlaid with the indicated cells derived from the parental clone (circles with pale color). See Table S1 for the samples analyzed. The color coding is as indicated. (B) Heat map representation (color coding as indicated) of the expression of the 481 genes characterizing hPGCLC specification (13) (Fig S2) in the parental hiPSCs, iMeLCs, d1 whole aggregates, and d2/d4/d6 BT+AG+ cells and in Dox-induced, GATA3/SOX17/TFAP2C–derived d6 BT+AG+ cells. The correlation coefficient (0.926) between bone morphogenetic protein (BMP)– and Dox-induced d6 BT+AG+ cells is shown. The color coding in the left column is as follows: red, genes for PGCLC specification; cyan, genes for endoderm/mesoderm specification; yellow, genes for pluripotency. See Fig S2 for details. (C) The numbers of differentially expressed genes between BMP- and Dox-induced cells of the GATA3/SOX17/TFAP2C clone in d2/d4/d6 BT+AG+ cells (P < 0.01 by Tukey–Kramer test, log2[RPM + 1] > 4 in cells with higher expression, log2[fold change: FC] > 1 [up, pale yellow; down, pale blue] or 2 [up, yellow; down, blue]). (D, F) Gene ontology terms (blue) and KEGG pathways (pink) enriched in genes up-regulated in BMP-induced (D) and in Dox-induced (F) GATA3/SOX17/TFAP2C clone-derived d2 BT+AG+ cells. (E, G) Expression dynamics of the genes up-regulated in BMP-induced (E, the parental clone) or Dox-induced (G, the GATA3/SOX17/TFAP2C clone) d2 BT+AG+ cells during the respective induction processes (BMP: black; Dox: red). The bars indicate the mean value of each time point, and the rank of the gene ordered by the fold change is shown. See Table S1 for the samples analyzed. (H) Expression dynamics of GATA3 and GATA2 during BMP-induced hPGCLC induction from the parental (gray) and the indicated knockout hiPSCs (red) (d1: whole iMeLC aggregates; d2: EOMES−/−: whole aggregates; SOX17−/−: whole aggregates; TFAP2C−/−: BT+ cells; BLIMP1−/−: AG+ cells) (13). The bars indicate the mean value of each time point of each genotype. See Table S1 for the samples analyzed.
- Figure S4. Dose-dependent function of GATA transcription factors in human primordial germ-cell-like cell specification.
(A) The CRISPR targets (left) and resulting mutations (right) for GATA3 (top), GATA2 (middle), and GATA2 in the GATA3−/− #40 clone (bottom). The same gRNA was used to create GATA2 mutants. (left) The amino acid sequences and the genomic structures (the exons: black boxes; introns: folded lines; un-translated regions: white boxes) of GATA3 and GATA2 are indicated, with the position of zinc finger DNA binding domain (orange) and the CRISPR target sites (red arrows). (right) The DNA sequences of both alleles for the indicated knockout lines are shown. Red and green letters indicate the positions of the gRNAs including the PAM sequences. del, deletion; ins, insertion. (B) Western blot analysis of GATA3 and GATA2 expression in TE-like cells induced from the GATA3−/−, GATA2−/−, GATA3−/−:GATA2+/−, and GATA3−/−:GATA2−/− clones, and in the GATA3−/−:GATA2−/−: GATA3 (rescued) clones cultured with or without 1.0 μg/ml of Dox for 24 h. α-TUBULIN was used as a loading control. (C) Phase-contrast images of iMeLCs in the designated clones. No apparent morphological differences were seen among the clones. Representative images of four (GATA3−/−) and two (GATA2−/−) independent experiments are shown. Bars, 50 μm. (D, E) Bright-field and fluorescence (AG/BT) images, and FACS analyses for BTAG expression in d2/d4 floating aggregates of the GATA3−/−#17, #18, #30 (D) or GATA2−/− #6, #12 (E) clones induced by bone morphogenetic protein 4. Representative images of four (D) and two (E) independent experiments are shown. Bars, 200 μm. (F, G) The numbers of differentially expressed genes between the parental and GATA3−/− (E) or GATA2−/− (F) clones in iMeLCs (iM), d2/d4/d6 BT+AG+ cells (P < 0.01 by Tukey–Kramer test, log2[RPM + 1] > 4 in cells with higher expression, log2[fold change: FC] > 1 [up, pale yellow; down, pale blue] or 2 [up, yellow; down, blue]). (H) Phase-contrast images of the TE-like cells induced from the designated clones. The GATA3−/−:GATA2+/− #5-1 clone exhibited a cobblestone-like epithelial morphology similar to TE, whereas the GATA3−/−:GATA2−/− #5-10 clone failed to show TE-like differentiation and exhibited a mesenchymal morphology. Bars, 200 μm. (I) Phase-contrast images of iMeLCs in the designated clones. No apparent morphological differences were seen among the clones. Representative images of at least two independent experiments are shown (indicated in Fig 5F). Bars, 50 μm.
Source data are available for this figure.
Source Data for Figure S4[LSA-2020-00974_SdataFS1_FS4.pdf]
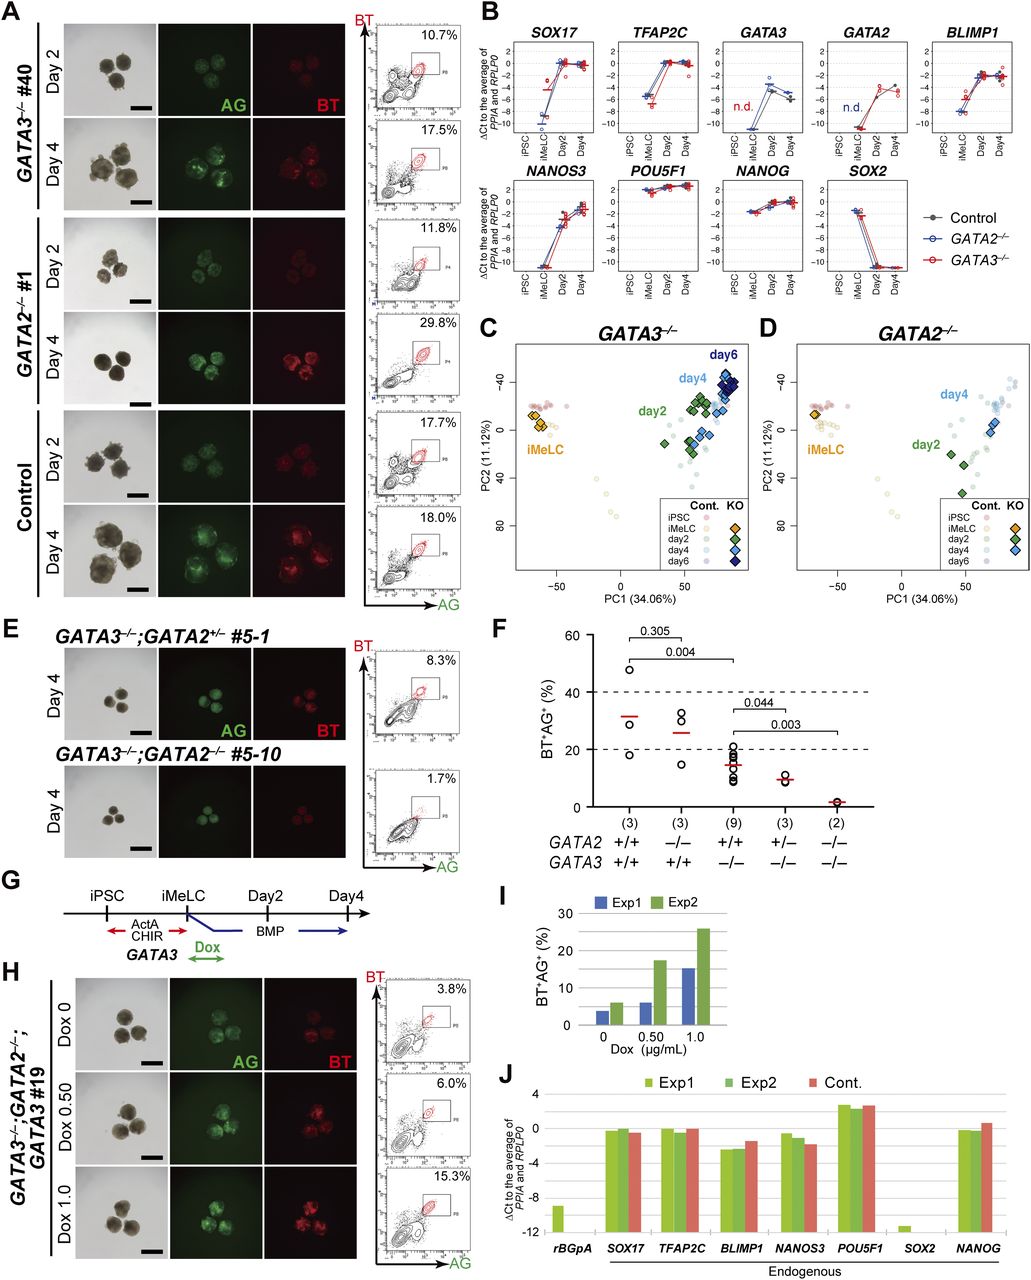
- Figure 5. Dose-dependent function of GATA transcription factors in human primordial germ-cell-like cell specification.
(A) Bright-field and fluorescence (AG/BT) images, and FACS analyses for BTAG expression in floating aggregates of the GATA3−/−, GATA2−/−, and parental clones induced by bone morphogenetic protein 4 (BMP4) at d2/d4. Representative images of at least two independent experiments are shown (indicated in Fig 5F). Bars, 200 μm. (B) Expression dynamics of the indicated genes during human primordial germ-cell–like cell induction (iMeLCs, d2/d4 BT+AG+ cells) by BMP4 from the parental (black), GATA3−/− (red), and GATA2−/− (blue) clones. For each gene, the ΔCt was calculated from the average Ct value of two housekeeping genes, RPLP0 and PPIA (set as 0). The bars indicate the mean value of each time point of each genotype. Replicate numbers: GATA2−/−: 3; GATA3−/−: 4 for iMeLCs and 8 for d2/d4 BT+AG+ cells; parental clone: 2. (C, D) The principal component analysis plots of the cells (iMeLCs, d2/d4/d6 BT+AG+ cells) derived from the GATA3−/− (C) and GATA2−/− (D) clones (squares), overlaid with the indicated cells derived from the parental clone (circles with pale colors). See Table S1 for the samples analyzed. The color coding is as indicated. (E) Bright-field and fluorescence (AG/BT) images, and FACS analyses for BTAG expression in floating aggregates of the GATA3−/−; GATA2+/− and GATA3−/−; GATA2−/− clones induced by BMP4 at d4. Representative images of at least two independent experiments are shown (indicated in Fig 5F). Bars, 200 μm. (F) The percentages of BT+AG+ cell induction from the indicated genotypes at d4. The replicate numbers and the P-values (t test) are as indicated. The inductions were performed side by side. Typically, the efficiency for BT+AG+ cell induction from parental hiPSCs varies to this extent (20%∼60%) (9, 13, 26). (G) A scheme for GATA3 expression in the GATA3−/−; GATA2−/−; GATA3 clone. (H) Bright-field and fluorescence (AG/BT) images, and FACS analyses for BTAG expression in floating aggregates of the GATA3−/−; GATA2−/−; GATA3 clone upon induction with BMP4 and 0, 0.5, and 1.0 μg/ml of Dox at d4. Representative images of at least two independent experiments are shown (indicated in Fig 5F). Bars, 200 μm. (I) The percentages of BT+AG+ cell induction at d4 (two replicates) from the GATA3−/−; GATA2−/−; GATA3 clone induced with BMP4 and 0, 0.5, and 1.0 μg/ml of Dox treatment. (J) Expression of the indicated genes in d4 BT+AG+ cells induced from the parental (with BMP4, red) or GATA3−/−; GATA2−/−; GATA3 (with BMP4 and Dox, green) clones (two replicates). For each gene, the ΔCt was calculated from the average Ct value of two housekeeping genes, RPLP0 and PPIA (set as 0).
- Figure 6. GATA3 expression in post-implantation cynomolgus monkey embryos.
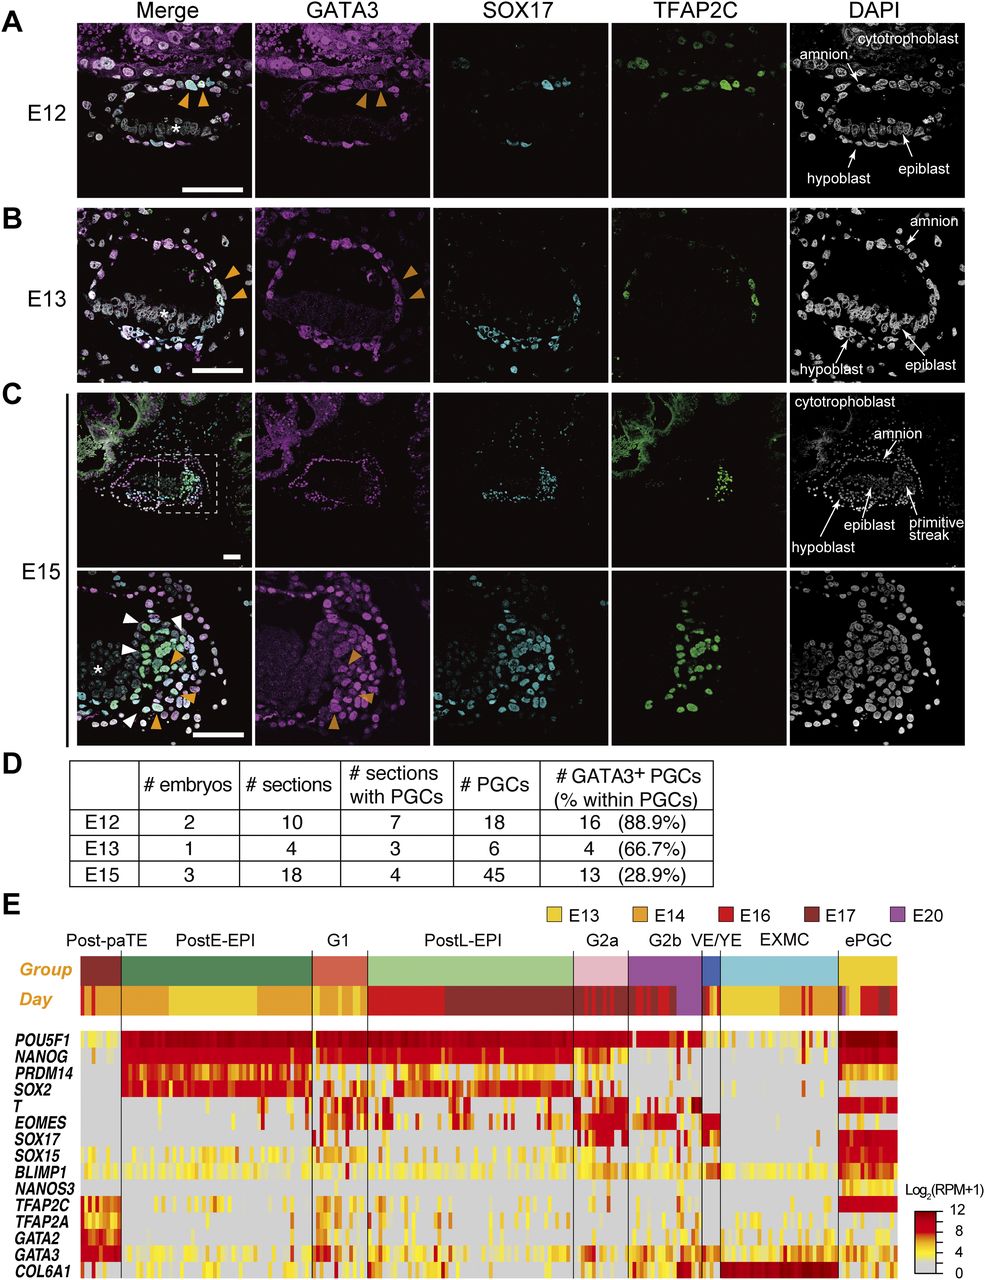
(A, B, C) Immunofluorescence analysis of GATA3 (magenta), SOX17 (cyan), and TFAP2C (green) expression (merged with DAPI) in cynomolgus monkey embryos at E12 (A), E13 (B) and E15 (C). For E15 (C), the boxed area (top) is magnified (bottom). Orange arrowheads indicate triple-positive PGCs, whereas white arrowheads indicate SOX17/TFAP2C+ but GATA3− cells. Note that there was no signal in the epiblast (asterisk). (D) Representative images of the samples shown in (D) are presented. Bars, 50 μm. (D) The numbers of embryos (E12, E13, and E15), total sections, and sections with PGCs (SOX17+TFAP2C+ cells), PGCs, and GATA3+ PGCs analyzed/detected in this study. (E) Heat map representation of the expression of key genes in the indicated cell types of the post-implantation cy embryos (30). The colored bars on top indicate cell types (top) and embryonic days (bottom), respectively. The color coding is as indicated. Post-paTE, PostE-EPI, post-implantation early epiblast; G1, gastrulating cells, group 1; postL-EPI, post-implantation late epiblast; G2a/G2b, gastrulating cells, group 2a/2b; VE/YE, visceral endoderm/yolk sac endoderm; EXMC, extraembryonic mesenchyme; ePGC, early PGC.
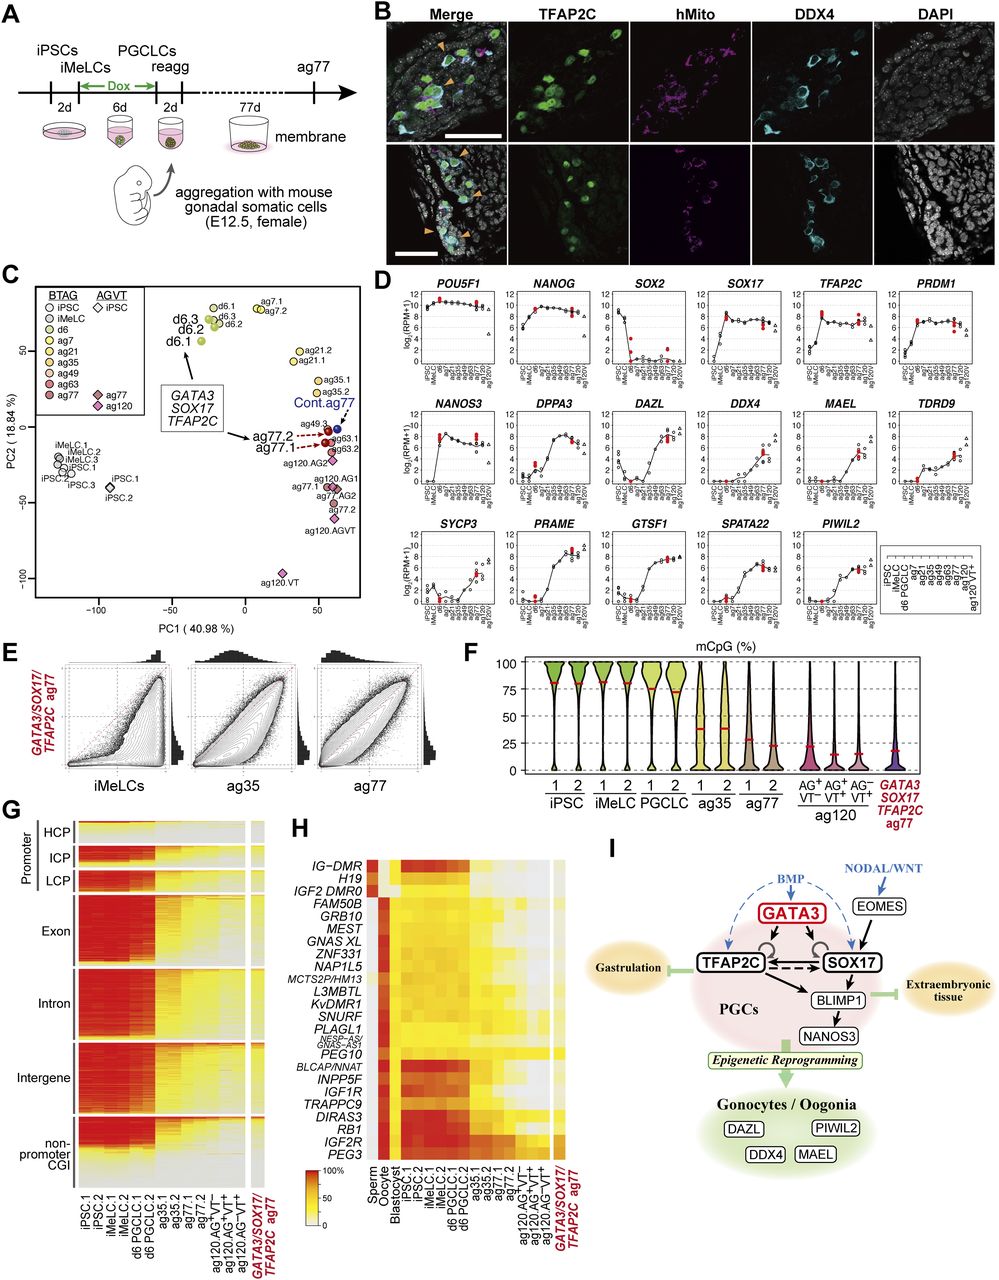
- Figure 7. Transcription factor-induced BT+AG+ cells differentiate into oogonia/gonocytes in xrOvaries.
(A) A scheme for xrOvary culture (10, 11) with Dox-induced GATA3/SOX17/TFAP2C clone-derived d6 BT+AG+ cells. (B) Immunofluorescence analysis of TFAP2C (green), human mitochondria antigen (magenta), and DDX4 (cyan) expression (merged with DAPI) on aggregation day (ag) 77 xrOvaries. In two independent experiments, 28 and 23 TFAP2C/DDX4-expressing cells/7 sections, respectively, were detected. Bars, 50 μm. (C) The principal component analysis plots of the transcriptome of the GATA3/SOX17/TFAP2C clone-derived d6 BT+AG+ cells, d6ag77 BT+AG+ cells, and the parent clone-derived bone morphogenetic protein-induced d6ag77 BT+AG+ cells (see Table S1) with the relevant cell types during in vitro oogonia/gonocyte differentiation reported in reference 10, in which 585B1 BTAG hiPSCs (XY) and 1390G3 AGVT (AG; DDX4 [also known as VASA]-tdTomato [VT]) hiPSCs (XX) were used as starting materials. Numbers following “ag” indicate the culture days in xrOvaries. For the AGVT cells, ag77 and 120 AG+VT− (AG), AG+VT+ (AGVT) or AG−VT+ (VT) were used for analysis. (D) Expression dynamics of the key genes in GATA3/SOX17/TFAP2C clone-derived d6 BT+AG+ cells, and d6ag77 BT+AG+ cells (n = 2, red circles) (see Table S1), overlaid with those in the relevant cell types during the in vitro oogonia/gonocyte differentiation reported in reference 10. (E) Scatter-plot comparisons, combined with histogram representations (top and right of scatter plots), of the genome-wide 5 mC levels (genome-wide 2-kb windows) between the indicated cell types. (F) Violin-plot representation of the genome-wide 5 mC levels determined by whole-genome bisulfite sequence analysis in the cell types indicated. The mean levels are indicated by red bars. (G, H) Heat map representation showing the 5 mC levels in the indicated genomic elements on the autosomes (G) and in the differentially methylated regions of the indicated imprinted genes (H) in the indicated cells. HCP/ICP/LCP, high/intermediate/low-CpG promoters. The color coding is as indicated. (I) A model of the transcription factor circuitry driving human primordial germ-cell like cell specification.
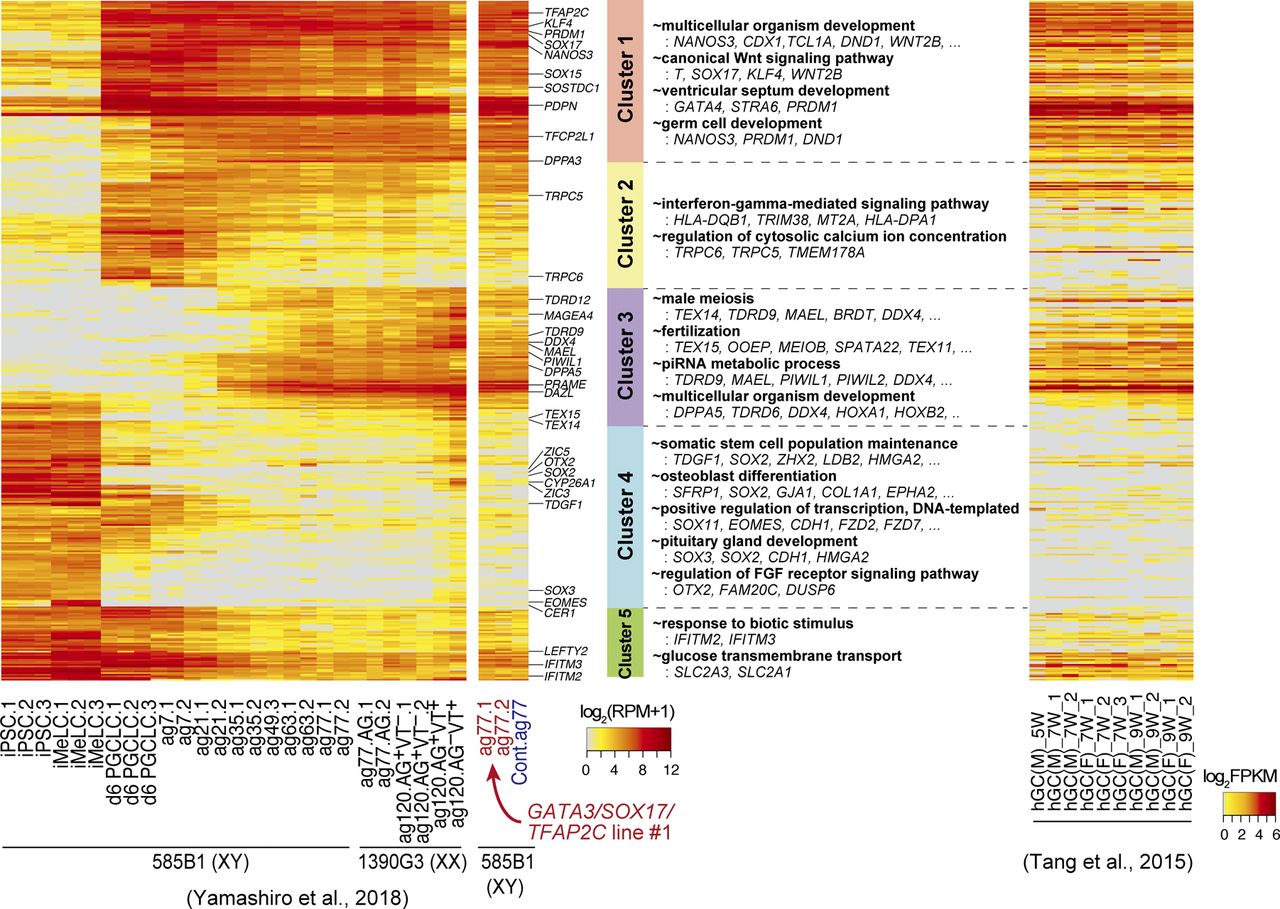
- Figure S5. Transcription factor-induced BT+AG+ cells differentiate into oogonia/gonocytes in xrOvaries.
Heat map representation of the expression of the 453 genes (the cluster 1–5 genes) characterizing the in vitro oogonia/gonocyte differentiation process reported in reference 10 in the GATA3/SOX17/TFAP2C-derived d6ag77 BT+AG+ cells and the parent clone-derived bone morphogenetic protein–induced d6ag77 BT+AG+ cells, in comparison with those in the relevant cell types in reference 10 and in human fetal germ cells reported in reference 47, as indicated. Representative genes are annotated, and gene ontology-term enrichments in each cluster and key genes are listed. ag, aggregation culture days; VT: DDX4 (also known as VASA)-tdTomato; hGC, human germ cells; M, male; F, female; W, developmental week. Numbers following the indications of cellular states denote replicate numbers. The color coding is as indicated.


Tables
Reagents and tools table
Reagent/resource Reference or source Identifier or catalog number Experimental models BTAG (BLIMP1-tdTomato and TFAP2C-eGFP knockin reporters in the 585B1 hiPSCs) Sasaki et al (2015). N/A BTAG; SOX17 OE#1 This study N/A BTAG; SOX17 OE#2 This study N/A BTAG; TFAP2C OE#1 This study N/A BTAG; TFAP2C OE#3 This study N/A BTAG; SOX17+BLIMP1 OE#9 This study N/A BTAG; SOX17+BLIMP1 OE#15 This study N/A BTAG; TFAP2C+BLIMP1 OE#2 This study N/A BTAG; TFAP2C+BLIMP1 OE#15 This study N/A BTAG; SOX17+TFAP2C OE#2 This study N/A BTAG; SOX17+TFAP2C OE#11 This study N/A BTAG; SOX17+TFAP2C OE#28 This study N/A BTAG; SOX17+TFAP2C+BLIMP1 OE#4 This study N/A BTAG; SOX17+TFAP2C+BLIMP1 OE#9 This study N/A BTAG; SOX17+TFAP2C+BLIMP1 OE#22 This study N/A BTAG; SOX17+TFAP2C+BLIMP1 OE#28 This study N/A BTAG; SOX17+TFAP2C+BLIMP1 OE#31 This study N/A BTAG; SOX17+TFAP2C+MSX2 OE#7 This study N/A BTAG; SOX17+TFAP2C+MSX2 OE#9 This study N/A BTAG; GATA3+SOX17+TFAP2C OE#1 This study N/A BTAG; GATA3+SOX17+TFAP2C OE#5 This study N/A BTAG; GATA2+SOX17+TFAP2C OE#29 This study N/A BTAG; GATA2−/− #1 This study N/A BTAG; GATA2−/− #6 This study N/A BTAG; GATA2−/− #12 This study N/A BTAG; GATA3−/− #17 This study N/A BTAG; GATA3−/− #18 This study N/A BTAG; GATA3−/− #30 This study N/A BTAG; GATA3−/− #40 This study N/A BTAG; HAND1−/− #6 This study N/A BTAG; GATA3−/−; GATA2+/− #5-1 This study N/A BTAG; GATA3−/−; GATA2−/− #5-10 This study N/A BTAG; GATA3−/−; GATA2−/−; GATA3 OE #19 This study N/A Recombinant DNA pX335-U6-Chimeric BB-CBh-hSpCas9n (D10A) Addgene Cat. no. 42335 Antibodies Goat anti-SOX17 R&D Systems AF1924; RRID: AB_355060 Mouse anti-TFAP2C Santa Cruz sc-12762; RRID: AB_667770 Mouse anti-BLIMP1 R&D Systems MAB36081; RRID: AB_10718104 Mouse anti-GATA3 BIOCARE ACR405A; RRID: AB_10895444 Rabbit anti-GATA3 Cell Signaling CST5852S; RRID:AB_10835690 Rabbit anti-GATA2 Novus NBP82581; RRID:AB_11026191 Rabbit anti-GATA2 Santa Cruz sc9008; RRID:AB_2294456 Mouse anti-human mitochondria Merck Millipore MAB1273; RRID:AB_94052 Goat anti-DDX4 R&D Systems AF2030; RRID:AB_2277369 Mouse IgG – HRP conjugated Sigma-Aldrich A5906; RRID: AB_258264 Mouse anti-α Tubulin Sigma-Aldrich T9026; RRID: AB_477593 Mouse IgG – HRP conjugated Sigma-Aldrich A5906; RRID: AB_258264 Rabbit IgG – HRP conjugated Sigma-Aldrich A6154; RRID: AB_258284 Goat IgG – HRP conjugated Sigma-Aldrich A5420; RRID: AB_258242 SSEA1 (CD15) microbeads for human and mouse Miltenyi Biotec 130-094+530 CD31 microbeads for mouse Miltenyi Biotec 130-097-418 Oligonucleotides and sequence-based reagents qRT-PCR primers This study Table S3 Chemicals, enzymes and other reagents StemFit AK03N Ajinomoto N/A iMatrix-511 Nippi Puromycin Thermo Fisher Scientific A1113803 G418, Geneticin Thermo Fisher Scientific #10131035 Hygromycin B Thermo Fisher Scientific #10131035 Doxycycline Takara-Clontech Z1311N Fibronectin Millipore FC010 GMEM Thermo Fisher Scientific #11710035 Knockout serum replacement Thermo Fisher Scientific A3181502 Activin A Peprotech 120-14E CHIR99021 TOCRIS #4423 Y27632 FujiFilm 030-24021 BMP4 R&D Systems 314-BP SCF R&D Systems 255-SC EGF R&D Systems 236-EG LIF Millipore LIF1010 LDN193189 StemGent 04-0074 Glutamax Thermo Fisher Scientific 35050-061 HEPES Thermo Fisher Scientific 15630-106 α-Minimum Essential Medium Thermo Fisher Scientific 32571-036 L-ascorbic acid Sigma-Aldrich A4403 Software FACSDiva Software BD Biosciences N/A DAVID (v6.8; GO analysis) https://david.ncifcrf.gov/ N/A FV10-ASW Olympus N/A R (v3.6.0; PCA, DEG, and graphs) https://www.R-project.org N/A Bowtie2 v2.2.7 http://bowtie-bio.sourceforge.net/bowtie2/index.shtml N/A TopHat v2.1.0 https://ccb.jhu.edu/software/tophat/index.shtml N/A HTSeq v0.9.1 https://htseq.readthedocs.io/en/master/overview.html N/A ImageJ/Fiji Fiji.sc N/A Trim_galore v0.6.3 https://www.bioinformatics.babraham.ac.uk/projects/trim_galore/ N/A cutadapt v118 http://cutadapt.readthedocs.io/en/stable/guide.html N/A Bismark v0.22.1 https://www.bioinformatics.babraham.ac.uk/projects/bismark/ N/A SAMtools v1.9 http://samtools.source-forge.net N/A Other pGEM-T Easy Kit Promega A3600 Gateway LR Clonase Enzyme Mix Thermo Fisher Scientific #11791043 v-bottom 96-well plate Greiner #651970 RNeasy Micro Kit QIAGEN #74004 NucleoSpin RNA XS Macherey-Nagel #740902 Qubit RNA HS assay kit Thermo Fisher Scientific Q32855 PowerSYBR Green PCR Master Mix Thermo Fisher Scientific #4367659 Qubit dsDNA HS assay kit Thermo Fisher Scientific Q32851 Protein Quantification Assay Macherey-Nagel #740967 ECL Western Blotting Detection Reagent GE Healthcare Life Sciences RPN2106 EZ DNA Methylation-Gold Kit Zymogen D5005 DP72 Olympus N/A FV1000-IX81 confocal microscope system Olympus N/A CFX384 Touch Real-Time PCR detection system Bio-Rad Laboratories N/A NextSeq500/550 Illumina N/A Hiseq2500 Illumina N/A


In this Issue
Subjects
Related Articles
Cited By...
- Generation of marmoset primordial germ cell-like cells under chemically defined conditions
- Rapid Human Oogonia-like Cell Specification via Combinatorial Transcription Factor-Directed Differentiation
- scEGOT: Single-cell trajectory inference framework based on entropic Gaussian mixture optimal transport
- Origin and segregation of the human germline
- Resolution of the curse of dimensionality in single-cell RNA sequencing data analysis
- Resolution of the curse of dimensionality in single-cell RNA sequencing data analysis