


Article Figures & Data
Figures
- Figure S1. Expression of NUC genes, DCX, and LIS1, in NB.
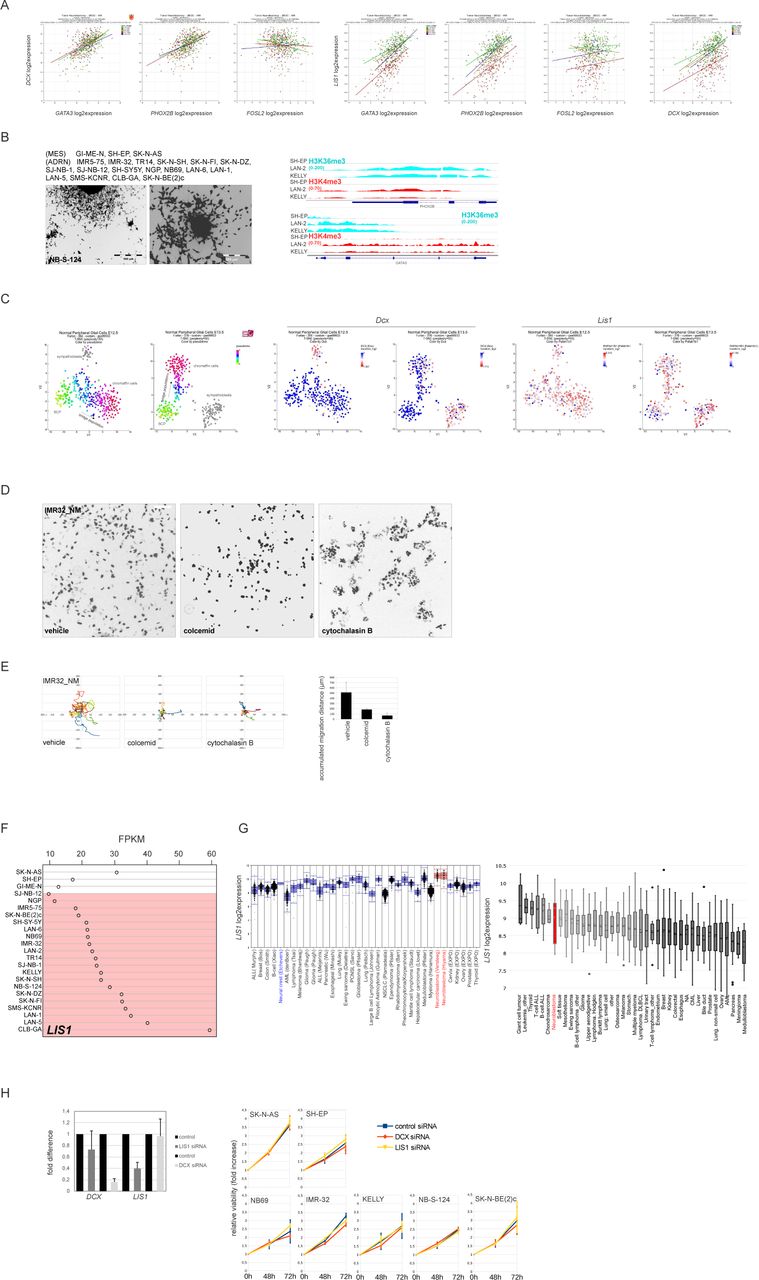
(A) Scatter plots showing correlation of expression of DCX or LIS1 and ADRN transcription factors GATA3, PHOX2B, or MES transcription factor FOSL2 (498 patients; GEO: gse49710). (B) ADRN and MES cell lines used in the work (Boeva et al, 2017; van Groningen et al, 2017) (top left) and representative phase-contrast images of N-type NB-S-124 (bottom left). ChIP-seq (right) showing H3K4me3 and H3K36me3 binding at GATA3 and PHOX2B loci in I-type cell lines KELLY and LAN-2 and MES-type SH-EP. (C) Dcx and Lis1 expression in t-SNE-resolved E12.5 and E13.5 sympathetic precursors: sympathoblasts, Schwann cell precursors, bridge population, and chromaffin cells (Furlan et al, 2017). t-SNE maps are annotated according to Furlan et al (2017). (D)_NM fluorescence (negative grayscale) for nuclear morphologies in IMR-32_NM cells after treatment with vehicle, colcemid or cytochalasin b. Scale bar 100 μm. (E) Random walk plots and accumulated migration distances in vehicle, colcemid or cytochalasin B-treated IMR-32_NM (13 h, 15-min intervals). For colcemid experiments, the cells were washed after treatment and left to recover for 10 h before imaging. Cells were tracked using an ImageJ plugin for manual tracking. Mean migration distances + SD are presented. (F) LIS1 mRNA expression in MES and ADRN (marked in red) cell lines. (G) Affymetrix LIS1 mRNA expression analysis (left) in two series of NB tumor samples (red) and series of various other tumor types and neural crest cell line (blue) (probe set 229349). Affymetrix LIS1 mRNA expression data (right) from various cancer cell lines (CCLE). NB cell lines are indicated in red. (H) Validation of DCX and LIS1-KD (left) by qRT-PCR 48 h after transfection in IMR-32 and cell viability of NB cell lines after DCX or LIS1-KD (right). Cell survival was assessed by Alamar Blue assay at 48 and 72 h after transfection. Values are reported as mean percent ± SD of vehicle-treated control.
- Figure 1. NB cells exhibit NUC during migration.
(A) DCX mRNA expression in MES and ADRN (marked in red) cell lines (the names of ADRN cell lines whose identity was assigned based on the phenotype and/or PHOX2b, GATA3, and FOSL2 transcription are represented in grey color [Fig S1A], the cell type identity in the other cell lines [black color] is described in the literature). (B) ChIP-seq showing H3K4me3, H3K36me3, and H3K27me3 binding at the DCX locus in three MES and ADRN (marked in red) cell lines. For H3K27me3 binding, the region surrounding DCX locus (white box) was visualized in IGV program. (C) Time-lapse images showing migrating NB-S-124 and IMR-32 cells. (D) Time-lapse images of IMR-32_NM and SH-EP_NM cells during migration. Nuclear (in blue) and cellular center (in orange) of migrating cells are indicated. Scale bar 20 μm. (E) CN trajectories and CN plots of representative IMR-32_NM and SH-EP_NM cells. (F) Schematic of nuclei positioning determined by NCn+1-NCn/|NCn+1-CCn+1 angle (NNC/NCC) (left) and NNC/NCC angle frequency distribution in IMR-32_NM, SK-N-BE(2)c_NM, and SH-EP_NM cells (right). NUC events decoded from CC; nuclear centroid tracks in concatenated tracks from IMR-32_NM, SK-N-BE(2)c_NM, and SH-EP_NM (top right). Mapping of NUC (exemplary track in red), positive and negative noise-corrected NC-CC distances, 0–40° and 130–180° signatures (two or more sequential frames within the same angle block) (exemplary multi-colored track) in concatenated tracks from IMR-32_NM, SK-N-BE(2)c_NM and SH-EP_NM (bottom right). (G) Correlation plots between cell velocity and NUC footprint (weighted mean NUC distance) in IMR-32_NM, SK-N-BE(2)c_NM and SH-EP_NM cells. (H) Live imaging of pseudo-3-D-assayed IMR-32_NM cells. Scale bar 10 μm. (I) 2D exclusion assay in NB cell lines after RNAi against DCX or LIS1 72 h post-transfection. Relative cell migration is quantified by cell density’s normalization to control siRNA-transfected control. Graphs represent the mean relative difference migration ± SD. (J) Random walk plots and accumulated migration distances in control IMR-32_NM cells and after RNAi against DCX or LIS1 72 h post-transfection (13 h, 15-min intervals). Mean migration distances + SD are presented. (K) Box plots showing cell migration distances in 216 and 1,528 (G1 phase), 167 and 985 (S/G2 phases) sequential timepoints (20 and 5 min per timepoint, respectively) from tracings of 13 cells from IMR5-75 and 22 cells from IMR-32 expressing the G1 cell cycle sensor (left); P-values: IMR5-75: 6.168 × 10⁻⁵, IMR-32: 2.2 × 10⁻¹⁶ (two-sample Kolmogorov-Smirnov test). NNC/NCC angle frequency distribution and noise-corrected nuclear centroid-CC distances (right) in 0–40° and 140–180° signatures in concatenated tracks from IMR-32_NM expressing the G1 cell cycle sensor. (L) Time-lapse images showing representative migrating IMR-32_NM expressing γ-tubulin. Scale bar 20 μm.
- Figure 2. NUC genes are involved in migration in ADRN-type cells.
(A) |NC-CC| plots for control IMR-32_NM cells and the cells after DCX- or LIS1-KD 72 h post-transfection. (B) βIII-tubulin immunolabeling (top left) in control IMR-32 cells and after RNAi against DCX and LIS1 72 h post-transfection. Neurite outgrowth after LIS1 RNAi (bottom left; grayscale negative field) is indicated by white arrows. Scale bar 100 μm. Violin plots showing the nucleus-to-centrosome distance distribution in DCX- and LIS1-KD IMR-32 cells (right). Means are indicated. P-values: DCX siRNA: 0.009898, LIS1 siRNA: n.s.; (Welch t test). (C) Mapping of NUC, positive and negative noise-corrected NC-CC distances, 0–40° and 140–180° signatures in concatenated tracks from DCX-KD (27 cells, 762 time points) and LIS1-KD (41 cells, 1,256 timepoints) IMR-32_NM. (D) NNC/NCC angle frequency distribution in concatenated tracks in DCX- and LIS1-KD IMR-32_NM cells. (E) Correlation plots between cell velocity and NUC footprint in DCX- and LIS1-KD IMR-32_NM cells. (F) Venn diagram showing overlaps between the differentially expressed genes (DEGs; |logFC| cutoff: 0.3) in DCX- and LIS1-KD IMR-32 versus control IMR-32. (G) Gene set enrichment analysis plots of the indicated gene sets in DCX-KD IMR-32. False discovery rate (FDR)-adjusted P-values (q-values) are listed. (H) Volcano plots showing log2FC expression (y-axis) and log10 FDR-adjusted P-value (−log10 FDR-P-value, x-axis) of DEGs in DCX- and LIS1-KD IMR-32 in stage 4S versus stage 4 tumors (GEO: gse49710). Each dot represents an individual spot. (I, J) Gene set enrichment analysis plots of the indicated gene sets in LIS1- and DCX-KD IMR-32 based on their mis-expression in stage 4S versus stage 4 tumors (P-values by two-way t test ≤ 0.05, no logFC cutoff). (K) Plots showing mapping of DEGs of DCX-KD IMR-32 onto NB disseminated tumor cell transcriptome profiles (Rifatbegovic et al, 2018).
- Figure S2. Analysis of DEGs in DCX- and LIS1-KD IMR-32.
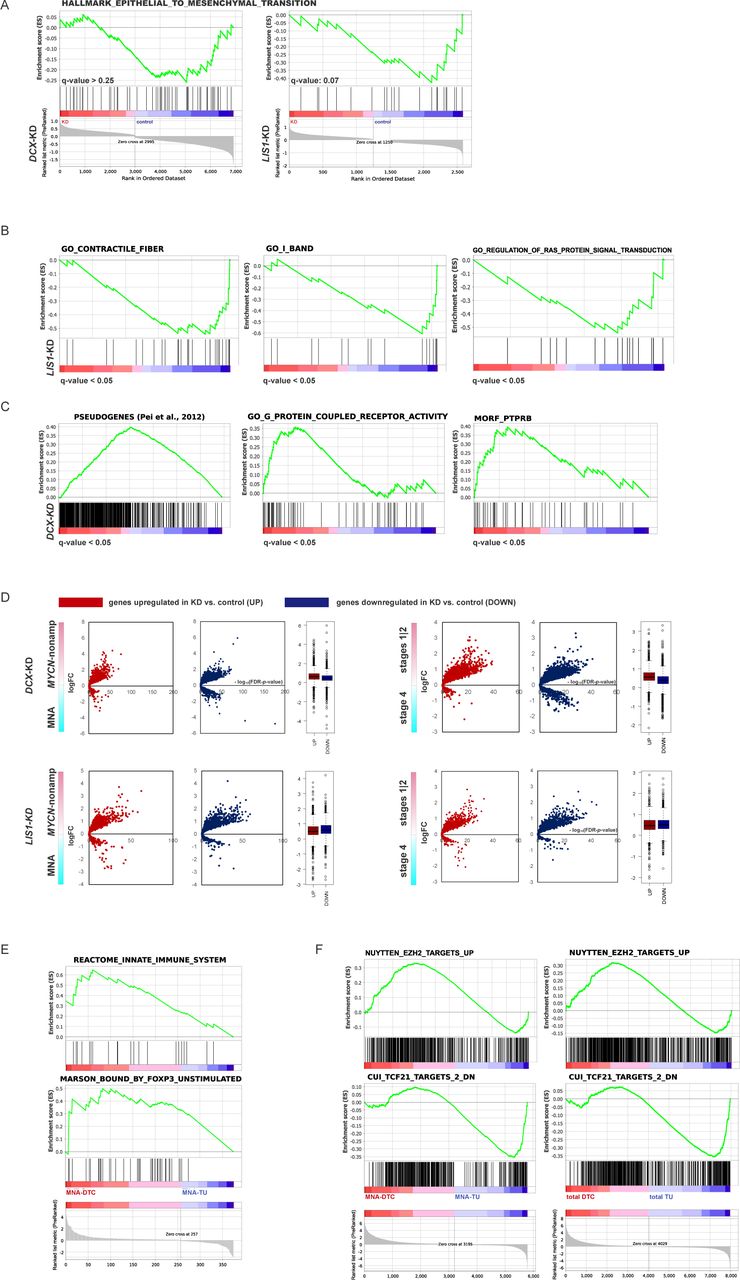
(A) Gene set enrichment analysis (GSEA) plots showing gene set “epithelial–mesenchymal transition” in DCX- and LIS1-KD IMR-32 versus control. q-values are listed. (B) GSEA plots showing gene signatures related to cell contraction and Ras signalling regulation in LIS1-KD IMR-32 versus control IMR-32. q-values are listed. (C) Enrichment plots for pseudogene transcripts (Pei et al, 2012), gene signatures related to G-protein coupled receptor signalling and PTPRB neighbourhood in DCX-KD IMR-32 versus control IMR-32. q-values are listed. (D) Volcano plots showing expression of DEGs in DCX-KD and LIS1-KD cells in MYCN-nonamplified versus MNA and stages 1|2 versus stage 4 tumors. (E) GSEA plots for immune cell specific signatures of DCX-KDUP ∩ NB_disseminated tumor cell list. (F) GSEA plots for the signatures associated with stage 4S, stages 1|2 and MYCN-nonamplified status, as identified by parametric analysis of gene set enrichment (PAGE analysis) using gse49710 signature (Table S1) in NB disseminated tumor cell transcriptome profiles (Rifatbegovic et al, 2018).
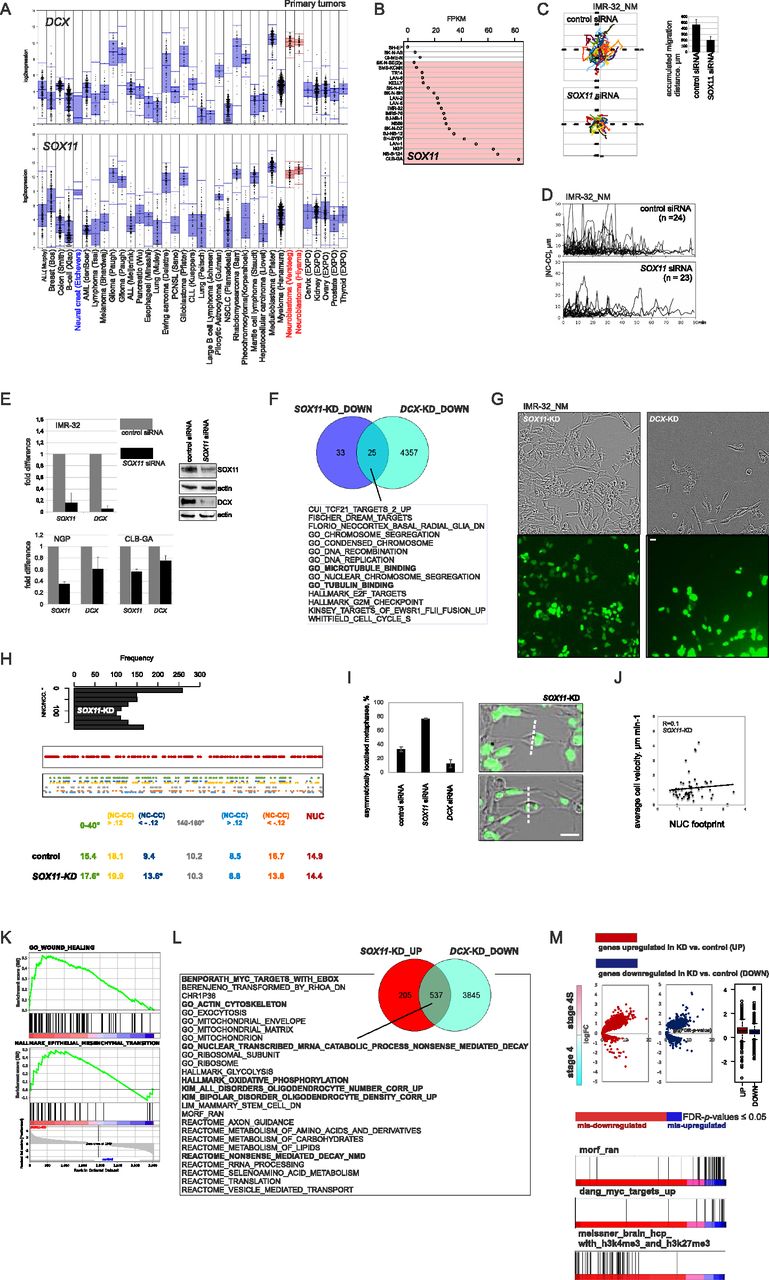
- Figure 3. SOX11 regulates NUC.
(A) Affymetrix DCX mRNA (probe set 229349, top) and SOX11 mRNA (probe set 204914, bottom) expression analysis from primary tumors. (B) SOX11 mRNA expression in MES and ADRN (marked in red) cell lines. (C) Random walk plots and accumulated migration distances in control IMR-32_NM and after RNAi against SOX11 72 h post-transfection (6 h, 15-min intervals). Mean migration distances + SD are presented. The efficiency of SOX11-KD was determined by WB. (D) Representative |NC-CC| plots in IMR-32_NM controls and after RNAi against SOX11. (E) Relative qRT-PCR for SOX11 and DCX in IMR-32 after SOX11 RNAi 72 h post-transfection and in NGP and CLB-GA after SOX11 RNAi 48 h post-transfection (left). Mean relative difference values + SE of control are presented. WB for DCX in IMR-32 after 48 h post-transfection (right). (F) Venn diagram showing the number of gene sets (extracted from MSigDB [22,596 gene sets]) in IMR-32 DCX-KDDOWN ∩ SOX11-KDDOWN semantic overlap (q-values ≤ 0.05). (G) Cell morphology in SOX11-and DCX-KD cells. Scale bar 20 μm. (H) NNC/NCC angle frequency distribution (top) and mapping of NUC, positive and negative noise-corrected NC-CC distances, 0–40° and 140–180° signatures (bottom) in SOX11-KD (57 cells, 1,314 timepoints). (I) The percentages of asymmetrically localised metaphases (left) in control, SOX11- and DCX-KD IMR-32_NM. Mean percentages + SD are presented. Representative images of dividing SOX11-KD cell (right, scale bar 20 μm). (J) Correlation plot between cell velocity and NUC footprint (weighted mean NUC distance) in SOX11-KD IMR-32_NM. (K) Gene set enrichment analysis plots showing gene sets “wound healing” and “epithelial–mesenchymal transition” in SOX11-KD versus control. (L) Venn diagram showing the number of gene sets (MSigDB) in IMR-32 SOX11-KDUP ∩ DCX-KDDOWN semantic overlap (q-values ≤ 0.05). (M) Volcano plots showing expression of DEGs in SOX11-KD IMR-32 in stage 4S versus stage 4 tumors.
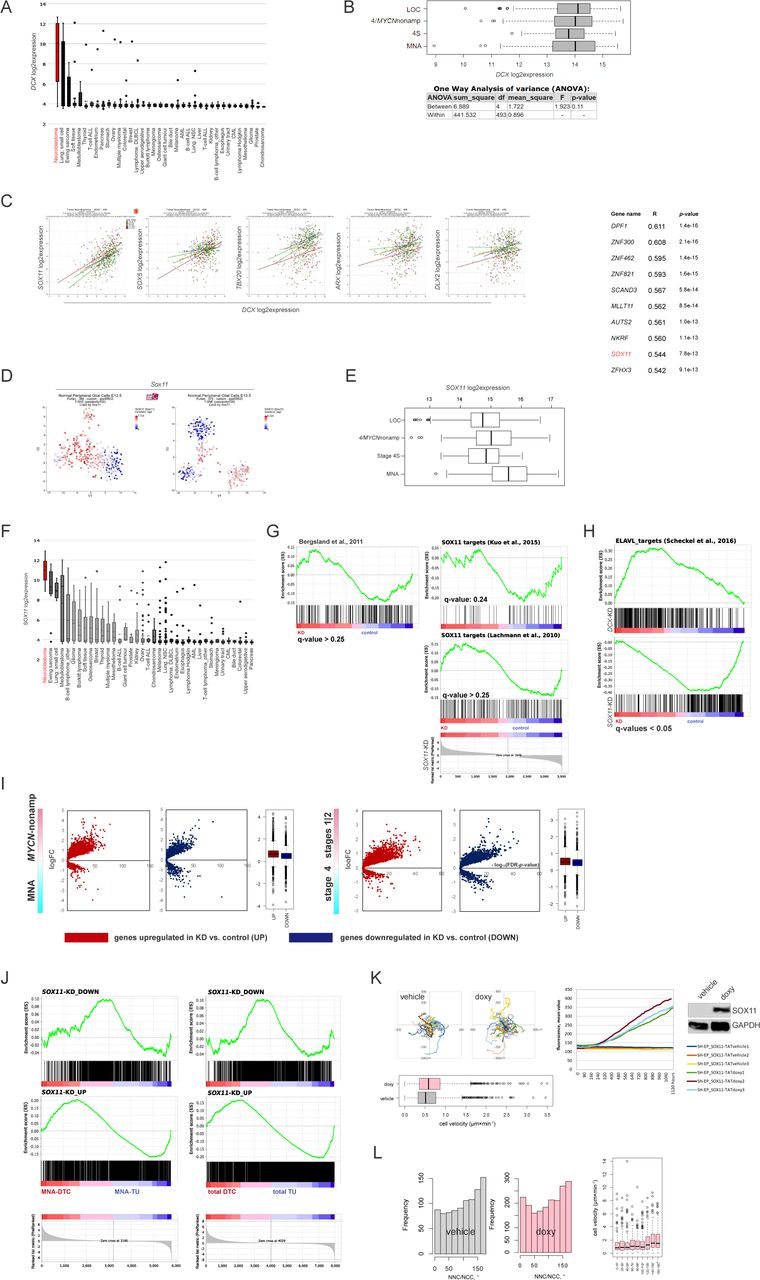
- Figure S3. Modulation of SOX11 levels in ADRN and MES NB cell lines.
(A) Affymetrix DCX mRNA expression analysis in cancer cell lines. (B) Box plots demonstrating DCX expression in primary NB: MYCN-nonamplified (stages 1–3 [localised, LOC], stage 4, stage 4S) and MNA (gse49710) and P-values by one-way ANOVA analysis. (C) Scatter plots (left) showing correlation of expression of DCX mRNA and the transcription factors involved in neuronal migration (gse49710) and Top10 of transcription factors positively correlated with DCX mRNA (right) in stage 4 NB (gse49710). (D) Sox11 expression in t-SNE-resolved E12.5 and E13.5 sympathetic precursors: sympathoblasts, Schwann cell precursors, bridge population and chromaffin cells (Furlan et al, 2017). Population annotation is as described in Fig S1C. (E) Box plot demonstrating SOX11 mRNA expression in primary NB (gse49710): MYCN-nonamplified (LOC, stage 4, and stage 4S) and MNA. (F) Affymetrix SOX11 mRNA expression analysis in various cancer lines. (G) Gene set enrichment analysis plots showing humanized gene list of Sox11 bound genes (Bergsland et al, 2011) and SOX11 targets (Lachmann et al, 2010; Kuo et al, 2015) in SOX11-KD versus control. (H) Gene set enrichment analysis plots showing targets of ELAVL proteins (Scheckel et al, 2016) in SOX11-KD, DCX-KD IMR-32 versus control. (I) Volcano plots showing expression of DEGs in SOX11-KD IMR-32 in MYCN-nonamplified versus MNA and stages 1|2 versus stage 4 tumors. (J) Mapping plots of DEGs in SOX11-KD IMR-32 onto NB disseminated tumor cell transcriptome profiles (Rifatbegovic et al, 2018). (K) Random walk plots in SH-EP_SOX11-TAT (top left) after application of doxycycline (doxy) or vehicle (1 h of pretreatment + 6 h 30 min of tracking, 15-min intervals) and box plots demonstrating cell velocity (bottom left) in vehicle (n = 2,065) and doxy-induced (n = 2,112) SH-EP_SOX11-TAT. P-value: 2.2 × 10⁻¹⁶ (Kruskal-Wallis test). SOX11 overexpression was confirmed by fluorescence monitoring and WB (right, exemplary tracks from three experiments). (L) NNC/NCC angle frequency distribution in concatenated tracks from control (22 cells; 923 timepoints) and doxycycline-induced (106 cells; 1,904 timepoints) SH-EP_SOX11-TAT (left). Box plots showing cell velocities (right) across NNC/NCC angle frequency distribution in SH-EP_SOX11-TAT.
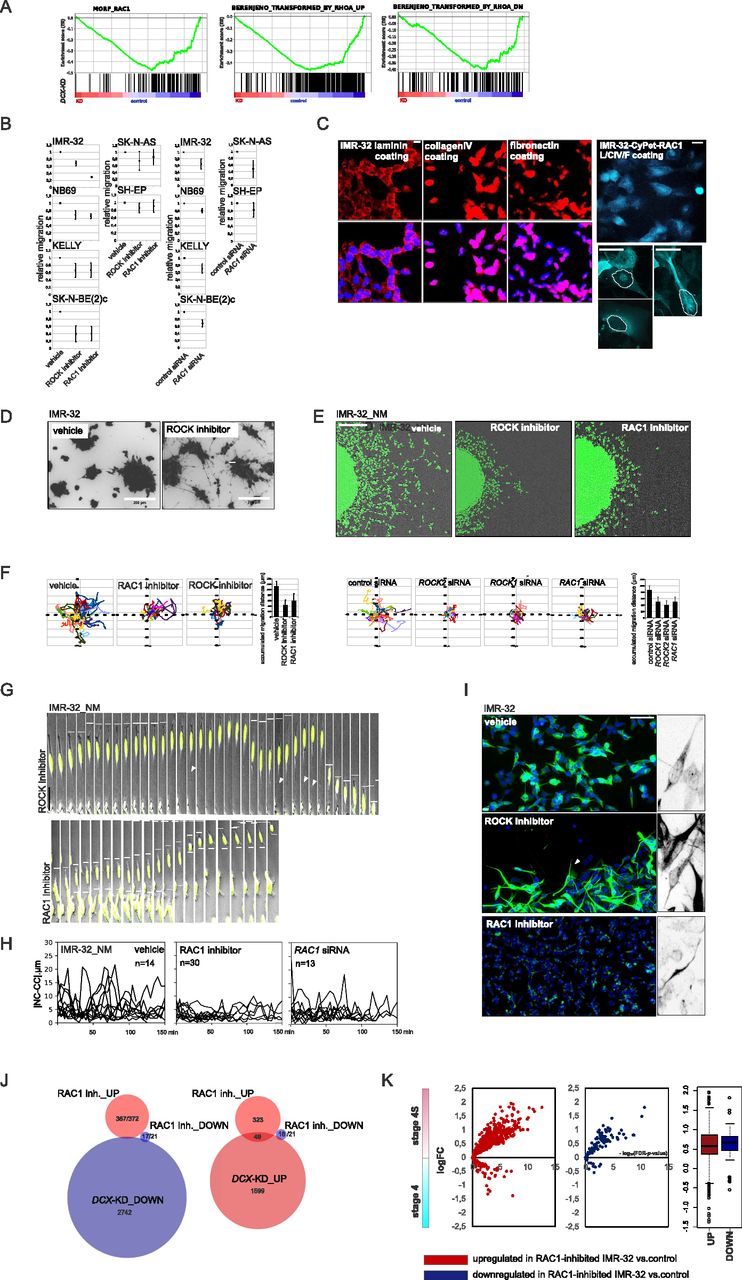
- Figure 4. ROCK and RAC1 inhibition interferes with cell detachment and NUC.
(A) Gene set enrichment analysis plots showing RHOA-related and RAC1-related gene sets in DCX-KD IMR-32 versus control. (B) 2D exclusion assay in NB cell lines after treatment with the RAC1 inhibitor or ROCK inhibitor and after RAC1 RNAi (left). Relative cell migration (right) is quantified by normalization of cell density to vehicle- or control siRNA-treated cells. Mean relative difference values ± SD are presented. (C) RAC1 immunostaining and CyPet-RAC1 subcellular localisation in IMR-32 (L, laminin; CIV, collagen IV; F, fibronectin). Scale bar 20 μm. (D) Images of IMR-32 spheroids stained with Calcein AM after 72 h of treatment with vehicle or ROCK inhibitor in pseudo 3-D. (E) Random walk plots in IMR-32_NM treated with vehicle, RAC1 inhibitor or ROCK inhibitor for 72 h (13 h, 15-min intervals). Scale bar 200 μm. (F) Accumulated migration distances of control, ROCK inhibitor– and RAC1 inhibitor–treated IMR-32_NM cells and after ROCK1, ROCK2, or RAC1 RNAi. Mean migration distances + SD are presented. (G) Time-lapse images of IMR-32_NM after treatment with ROCK inhibitor (left) or RAC1 inhibitor (right). Nuclei and cell leading edges of migrating cells are indicated. Scale bar 20 μm. (H) |NC-CC| plots in control IMR-32_NM and after treatment with the RAC1 inhibitor or RNAi against RAC1. (I) βIII-tubulin immunolabeling in IMR-32 after treatment with vehicle, ROCK- or RAC1 inhibitor. Fork-like structures are showed in grayscale negative field. Scale bar 100 μm. (J) Venn diagrams showing the numbers of genes in DCX-KD ∩ RAC1 inhibitor transcriptomic overlap (P-values ≤ 0.09; |logFC| cutoff [DCX-KD]: 0.3, |logFC| cutoff [RAC1 inhibitor]: 0.2). (K) Volcano plots showing expression of DEGs in RAC1-inhibitor-treated IMR-32 in stage 4S versus 4 tumors.
- Figure S4. Cell analyses in NB cell lines after RAC1 and ROCK inhibition.
(A) Cell viability of NB cell lines treated with various concentrations of RAC1 inhibitor NSC23766 or ROCK inhibitor Y27632. Cell survival was assessed by Alamar Blue assay at 48 and 96 h after treatment. Mean percent values ± SD of vehicle-treated control are reported. (B) Cell viability of NB cell lines treated with ROCK inhibitor Y27632 (5 μM) or RAC1 inhibitor NSC23766 (10 μM) in 2D exclusion assay. Cell survival was assessed by Alamar Blue assay. Mean percent values + SD of vehicle-treated control are reported. (C) Random walk plots and accumulated migration distances of vehicle, RAC1 inhibitor- and ROCK inhibitor-treated NB-S-124 cells (2.5 h; 5-min intervals). (D) Cell viability of NB cell lines transfected with control siRNA or RAC1 siRNA in 2D exclusion assay. Cell survival was assessed by Alamar Blue assay. Mean percent values + SD of control are reported. (E) Representative images of IMR-32 showing filopodia and growth cone-free cell edges (left). Scale bar 20 μm. RAC1 activity in IMR-32, SK-N-BE(2)c and SH-EP (right). The cell lysates were incubated with PAK-PBD beads and the bound RAC1 was analysed by Western blotting. (F) Images of SK-N-BE(2)c spheroids stained with Calcein AM after 72 h of treatment with vehicle or ROCK inhibitor in pseudo 3-D. Cell cycle analysis by flow cytometry in SK-N-BE(2)c and SK-N-BE(2)c after the treatment with ROCK inhibitor. Cell cycle distribution of VioBlue Dye-labelled cells was analysed by flow cytometric analysis. Percentage of cells in each phase of the cell cycle and representative cell cycle images are shown. Mean values ± SD are presented. (G) qRT-PCR analysis of RAC1-, ROCK1- and ROCK2-KD in IMR-32 cells. (H) Tracings of IMR-32_NM nuclei after treatment with vehicle and ROCK inhibitor. (I) Volcano plots showing expression of DEGs in RAC1-inhibitor-treated IMR-32 in MYCN-nonamplified versus MNA and stages 1|2 versus stage 4 tumors.
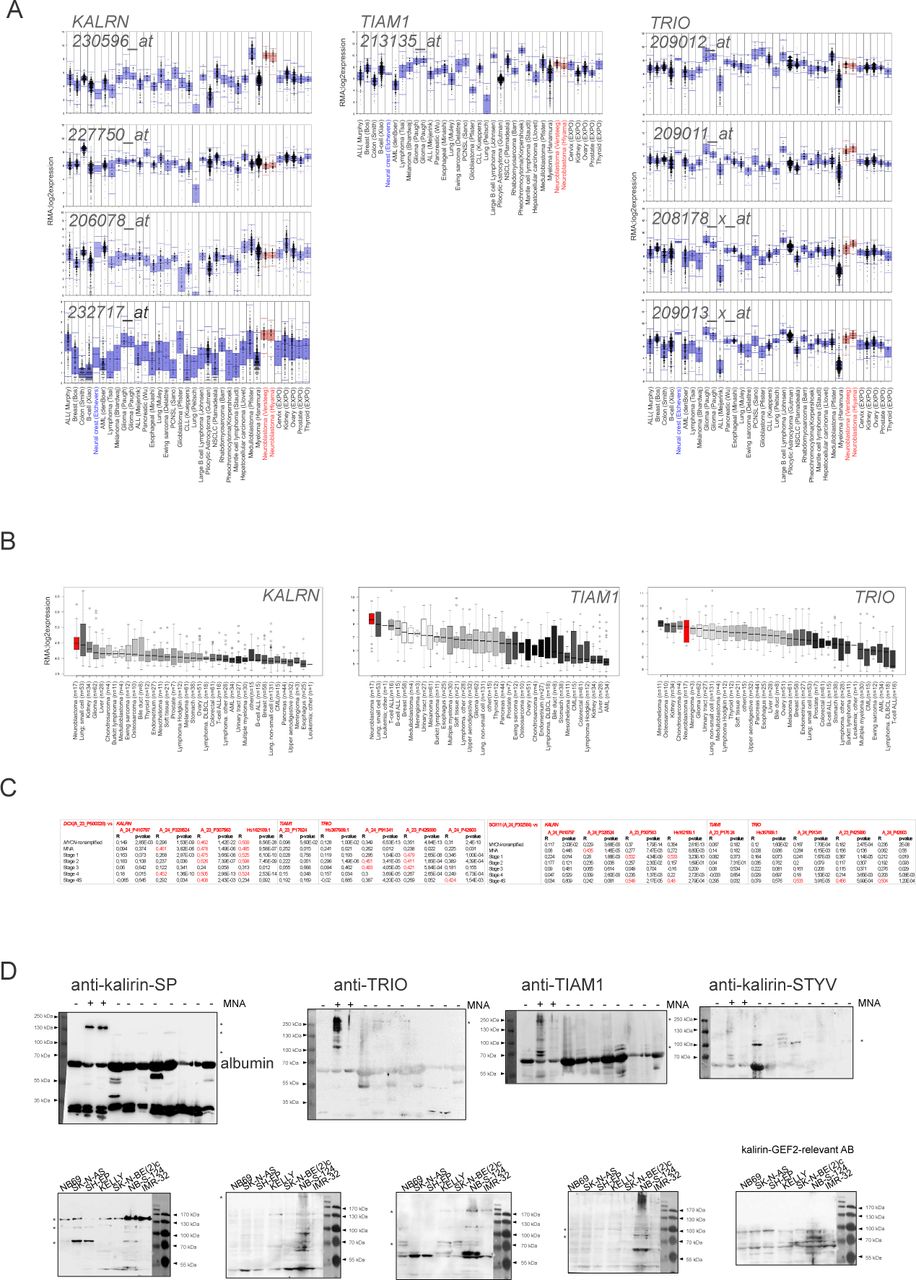
- Figure S5. Expression of RAC1-GEF-encoding KALRN, TIAM1, and TRIO in NB.
(A) Affymetrix mRNA expression analysis (probe sets: KALRN, 230596, 206078, 227750, 232717; TIAM1, 213135; TRIO, 209011, 209012, 208178, and 209013) in two series of NB tumor samples (red) and series of various other tumor types (blue). (B) Expression of KALRN, TIAM1, and TRIO in NB cell lines (red) and series of different cancer cell lines (black). (C) Graphs showing correlation of expression of DCX (left) or SOX11 (right) and KALRN, TIAM1, or TRIO in primary NB (gse49710). (D) WB analysis of kalirin expression with kalirin-SP, TRIO, TIAM1, kalirin-STYV, and anti-kalirin-PH-2 in NB cell lines and primary tumors. Asterisks indicate previously annotated isoforms.
- Figure 5. Kalirin is a NSC23766-sensitive RAC1-GEF in ADRN-type cells.
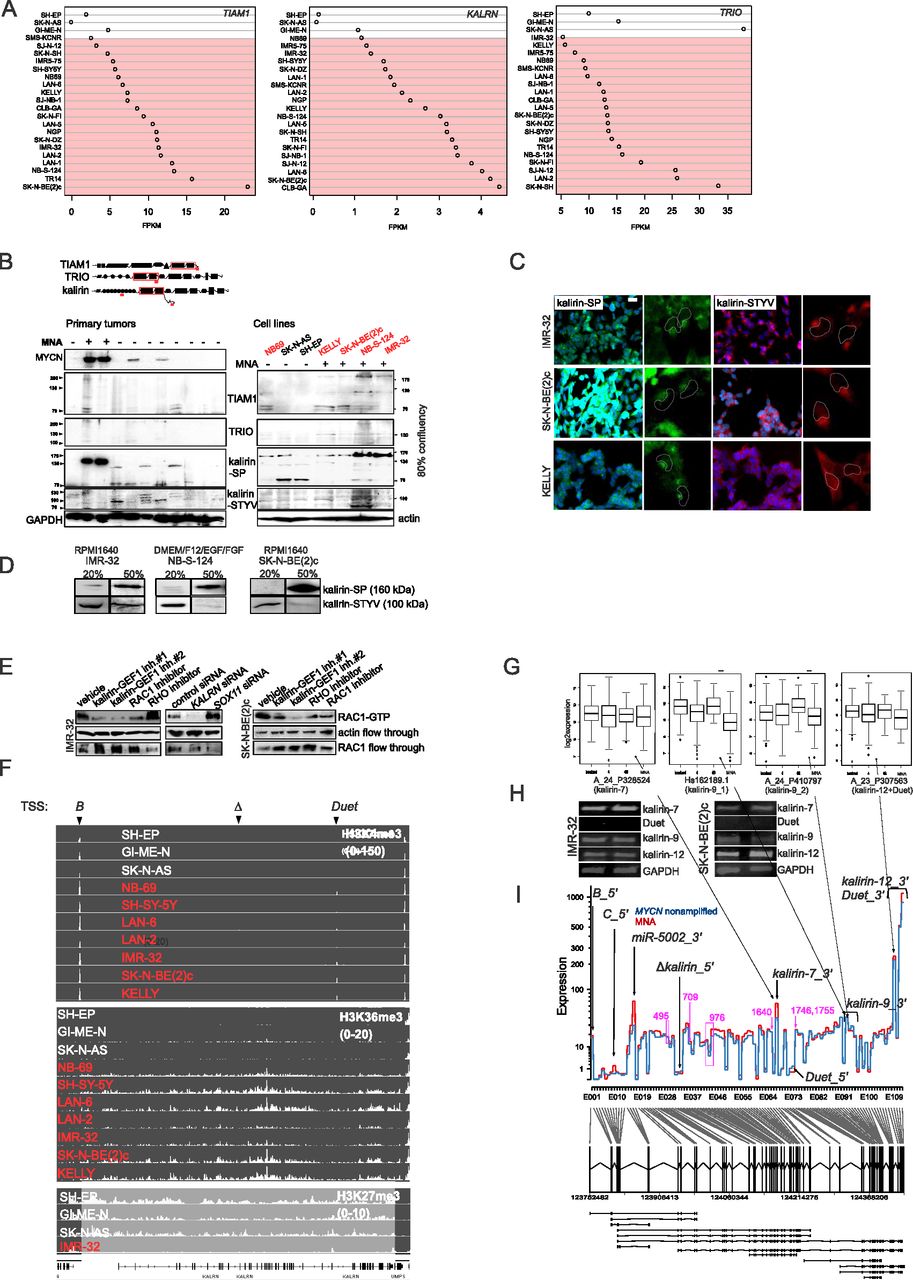
(A) TIAM1, KALRN, and TRIO mRNA expression in MES and ADRN (marked in red color) cell lines. (B) WB analysis of TIAM1, TRIO and kalirin in a panel of primary NBs, NB cell lines. Location of antigens and RAC1-GEF domains in TIAM1, TRIO, and kalirin proteins (top) is marked by red lines and boxes, respectively. MNA status in primary tumors and cell lines is indicated. The names of ADRN cell lines are marked in red color. (C) IMR-32, SK-N-BE(2)c, and KELLY were stained with anti-STYV and anti–kalirin–SP antibodies and visualized with Cy3- or Alexa 488–conjugated secondary antibodies. Nuclei are indicated by the dashed lines. (D) WB analysis of kalirin–SP and kalirin–STYV in MNA cell lines harvested at 20% and 50% confluency. (E) RAC1 activity in IMR-32 and SK-N-BE(2)c cell treated with kalirin–GEF1 inhibitor#1 (10 μM), kalirin–GEF1 inhibitor#2 (5 μM), RHOA inhibitor (3 μM), RAC1 inhibitor (10 μM), or after SOX11 and KALRN RNAi. The cell lysates were incubated with RBD–Rhotekin or PAK-PBD beads and the bound activated RHOA and RAC1 was analysed by Western blotting. Flow through fraction was analysed for RHOA and RAC1 expression as loading control. (F) H3K4me3, H3K36me3, and H3K27me3 ChIP-seq showing binding events at KALRN promoter and gene body in NB cell lines. ADRN cell lines are marked in red color. Arrows indicate transcription start sites. (G) Expression of kalirin isoforms in primary NBs. (H) RT-PCR for 3′-most exons of kalirin-7, kalirin-12, Duet and kalirin-9 in IMR-32 and SK-N-BE(2)c. (I) KALRN gene profile obtained from RNA-seq data analysis of 27 primary NBs. 5′-most exons, 3′-most exons of the isoforms are indicated, exons encoding known and high score calpain cleavage sites (predicted for the kalirin-12 [uniprot: O60229-1]) are marked in purple color.
- Figure S6. Expression and localisation of kalirin, TRIO, and TIAM1 proteins in NB cells.
(A) Immunolabelling of TRIO and TIAM1 in IMR-32, SK-N-BE(2)c, and KELLY grown on (collagenIV/laminin/fibronectin)-coated plastic. Scale bar 20 μm. (B) Subcellular localisation of kalirin-STYV, Golgi apparatus and γ-tubulin (left) in IMR-32 cells. Scale bar 10 μm. For superimposed images (right), centrosome-specific (centrin-2), and Golgi apparatus signals were colored green. Scale bar 5 μm. (C) Heterogeneity of kalirin-SP and kalirin-STYV subcellular localisation in IMR-32 and SK-N-BE(2)c. Scale bar 20 μm. (D) WB analysis of TIAM1, TRIO, and kalirin in IMR-32 cells after 48 h of SOX11 RNAi. (E) Migration fronts of NB-S-124 stained by kalirin-STYV and kalirin-SP. Scale bar 10 μm.
- Figure S7. Modulation of KALRN levels in ADRN NB with RNAi and RA-induced differentiation.
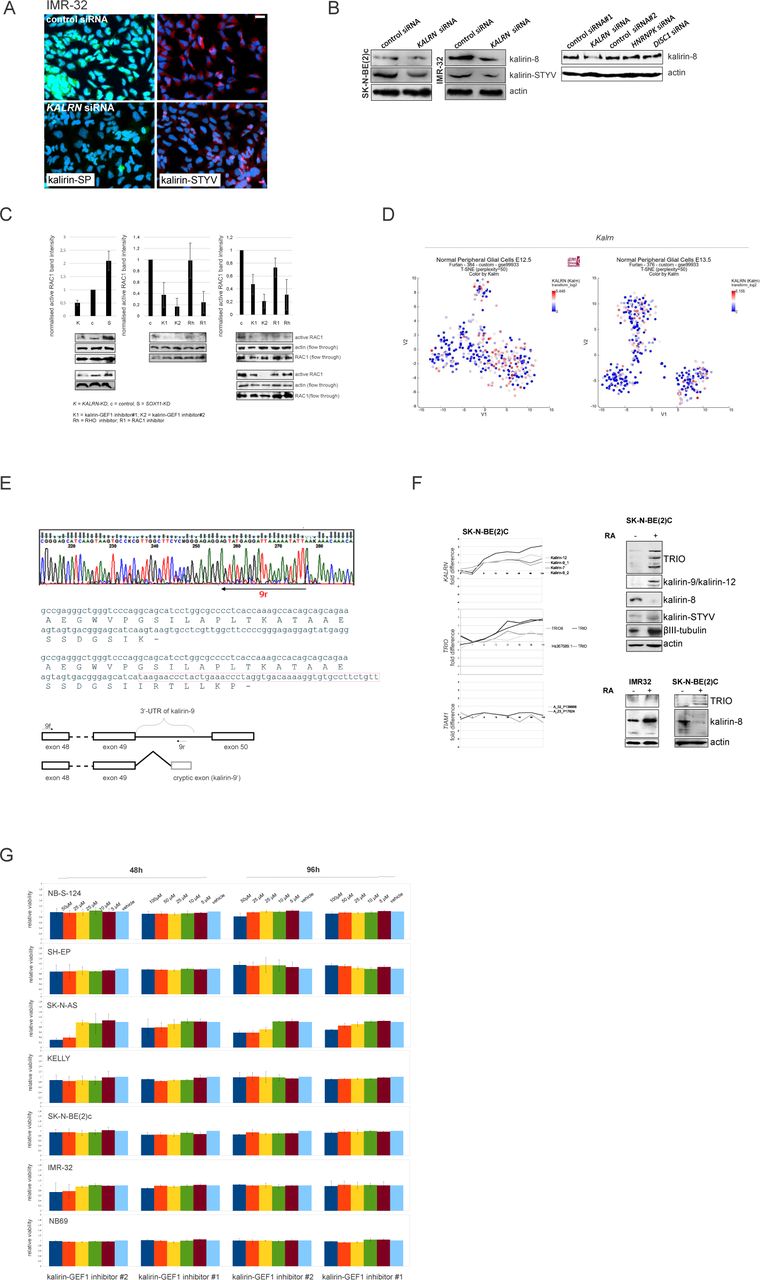
(A) Immunolabelling of kalirin in IMR-32 after KALRN RNAi. Scale bar 20 μm. (B) Western blot analysis of kalirin-8 and kalirin-STYV levels in IMR-32 and SK-N-BE(2)c after KALRN RNAi and kalirin-8 levels in IMR32 after KALRN RNAi or additional negative control siRNAs: control siRNA #2, HNRNPK siRNA, and DISC1 siRNA. (C) RAC1 activity in IMR-32 and SK-N-BE(2)c cell treated with kalirin-GEF1 inhibitor#1 (10 μM), kalirin-GEF1 inhibitor#2 (5 μM), RHOA inhibitor (3 μM), RAC1 inhibitor (10 μM), or after SOX11 and KALRN RNAi. (D) Kalrn expression in t-SNE-resolved E12.5 and E13.5 sympathetic precursors: sympathoblasts, Schwann cell precursors, bridge population and chromaffin cells (Furlan et al, 2017). (E) Sequencing electrophoregrams showing 3′-UTR of kalirin-9 isoform (top) and the exon scheme based on the results of sequencing (bottom). Location of stop codon is marked with “-.” (F) KALRN, TRIO, and TIAM expression in SK-N-BE(2)c (left) after RA (10 μM) treatment. x-axis indicate timepoints in hours. Western Blot analysis of kalirin, TRIO, and βIII-tubulin in SK-N-BE2c after 72 h of RA-treatment (top right) and of TRIO and kalirin-8 in IMR-32 and SK-N-BE(2)c after 72 h of RA treatment (bottom right). (G) Cell viability of NB cell lines treated with vehicle, kalirin-GEF1 inhibitor#2, or kalirin-GEF1 inhibitor#1. Values are reported as mean percent ± SD of vehicle-treated control.
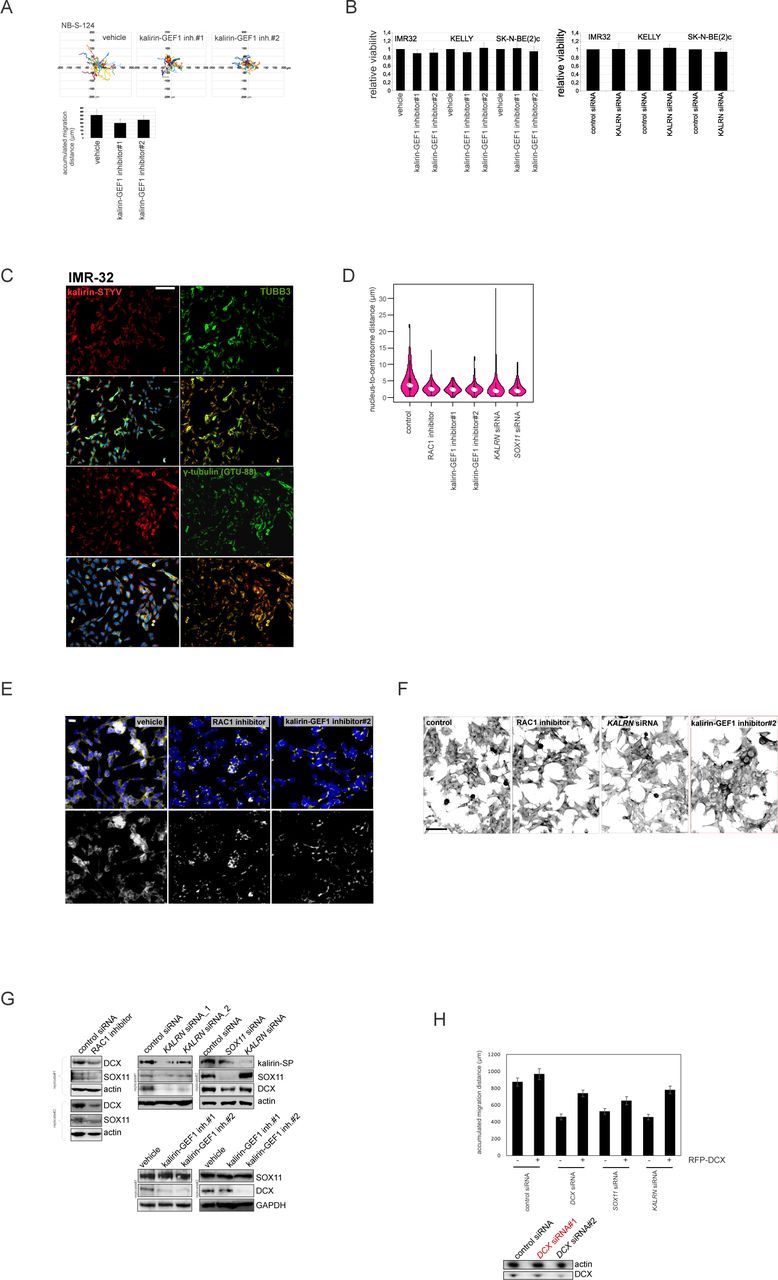
- Figure S8 Analysis of NUC defects in kalirin-GEF1-inhibited cells.
. (A) Random walk plots and accumulated migration distances of vehicle- and kalirin–GEF1 inhibitor–treated NB-S-124 cells (13 h, 15-min intervals). Mean values + SD are presented. (B) Cell viability of NB cell lines treated with vehicle, kalirin–GEF1 inhibitor#2 (5 μM) or kalirin–GEF1 inhibitor#1 (10 μM) in 2D exclusion assay. Values are reported as mean percent + SD of vehicle-treated control. (C) Kalirin–STYV, βIII-tubulin, and γ-tubulin co-localisation in IMR-32. (D) Violin plots showing the nucleus-to-centrosome distance in IMR-32 cells treated with kalirin–GEF1 inhibitor#1, kalirin–GEF1 inhibitor#2, or RAC1 inhibitor and in KALRN-KD or SOX11-KD IMR-32 cells. P-values: RAC1 inh: 0.0001028, kalirin–GEF1 inhibitor#1: 1.933 × 10⁻⁶, kalirin-GEF1 inhibitor#2: 1.191 × 10⁻⁵, KALRN siRNA: 0.0001527, SOX11 siRNA; 2.388 × 10⁻⁵ (Welch t test). (E) γ-tubulin distribution in control, RAC1 inhibitor–treated and kalirin–GEF1 inhibitor#2–treated IMR-32 cells. Scale bar 20 μm. (F) Representative negative images of IMR-32 in control cells and after treatment with RAC1 inhibitor, kalirin–GEF1 inhibitor#2 or after KALRN-KD stained with phalloidin-Alexa Fluor-555. Scale bar 200 μm. (G) WB for DCX in RAC1-inhibited and kalirin-GEF1-suppressed IMR-32. (H) Cell migration (16 h, 15-min intervals) in expressing DCX-RFP KALRN-KD, SOX11-KD and DCX-KD (Ambion siRNA:145587) IMR-32 cells (72 h of RNAi). Values are reported as mean + SE of control. P-values: (DCX-RFP [−] versus DCX-RFP [+]): control siRNA: n.s., DCX siRNA: 9.906 × 10⁻⁷; SOX11 siRNA: 0.1; KALRN siRNA: 3.737 × 10⁻⁷ (Welch t test). The efficiency of DCX-KD was determined by WB, and the selected siRNA is marked in red.
- Figure 6. Kalirin inhibition hinders migration in MNA cells and perturbs cell polarisation and MT structure.
(A) Relative migration in 2D exclusion assay after treatment with vehicle, kalirin–GEF1 inhibitor#1 (10 μM) and kalirin–GEF1 inhibitor#2 (5 μM) or after KALRN RNAi. Relative cell migration is quantified via normalization of cell density to vehicle- or siRNA-treated control. Graphs represent mean relative difference in migration + SD. (B) Random walk plots and accumulated migration distances in control IMR-32_NM cell after treatment with kalirin–GEF1 inhibitor#1 or kalirin–GEF1 inhibitor#2, and after 48 h of KALRN RNAi (13 and 10 h, 15-min intervals). Mean values + SD are presented. (C) Time-lapse images of IMR-32_NM after kalirin–GEF1 inhibitor#2 treatment. Nuclei and leading processes are indicated. Scale bar 20 μm. (D) |NC-CC| plots in control IMR-32_NM and after treatment with kalirin–GEF1 inhibitor#2, kalirin–GEF1 inhibitor#1 or KALRN siRNA. (E) The percentage of centrosomes located distally in control, kalirin, or RAC1-suppressed IMR-32 cells. Mean values + SD are presented. (F) DAPI staining showing changes in the nucleus shape in IMR-32 after kalirin–GEF1 inhibition. (G) Box plots demonstrating nuclear roundness in IMR-32 cells treated with RAC1- or kalirin–GEF1 inhibitor. Data represent three independent experiments (819, 1,008, 375, and 772 cells). (H) βIII-tubulin staining in control IMR-32 cells and after treatment with kalirin–GEF1 inhibitor#2 or KALRN RNAi. The representative fields were photographed. Scale bar 100 μm. (I) NNC/NCC angle frequency distribution (left) and NUC and noise-corrected NC-CC distances in 0–40° and 140–180° signatures in concatenated tracks from control (25 cells and 866 cells), RAC1-inhibited (30 cells, 563 timepoints), kalirin–GEF1–inhibited (25 cells and 606 timepoints) and KALRN siRNA treated (30 cells and 860 timepoints) IMR-32_NM (right). (J) Correlation plots between cell velocity and NUC footprint in control IMR-32_NM and after treatment with RAC1 inhibitor, kalirin–GEF1 inhibitor#1, kalirin–GEF1 inhibitor#2, or KALRN siRNA. (K) Phase contrast images, random walk plots, and accumulated migration distances of randomly migrating cells treated with vehicle, RAC1 inhibitor (10 μM), kalirin–GEF1 inhibitor#1 (10 μM) or kalirin–GEF1 inhibitor#2 (5 μM) for 48 h in pseudo-3-D (21 h, 90-min intervals). Mean values + SD are presented.
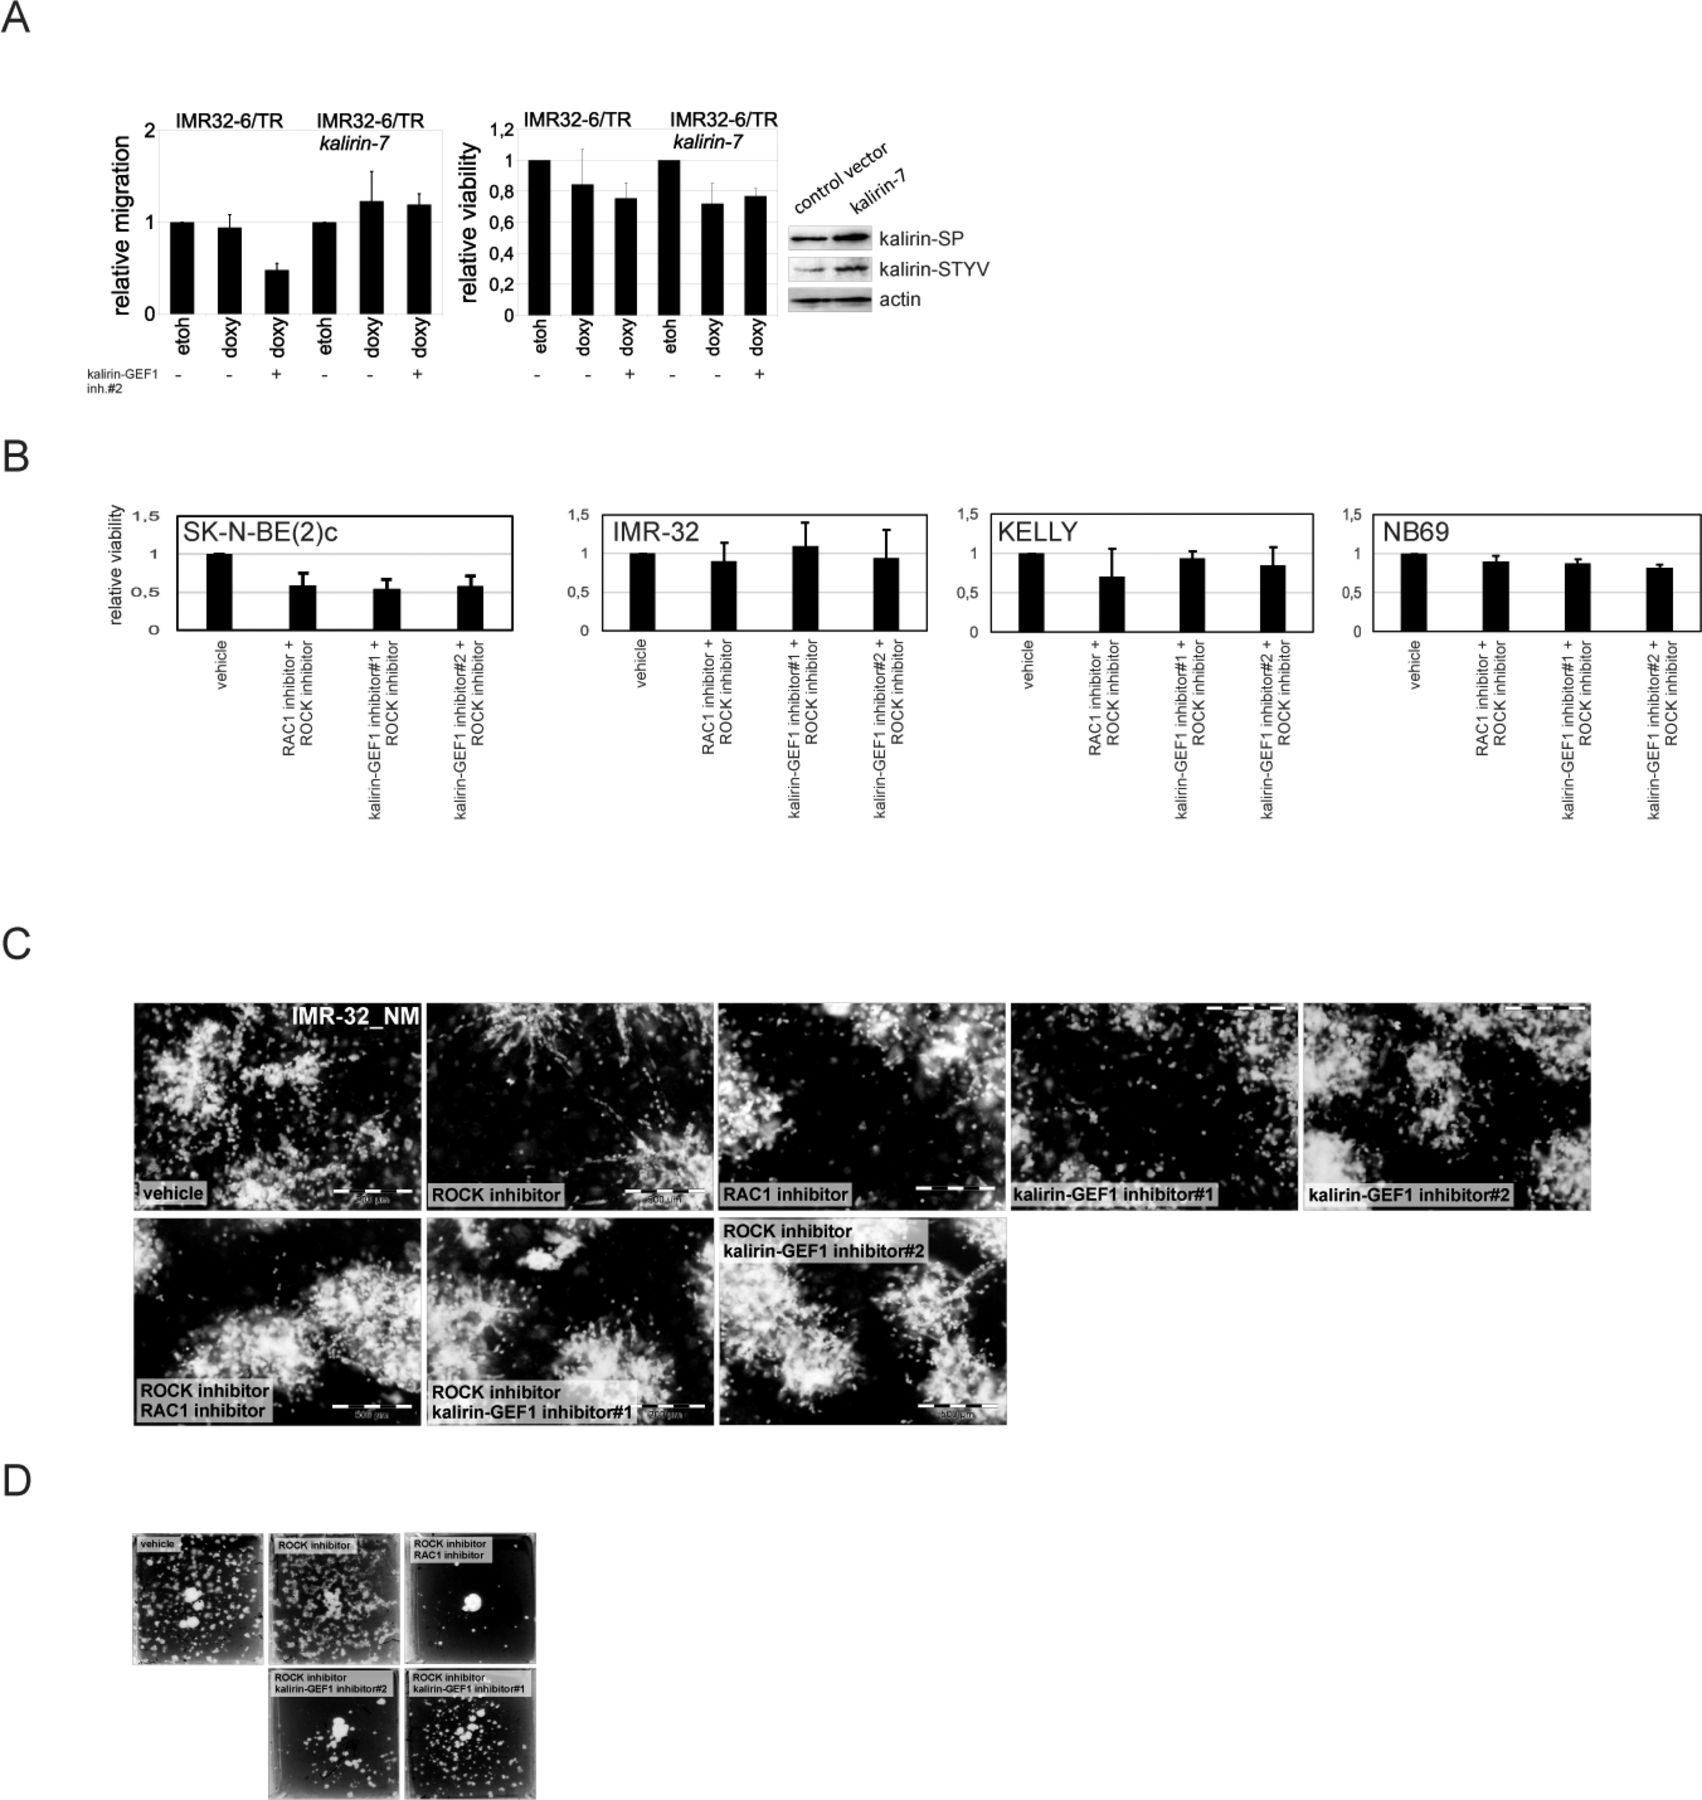
- Figure S9. Migration inhibition after double treatments with ROCK- and kalirin-GEF1 inhibitors.
(A) 2D exclusion assay in IMR-32-6/TR and IMR-32-6/TR-kalirin-7 (left) after treatment with kalirin–GEF1 inhibitor#2 (5 μM). Relative cell migration is quantified by normalization of cell density to vehicle-treated control (100%). Graphs represent the mean percent migration + SD from three independent experiments. Cell viability of IMR-32-6/TR and IMR-32-6/TR-kalirin-7 (right) treated with vehicle or kalirin–GEF1 inhibitor#2 (5 μM) in 2D exclusion assay. Values are reported as mean percent + SD of vehicle-treated control. (B) Cell viability of IMR-32, SK-N-BE(2)c, NB69, and KELLY treated with vehicle, kalirin–GEF1 inhibitor#1 (5 μM), kalirin–GEF1 inhibitor#2 or RAC1 inhibitor in combination with ROCK inhibitor (5 μM). Values are reported as mean percent + SD of vehicle-treated control. (C) IMR-32_NM spheroids treated with vehicle, ROCK inhibitor (5 μM), RAC1 inhibitor (5 μM), kalirin–GEF1 inhibitor#1 (10 μM), or kalirin–GEF1 inhibitor#2 (2.5 μM) for 48 h or treated with ROCK inhibitor (72 h) before addition of RAC1- or kalirin–GEF1 inhibitors (48 h) and stained with Calcein AM in pseudo-3-D. Scale bar 500 μm. (D) IMR-32 spheroids treated with ROCK inhibitor (5 μM) alone and in combination with RAC1 inhibitor (5 μM), kalirin–GEF1 inhibitor#1 (5 μM), or kalirin–GEF1 inhibitor#2 (2.5 μM) for 96 h in pseudo-3-D and stained with crystal violet.
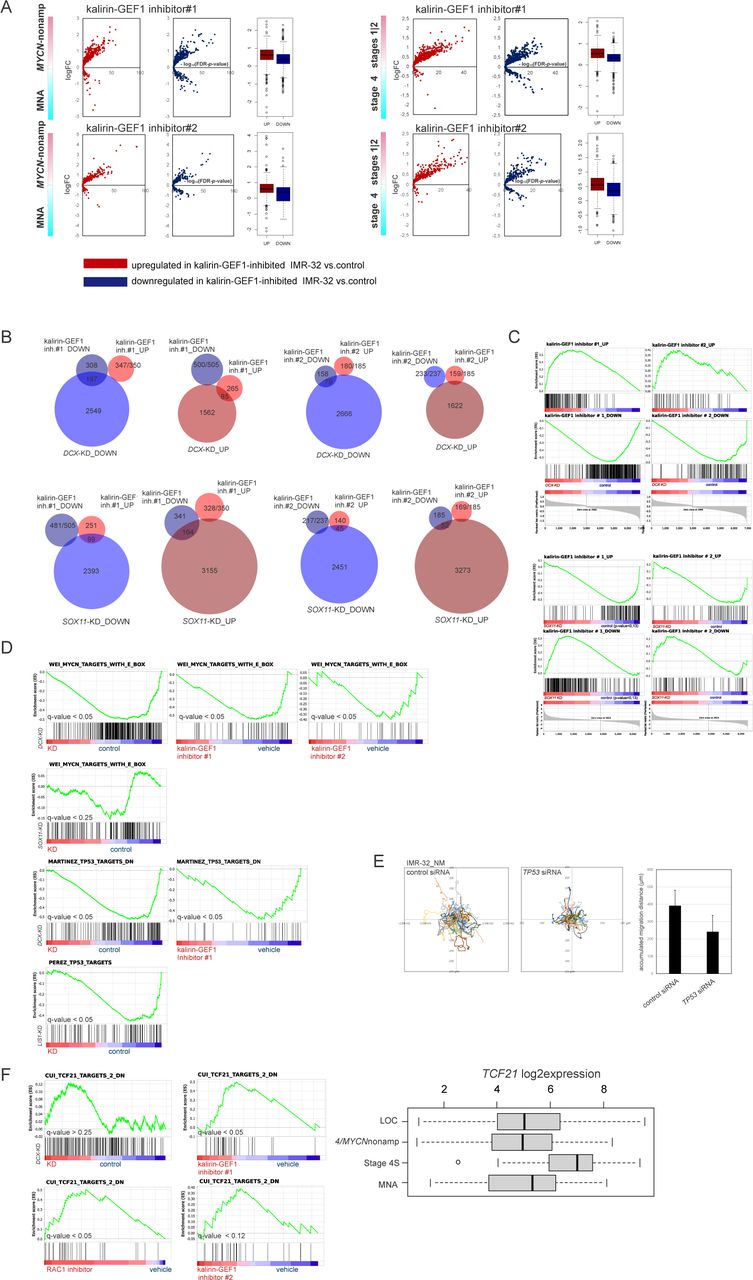
- Figure S10. Analysis of DEGs in kalirin-GEF1-inhibited IMR-32.
(A) Volcano plots showing expression of DEGs in kalirin–GEF1–inhibited IMR-32 versus control IMR-32 in MYCN-nonamplified versus MNA and stages 1|2 versus 4 tumors. (B) Venn diagrams showing the numbers of genes in transcriptomic overlap between kalirin–GEF1 inhibition and DCX-KD or SOX11-KD in IMR-32. (C) Enrichment plots showing positions of DCX-KD and SOX11-KD transcriptomic overlaps in kalirin-GEF1-inhibited IMR32 versus control IMR-32. (D) Enrichment plots showing TP53 and MYC(N) targets in DCX-KD, RAC1-inhibited/kalirin-GEF1 LIS1-KD, SOX11-KD, and IMR-32 versus control. q-values are listed. (E) Random walk plots and accumulated migration distances in control IMR-32_NM cell after 48 h of TP53 RNAi (4 h, 5-min intervals). Mean values + SD are presented. P-value: 0.003 (Welch t test). (F) Enrichment plots showing “CUI_TCF21_TARGETS_DN“ gene set (left) in DCX-KD, RAC1-, and kalirin–GEF1–inhibited cells and box plot demonstrating TCF21 expression in primary NB tumors (right).
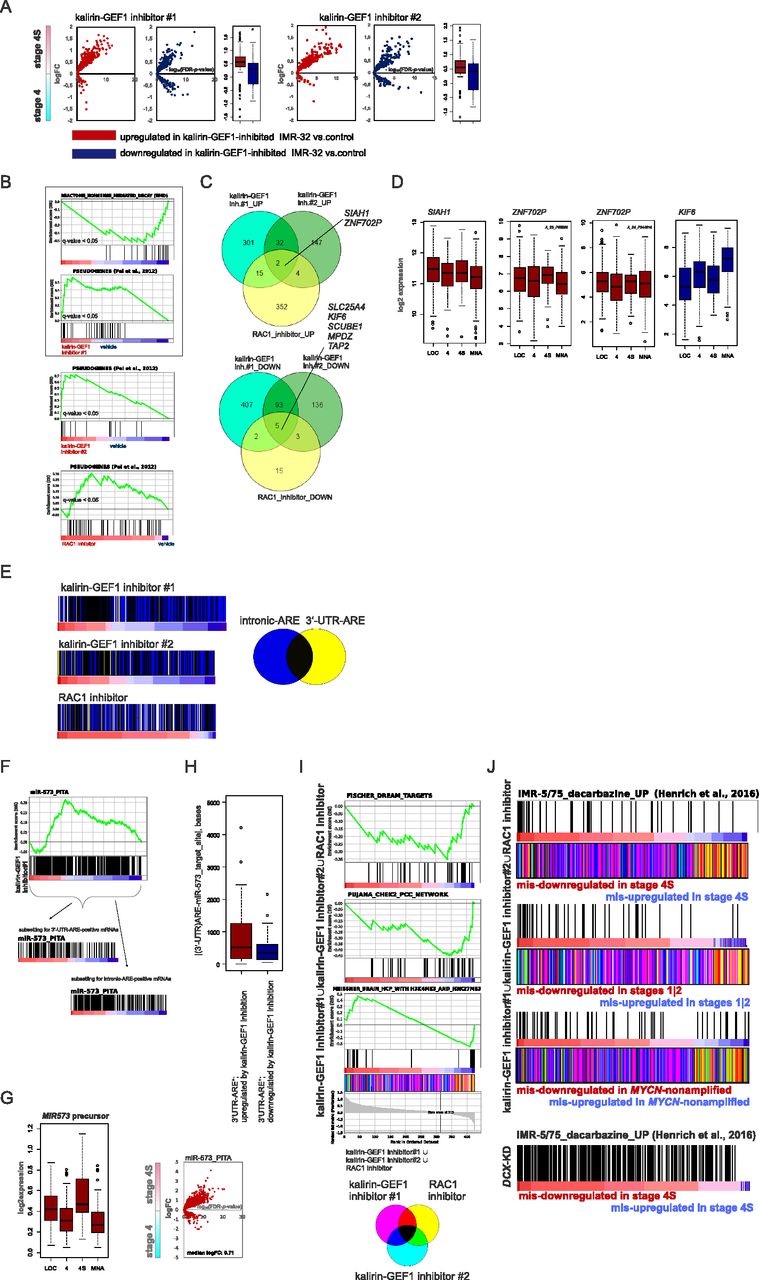
- Figure 7. Inhibition of kalirin-GEF1 engages pathways of post-transcriptional gene regulation.
(A) Volcano plots showing expression of DEGs in kalirin–GEF1–inhibited cells versus control in stage 4S versus 4 tumors (gse49710). (B) Gene set enrichment analysis plots showing genes sets with similar pattern of regulation in kalirin–GEF1–inhibited and DCX-KD IMR-32. (C) Venn diagram showing the number of genes in transcriptomic overlap between DEGs in RAC1 inhibitor-, kalirin–GEF1 inhibitor#1– and kalirin–GEF1 inhibitor#2–treated IMR-32 versus control. (D) Box plots demonstrating ZNF702P, SIAH1, and KIF6 expression in primary NB tumors. (E) Color-coded scheme showing gene overlaps between 3′-UTR- and intronic-AU–rich element (ARE)-containing genes (Bakheet et al, 2018) in the ranked lists of DEGs in RAC1- and kalirin–GEF1–inhibited IMR-32 versus control IMR-32. (F) Enrichment plots for miR-573 targets (“miR-573_PITA”) based on PITA algorithm (Kertesz et al, 2007) in IMR-32–treated with kalirin–GEF1 inhibitor#1 versus control (top). Diagrams demonstrating miR-573 targets in the ranked gene subsets of 3′-UTR-ARE and intronic ARE containing genes from IMR-32–treated with kalirin–GEF1 inhibitor#1 versus control (bottom). (G) Box plot demonstrating MIR573 expression in primary NB tumors (gse62564) (left) and volcano plot showing expression of predicted miR-573 targets (right) in stage 4S versus 4 tumors. (H) Box plot showing distances between AREs and miR-573–binding sites in 3′-UTRs of DEGs in kalirin–GEF1–inhibited cells. P-value: 0.005 (two-sample Kolmogorov–Smirnov test). (I) Gene set enrichment analysis plots for the indicated gene sets (top) in the combined list of genes mis-regulated (based on their mis-expression in stage 4S versus stage 4 tumors [P-values by two-way t test ≤0.05; no logFC cutoff]) in RAC1- and kalirin–GEF1–inhibited IMR-32. Color-coded scheme showing gene overlaps (bottom) between mis-expressed genes extracted from profiles of kalirin–GEF1– and RAC1-inhibited cells and ranked according to their expression in stage 4S versus stage 4. (J) Diagrams showing positions of the genes up-regulated by dacarbazine in ADRN-type cell lines (Henrich et al, 2016) in the combined lists of genes mis-regulated in RAC1– and kalirin–GEF1–inhibited (top) and DCX-KD IMR-32 (bottom).
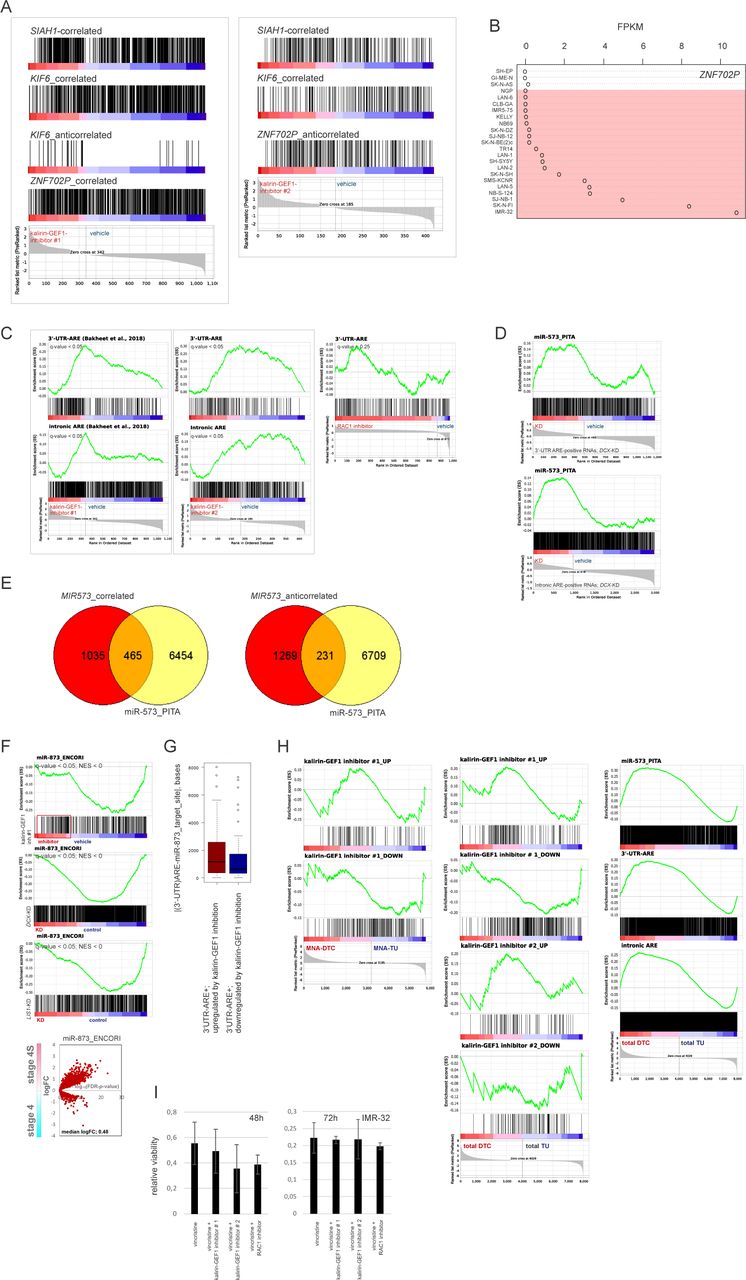
- Figure S11. Analysis of AU-rich element (ARE)–containing genes and miRNA targets in kalirin-GEF1– and RAC1-inhibited IMR-32.
(A) Diagrams showing positions of genes correlated positively or negatively with ZNF702P, SIAH1 and KIF6 expression in kalirin–GEF1–inhibited IMR-32 versus control IMR-32. (B) ZNF702P mRNA expression in MES and ADRN (marked in red) cell lines. (C) Enrichment plots for ARE-containing genes (Bakheet et al, 2018) in kalirin-GEF1- and RAC1-inhibited IMR-32 versus control IMR-32 (q-values are listed). (D) Enrichment plots for miR-573 targets (Kertesz et al, 2007) in the ranked gene subsets of 3′-UTR-ARE and intronic ARE containing genes from DCX-KD IMR-32 versus control IMR-32 (q-values are listed). (E) Venn diagrams showing the number of genes potentially targeted by miR-573 (Kertesz et al, 2007) in the subsets of genes correlated positively (“correlated”) and negatively (“anticorrelated”) with the expression of MIR573 in primary NB (gse62564). (F) Enrichment plots for the genes targeted by miR-873 (Li et al, 2014) in kalirin-GEF1-inhibitor#1-treated, DCX-KD and LIS1-KD IMR-32 versus control (q-values are listed) (top) and volcano plot showing expression of miR-873 targets (bottom) in stage 4S versus 4 tumors. (G) Box plots showing distances between AREs and miR-873 target sites in 3-UTRs of DEGs in kalirin–GEF1–inhibited cells. P-value: 0.04 (two-sample Kolmogorov–Smirnov test). (H) Mapping of DEGs in kalirin–GEF1–inhibitor#1- and kalirin–GEF1–inhibitor#2-treated IMR-32 (left) and miR-573 targets and ARE-containing genes (right) onto NB_disseminated tumor cell transcriptomic profiles. (I) Cell viability in RAC1-inhibited and kalirin–GEF1–inhibited IMR-32 treated with vincristine. Mean relative viabilities + SD are presented.


Supplementary Materials
- Video 1
IMR-32_NM and SHEP_NM in 2D assay.Download video
- Video 2
IMR-32, IMR-32_NM, NB69, NB-S-124, KELLY, and SK-N-BE(2)c in pseudo 3-D assay.Download video
- Video 3
IMR-32_NM treated with colcemid and cytochalasin B.Download video
- Video 4
IMR-32 treated with control siRNA, DCX siRNA, or SOX11 siRNA at 48 and 72 h after transfection (movie start).Download video
- Video 5
IMR-32_NM treated with vehicle (top left), ROCK inhibitor (top middle), RAC1 inhibitor (top right), RAC1 siRNA (bottom left), kalirin-GEF1 inhibitor#1 (bottom middle), or kalirin-GEF1 inhibitor#2 (bottom right).Download video
- Video 6
Migration front of IMR-32_NM spheroid treated with ROCK inhibitor.Download video
- Video 7
IMR-32_NM treated with RAC1 inhibitor, kalirin–GEF1 inhibitor#2–treated or KALRN siRNA, KALRN siRNA-treated IMR-32_NM.Download video
- Video 8
IMR-32_NM treated with TP53 siRNA.Download video


In this Issue
Subjects
Related Articles
Cited By...
- No citing articles found.