


Article Figures & Data
Figures
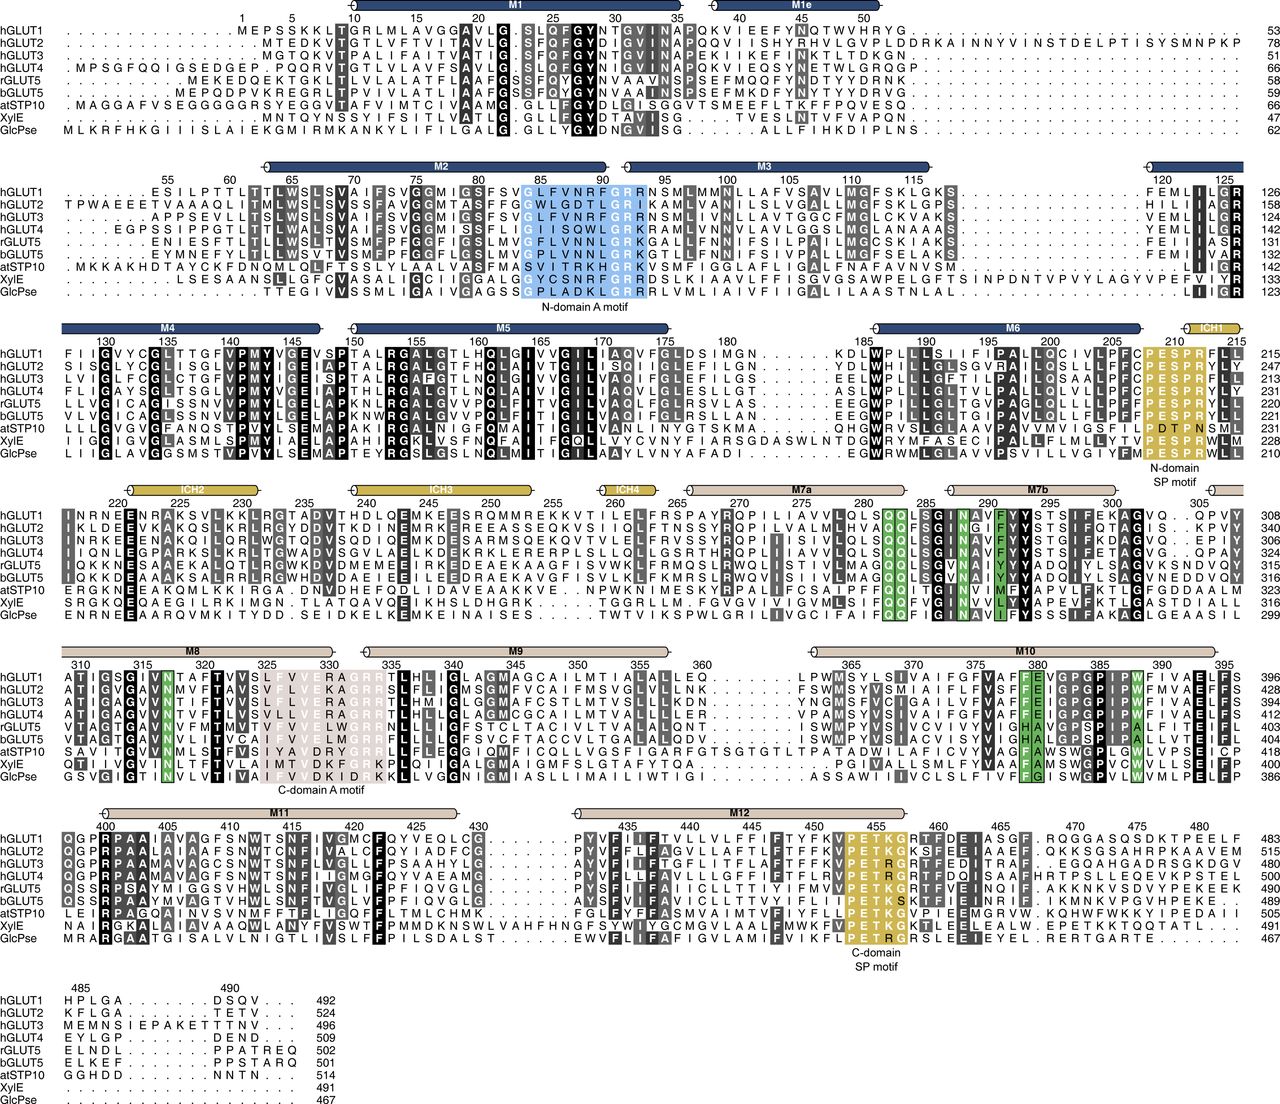
- Figure S1. Multiple sequence alignment between human GLUT1 and other structurally characterized members of the Sugar Porter family.
Alignment between human GLUT1 (UniProt P11166), GLUT2 (UniProt P11168), GLUT3 (UniProt P11169), GLUT4 (UniProt P14672), rGLUT5 (UniProt P43427), bGLUT5 (UniProt P58353), atSTP10 (UniProt Q9LT15), XylE (UniProt P0AGF4), and GlcPse (UniProt A0A0H2VG78). Conserved residues are highlighted with gray-scale. Alpha helices as found in GLUT1 are represented above the sequence as colored tubes. Residues highlighted in blue and brown are the N-domain and C-domain A motifs, respectively. The Sugar Porter motifs in both domains are highlighted in yellow. In green are residues that create the central substrate binding-site, perfectly conserved between GLUT1-4.
- Figure 1. Comparison between GLUT1 and GLUT3.
(A) Schematic model for transport by GLUTs, alternating between two major conformations with the substrate-binding site exposed to the inside and outside of the cell. Transition between these conformations leads to sugar transport across the membrane following the substrate concentration gradient. (B) Uptake of 2-DG into GLUT1-injected Xenopus oocytes (circle), GLUT3-injected oocytes (squares) or water-injected oocytes (open triangles) at an initial outside concentration of 5 mM 2-DG. For both proteins, 2-DG uptake was linear in the range of 90 min. Data for all assays are mean ± SD of three or more replicate experiments. (C) Determination of the kinetic parameters for the transport of 2-DG of GLUT1. The data were fitted using the Michaelis–Menten non-linear fit, yielding a Km = 9.5 ± 1.0 mM and Vmax = 5,988 ± 226 pmol/oocyte/30 min. Sugar uptake was inhibited in GLUT1-injected oocytes exposed to cytochalasin B. (D) Determination of the kinetic parameters for the transport of 2-DG of GLUT3. The data were fitted using the Michaelis–Menten non-linear fit, yielding a Km = 2.6 ± 0.4 mM and Vmax = 2,731 ± 94 pmol/oocyte/30 min. Sugar uptake was inhibited in GLUT3-injected oocytes exposed to cytochalasin B. (E) Substrate selectivity of GLUT1 determined by competition assay in oocytes exposed to 5 mM 2-DG and 20× fold of the competing sugar, for 15 min. (F) Substrate selectivity of GLUT3 determined by competition assay in oocytes exposed to 5 mM 2-DG and 20× fold of the competing sugar, for 15 min. Data information: In (B, C, D, E, F) Data for all assays are mean ± SD of three or more replicate experiments. In (E, F) ns, Not significant; *P ≤ 0.05; **P ≤ 0.01; and ***P ≤ 0.001 by t test. P-value is shown for ns and *.
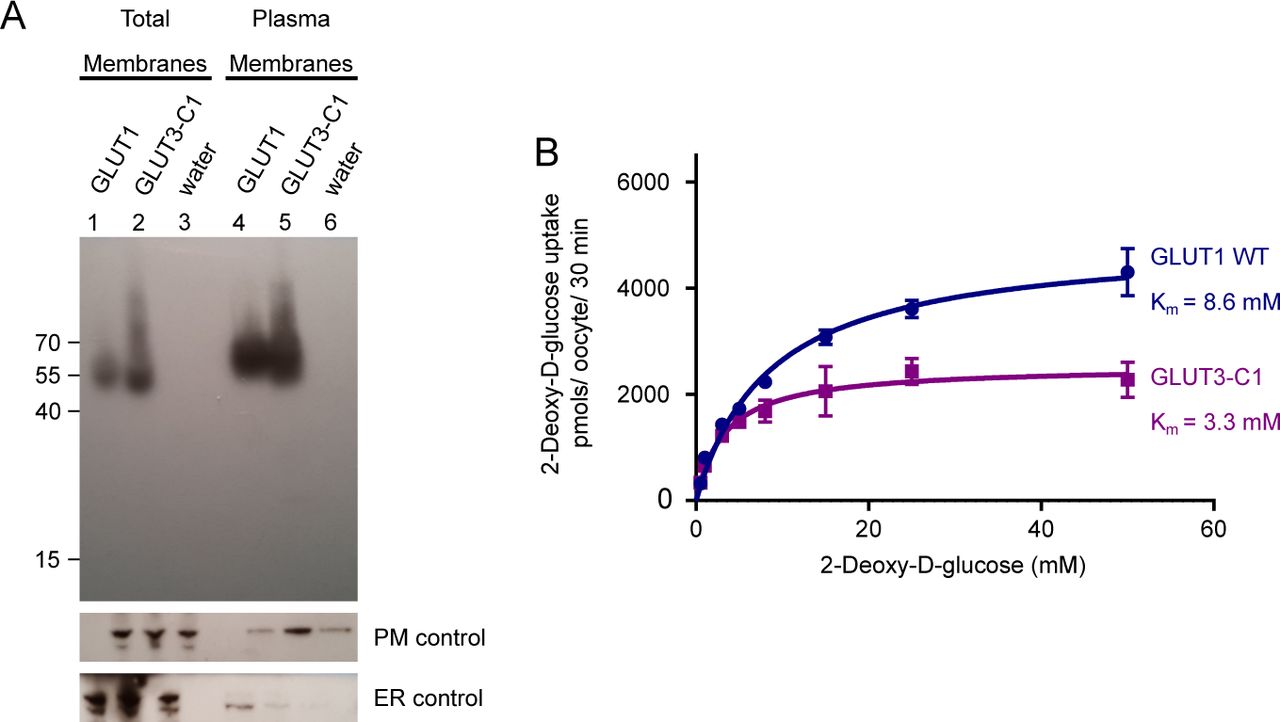
- Figure S2. Expression of GLUT1 and GLUT3 chimera in Xenopus oocytes.
(A) Western blot analysis between GLUT1-injected oocytes, GLUT3 chimera C1-injected oocytes, and water-injected oocytes, from total membrane and plasma membrane preparations. β-integrin is used as a plasma membrane loading control and calnexin as an ER control. (B) Michaelis–Menten analysis of 2-DG uptake between GLUT1 and GLUT3 chimera C1 in Xenopus oocytes. The data were fitted using the Michaelis–Menten non-linear fit, yielding a Km = 8.6 ± 0.8 mM and Vmax = 4,920 ± 155 pmol/oocyte/30 min for GLUT1 and Km = 3.3 ± 0.5 mM and Vmax = 2,537 ± 99 pmol/oocyte/30 min for GLUT3-C1. Data represent the mean ± SD of three or more replicate experiments.
- Figure S3. Purification and crystallization of human GLUT1.
(A) Size exclusion profile of GLUT1 in 0.2% NG/0.02% CHS and the SDS–PAGE correspondent to the protein fraction was obtained (P: pool from Ni-NTA; L: SEC load; M: Size marker; *: Peak fractions). Crystal experiments were set up using the peak fractions (∼5 mg/ml concentration) directly. (B) GLUT1 crystals. (C) Asymmetric unit and crystal packing of GLUT1. The unit cell is highlighted in red. The asymmetric unit contains one molecule of GLUT1. (D) Backbone representation of GLUT1 and ligands are colored by atomic displacement factor (B-factor) with a rainbow gradient from low/blue (57.3 Å2) to high/red (206.8 Å2).
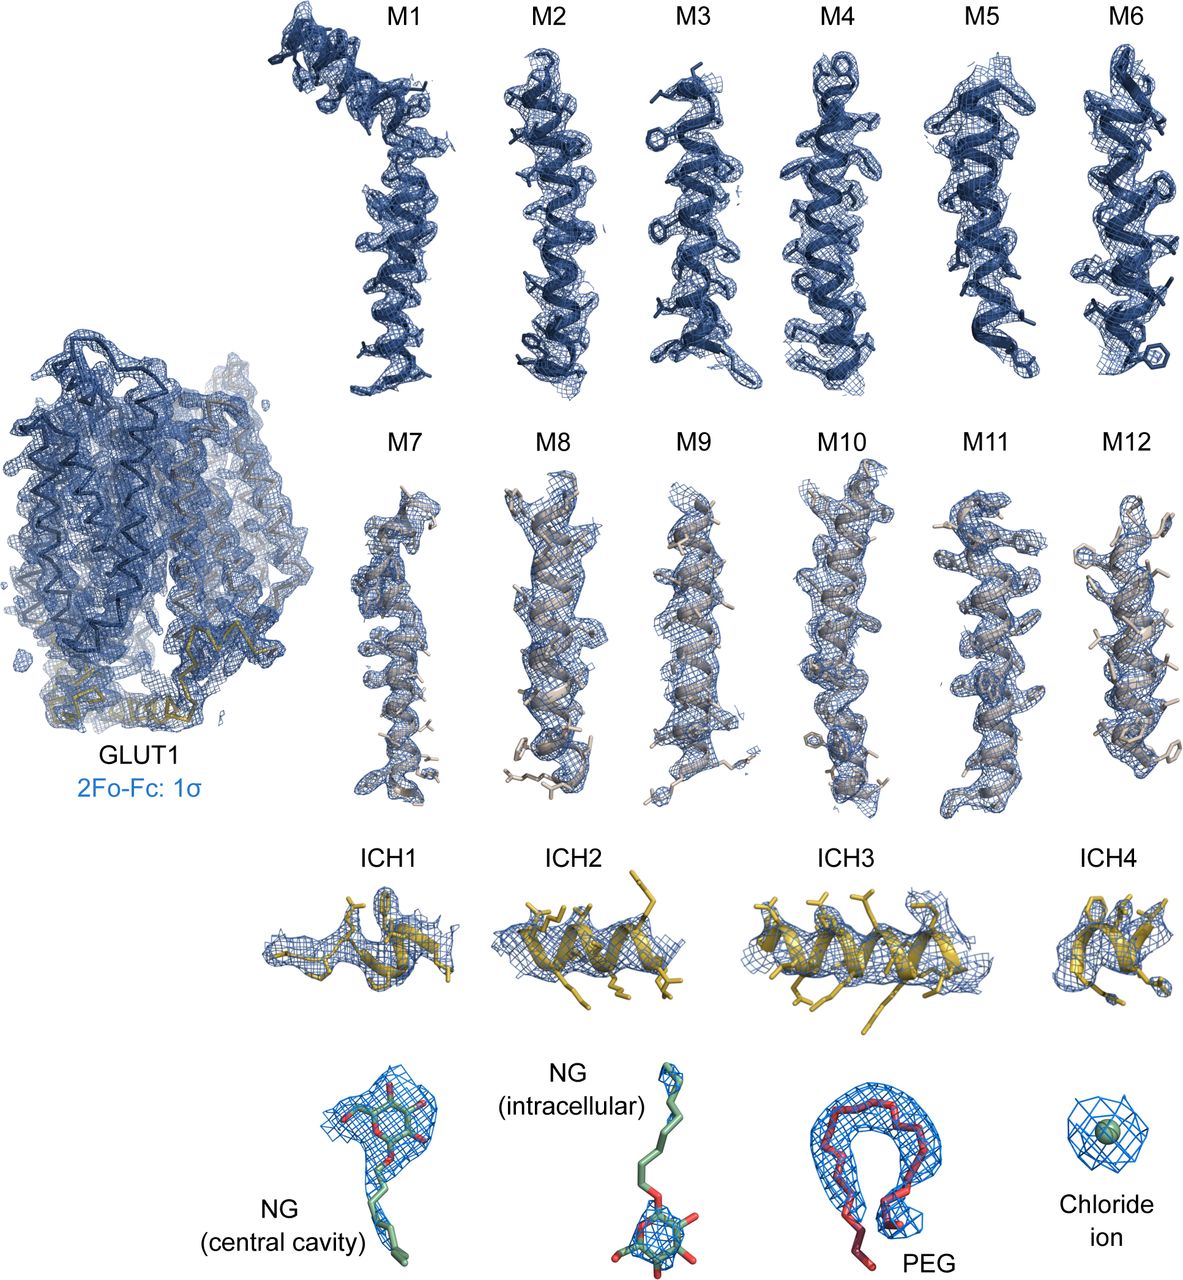
- Figure S4. Electron density of the 2.4 Å crystal structure of GLUT1.
Weighted 2Fo-Fc electron density map countered at 1.0 σ are colored in blue with the final model overlaid and amino acid side chains shown as sticks. Maps are shown for individual helices and ligands.
- Figure S5. Superposition between GLUTs.
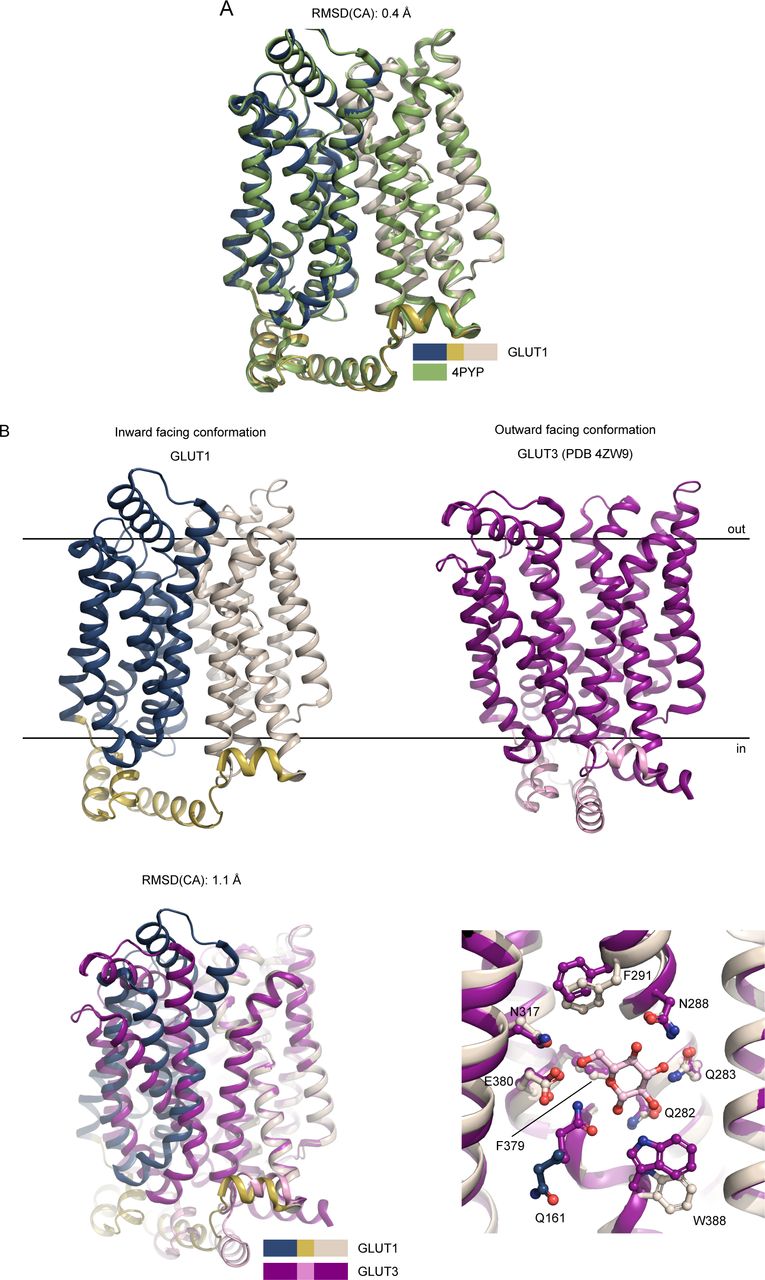
(A) Superposition between the GLUT1 (WT, this work, color coded as in Fig 2) and GLUT1 (N45T/E329Q, PDB 4PYP) show that the models are virtually identical along the backbone, despite the improved resolution. (B) Comparison between GLUT1 and GLUT3 structures. The human GLUT1 structure (this work) was solved in the inward-open conformation, whereas the GLUT3 structure (PDB 4ZW9) was solved in the outward-open conformation. Superimposition of GLUT1 and GLUT3, relative to their C domains show identical sugar coordination and highlight the movement of the N-domain. Residues are labeled according to GLUT1 sequence.
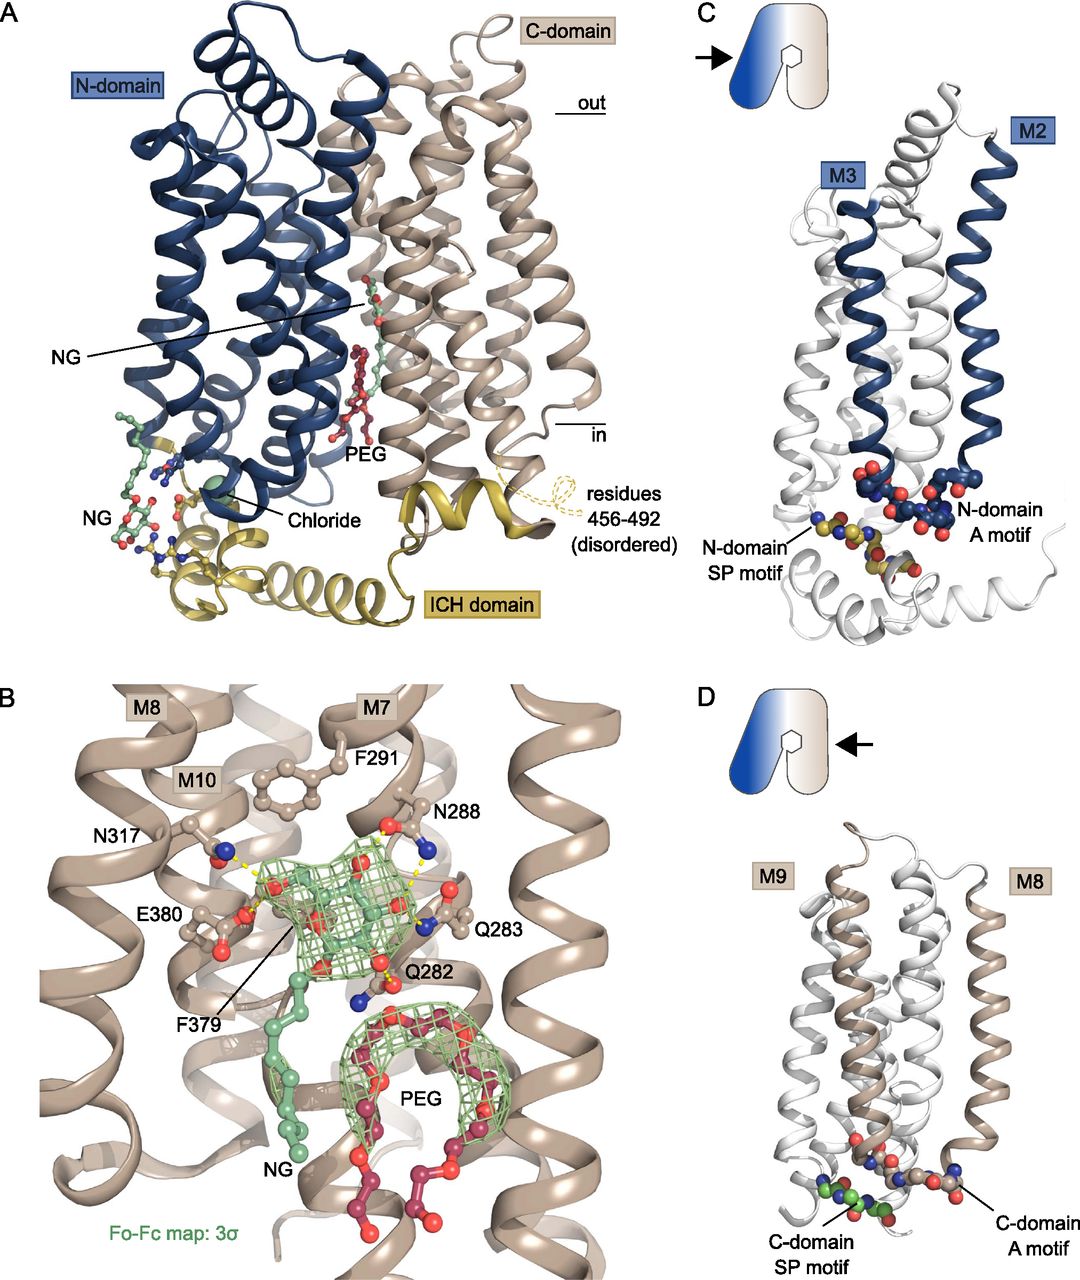
- Figure 2. Crystal structure of GLUT1 reveals new ligands.
(A) The overall structure of GLUT1 in the inward-open conformation. The structure represents a bound state with an NG molecule (shown as sticks) in the central cavity formed between the N-domain (blue) and the C-domain (brown), followed by a PEG molecule (shown as sticks). In close proximity with the ICH domain (yellow) another NG molecule (shown as sticks) was found, as well as a chloride ion (shown as a sphere). Selected residues are shown as sticks. Black lines depict the approximate location of the membrane. (B) Coordination of the glucose moiety in the central cavity by residues from C-domain. Hydrogen bonds are represented by yellow dashes (2.6–3.6 Å distances). The omit Fo-Fc density for NG and PEG is contoured in green at 3 σ. (C) Side view of GLUT1 shows the localization of the N-domain Sugar Porter motif directly underneath the A-motif from the M2-M3 loop. Signature motifs are shown as spheres. (D) Side view of GLUT1 shows the localization of the C-domain Sugar Porter motif directly underneath the A-motif from the M8-M9 loop. Signature motifs are shown as spheres.
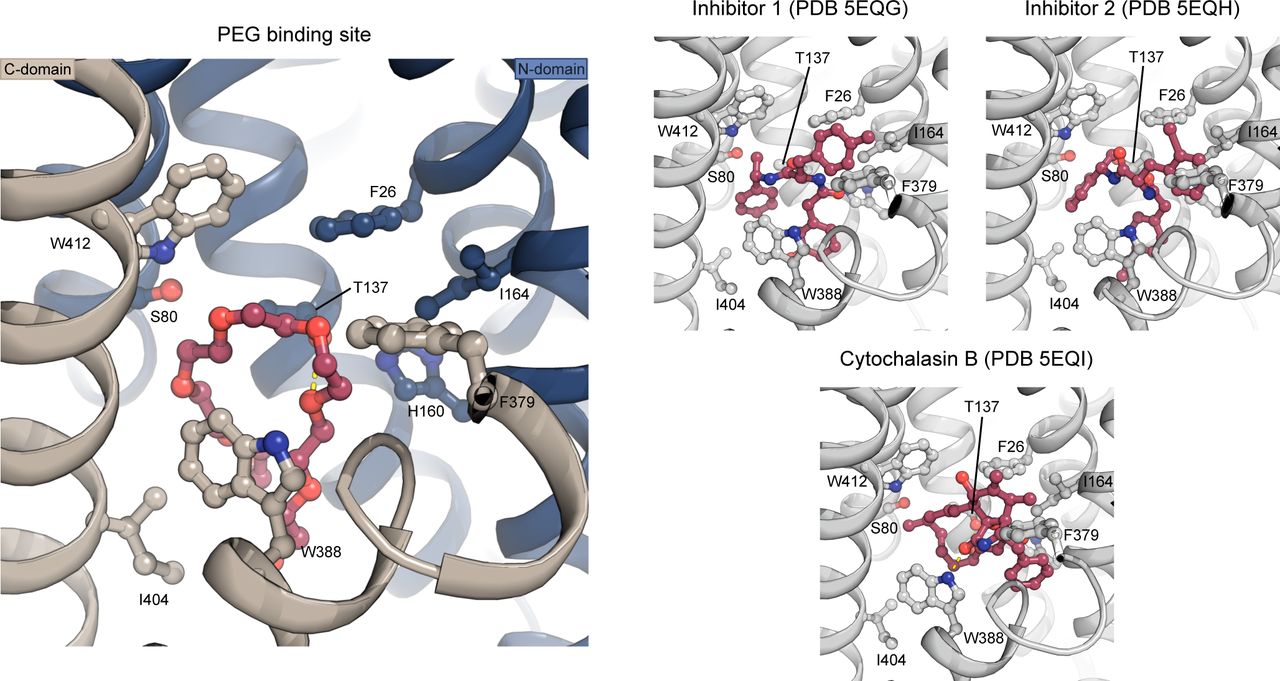
- Figure S6. The PEG-binding site compared to binding of endofacial inhibitors.
A PEG molecule (red) was identified just below the central binding-site of glucose. The PEG molecule binds through interactions with Trp388, Trp412, Ile404, Thr137, and Ser80. The PEG binding pose is similar to the pose of endofacial inhibitors 1 (PDB 5EQG) and 2 (PDB 5EQH) previously characterized for GLUT1, whereas the previously characterized cytochalasin B (PDB 5EQI) binding pose differs (despite being at the same binding site in the protein). The inhibitors are shown as sticks and colored in red, whereas protein is shown as cartoon and colored in gray. Investigation of the inhibitor density found in 5EQG and 5EQH, suggest the electron density could fit a PEG molecule as well. Interestingly, an older structure of GLUT1 (Deng et al, 2014) also has unmodeled density in this region that could accommodate a PEG molecule in the same site.
- Figure 3. Intracellular binding of Chloride and NG stabilize the inward-open conformation.
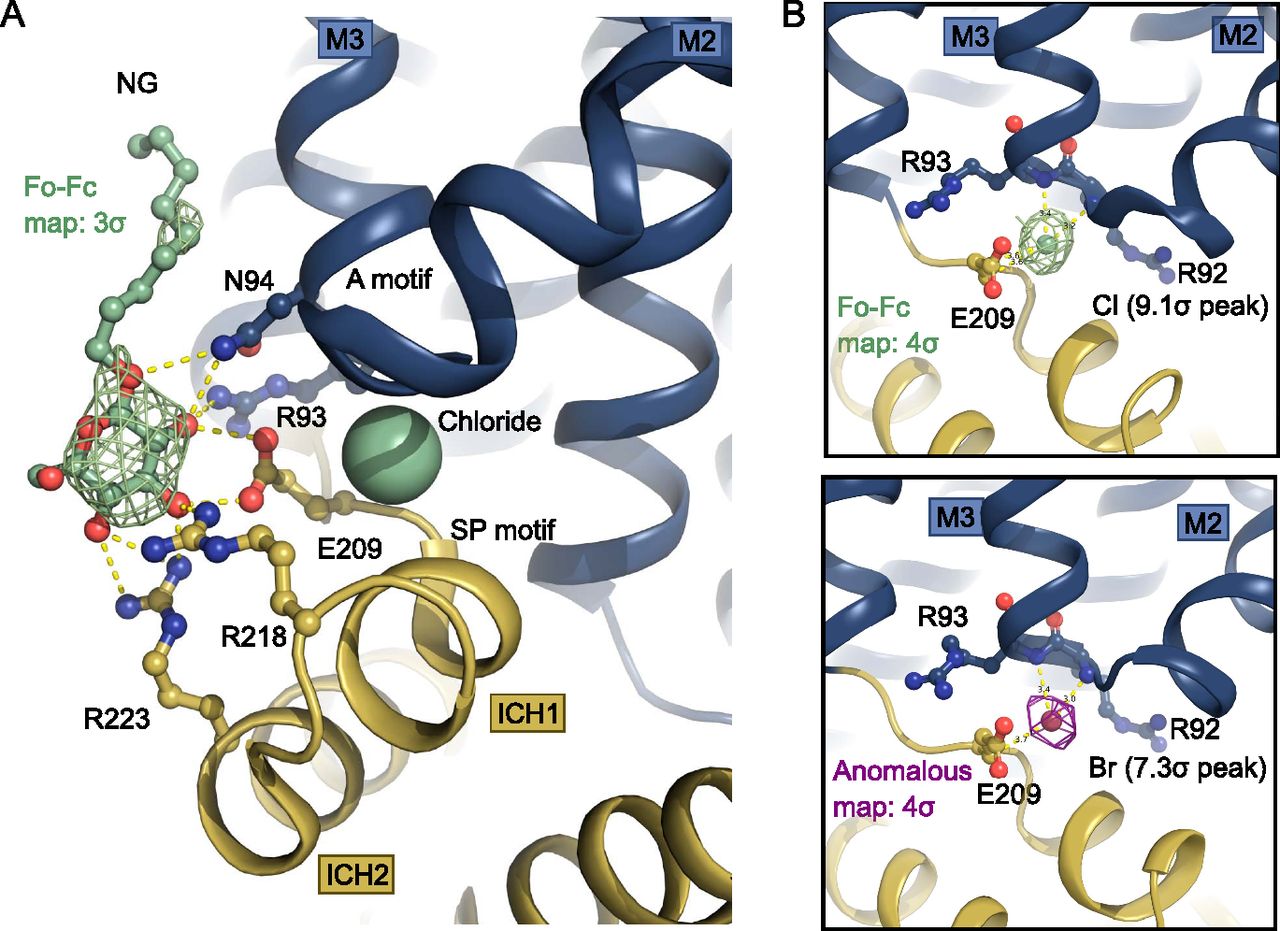
(A) Intracellular NG is coordinated by residues from the Sugar Porter and A motifs. A chloride ion (shown as spheres) neutralizes the A-motif. Hydrogen bonds are represented by yellow dashes (2.6–3.6 Å distances). The omit Fo-Fc density for NG is contoured in green at 3 σ. (B) Coordination of the chloride ion by residues of the A-motif. The Fo-Fc electron density, shown in green mesh, is contoured at 4 σ (top). The anomalous signal for the chemical chloride congener, bromide, shown in magenta mesh, is contoured at 4 σ (bottom).
- Figure 4. The N-domain Sugar Porter (SP)-A network between inward and outward states.
(A) Sequence alignment between GLUT1 and GLUT3 of the N-domain A motif (blue) and the N-domain SP motif (yellow). Residues involved in GLUT1 deficiency syndrome are colored in red. N-domain SP-A network in the inward conformation represented by the GLUT1 structure (left) and the outward conformation represented by the GLUT3 structure (PDB 4ZW9) (right). Selected residues are shown as sticks and hydrogen bonds are represented by yellow dashes (2.6–3.6 Å distances). (B) GLUT1 E209Q: Km = 17 ± 3.4 mM and Vmax = 6,473 ± 528 pmol/oocyte/30 min. (C) GLUT3 E207Q: Km = 6.2 ± 1.2 mM and Vmax = 1,418 ± 88 pmol/oocyte/30 min. Data information: In (B, C) Michaelis–Menten analysis of 2-DG uptake in oocytes. Data represents the mean ± SD of three or more replicate experiments.
- Figure S7. The Sugar Porter (SP) motif glutamate residue in known SP proteins structures.
(A) Outward-open conformation structures of GLUT3 (PDB 4ZW9), rGLUT5 (PDB 4YBQ), and atSTP10 (PDB 6H7D) were superimposed relative to their N-domains (left) or C-domains (right). The glutamate residues (shown as sticks) in both N- (bottom left) and C- (bottom right) domains motifs are pointing towards the A-motif, interaction with it in an SP-A network. (B) Inward-open conformation structures from GLUT1 (this work), the GlcPse (PDB 4LDS), and bGLUT5 (PDB 4YB9) were superimposed relative to their N-domains (left) or C-domains (right). The glutamate residues (shown as sticks) in both N- (bottom left) and C-domains (bottom right) motifs point away from the A motif, with the exception of the C-domain glutamate of the GlcPse (bottom right).
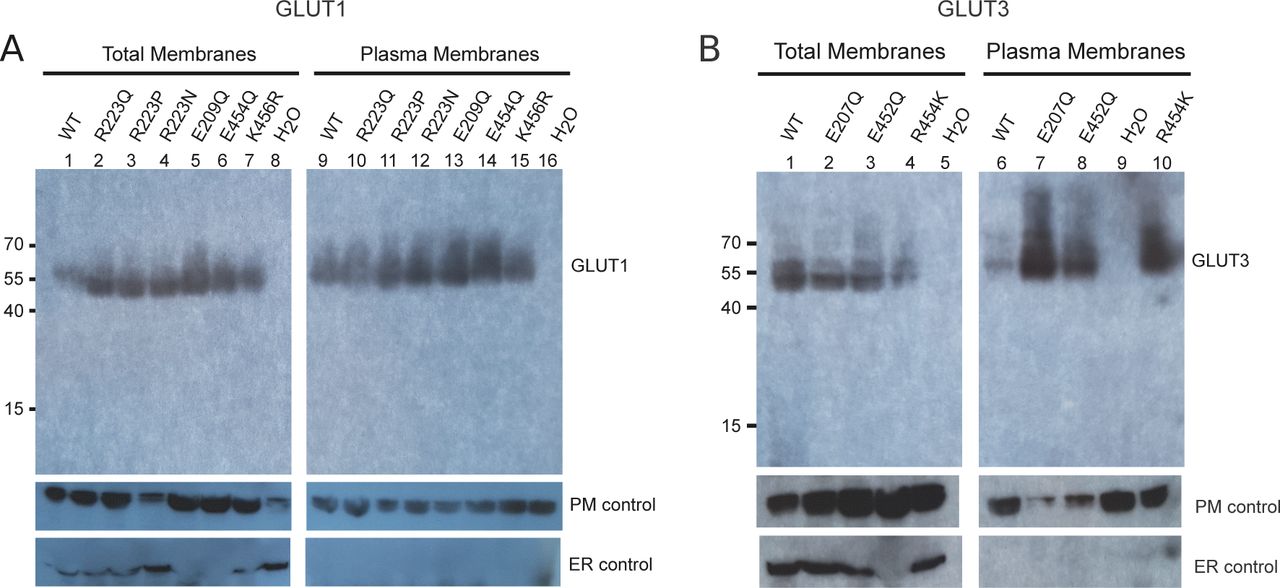
- Figure S8. Expression of GLUT mutants in Xenopus oocytes.
(A) Western blot analysis between GLUT1-injected oocytes, GLUT1 mutants and water-injected oocytes, from total membrane and plasma membrane preparations. β-integrin is used as a plasma membrane loading control and calnexin as an ER control. (B) Western blot analysis between GLUT3-injected oocytes, GLUT3 mutants, and water-injected oocytes, from total membrane and plasma membrane preparations. β-integrin is used as a plasma membrane loading control and calnexin as an ER control.
- Figure 5. The C-domain Sugar Porter (SP)-A network between inward and outward states.
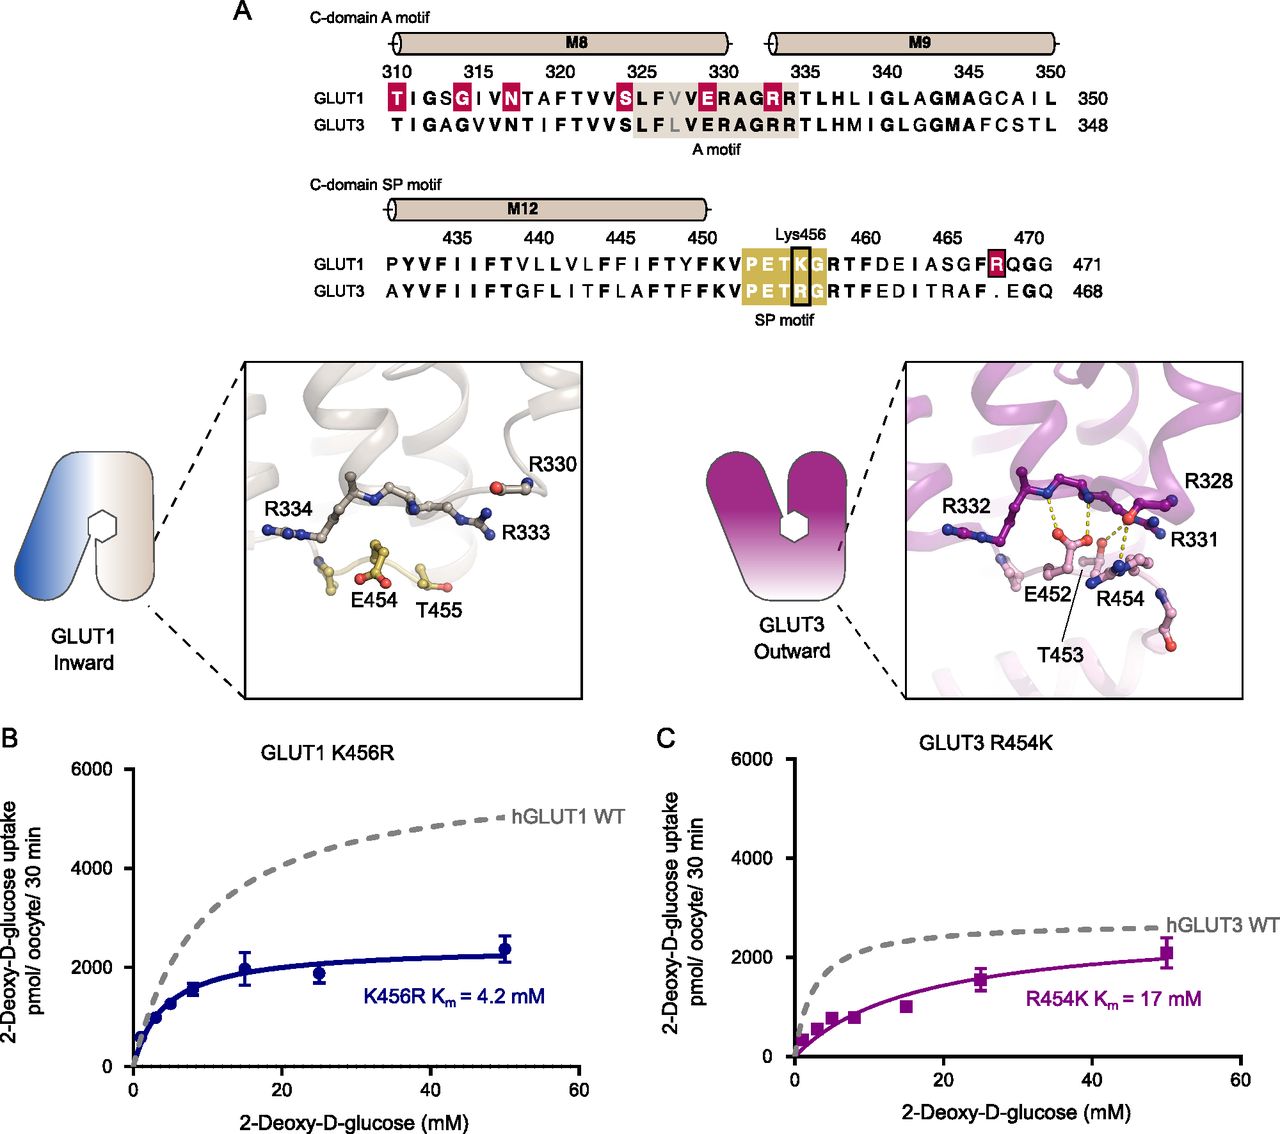
(A) Sequence alignment between GLUT1 and GLUT3 of the C-domain A motif (brown) and the C-domain SP motif (yellow). Residues involved in GLUT1 deficiency syndrome are colored in red. C-domain SP-A network in the inward conformation represented by the GLUT1 structure (left) and the outward conformation represented by the GLUT3 structure (PDB 4ZW9) (right). Selected residues are shown as sticks and hydrogen bonds are represented by yellow dashes (2.6–3.6 Å distances). (B) GLUT1 K456R: Km = 4.2 ± 0.6 mM and Vmax = 2,427 ± 90 pmol/oocyte/30 min. (C) GLUT3 R454K: Km = 17 ± 3.3 mM and Vmax = 2,638 ± 234 pmol/oocyte/30 min. Data information: In (B, C) Michaelis–Menten analysis of 2-DG uptake in oocytes. Data represent the mean ± SD of three or more replicate experiments.
- Figure S9. Conservation of the N-domain and C-domain A motifs.
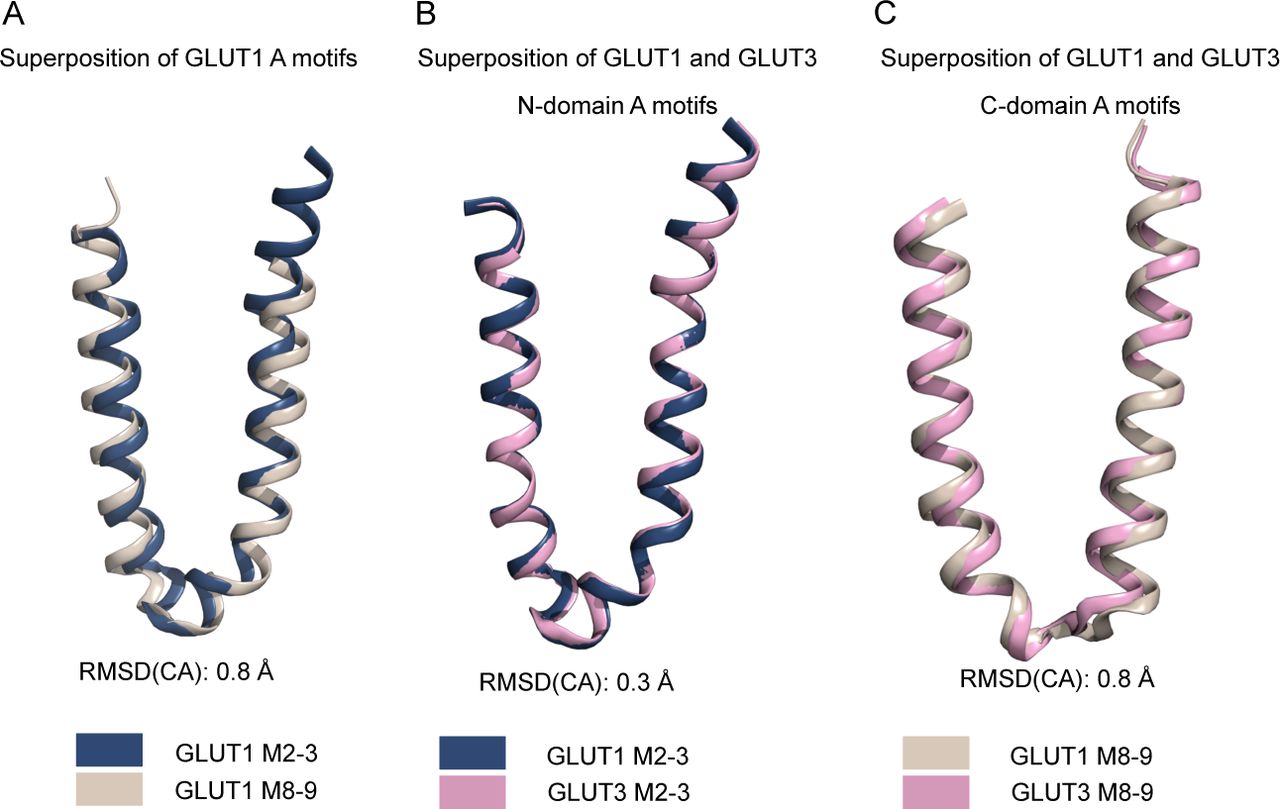
(A) Superposition of the GLUT1 N-domain A-motif (blue) with the C-domain A-motif (brown), shown as cartoon representation. (B) Superposition of the GLUT1 N-domain A-motif (blue) with the GLUT3 N-domain A-motif (pink), shown as cartoon representation. (C) Superposition of the GLUT1 C-domain A-motif (brown) with the GLUT3 C-domain A-motif (pink), shown as cartoon representation.
- Figure S10. The N-domain Sugar Porter (SP)-A network of the GLUT1 bacterial homolog.
Sequence alignment between GLUT3 (UniProt P11169) and XylE (UniProt P0AGF4) of the C-domain A motif and the C-domain SP motif. Conserved residues are highlighted in bold. The residues belonging to the A motif and the SP motif are colored in blue. C-domain SP-A network in the inward conformation represented by the XylE structure (PDB 4JA4) (left) and the outward conformation represented by the GLUT3 structure (PDB 4ZW9) (right). Selected residues are shown as sticks and hydrogen bonds are represented by yellow dashes (2.6–3.6 Å distances).
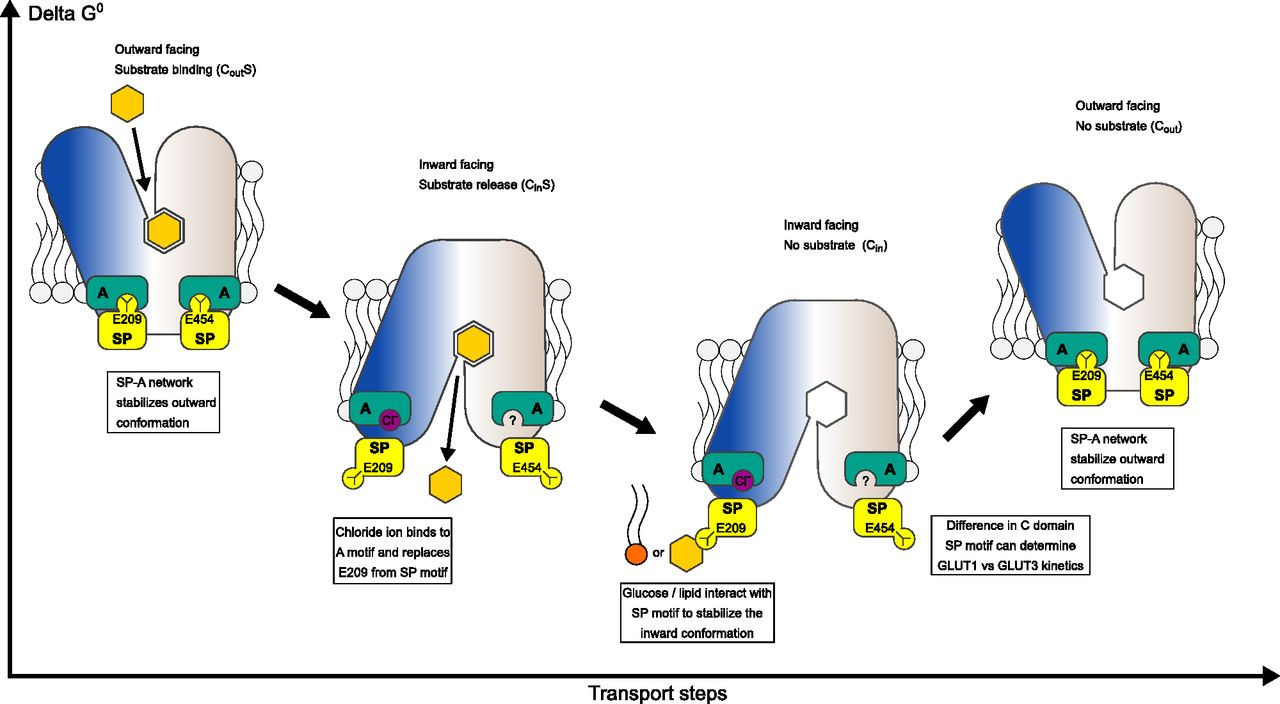
- Figure 6. Model for kinetic control of the transport cycle based on the Sugar Porter (SP)-A network.
The SP-A network stabilizes the outward conformation where glucose binds from the extracellular side to the central substrate binding site. Glucose binding leads to closure of the binding site towards the extracellular side and the SP motif glutamate flips away from the A-motif, interchanged by a chloride ion. The disruption of the SP-A network opens the central cavity to the intracellular side and a cytosolic exit pathway for glucose is created. Direct interactions between glucose/lipids with the SP and A motifs can stabilize the inward conformation.


Supplementary Materials


In this Issue
Related Articles
Cited By...
- Molecular genetics of GLUT1DS Italian pediatric cohort: 10 novel related-disease variants and structural analysis
- Interpreting the molecular mechanisms of disease variants in human membrane proteins
- The wheat multi-pathogen resistance gene, Lr67res, confers a novel gain-of-function phenotype involving anion fluxes
- Insights into the structure and function of the human organic anion transporter 1 in lipid bilayer membranes