


Article Figures & Data
Figures
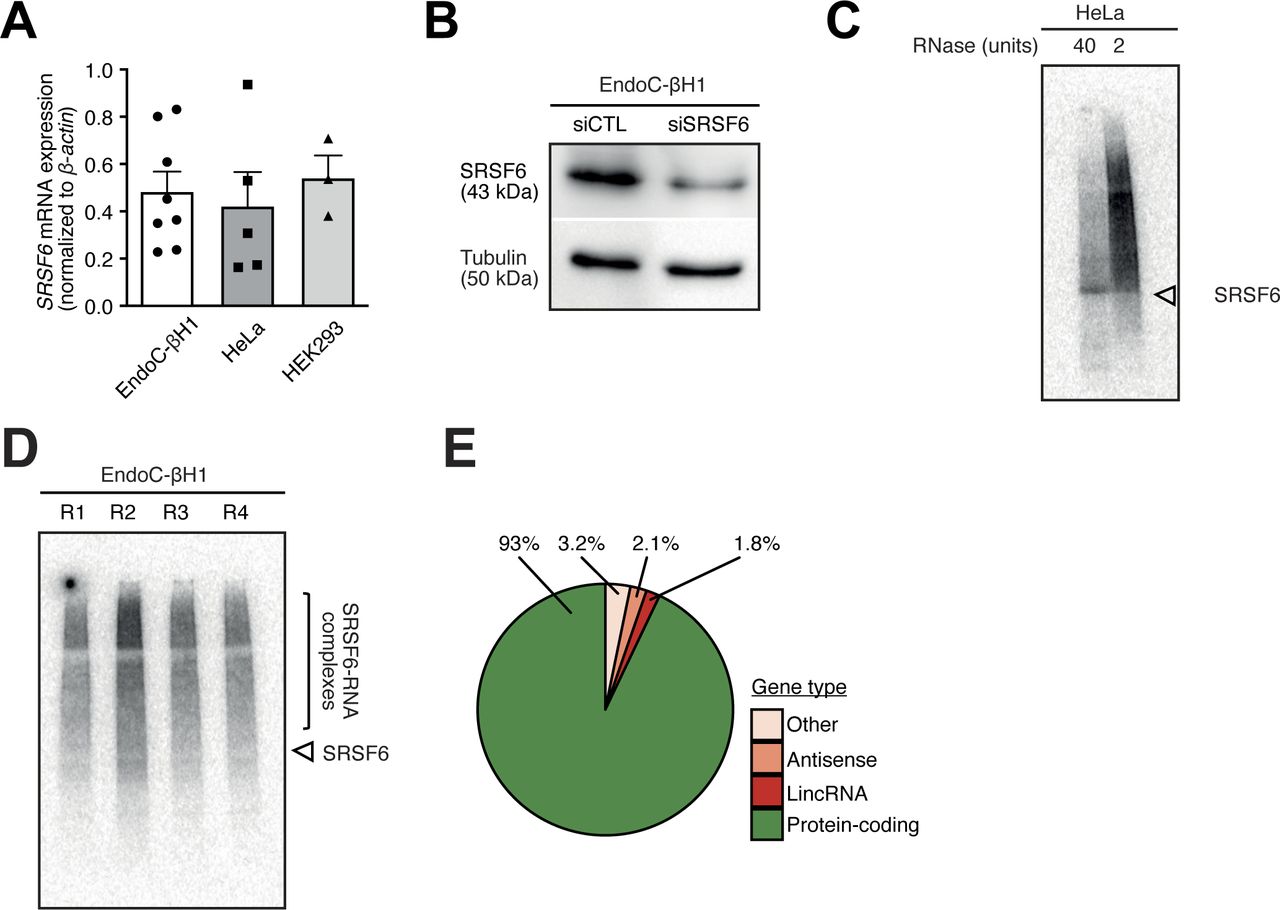
- Figure S1. The conditions for SRSF6 iCLIP were optimized in EndoC-βH1 cells.
(A) SRSF6 mRNA expression in EndoC-βH1, HeLa, and HEK293 cells by quantitative real-time PCR (qRT-PCR) normalized by the housekeeping gene β-actin. Mean and standard deviation of the mean (SEM) are shown for 3–8 replicates. (B) Western blot analysis of SRSF6 in control condition (siCTL) and after SRSF6 knockdown (siSRSF6), illustrating the specificity of the anti-SRSF6 antibody. An antibody against Tubulin was used as loading control. (C) Autoradiographs of 32P-labeled SRSF6–RNA complexes from HeLa cells immobilized on a nitrocellulose membrane. UV cross-linking was induced in 8 × 10⁶ cells using UV light (254 nm) with an irradiation energy of 150 mJ/cm2. HeLa cells were treated with 40 or 2 units of RNase. High RNase concentration focuses the protein–RNA complexes to a defined band at the expected molecular weight of SRSF6 (43 kD, arrowhead). (D) Autoradiograph of four replicate iCLIP experiments from EndoC-βH1 cells that were used for iCLIP library preparation and high-throughput sequencing (R1-4). UV cross-linking was induced in 8 × 10⁶ EndoC-βH1 cells at 300 mJ/cm2 UV light (254 nm). Bracket indicates region of nitrocellulose membrane that was excised to extract SRSF6–RNAs complexes. (E) SRSF6 binding sites are predominantly associated with protein-coding genes. The pie chart shows percentage of SRSF6 binding sites in different types of annotated genes. Only binding sites overlapping with a single gene were taken into account. LincRNA, long intervening non-coding RNA.
Source data are available for this figure.
Source Data for Figure S1[LSA-2020-00825_SdataFS1.xlsx]
- Figure 1. iCLIP experiments show SRSF6 binding to thousands of transcripts in EndoC-βH1 cells.
(A) Optimization of UV cross-linking conditions indicates that a combination of 300 mJ/cm2 UV energy and 8 × 10⁶ cells gives highest yield. Autoradiographs of 32P-labeled SRSF6–RNA complexes that immunoprecipitated from EndoC-βH1 (lanes 1, 2, 4–6) and HeLa cells (lane 3), separated by SDS–PAGE and immobilized on a nitrocellulose membrane. UV cross-linking was performed with different amounts of cells and using UV 254 nm with different irradiation energy, as indicated above. EndoC-βH1 cells were treated with low (2 U) and high (40 U) RNase concentration. High RNase concentration focuses the protein-RNA complexes to a defined band slightly above the expected molecular weight of SRSF6 (43 kD, arrowhead). (B) Gene Ontology enrichment in SRSF6-bound genes. Gene count refers to number of genes in the tested set that are associated with a given Gene Ontology term. P-value from hypergeometric distribution. (C) SRSF6 primarily binds coding sequences (CDS). The pie chart (top) shows distribution of SRSF6 binding sites per transcript region on protein-coding genes. Numbers indicate percentage or absolute number (brackets) of SRSF6 binding sites. The bar chart (bottom) shows relative enrichment per region, that is, number of binding sites normalized by summed length of respective bound transcript regions. (D) SRSF6 preferentially binds on exons of the CCDC50 gene. Genome browser view of SRSF6 iCLIP data (signal of merged replicates), binding sites (green), and SRSF6 motif (yellow boxes). Selected transcript isoforms are shown below (GENCODE v29), with black boxes highlighting a SRSF6-regulated alternative exon together with the flanking constitutive exons. UTR, untranslated region.
Source data are available for this figure.
Source Data for Figure 1[LSA-2020-00825_SdataF1.xlsx]
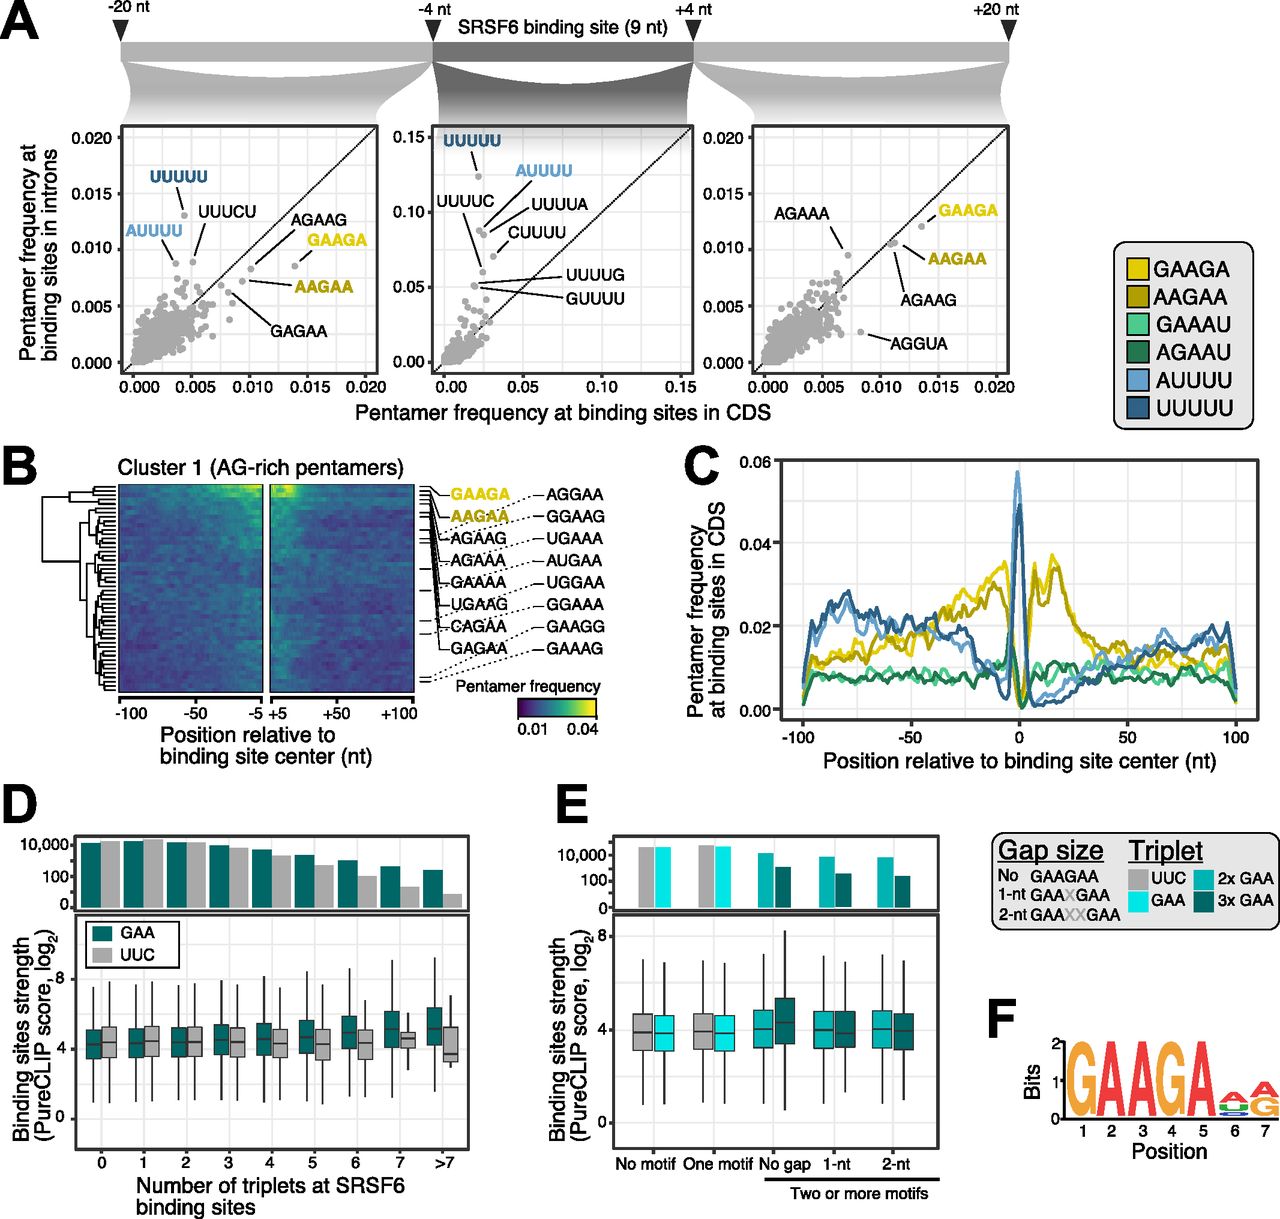
- Figure 2. SRSF6 specifically recognizes GAA motifs in exons.
(A) SRSF6 binding sites in CDS frequently display AG-rich pentamers, contrasting the uridine-rich pentamers in introns, most prominently UUUUU. Scatter plots compare pentamer frequency within the 9-nt binding sites and in flanking 20-nt windows for SRSF6 binding sites in introns and CDS. Two most enriched pentamers of clusters 1 and 2 derived from hierarchical clustering of pentamer profiles are colored (see (B) and Fig S2A). (B) GAAGA and AAGAA enrich around SRSF6 binding sites in the CDS, whereas UUUUU marks binding site centers. Heat map shows cluster 1 from hierarchical clustering of pentamer profiles. Two most enriched pentamers are labeled and colored as in (A). Clusters 2 and 3 with uridine-rich and other pentamers are shown in Fig S2A and B. (C) SRSF6 positions towards end of motif-enriched stretches. Metaprofile shows pentamer frequencies in 201-nt window around SRSF6 binding sites. Two most enriched pentamers of three clusters from hierarchical clustering of pentamer profiles are shown. (D) Binding site strength increases with the number of GAA triplets. Boxplot (bottom) shows the distribution of binding site strengths (log2-transformed PureCLIP score) for binding sites with a given number of GAA triplets within 30 nt from binding site center. Reverse complement UUC was used as control. Box represents quartiles, center line denotes 50th percentile, and whiskers extend to most extreme data points within 1.5× interquartile range. The bar chart (top) gives number of binding sites in each category. (E) Two or more GAA triplets in direct sequence are associated with increased binding site strength. Boxplot shows the distribution of binding site strengths (log2-transformed PureCLIP score) for binding sites with no or one triplet (GAA or UCC) compared with two or more triplets in direct sequence or with 1-nt or 2-nt gaps. Visualization as in (D). (F) Motif enrichment analysis using DREME (Bailey, 2011) detected a purine-rich motif, reinforcing the role of GAA regions in SRSF6 binding. The motif is present at 25,148 SRSF6 binding sites.
- Figure S2. SRSF6 preferentially binds to coding sequences in EndoC-βH1 cells.
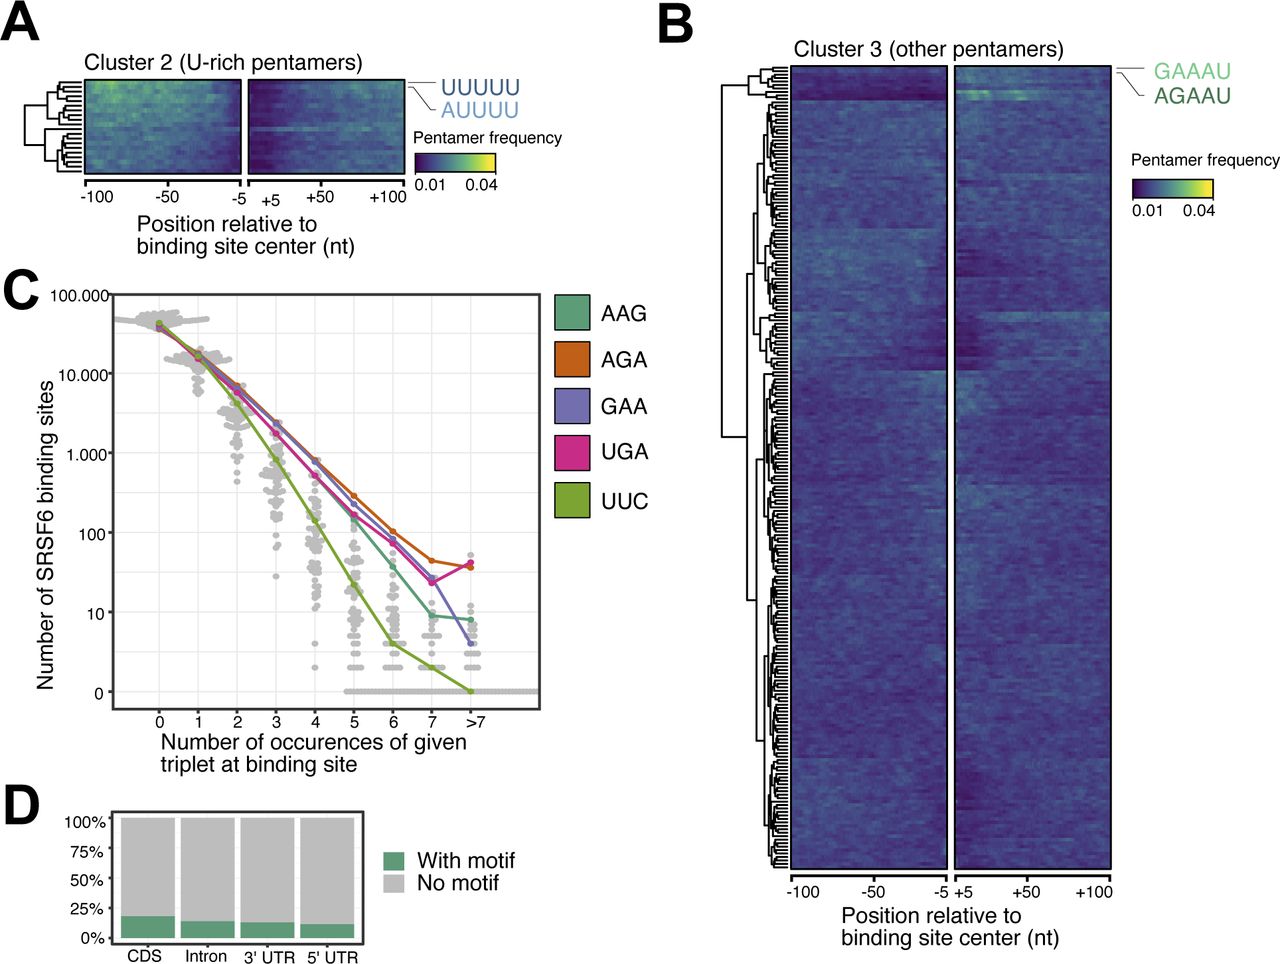
(A, B) U-rich pentamers are not enriched outside the immediate SRSF6 binding sites. (A, B) Heatmaps show clusters 2 (uridine-rich pentamers) (A) and cluster 3 (mixed pentamers) (B) from hierarchical clustering of pentamer profiles. (A) The two most enriched pentamers in each cluster are labeled and colored as in (A). Visualization as in Fig 2B. (C) The triplets GAA and AGA, which constitute part of the predicted SRSF6 recognition motif (Fig 2F), occur more frequently in higher repetition at SRSF6 binding sites, whereas occurrence of the control triplet UUC declines more rapidly at higher repetition sites. Bee swarm plot shows the number of SRSF6 binding sites (y-axis) with zero, one or more triplet occurrences (x-axis) for all 64 possible triplets within a 49-nt window around binding sites. Selected triplets are highlighted. (D) The bar chart shows percentage of SRSF6 binding sites harboring the enriched SRSF6 motif in different transcript regions.
- Figure 3. SRSF6 binding on alternative and constitutive exons defines the splicing outcome in EndoC-βH1 cells.
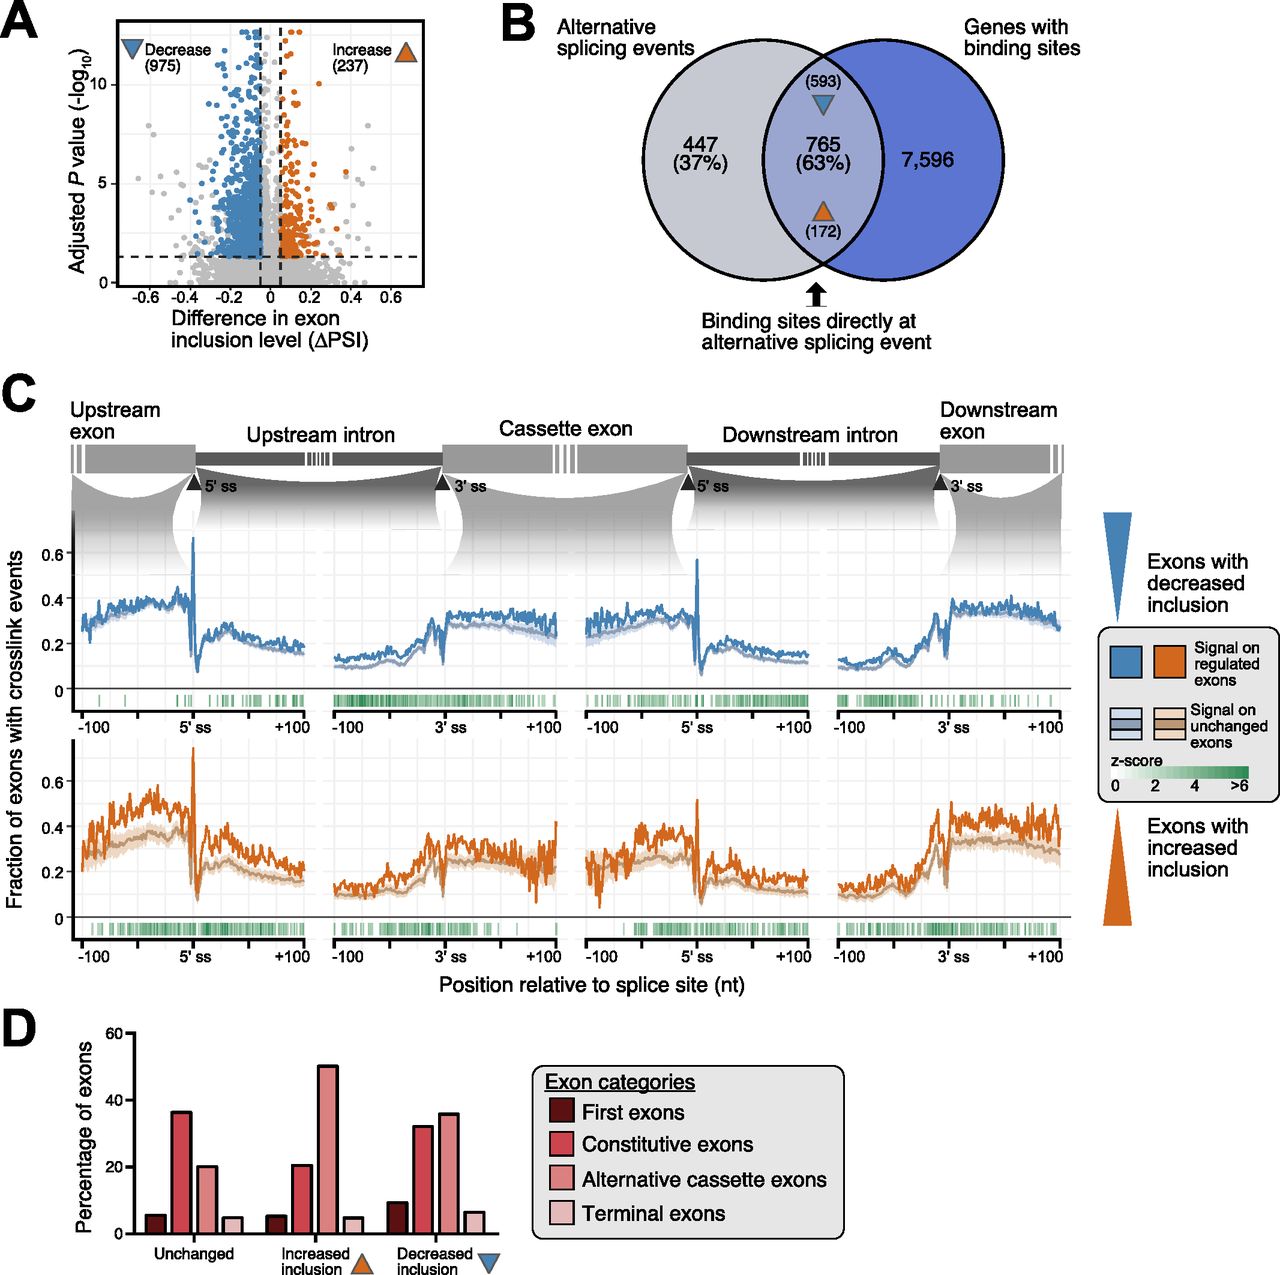
(A) SRSF6 knockdown (KD) affects the inclusion of 1,212 cassette exons (CEs). Volcano plot shows log10-transformed adjusted P-values against differences in “percent spliced-in” (ΔPSI) of CEs. Exons with significantly increased or decreased inclusion are colored (ΔPSI > 0.05, adjusted P-value < 0.05), according to reanalysis of our previously published RNA-seq data of EndoC-βH1 upon SRSF6 KD (n = 5) (Juan-Mateu et al, 2018). (B) Most SRSF6-regulated CEs are directly associated with an SRSF6 binding site. Venn diagram depicts number and percentage of significantly regulated exons that harbor an SRSF6 binding site in the alternatively spliced region. Numbers in brackets at arrowheads specify exons with significantly increased and decreased inclusion in the overlap. (C) SRSF6 RNA splicing maps. SRSF6 shows more cross-link events on exons with decreased inclusion after SRSF6 KD (blue, top), suggesting that SRSF6 binding is required for their inclusion, whereas exons with increased inclusion after SRSF6 KD (orange, bottom) display more SRSF6 on the flanking constitutive exons. Metaprofile depicts fraction of exons with cross-link events at a given position within 100-nt on either side of indicated 3′ and 5′ splice sites. For comparison, mean and standard deviation are shown for a PSI-matched background distribution of unchanged exons (light blue and light orange lines, respectively; see Fig S3C–E), resulting from randomly sampled unchanged exons in EndoC-βH1 cells with comparable exon inclusion levels under control conditions. Only positive z-scores with adjusted P-value < 0.05 are shown. (D) Up-regulation upon SRSF6 KD predominantly affects alternative exons, whereas down-regulation is almost equally observed for constitutive exons. The bar chart shows the contribution of different exon categories to exons with significantly increased or decreased inclusion upon SRSF6 KD according to Exon Ontology analysis (Tranchevent et al, 2017). All remaining CEs (Unchanged) are shown as control.
- Figure S3. Splice site strength of SRSF6-regulated exons and selection of background exon sets.
(A, B) SRSF6-regulated exons show minor differences in splice site strength. Violin plots show distribution of MaxEnt scores for 3′ (A) and 5′ (B) splice sites of exons with significantly decreased (n = 975) or increased (n = 237) inclusion upon SRSF6 KD. All remaining exons from the same transcripts are shown for comparison (Unchanged). Box represents quartiles, center line denotes 50th percentile, and whiskers extend to most extreme data points within 1.5x interquartile range. *P-value < 0.05, t test. (C) Exons with high inclusion harbor more crosslink events detected by iCLIP, pointing to their higher overall abundance compared to exons with low inclusion. Boxplot shows distribution of log2-transformed cross-link events per exon (normalized by exon length). All measured exons (n = 19,308) were stratified into five bins (color shading) by their inclusion level in control (“percent spliced-in,” PSI). Boxes as in (A). (D) A PSI-matched background set is repeatedly subsampled from all unchanged exons. Background sets were compiled by subselecting exons with a similar mean inclusion (PSI, control) as the up-regulated (n = 237) or down-regulated (n = 975) exons. Subsampling was repeated 100 times to obtain the mean and standard deviation of the two background set distributions, which were used for comparison in the SRSF6 RNA splicing map (Fig 3C). (E) PSI-matched background sets show similar mean inclusion levels as up-regulated and down-regulated exons. Violin plots illustrate distribution of PSI values in control for SRSF6-regulated exons and one exemplary set of unchanged exons before (Uniform) and after (PSI-matched) background adjustment. Boxes as in (A).
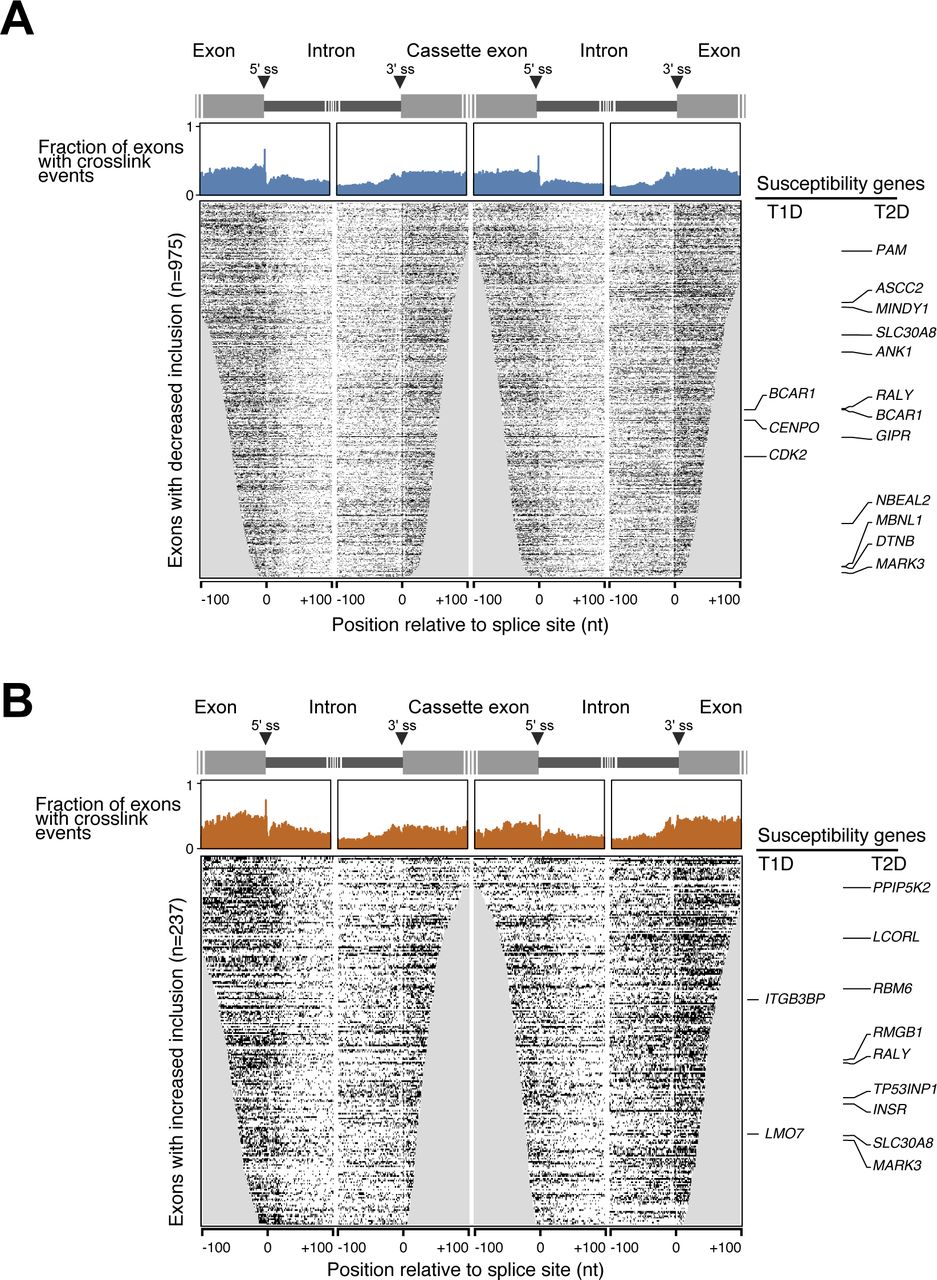
- Figure S4. SRSF6 cross-link events around SRSF6-regulated cassette exons.
(A, B) Metaprofiles (top) and heat maps (bottom) represent the SRSF6 cross link signal on exons with significantly decreased (n = 975) (A) or increased (n = 237) (B) inclusion upon SRSF6 KD in EndoC-βH1 cells. Type 1 (T1D) and type 2 (T2D) diabetes susceptibility genes are labeled on the side. Metaprofiles depict fraction of exons with cross-link events (merged replicates) at a given position within 100 nt on either side of indicated 3′ and 5′ splice sites. Heat maps depict individual positions with cross-link evens in the respective exons. Rows are sorted by exon length and iCLIP coverage. Positions missing for a particular exon are set to 0 and thus are included in the metaprofile above.
- Figure S5. SRSF6 KD affects gene expression of splicing-regulatory proteins in EndoC-βH1 cells.
(A) SRSF6 KD significantly changes the expression of 106 genes. Volcano plot shows adjusted P-value (Benjamini–Hochberg correction) against log2-transformed fold-change (LFC). Significant genes are highlighted (adjusted P-value < 0.001, |LFC| > 1). (B) SRSF6-regulated splicing events are not associated with global changes in gene expression. Scatter plot compares differences in exon inclusion (percent spliced-in, PSI) to changes in gene expression upon SRSF6 KD in EndoC-βH1 cells. Genes are color-coded according to their significant differential expression and/or alternative splicing. (C) SRSF6 KD affects expression of many splicing regulator genes in EndoC-βH1 cells. The bar chart depicts log2-transformed fold-change of differentially expressed splicing regulator genes (adjusted P-value < 0.001). Genes with additional alternatively spliced exons are colored. (D) The SR protein-encoding gene SRSF4 is significantly up-regulated upon SRSF6 KD. It harbors an SRSF6-regulated exon and shows strong SRSF6 binding. Genome browser view depicts SRSF6 iCLIP data (merged replicates) and binding sites (green) together with RNA-seq read coverage from control and SRSF6 KD EndoC-βH1 cells. Selected transcript isoforms are shown below (GENCODE v29). Zoom-in on SRSF6-regulated cassette exon and the flanking constitutive exons. Lines indicate exon-exon junctions with numbers of supporting reads. In line with the global RNA splicing map for SRSF6 (Fig 3C), SRSF6 binding in the alternative exon appears to promote its inclusion.
- Figure 4. Diabetes susceptibility genes are directly bound by SRSF6.
(A, B) SRSF6 regulates alternative splicing events in several type 1 diabetes (T1D) (A) and type 2 diabetes (T2D) (B) susceptibility genes. Scatter plots show inclusion level differences (ΔPSI) against strength of strongest associated SRSF6 binding site (log2-transformed PureCLIP score). Genes highlighted in dark blue and dark orange carry at least one SRSF6 binding site with a GAA-rich motif within 100 nt as shown in Fig 2F. Note that several genes harbor multiple SRSF6-regulated splicing events. (C, D) SRSF6 regulates 6 and 22 splicing events in 5 T1D (C) and 17 T2D (D) susceptibility genes, respectively. Venn diagrams depict overlap of SRSF6-regulated cassette exons and susceptibility genes. (E) Seven out of nine SRSF6-regulated exons in T1D (lightgreen) and T2D (darkgreen) susceptibility genes were validated by semiquantitative RT-PCR in control (siCTL) and SRSF6 KD (siSRSF6) EndoC-βH1 cells. Representative digital gel images (top) and quantifications with paired individual data points for 4–7 independent experiments (bottom) are shown for each splicing event. *P < 0.05, **P < 0.01, and ***P < 0.001, paired t test.
Source data are available for this figure.
Source Data for Figure 4[LSA-2020-00825_SdataF4.xlsx]
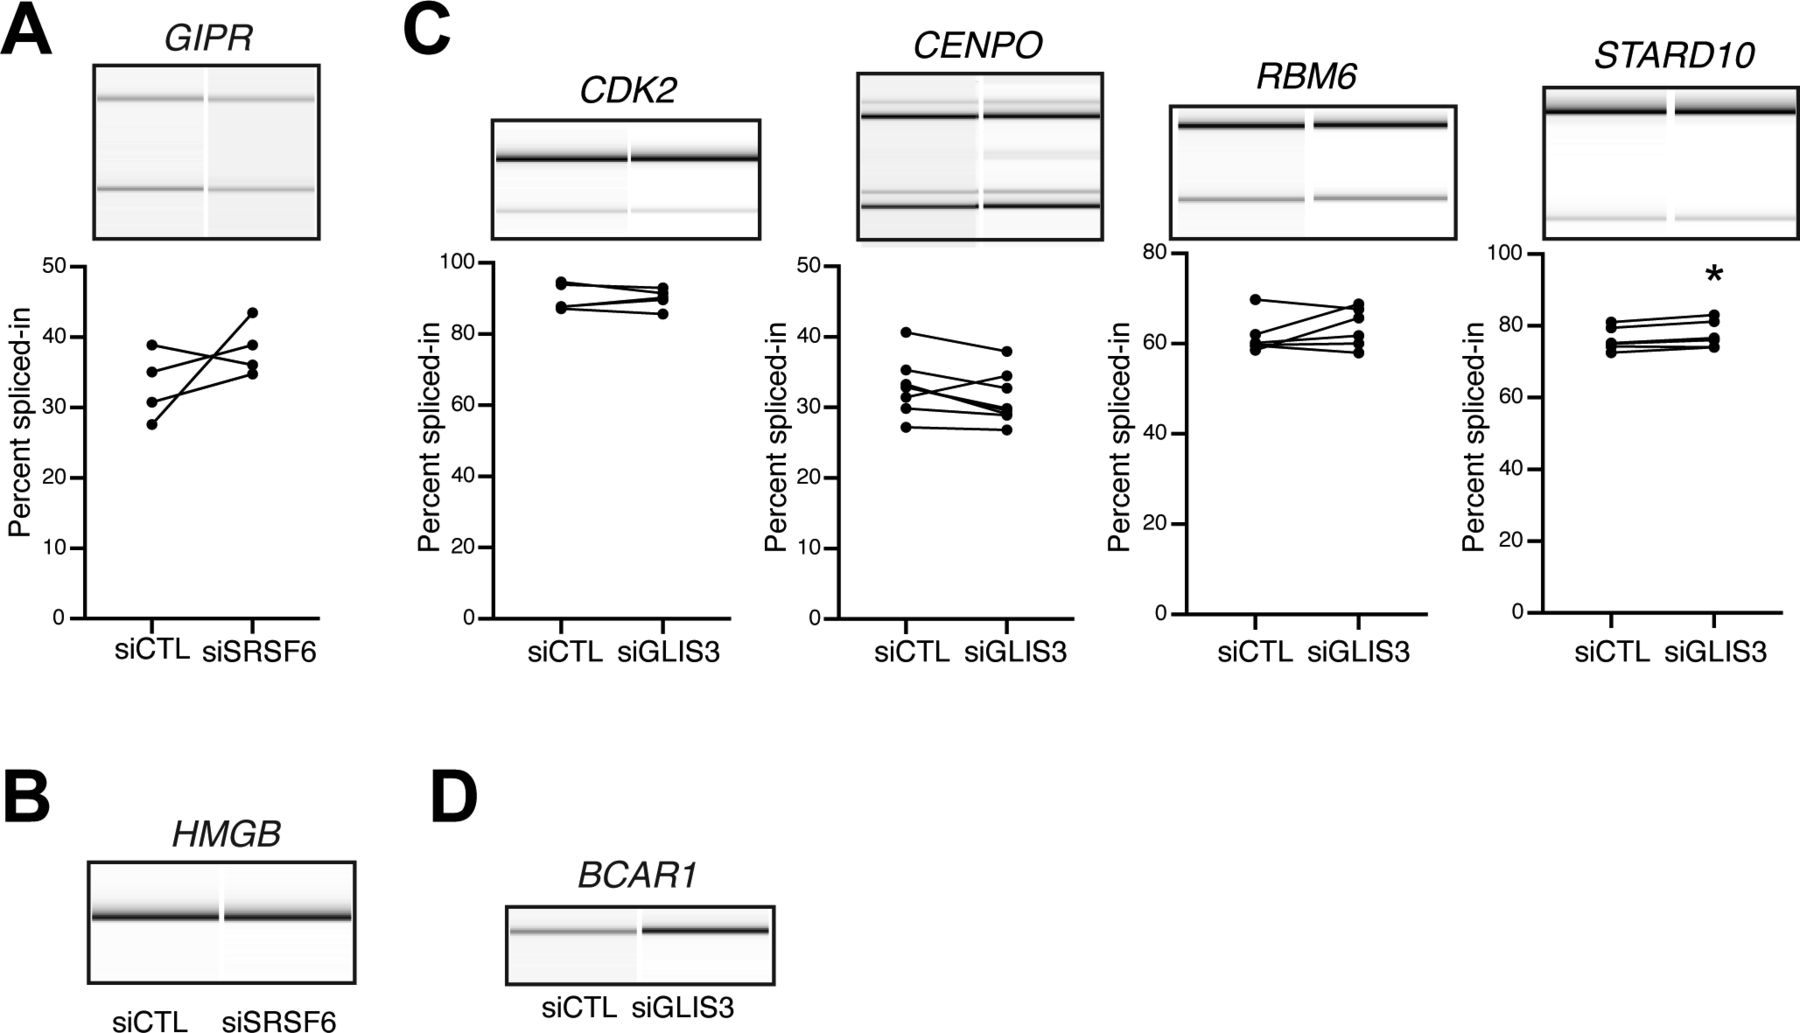
- Figure S6. Impact of SRSF6 and GLIS3 down-regulation on the splicing of diabetes susceptibility genes.
(A, B) Alternative splicing events in the diabetes susceptibility genes GIPR and HMGB that were detected by RNA-seq following SRSF6 KD in EndoC-βH1 cells. Semiquantitative RT-PCR analysis for GIPR did not show a statistically significant difference between the two conditions. RT-PCR amplification for HMGB only yielded one PCR amplicon. Representative digital gel images (top) and quantification (GIPR) are shown. (C, D) The alternative splicing events in the diabetes susceptibility genes CDK2, CENPO, and RBM6 show no significant differences between control conditions (siCTL) and GLIS3 KD (siGLIS3). The event in STARD10 shows a statistically significant change in the opposite direction as observed after SRSF6 KD (Fig 4E). The presence of only one band for the BCAR1 precludes detection of alternative splicing changes. Visualization as in (A).
Source data are available for this figure.
Source Data for Figure S6[LSA-2020-00825_SdataFS6.xlsx]
- Figure S7. Predicted impact of SRSF6 on diabetes susceptibility genes expression.
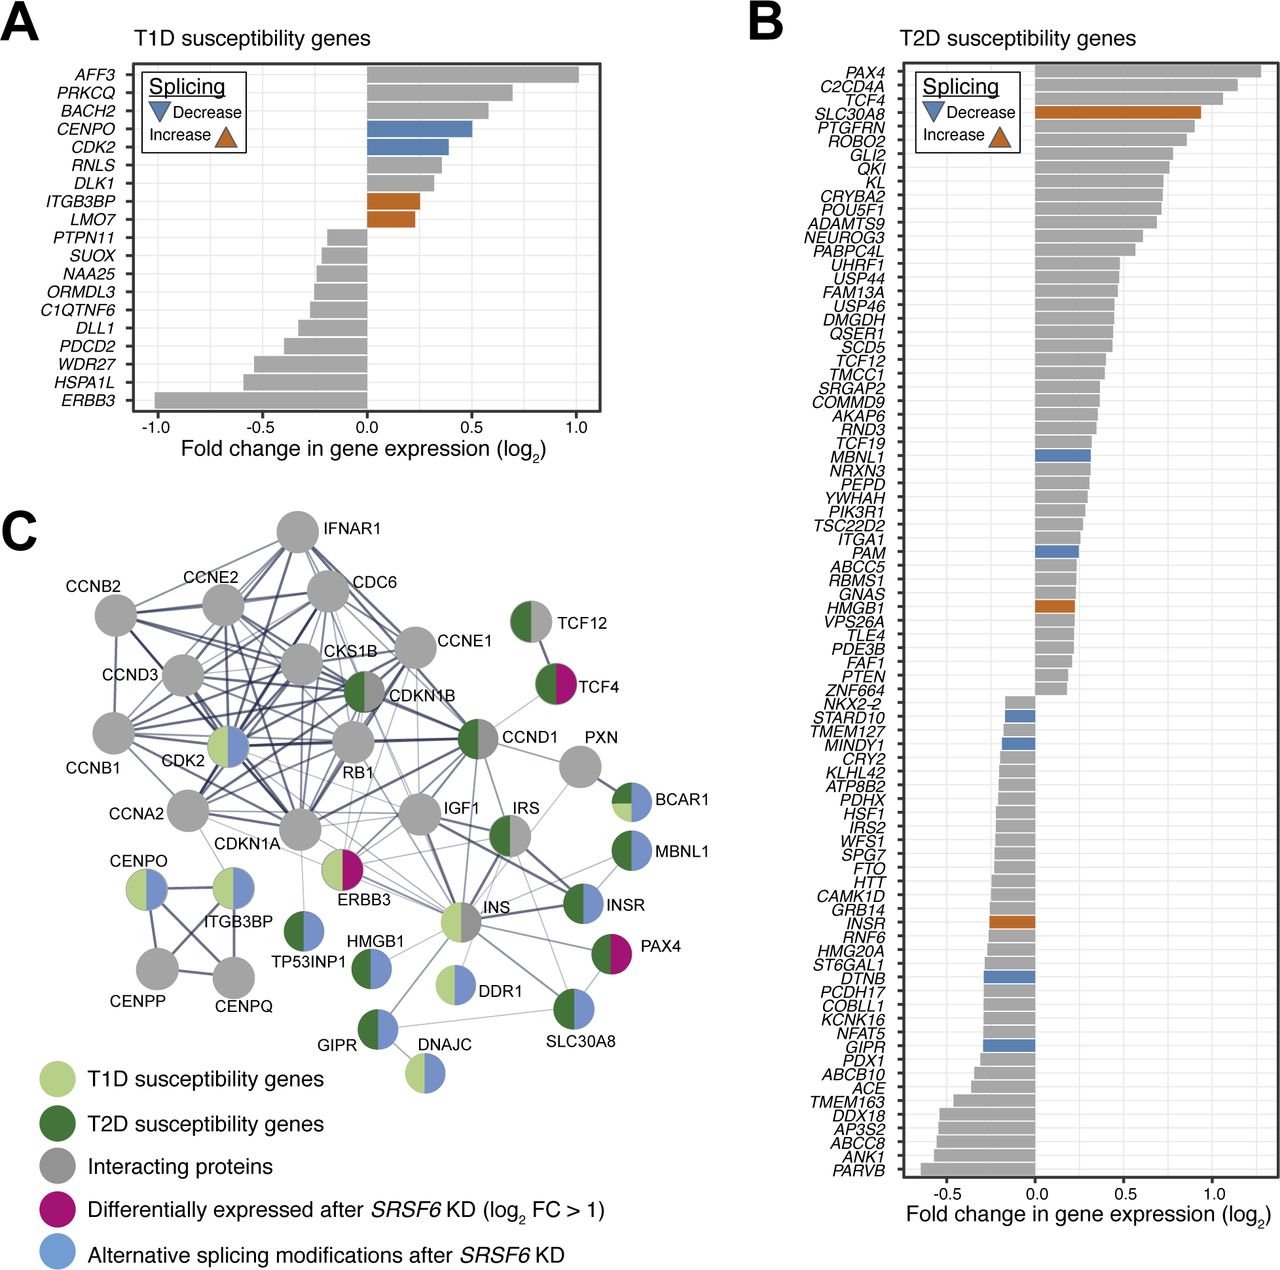
(A, B) SRSF6 KD affects expression of nine T1D (A) and 81 T2D (B) susceptibility genes in EndoC-βH1 cells. Some of these differentially expressed genes also harbor SRSF6-regulated splicing events. Bar charts depict log2-transformed fold-changes of differentially expressed diabetes susceptibility genes (adjusted P-value < 0.001). Genes with additional alternatively spliced exons are colored. (C) Proteins encoded by SRSF6-regulated diabetes susceptibility genes form a protein–protein interaction network which bridges functionally related proteins, including further diabetes susceptibility genes, namely TCF12, CDKN1B, CCND1, INS, and IRS. Protein–protein interaction network was obtained using STRING version 11.0 (https://string-db.org/), using as input 29 T1D and T2D susceptibility genes with significant alternative splicing and/or differential expression (with absolute log2-transformed fold-change >1) after SRSF6 KD.
- Figure 5. SRSF6 acts downstream of GLIS3 and affects the splicing of diabetes susceptibility genes.
(A) SRSF6 gene expression correlates with GLIS3 gene expression in human pancreatic tissue samples. Scatter plot compares gene expression (log2-transformed transcripts per million, TPM) in pancreas samples of 127 healthy individuals from the Genotype-Tissue Expression (GTEx) database. Linear regression line (blue) with 95% confidence interval (gray corridor), Pearson correlation coefficient and associated P-value are indicated. (B) GLIS3 was depleted in EndoC-βH1 cells by transfection with control (siCTL) or specific siRNA targeting GLIS3 (siGLIS3) for 48 h. GLIS3 mRNA expression was measured by quantitative real-time PCR (qRT-PCR) and normalized by the housekeeping gene β-actin. Mean ± SEM are shown for six independent experiments. (C) GLIS3 depletion increases EndoC-βH1 cell apoptosis. Percentage of dead cells was counted after Hoechst and propidium iodine staining. Apoptosis was confirmed by microscopic evaluation of cell morphology and chromatin condensation. Mean ± SEM are shown for eight independent experiments. (D) SRSF6 mRNA expression is decreased after GLIS3 depletion. SRSF6 mRNA expression was measured by qRT-PCR and normalized to β-actin. Mean ± SEM are shown for six independent experiments. (E) GLIS3 depletion promotes alternative exon inclusion in the T1D susceptibility genes LMO7 and ITGB3BP. Exon inclusion was quantified by semiquantitative RT-PCR and capillary gel electrophoresis. Representative digital gel images and quantification of paired individual data points for six independent experiments are shown. *P < 0.05, **P < 0.01, and *** P < 0.001 against siCTL, paired t test.
Source data are available for this figure.
Source Data for Figure 5[LSA-2020-00825_SdataF5.xlsx]
- Figure 6. Antisense oligonucleotides promote LMO7 exon 10 skipping in EndoC-βH1 cells.
(A) SRSF6 binds LMO7 and suppresses inclusion of exon 10. Genome browser view depicts SRSF6 iCLIP data (merged replicates) and binding sites (green, with motif; gray, without motif) together with RNA-seq read coverage from control and SRSF6 KD EndoC-βH1 cells. Lines indicate exon-exon junctions with numbers of supporting reads. In line with the global RNA splicing map for SRSF6 (Fig 3C), SRSF6 binding in the preceding constitutive exon down-regulates LMO7 exon 10 inclusion. (B) Pro-inflammatory conditions increase LMO7 exon 10 inclusion. Quantification of semiquantitative RT-PCR for LMO7 exon 10 inclusion under basal conditions (NT, not treated) and after exposure to pro-inflammatory cytokines (IL1β + IFNγ) for 48 h. Paired individual data points are shown for six independent experiments. **P-value < 0.01, paired t test. (C) LMO7 gene expression goes up in EndoC-βH1 cells exposed to IL1β + IFNγ. Analysis of LMO7 gene expression (RPKM, reads per kilobase per million mapped reads) in published RNA-seq data (n = 5) (Ramos-Rodríguez et al, 2019). **P-value < 0.01, paired t test. (D) Antisense oligonucleotides (ASOs) were designed to target the 3′ and 5′ splice site of LMO7 exon 10 (ASO-3ss and ASO-5ss, respectively). Schematic representation of the pre-mRNA sequence of LMO7 exon 10 and flanking intronic regions. Annealing of the ASOs to the indicated positions is predicted to interfere with splice site recognition and thereby to reduce LMO7 exon 10 inclusion. (E) Targeting the splice sites decreases inclusion of LMO7 exon 10, most prominently with ASO-5ss at 200 μM. The bar chart depicts quantification of LMO7 exon 10 inclusion after transfection with different ASO concentrations (10, 50, and 200 μM) for 48 h. Mean ± SEM and individual data points are shown for semiquantitative RT-PCR measurements (n = 6). ANOVA followed by Bonferroni correction was used to compare three ASOs at each concentration. ****P-value < 0.0001. (F) ASOs promote LMO7 exon 10 skipping in presence of SRSF6 KD. Representative digital gel images (top) and quantification (bottom) of semiquantitative RT-PCR in ASO-treated EndoC-βH1 cells under control conditions (siCTL) and after SRSF6 KD (siSRSF6), co-transfected for 48 h with 50 μM of ASO-Ctrl, ASO-5ss, or ASO-3ss. Results are mean ± SEM of six independent experiments. ANOVA followed by Bonferroni correction was used to compare three ASOs in control or after SRSF6 KD. **P-value < 0.01.
Source data are available for this figure.
Source Data for Figure 6[LSA-2020-00825_SdataF6.xlsx]


Supplementary Materials
Table S4 List of siRNAs used.
Supplemental Data 1.
The script files contain the custom code to: (1) define reproducible binding sites from the SRSF6 iCLIP data (BindingSiteDefinition.R), (2) analyze the motif content around SRSF6 binding sites (MotifDefinition.R), (3) filter the rMATS output for significantly alternatively spliced exons (AsEventDefinition.R), (4) count crosslink events around regulated exons and draw the RNA splicing map (RnaMap.R). Each script has an associated function script with the required function definitions.[LSA-2020-00825_Supplemental_Data_1.zip]


