Advertisement

Main menu

  • Home
  • Articles
    • Newest Articles
    • Current Issue
    • Methods & Resources
    • Author Interviews
    • Archive
    • Subjects
  • Collections
  • Submit
    • Submit a Manuscript
    • Author Guidelines
    • License, Copyright, Fee
    • FAQ
    • Why submit
  • About
    • About Us
    • Editors & Staff
    • Board Members
    • Licensing and Reuse
    • Reviewer Guidelines
    • Privacy Policy
    • Advertise
    • Contact Us
    • LSA LLC
  • Alerts
  • Other Publications
    • EMBO Press
    • The EMBO Journal
    • EMBO reports
    • EMBO Molecular Medicine
    • Molecular Systems Biology
    • Rockefeller University Press
    • Journal of Cell Biology
    • Journal of Experimental Medicine
    • Journal of General Physiology
    • Journal of Human Immunity
    • Cold Spring Harbor Laboratory Press
    • Genes & Development
    • Genome Research

User menu

  • My alerts

Search

  • Advanced search
Life Science Alliance
  • Other Publications
    • EMBO Press
    • The EMBO Journal
    • EMBO reports
    • EMBO Molecular Medicine
    • Molecular Systems Biology
    • Rockefeller University Press
    • Journal of Cell Biology
    • Journal of Experimental Medicine
    • Journal of General Physiology
    • Journal of Human Immunity
    • Cold Spring Harbor Laboratory Press
    • Genes & Development
    • Genome Research
  • My alerts
Life Science Alliance

Advanced Search

  • Home
  • Articles
    • Newest Articles
    • Current Issue
    • Methods & Resources
    • Author Interviews
    • Archive
    • Subjects
  • Collections
  • Submit
    • Submit a Manuscript
    • Author Guidelines
    • License, Copyright, Fee
    • FAQ
    • Why submit
  • About
    • About Us
    • Editors & Staff
    • Board Members
    • Licensing and Reuse
    • Reviewer Guidelines
    • Privacy Policy
    • Advertise
    • Contact Us
    • LSA LLC
  • Alerts
  • Follow LSA on Bluesky
  • Follow lsa Template on Twitter
Research Article
Transparent Process
Open Access

Profiling of immune dysfunction in COVID-19 patients allows early prediction of disease progression

André F Rendeiro, Joseph Casano, Charles Kyriakos Vorkas, Harjot Singh, Ayana Morales, View ORCID ProfileRobert A DeSimone, View ORCID ProfileGrant B Ellsworth, Rosemary Soave, Shashi N Kapadia, Kohta Saito, View ORCID ProfileChristopher D Brown, JingMei Hsu, Christopher Kyriakides, Steven Chiu, View ORCID ProfileLuca Vincenzo Cappelli, Maria Teresa Cacciapuoti, Wayne Tam, Lorenzo Galluzzi, Paul D Simonson, Olivier Elemento  Correspondence email, View ORCID ProfileMirella Salvatore  Correspondence email, View ORCID ProfileGiorgio Inghirami  Correspondence email
André F Rendeiro
1Institute of Computational Biomedicine, Weill Cornell Medicine, New York, NY, USA
2Caryl and Israel Englander Institute for Precision Medicine, Weill Cornell Medicine, New York, NY, USA
  • Find this author on Google Scholar
  • Find this author on PubMed
  • Search for this author on this site
Joseph Casano
3Department of Pathology and Laboratory Medicine, Weill Cornell Medicine, New York, NY, USA
  • Find this author on Google Scholar
  • Find this author on PubMed
  • Search for this author on this site
Charles Kyriakos Vorkas
4Division of Infectious Diseases, Department of Medicine, Weill Cornell Medicine, New York, NY, USA
  • Find this author on Google Scholar
  • Find this author on PubMed
  • Search for this author on this site
Harjot Singh
4Division of Infectious Diseases, Department of Medicine, Weill Cornell Medicine, New York, NY, USA
  • Find this author on Google Scholar
  • Find this author on PubMed
  • Search for this author on this site
Ayana Morales
4Division of Infectious Diseases, Department of Medicine, Weill Cornell Medicine, New York, NY, USA
  • Find this author on Google Scholar
  • Find this author on PubMed
  • Search for this author on this site
Robert A DeSimone
3Department of Pathology and Laboratory Medicine, Weill Cornell Medicine, New York, NY, USA
  • Find this author on Google Scholar
  • Find this author on PubMed
  • Search for this author on this site
  • ORCID record for Robert A DeSimone
Grant B Ellsworth
4Division of Infectious Diseases, Department of Medicine, Weill Cornell Medicine, New York, NY, USA
  • Find this author on Google Scholar
  • Find this author on PubMed
  • Search for this author on this site
  • ORCID record for Grant B Ellsworth
Rosemary Soave
4Division of Infectious Diseases, Department of Medicine, Weill Cornell Medicine, New York, NY, USA
  • Find this author on Google Scholar
  • Find this author on PubMed
  • Search for this author on this site
Shashi N Kapadia
4Division of Infectious Diseases, Department of Medicine, Weill Cornell Medicine, New York, NY, USA
5Department of Population Health Sciences, Weill Cornell Medicine, New York, NY, USA
  • Find this author on Google Scholar
  • Find this author on PubMed
  • Search for this author on this site
Kohta Saito
4Division of Infectious Diseases, Department of Medicine, Weill Cornell Medicine, New York, NY, USA
  • Find this author on Google Scholar
  • Find this author on PubMed
  • Search for this author on this site
Christopher D Brown
4Division of Infectious Diseases, Department of Medicine, Weill Cornell Medicine, New York, NY, USA
  • Find this author on Google Scholar
  • Find this author on PubMed
  • Search for this author on this site
  • ORCID record for Christopher D Brown
JingMei Hsu
6Division of Hematology/Oncology, Department of Medicine Weill Cornell Medicine, New York, NY, USA
  • Find this author on Google Scholar
  • Find this author on PubMed
  • Search for this author on this site
Christopher Kyriakides
7Department of Rehabilitation Medicine at New York University Grossman School of Medicine New York, NY, USA
  • Find this author on Google Scholar
  • Find this author on PubMed
  • Search for this author on this site
Steven Chiu
3Department of Pathology and Laboratory Medicine, Weill Cornell Medicine, New York, NY, USA
  • Find this author on Google Scholar
  • Find this author on PubMed
  • Search for this author on this site
Luca Vincenzo Cappelli
3Department of Pathology and Laboratory Medicine, Weill Cornell Medicine, New York, NY, USA
  • Find this author on Google Scholar
  • Find this author on PubMed
  • Search for this author on this site
  • ORCID record for Luca Vincenzo Cappelli
Maria Teresa Cacciapuoti
3Department of Pathology and Laboratory Medicine, Weill Cornell Medicine, New York, NY, USA
  • Find this author on Google Scholar
  • Find this author on PubMed
  • Search for this author on this site
Wayne Tam
3Department of Pathology and Laboratory Medicine, Weill Cornell Medicine, New York, NY, USA
  • Find this author on Google Scholar
  • Find this author on PubMed
  • Search for this author on this site
Lorenzo Galluzzi
2Caryl and Israel Englander Institute for Precision Medicine, Weill Cornell Medicine, New York, NY, USA
8Department of Radiation Oncology, Weill Cornell Medical College, New York, NY, USA
9Sandra and Edward Meyer Cancer Center, New York, NY, USA
10Department of Dermatology, Yale School of Medicine, New Haven, CT, USA
  • Find this author on Google Scholar
  • Find this author on PubMed
  • Search for this author on this site
Paul D Simonson
3Department of Pathology and Laboratory Medicine, Weill Cornell Medicine, New York, NY, USA
  • Find this author on Google Scholar
  • Find this author on PubMed
  • Search for this author on this site
Olivier Elemento
1Institute of Computational Biomedicine, Weill Cornell Medicine, New York, NY, USA
2Caryl and Israel Englander Institute for Precision Medicine, Weill Cornell Medicine, New York, NY, USA
  • Find this author on Google Scholar
  • Find this author on PubMed
  • Search for this author on this site
  • For correspondence: ole2001@med.cornell.edu
Mirella Salvatore
5Department of Population Health Sciences, Weill Cornell Medicine, New York, NY, USA
11Division of Public Health Programs, Department of Medicine, Weill Cornell Medicine, New York, NY, USA
  • Find this author on Google Scholar
  • Find this author on PubMed
  • Search for this author on this site
  • ORCID record for Mirella Salvatore
  • For correspondence: mis2053@med.cornell.edu
Giorgio Inghirami
3Department of Pathology and Laboratory Medicine, Weill Cornell Medicine, New York, NY, USA
  • Find this author on Google Scholar
  • Find this author on PubMed
  • Search for this author on this site
  • ORCID record for Giorgio Inghirami
  • For correspondence: ggi9001@med.cornell.edu
Published 24 December 2020. DOI: 10.26508/lsa.202000955
  • Article
  • Figures & Data
  • Info
  • Metrics
  • Reviewer Comments
  • PDF
Loading

Article Figures & Data

Figures

  • Supplementary Materials
  • Figure 1.
    • Download figure
    • Open in new tab
    • Download powerpoint
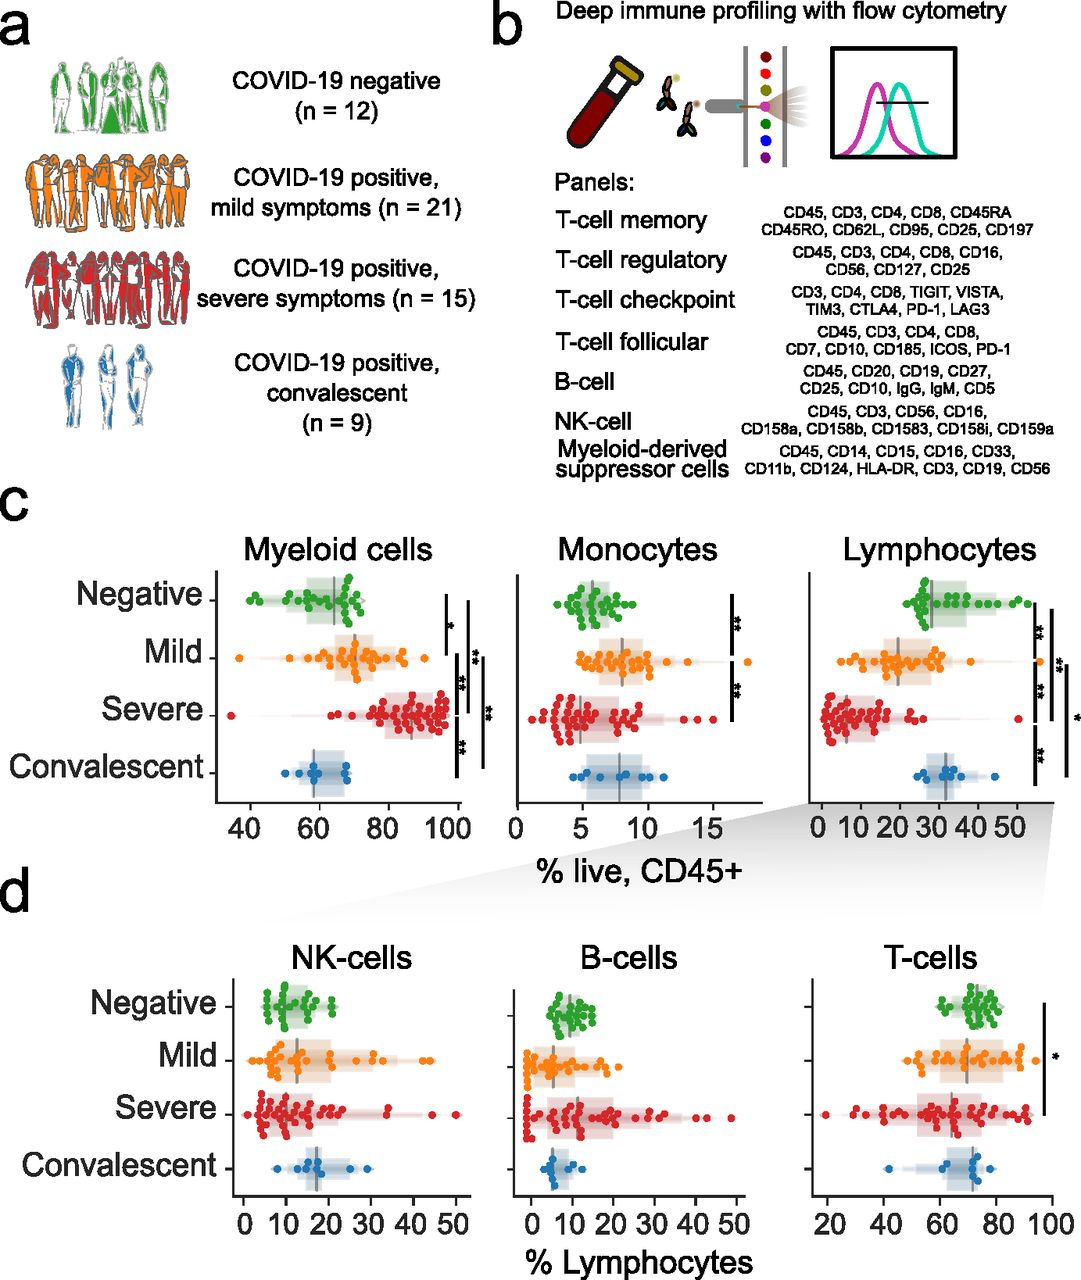
    Figure 1. Immunoprofiling of COVID-19 patients reveals a disarrayed immune system.

    (A) Composition of the study cohort. (B) Description of immune panels and their target epitopes. (C) Composition of major immune compartments as a percentage of all live CD45+ cells. (D) Abundance of major lymphoid compartments as a percentage of all lymphocytes. For (C) and (D), the upper panels divide patients by general disease status and three lower panels further divide the study subjects by clinical intervention or outcome. Significance was assessed using Mann–Whitney U tests and corrected for multiple testing with the Benjamini–Hochberg false discovery rate (FDR). **FDR-adjusted P-value < 0.01; *FDR-adjusted P-value of 0.01–0.05.

  • Figure S1.
    • Download figure
    • Open in new tab
    • Download powerpoint
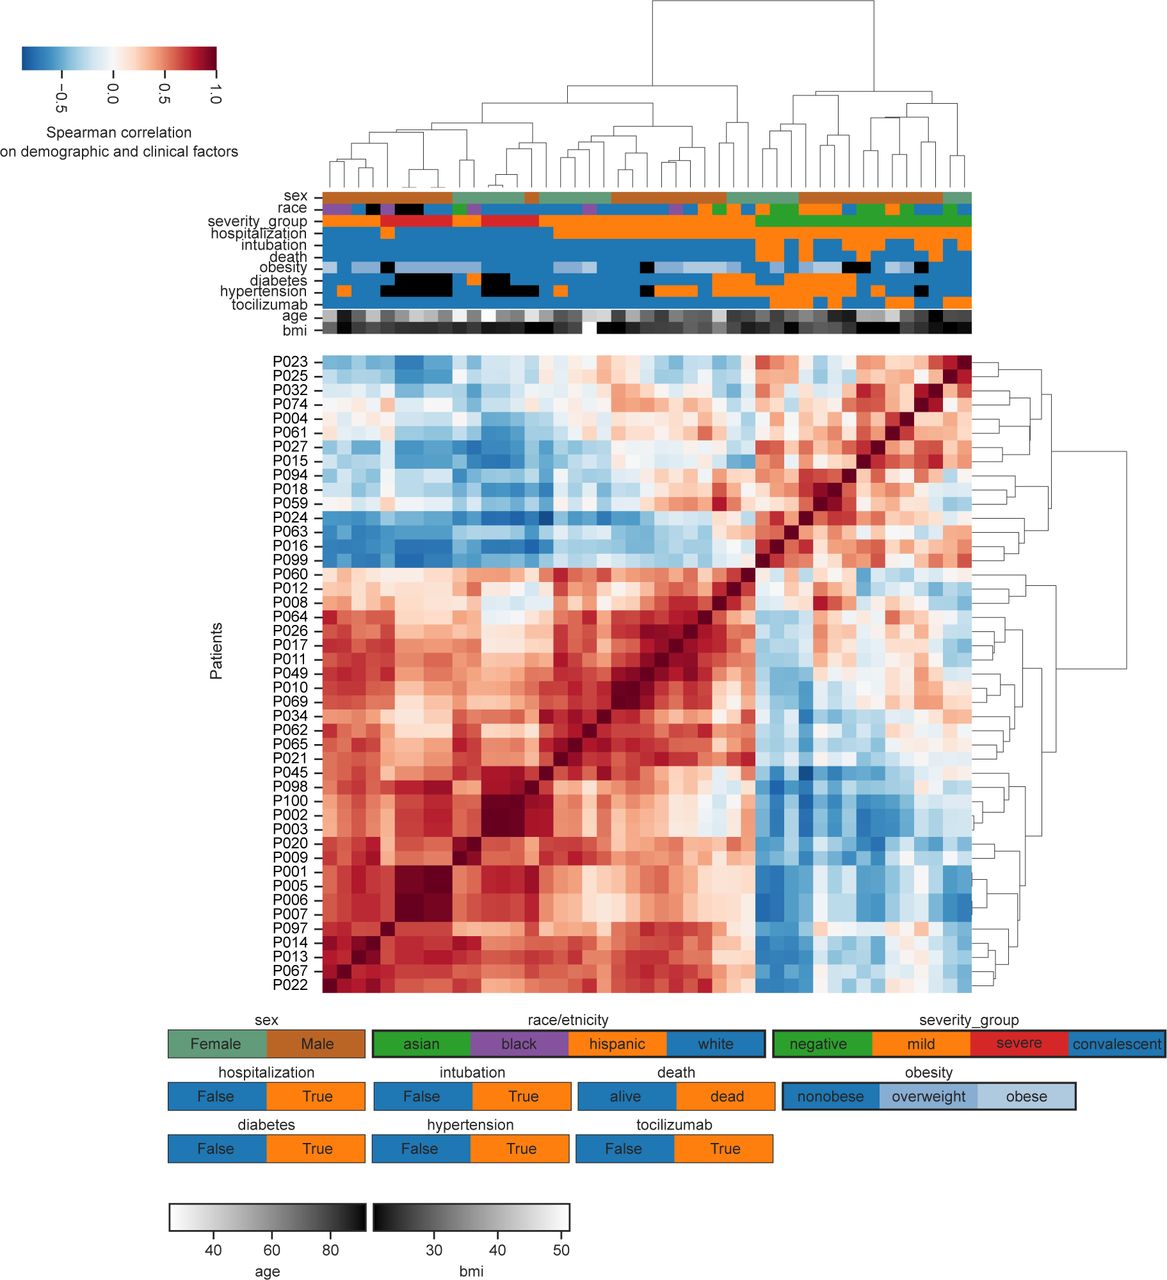
    Figure S1. Relationship between patient demographics and clinical factors.

    Hierarchical clustering of patients based exclusively on demographic or clinical factors.

  • Figure S2.
    • Download figure
    • Open in new tab
    • Download powerpoint
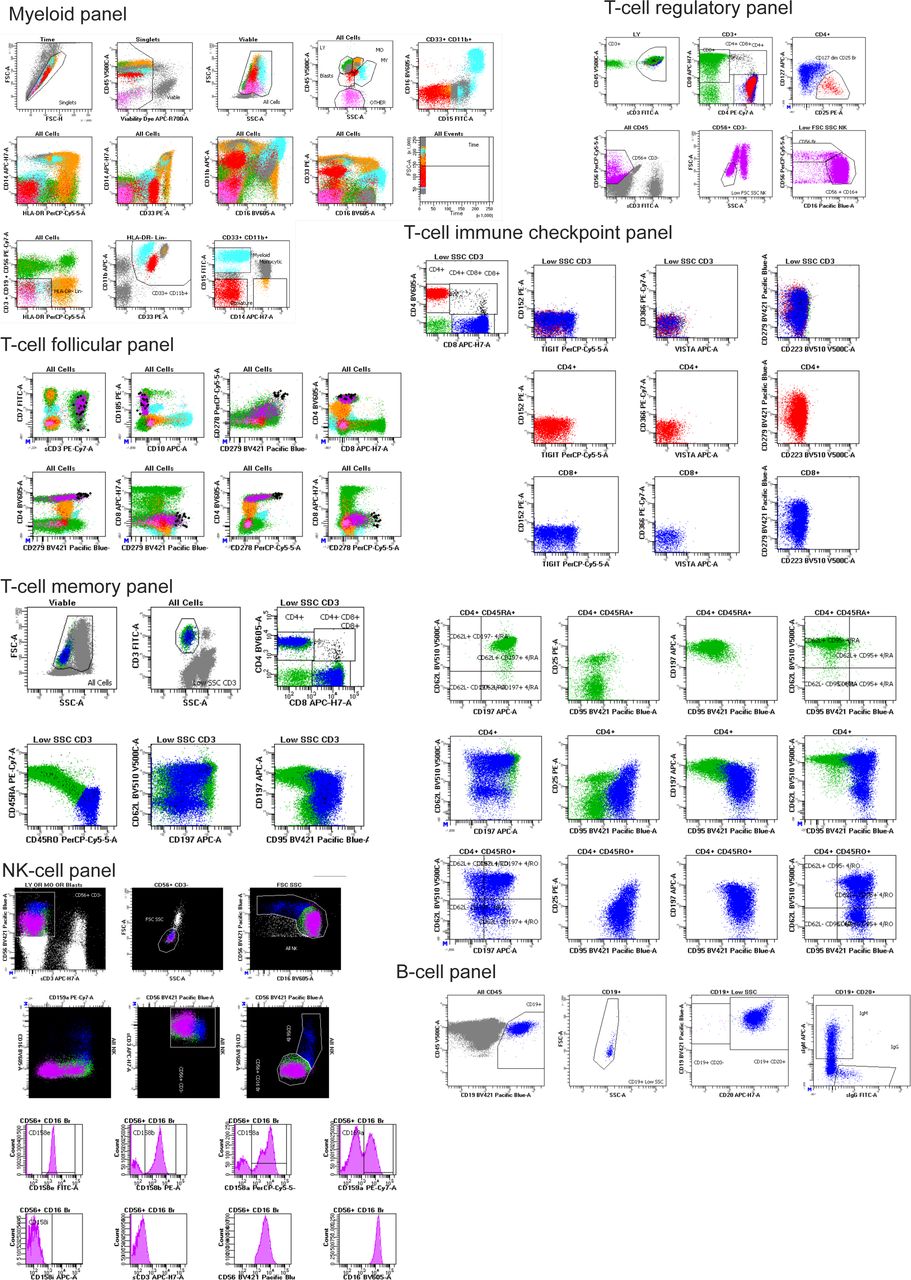
    Figure S2. Gating strategies employed for all seven flow cytometry panels.

    Gated cell populations are labeled with text positioned on top or next to the respective population. Forward/side scatter and gating of major immune populations is demonstrated only in the myeloid panel.

  • Figure 2.
    • Download figure
    • Open in new tab
    • Download powerpoint
    Figure 2. T cells from COVID-19 patients have high levels of CD25, FAS, and exhaustion markers.

    (A) The ratio of CD4 to CD8 cells is dependent on disease state and clinical intervention. (B) The abundance of CD45RA/RO cells in either CD4+ or CD8+ compartments is dependent on disease state or clinical intervention. (C) Abundance of immune populations changes significantly between disease states. (D) Uniform Manifold Approximation and Projection (UMAP) projection of all cells colored by either surface receptor expression, cluster assignment, or disease severity. (E) Immune phenotype of each cluster (top) and its composition in disease severity (bottom). (F) Expression levels of CD25 and FAS receptors in the UMAP projection. (G) FAS expression across all clusters depending on disease severity (left) and the proportion of cells not expressing FAS for each sample (right). (H) Scatter plot of CD25 and FAS expression for each cell according to disease severity. (I) Abundance of CD4+ CXCR5+ PD-1+ TFH by disease severity. (J) Immune populations with significantly different amounts of cells expressing immune checkpoint receptors by disease severity. Significance was assessed by Mann–Whitney U tests and corrected for multiple testing with the Benjamini–Hochberg false discovery rate (FDR). **FDR-adjusted P-value < 0.01; *FDR-adjusted P-value 0.01–0.05.

  • Figure S3.
    • Download figure
    • Open in new tab
    • Download powerpoint
    Figure S3. Changes in TREG and TFH with COVID-19.

    (A) Abundance of follicular populations according to disease severity. (B) Gating strategy used for alternative quantification of TFHs. (C) Abundance of TREG populations according to disease severity. Significance was assessed using Mann–Whitney U tests and corrected for multiple testing with Benjamini–Hochberg false discovery rate (FDR). **FDR-adjusted P-value < 0.01; *FDR-adjusted P-value 0.01–0.05.

  • Figure 3.
    • Download figure
    • Open in new tab
    • Download powerpoint
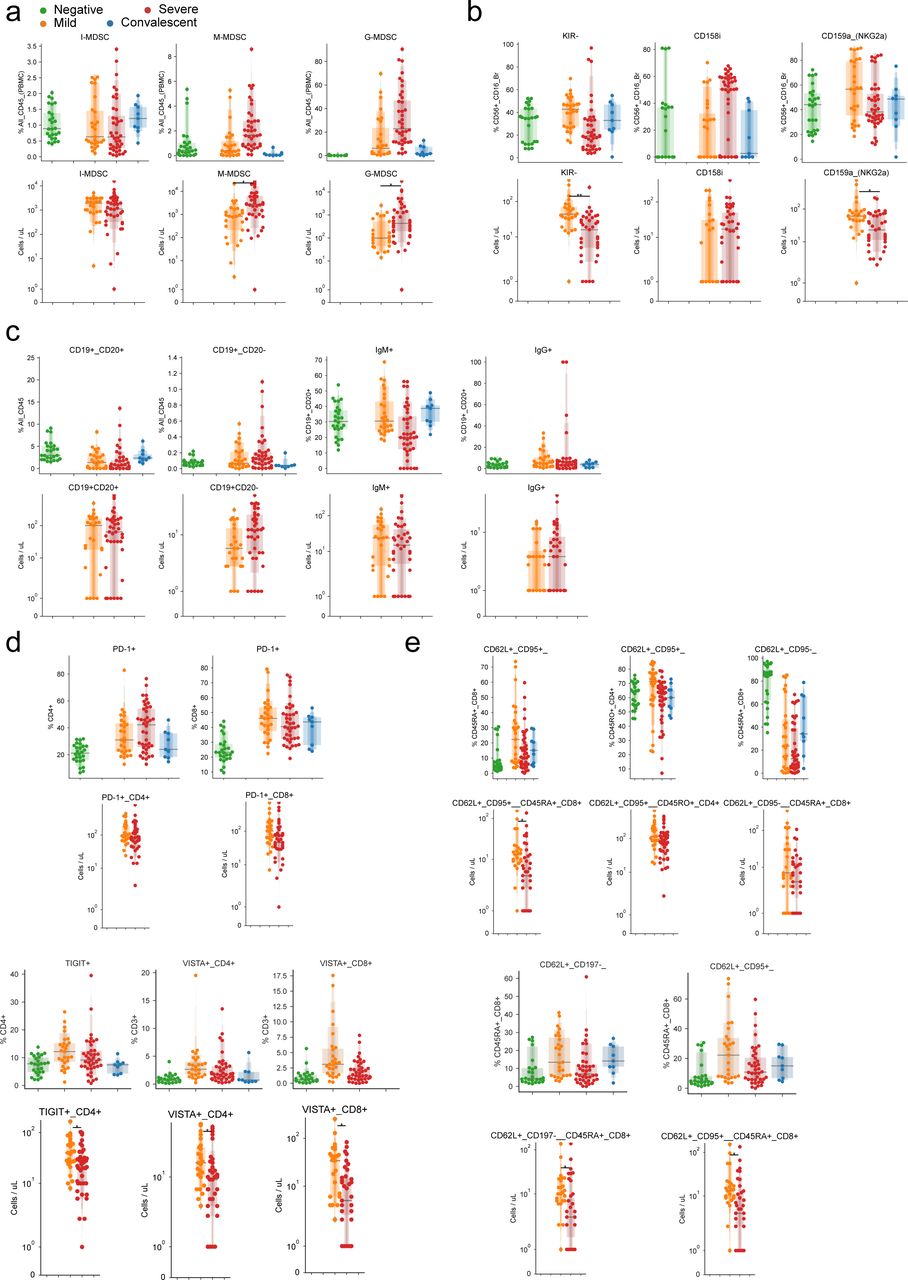
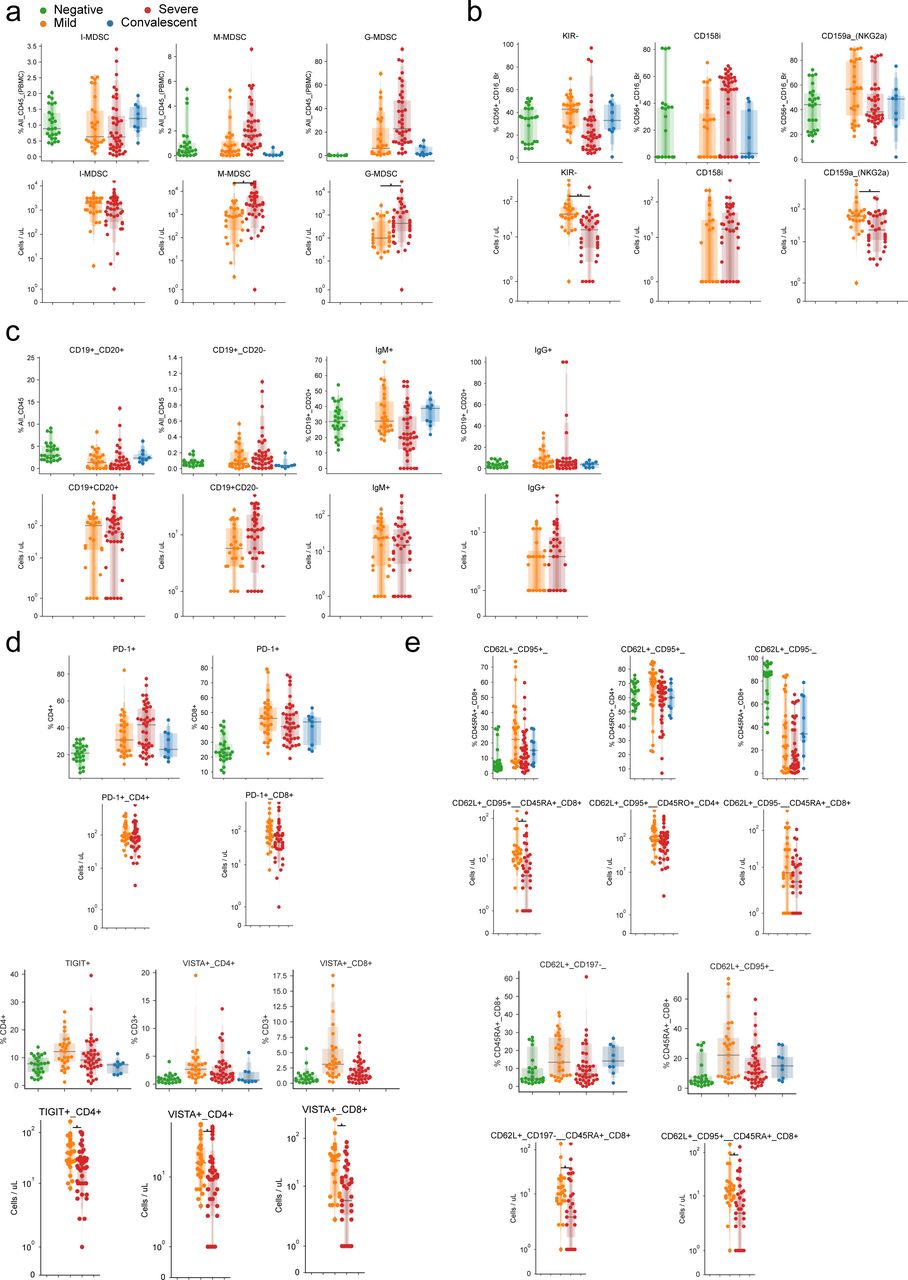
    Figure 3. Emergence of granulocytic myeloid-derived suppressor cells and preferential expression of specific NK cell receptors in the innate immune system of COVID-19 patients.

    (A) Abundance of myeloid-derived suppressor cells as a percentage of all immune cells according to disease severity. (B) Uniform Manifold Approximation and Projection (UMAP) projection of all cells from all patients colored by the expression levels of surface receptors, derived clusters, or disease severity among all patients. (B, C) Immune profile of each cluster from (B) based on the expression of surface markers (top) and composition in disease severity (bottom). (D) Expression levels of CD15 dependent on disease severity (left) and quantification of cells expressing it (right) according to CD16, CD3, and CD33 expression. (E) Abundance of cells expressing various KIR receptors as a percentage of NK cells according to disease severity. (F) UMAP projection of all cells from all patients colored by the expression of surface receptors, derived clusters, or disease severity. (F, G) Immune profile of each cluster from (F) based on the expression of surface markers (top) and composition in disease severity (bottom). (H) Expression levels of all four measured KIR receptors in each disease state. Significance was assessed using Mann–Whitney U tests and corrected for multiple testing with the Benjamini–Hochberg false discovery rate (FDR). **FDR-adjusted P-value < 0.01; *FDR-adjusted P-value 0.01–0.05.

  • Figure S4.
    • Download figure
    • Open in new tab
    • Download powerpoint
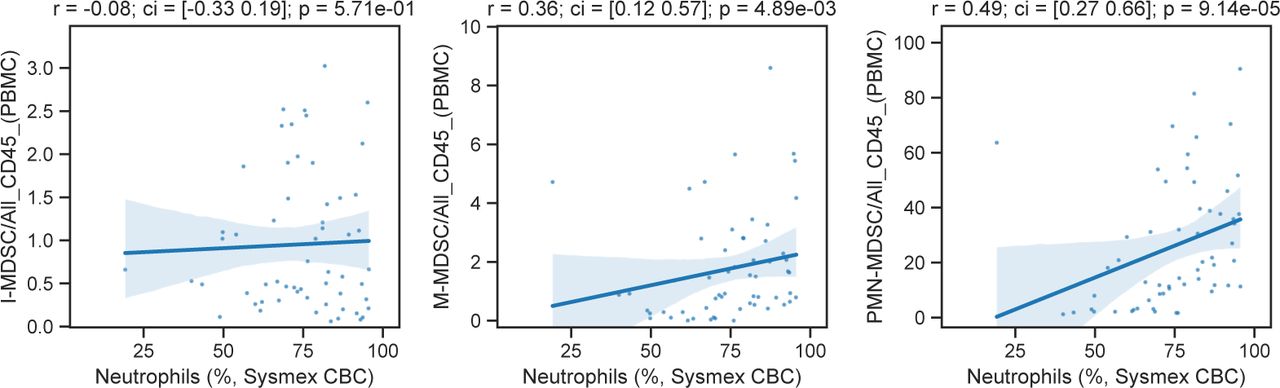
    Figure S4. Comparison of the abundance of myeloid-derived suppressor cells and neutrophils.

    Scatterplot of myeloid-derived suppressor cell populations compared with neutrophil abundance, as measured in complete blood counts.

  • Figure 4.
    • Download figure
    • Open in new tab
    • Download powerpoint
    Figure 4. B cells of COVID-19 patients are marked by a shift toward a plasmocytic IgM phenotype.

    (A, B) The abundance of total B cells, plasma, and IgG+ and IgG+ cells between disease states. (C) Uniform Manifold Approximation and Projection (UMAP) projection of all cells colored by surface receptor expression, cluster assignment, or disease severity. (D) Immunophenotype of each cluster (top) and its composition by disease severity (bottom). (E) Identification and quantification of five populations of B cells dependent on CD20 and CD19 expression. (E, F) Comparison of the abundance of the populations identified in (E) between disease states. Significance was assessed using Mann–Whitney U tests and corrected for multiple testing with Benjamini–Hochberg false discovery rate (FDR). **FDR-adjusted P-value < 0.01; *FDR-adjusted P-value 0.01–0.05.

  • Figure 5.
    • Download figure
    • Open in new tab
    • Download powerpoint
    Figure 5. Pseudo-temporal reconstitution of disease progression reveals a hierarchy of immune changes in COVID-19 disease.

    (A) Projection of immune profiles into a two-dimensional latent space that reconstructs the hierarchy of disease progression. The x-axis represents disease progression in the pseudo-temporal space. Sample from patients which died from COVID-19 are marked with a diagonal black line. (B) Distribution of samples grouped by disease state along the pseudo-temporal axis derived in (B). (C) Immune populations associated with the pseudo-temporal axis represented by either the absolute change in percentage in their extremes (x-axis) or strength of linear association (y-axis). (D) Clusters of immune populations based on their abundance along the pseudo-temporal axis. (D, E) Examples of immune populations from each cluster in (D).

  • Figure S5.
    • Download figure
    • Open in new tab
    • Download powerpoint
    Figure S5. Effect of demographic and clinical factors on immune cell populations in COVID-19 patients.

    (A) Hierarchically clustered heat map of estimated coefficients across all models. Cells with gray squares represent coefficients with Benjamini–Hochberg adjusted P-values < 0.05. (B) Scatter plot of patient age and lymphocyte abundance for each patient. (C) Coefficients of change estimated when comparing severe COVID-19 patients treated with the IL-6 inhibitor tocilizumab versus untreated severe patients. The top 10 immune populations in each direction of change are displayed.

  • Figure 6.
    • Download figure
    • Open in new tab
    • Download powerpoint
    Figure 6. Factors conditioning the immune response during COVID-19 and predicting disease severity.

    (A) Directed graph of clinical factors (green) and immune populations (pink). Edges represent the association between factors and immune populations and are colored by the direction and strength of association (blue, negative; red, positive). (B) Abundance of select immune populations with significantly different responses between sexes dependent on outcome. (C) Estimated coefficients of change for severe versus mild disease (left) or tocilizumab treatment (right) for immune populations that change discordantly. (D, E) Abundance of select immune populations with significantly different responses between sexes dependent on tocilizumab treatment (D) or intubation (E). (F) Graphical depiction of the machine-learning framework for predicting disease severity using the earliest available samples per patient and cross validation. (G, H) Performance of classifiers trained with real or randomly shuffled labels and either all immune populations (G) or with selection for the top most predictive eight populations (H). (I) Predicted severity scores over time since symptoms started for immune profiles from patients with at least three longitudinal sampling points. (G, J) Relative expression of CD25, CD45RA, and CD45RO over time in four patients from (G). **False discovery rate-adjusted P-value < 0.01; *false discovery rate-adjusted P-value 0.01–0.05.

  • Figure S6.
    • Download figure
    • Open in new tab
    • Download powerpoint
    Figure S6. Agreement between young and older cohorts of healthy donors in abundance of immune populations.

    (A) Age distribution between cohorts of healthy young donors (n = 12), healthy older individuals (n = 5), and COVID-19 patients. (B) Relative abundances of most prominent immune populations of relevance for cohorts of healthy donors and COVID-19 patients. Significance was assessed using Mann–Whitney U tests and corrected for multiple testing with Benjamini–Hochberg false discovery rate (FDR). **FDR-adjusted P-value < 0.01; *FDR-adjusted P-value 0.01–0.05.

  • Figure S7.
    • Download figure
    • Open in new tab
    • Download powerpoint
    Figure S7. Agreement between absolute and relative abundance of immune populations.

    (A, B, C, D, E) Comparison of relative (top) and absolute (bottom) abundances of (A) myeloid-derived suppressor cells, (B) NK cells, (C) B cells, (D) co-inhibitory receptors of T cells, and (E) T cell populations. Significance was assessed using Mann–Whitney U tests and corrected for multiple testing with Benjamini–Hochberg false discovery rate (FDR). **FDR-adjusted P-value < 0.01; *FDR-adjusted P-value 0.01–0.05.

Supplementary Materials

  • Figures
  • Table S1 Patient data summary.

  • Table S2 Patient metadata.

  • Table S3 Immune panels.

  • Table S4 Immune populations.

  • Table S5 NK imnune populations.

  • Table S6 PMN-MDSC/LY immune populations.

PreviousNext
Back to top
Download PDF
Email Article

Thank you for your interest in spreading the word on Life Science Alliance.

NOTE: We only request your email address so that the person you are recommending the page to knows that you wanted them to see it, and that it is not junk mail. We do not capture any email address.

Enter multiple addresses on separate lines or separate them with commas.
Profiling of immune dysfunction in COVID-19 patients allows early prediction of disease progression
(Your Name) has sent you a message from Life Science Alliance
(Your Name) thought you would like to see the Life Science Alliance web site.
CAPTCHA
This question is for testing whether or not you are a human visitor and to prevent automated spam submissions.
Citation Tools
COVID-19 immune profiling and prediction
André F Rendeiro, Joseph Casano, Charles Kyriakos Vorkas, Harjot Singh, Ayana Morales, Robert A DeSimone, Grant B Ellsworth, Rosemary Soave, Shashi N Kapadia, Kohta Saito, Christopher D Brown, JingMei Hsu, Christopher Kyriakides, Steven Chiu, Luca Vincenzo Cappelli, Maria Teresa Cacciapuoti, Wayne Tam, Lorenzo Galluzzi, Paul D Simonson, Olivier Elemento, Mirella Salvatore, Giorgio Inghirami
Life Science Alliance Dec 2020, 4 (2) e202000955; DOI: 10.26508/lsa.202000955

Citation Manager Formats

  • BibTeX
  • Bookends
  • EasyBib
  • EndNote (tagged)
  • EndNote 8 (xml)
  • Medlars
  • Mendeley
  • Papers
  • RefWorks Tagged
  • Ref Manager
  • RIS
  • Zotero
Share
COVID-19 immune profiling and prediction
André F Rendeiro, Joseph Casano, Charles Kyriakos Vorkas, Harjot Singh, Ayana Morales, Robert A DeSimone, Grant B Ellsworth, Rosemary Soave, Shashi N Kapadia, Kohta Saito, Christopher D Brown, JingMei Hsu, Christopher Kyriakides, Steven Chiu, Luca Vincenzo Cappelli, Maria Teresa Cacciapuoti, Wayne Tam, Lorenzo Galluzzi, Paul D Simonson, Olivier Elemento, Mirella Salvatore, Giorgio Inghirami
Life Science Alliance Dec 2020, 4 (2) e202000955; DOI: 10.26508/lsa.202000955
Twitter logo Facebook logo Mendeley logo
  • Tweet Widget
Issue Cover

In this Issue

Volume 4, No. 2
February 2021
  • Table of Contents
  • Cover (PDF)
  • About the Cover
  • Masthead (PDF)
Advertisement

Jump to section

  • Article
    • Abstract
    • Introduction
    • Results
    • Discussion
    • Materials and Methods
    • Data Availability
    • Acknowledgements
    • Footnotes
    • References
  • Figures & Data
  • Info
  • Metrics
  • Reviewer Comments
  • PDF

Subjects

  • Immunology
  • Medical Research
  • Microbiology, Virology & Host Pathogen Interaction

Related Articles

  • No related articles found.

Cited By...

  • High Frequencies of PD-1+TIM3+TIGIT+CTLA4+ Functionally Exhausted SARS-CoV-2-Specific CD4+ and CD8+ T Cells Associated with Severe Disease in Critically ill COVID-19 Patients
  • Patient commentary: How power imbalances in the narratives, research, and publications around long covid can harm patients
  • Plasma from patients with bacterial sepsis or severe COVID-19 induces production of suppressive myeloid cells from human hematopoietic progenitor cells in vitro
  • Systemic Tissue and Cellular Disruption from SARS-CoV-2 Infection revealed in COVID-19 Autopsies and Spatial Omics Tissue Maps
  • Google Scholar

More in this TOC Section

  • HU modulates thiol–disulfide homeostasis
  • GSK3A, a proviral host factor for HAdV-B7 replication
  • PSME3 regulates myogenesis
Show more Research Article

Similar Articles

EMBO Press LogoRockefeller University Press LogoCold Spring Harbor Logo

Content

  • Home
  • Newest Articles
  • Current Issue
  • Archive
  • Subject Collections

For Authors

  • Submit a Manuscript
  • Author Guidelines
  • License, copyright, Fee

Other Services

  • Alerts
  • Bluesky
  • X/Twitter
  • RSS Feeds

More Information

  • Editors & Staff
  • Reviewer Guidelines
  • Feedback
  • Licensing and Reuse
  • Privacy Policy

ISSN: 2575-1077
© 2025 Life Science Alliance LLC

Life Science Alliance is registered as a trademark in the U.S. Patent and Trade Mark Office and in the European Union Intellectual Property Office.