


Article Figures & Data
Figures
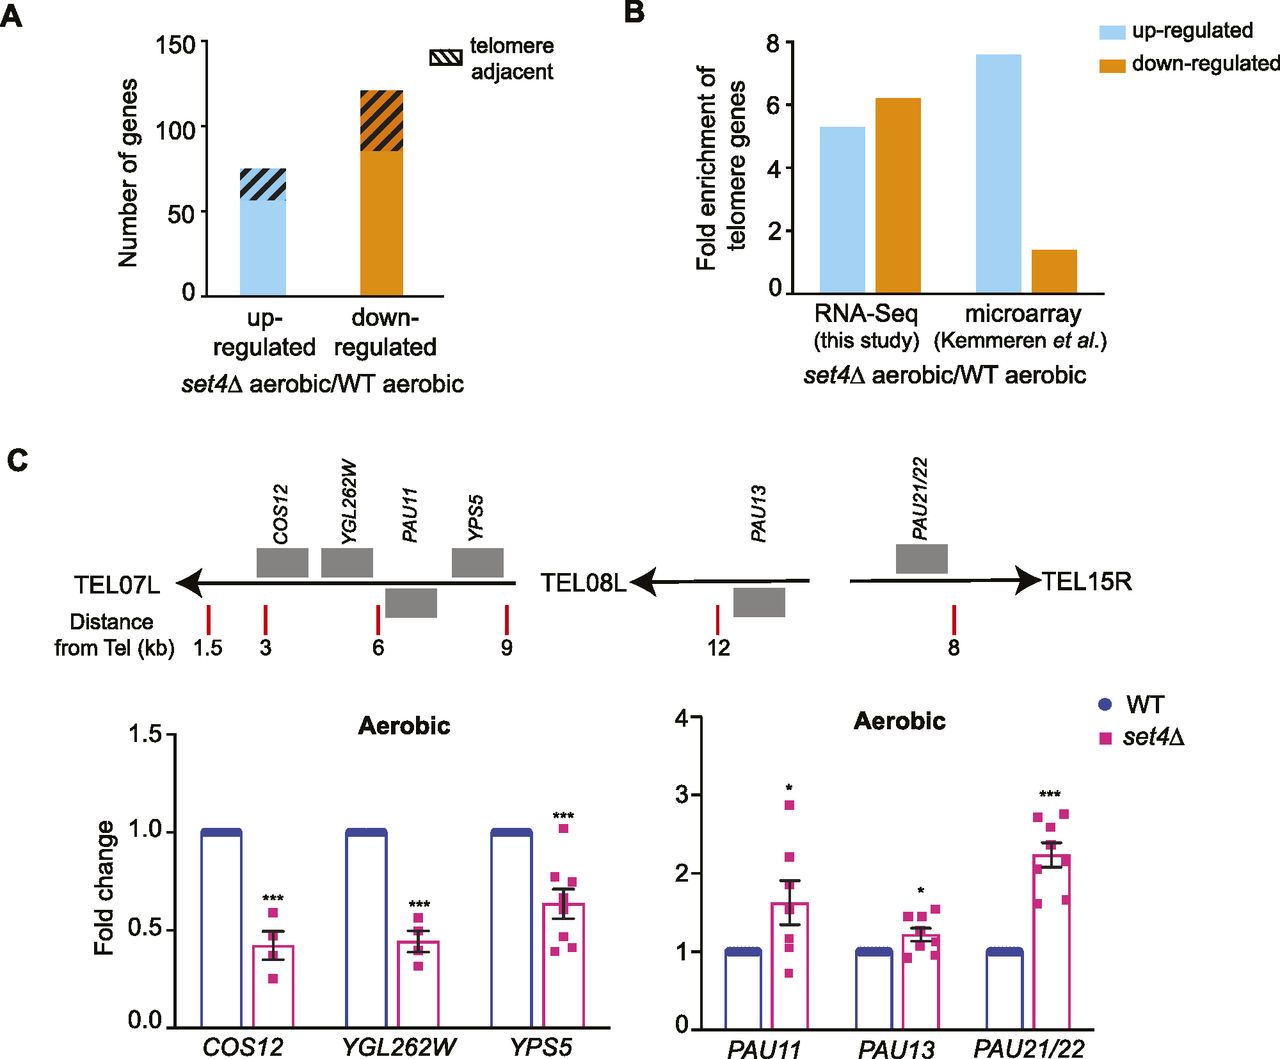
- Figure 1. Set4 regulates the expression of subtelomeric genes.
(A) The total number of genes identified as up- or down-regulated (FDR ≤ 0.05) from RNA-sequencing of set4Δ (yEG322) cells relative to wt (yEG001). Gene list provided in Table S1. The total number of telomere-enriched genes is indicated with the hashed box. (B) The fold enrichment of differentially expressed subtelomeric genes (defined as less than 40 kb from the chromosome end) in our RNA-sequencing data of set4Δ cells and in previously published microarray data (Kemmeren et al, 2014). (C) qRT-PCR of sub-telomeric genes from wt (yEG001) and set4Δ (yEG322) strains grown in YPD. Expression levels were normalized to TFC1. Fold change relative to wt is shown. The error bars represent SEM from at least three biological replicates. Asterisks represent P-values as calculated by an unpaired t test (* ≤ 0.05; **≤ 0.01; *** ≤ 0.001).
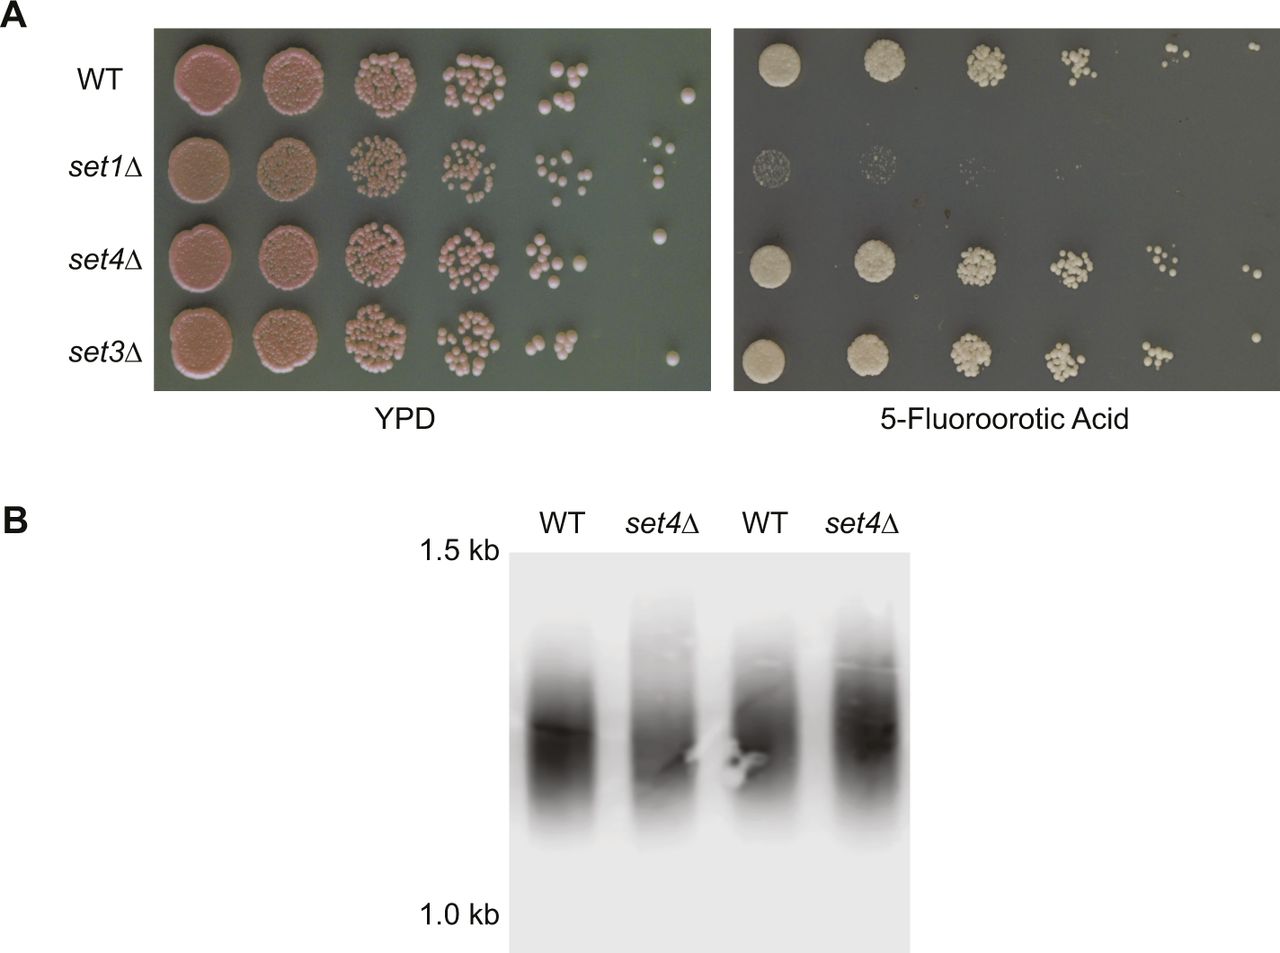
- Figure S1. Set4 is not implicated in canonical telomere position effect or telomere length regulation.
(A) Ten-fold serial dilutions of wt (yEG001), set1Δ (yEG392), set4Δ (yEG910), and set3Δ (yEG909) carrying a URA3-VIIL reporter were spotted on YPD and SC-URA + 5-FOA plates to assay telomere position effect. (B) Southern blot using a telomere probe of two isolates of wt (yEG001) and set4Δ (yEG322) strains cultured in YPD.
- Figure S2. Subtelomeric gene regulation in oxidative stress and ergosterol biosynthetic gene regulation in hypoxia.
(A) qRT-PCR of sub-telomeric genes from wt (yEG001) and set4Δ (yEG322) strains grown in YPD and treated with 0.4 mM H2O2 for 30 min. Expression levels were normalized to SCR1. Fold change relative to wt without H2O2 treatment is shown. (B) qRT-PCR of ERG3 and ERG11 from wt (yEG001) and set4Δ (yEG322) strains grown in YPD under aerobic or hypoxic conditions. Expression levels were normalized to TFC1. Fold change relative to wild type aerobic is shown. For all panels, error bars represent S.E.M. from at least three biological replicates and asterisks represent P-values as calculated by an unpaired t test (* <0.05, **<0.01, *** <0.001).
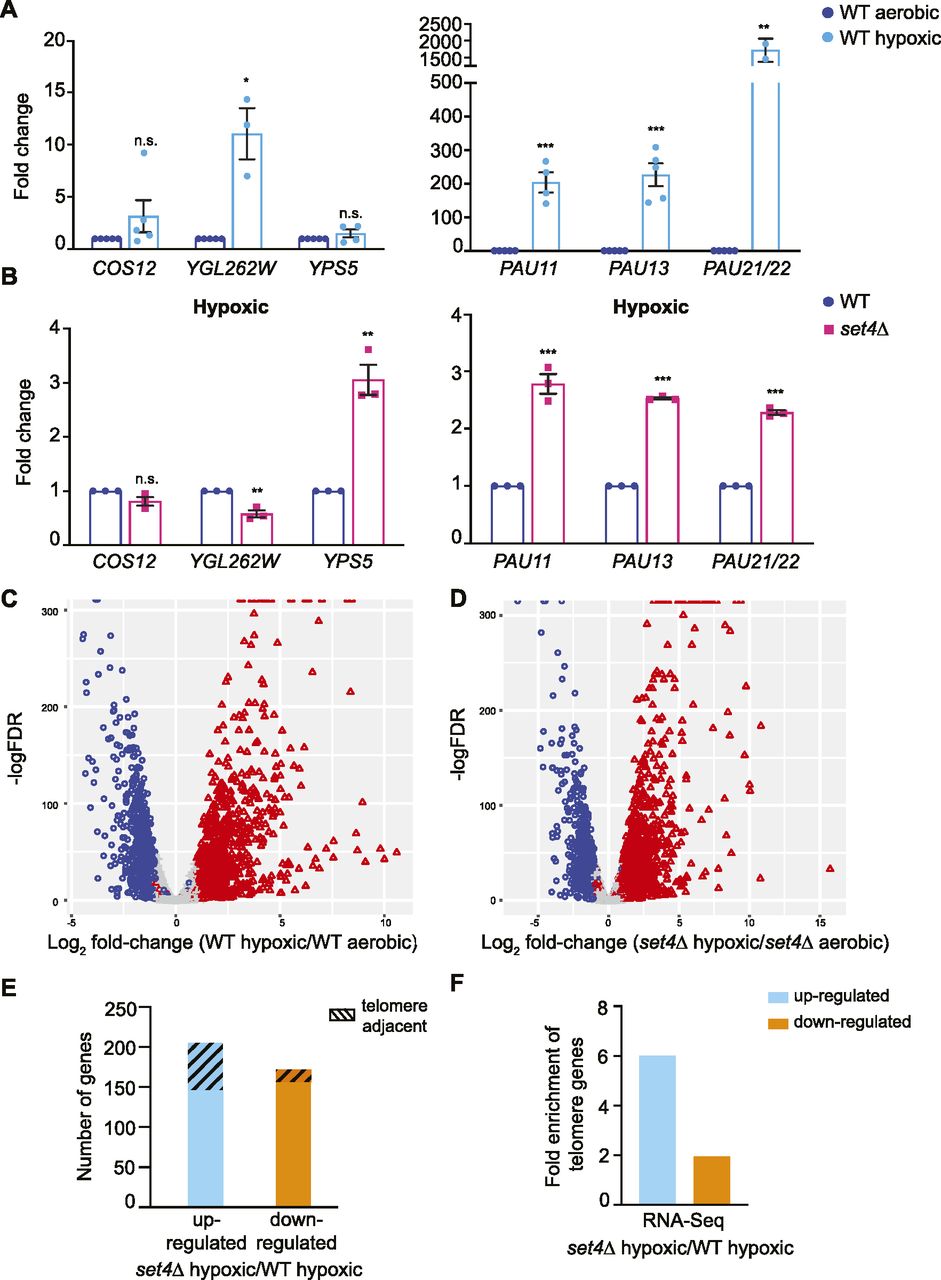
- Figure 2. Stress response genes at subtelomeres are regulated by Set4.
(A) qRT-PCR of subtelomeric genes from wt (yEG001) strains grown in YPD under aerobic or hypoxic conditions. Expression levels were normalized to TFC1 and fold change relative to aerobic conditions is shown. (B) qRT-PCR of subtelomeric genes from wt (yEG001) and set4Δ (yEG322) strains grown in hypoxia in YPD. Expression levels were normalized to TFC1. Fold change relative to wt in hypoxia is shown. For all panels, error bars represent SEM from at least three biological replicates and asterisks represent P-values as calculated by an unpaired t test (* ≤ 0.05; **≤ 0.01; *** ≤ 0.001; n.s., not significant). (C, D) Volcano plots depicting significantly differentially expressed genes (log FC ≥ 1.0, P ≤ 0.05) comparing wild-type hypoxic to wild-type aerobic cultures (C) and set4Δ hypoxic to set4Δ aerobic cultures (D). (E) The total number of genes identified as up- or down-regulated (FDR < 0.05) from RNA-sequencing of set4Δ (yEG322) cells relative to wt (yEG001) in hypoxia. Gene list provided in Table S1. The total number of telomere-enriched genes are indicated with the hashed box. (F) The fold enrichment of subtelomeric genes (defined as less than 40 kb from the chromosome end) for those genes differentially expressed between set4Δ hypoxic cultures relative to wild-type hypoxic cultures.
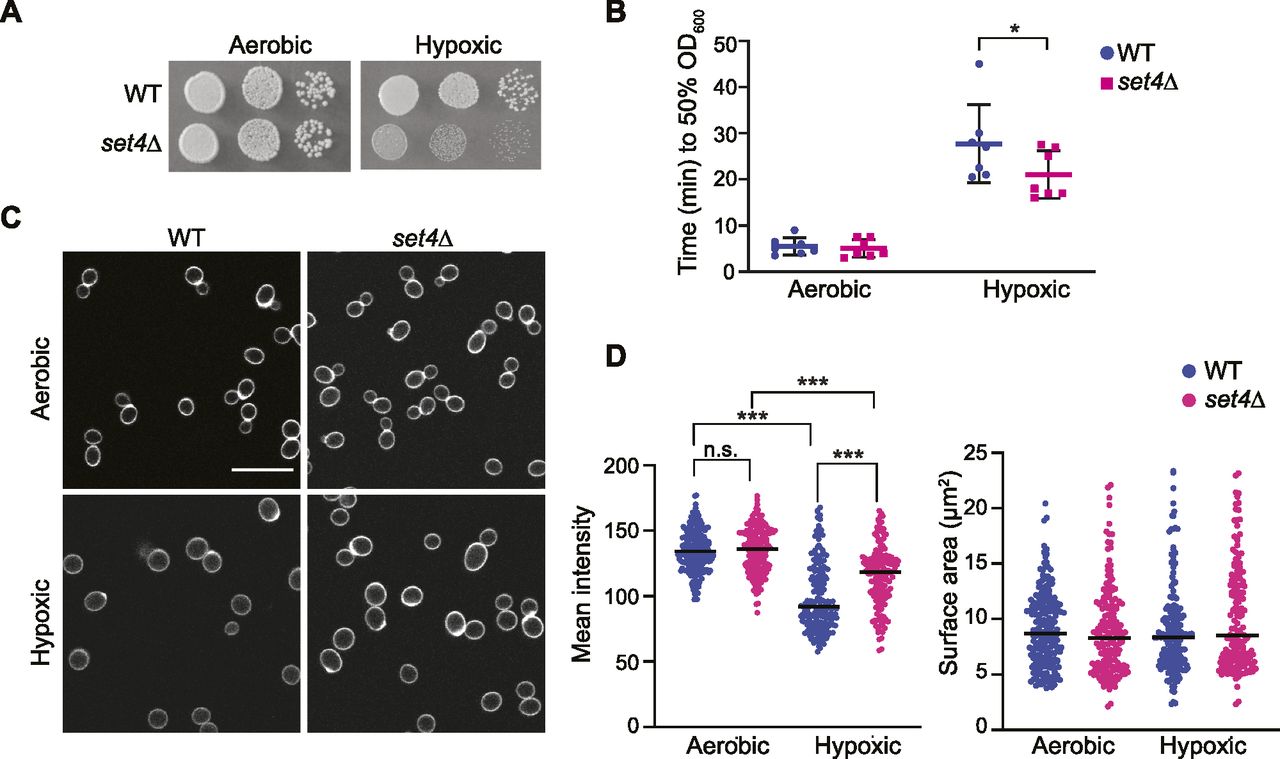
- Figure 3. Set4 promotes cell fitness and cell wall integrity in hypoxia.
(A) Ten-fold serial dilutions of wt (yEG001) and set4Δ (yEG322) strains spotted on YPD and grown under aerobic (2 d) or hypoxic (8 d) conditions at 30°C. (B) Scatter dot plot of the time elapsed for wt (yEG001) and set4Δ (yEG322) cultures grown in either aerobic or hypoxic conditions to reach 50% digestion by zymolyase. Error bars represent SD from seven biological replicates. Asterisk represents P-value as calculated by two-way ANOVA and Sidak’s multiple comparisons test (* <0.05). (C) Fluorescence microscopy of wt (yEG001) and set4Δ (yEG322) cells grown under aerobic or hypoxic conditions and stained with trypan blue. Scale bar is 5 μm. (D) Left panel: Quantitation of the mean intensity of the trypan blue staining at the cell perimeter of the images shown in (C). Black line indicates the mean. Measurements were performed for 160–210 cells per genotype and condition. Asterisks represent P-value as calculated from a two-way ANOVA with Turkey’s post hoc test (*** ≤ 0.001; n.s., not significant). Right panel: Surface area (μm2) of cells displayed and analyzed in (C). No significant differences were found using a two-way ANOVA and Turkey’s post hoc test.
- Figure 4. Histone acetylation increases at subtelomeric chromatin in set4Δ cells in hypoxia.
(A, B) chIP of H3K9ac, H4K5ac, H4K12ac, and H4K16ac at subtelomeric regions from wt (yEG001) and set4Δ (yEG322) strains grown to mid-log phase in YPD under aerobic (A) or hypoxic (B) conditions. Percent input of each acetyl mark is shown relative to percent input of total H3 levels. A minimum of three biological replicates for histone acetyl mark chIPs and six biological replicates of histone H3 chIP was performed. The histone H3 immunoprecipitation is more efficient and consistent than histone H4, and therefore was used to normalize to total histone levels. For all panels, error bars indicate SEM and asterisks represent P-values as calculated by unpaired t tests (* ≤ 0.05). If no asterisk is present, no significant differences were detected.
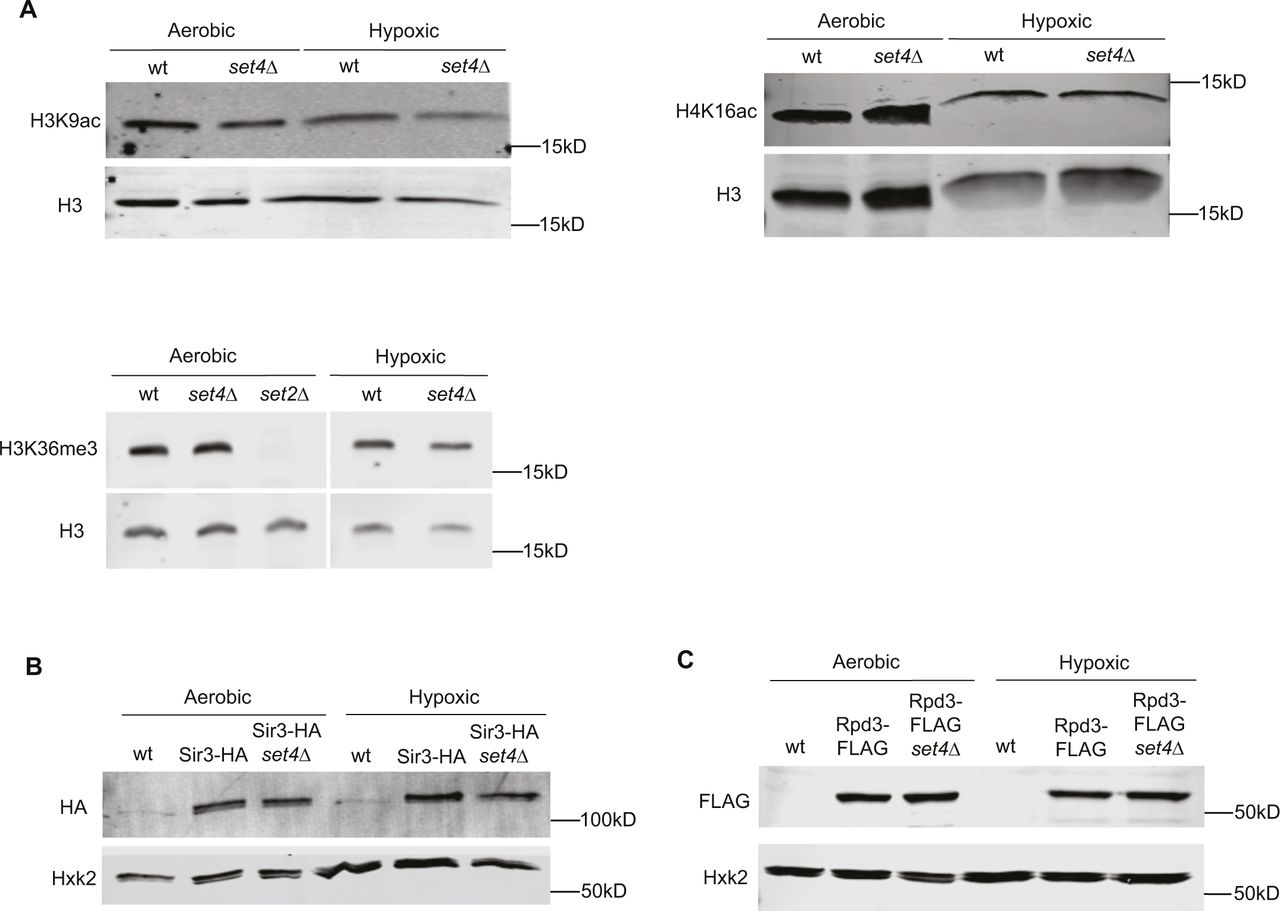
- Figure S3. Global acetylation and HDAC levels in wt and set4Δ under aerobic and hypoxic conditions.
(A) Clarified whole cell extract for wt (yEG001) and set4Δ (yEG322) strains grown to mid-log phase in YPD under normal and hypoxic conditions. Immunoblots probed with antibodies against H3, H3K9ac, H4K16ac, and H3K36me3. (B) Immunoblotting of Sir3-HA from clarified lysates of wt (yEG873) and set4Δ (yEG874) cells grown under aerobic and hypoxic conditions. Anti-Hxk2 immunoblot serves as a loading control. (C) Immunoblotting of Rpd3-FLAG from clarified lysates of wt (yEG956) and set4Δ (yEG1010) cells grown under aerobic and hypoxic conditions.
- Figure 5. H3K4me3 and H3K36me3 show little change in the absence of Set4 at subtelomeric regions.
(A, B) chIP of H3K4me3 (A) and H3K36me3 (B) were performed as described and analyzed as presented in Fig 4. Because of the predominant localization of H3K36me3 in coding regions, additional primer sets within PAU gene ORFs were used for this chIP. Error bars indicate SEM and asterisks represent P-values as calculated by unpaired t tests (* ≤ 0.05). If no asterisk is present, no significant differences were detected.
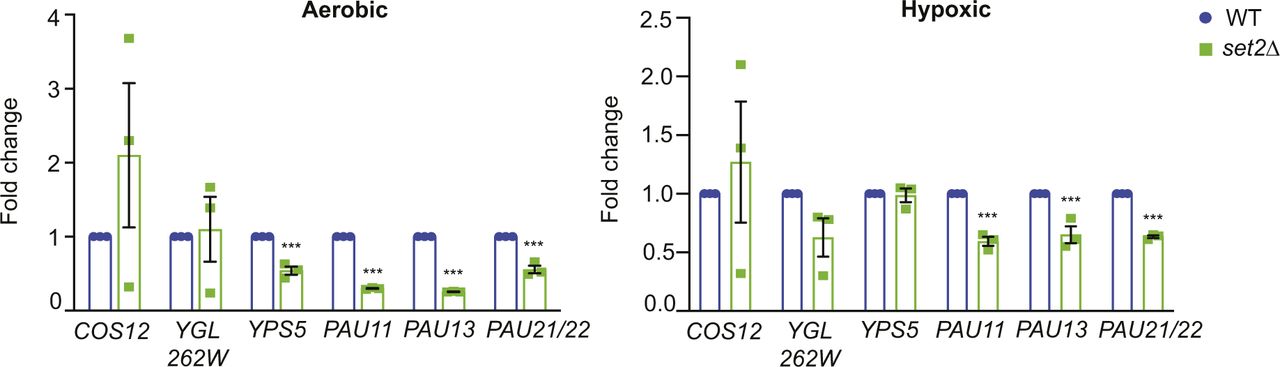
- Figure S4. Subtelomeric gene expression in set2Δ cells in aerobic and hypoxic conditions.
qRT-PCR of subtelomeric genes from wt (yEG001) and set2Δ (yEG091) strains grown under aerobic or hypoxic conditions in YPD. Error bars indicate SEM and asterisks represent P-values from unpaired t tests (** <0.001). If no asterisks are present, there are no significant differences between strains.
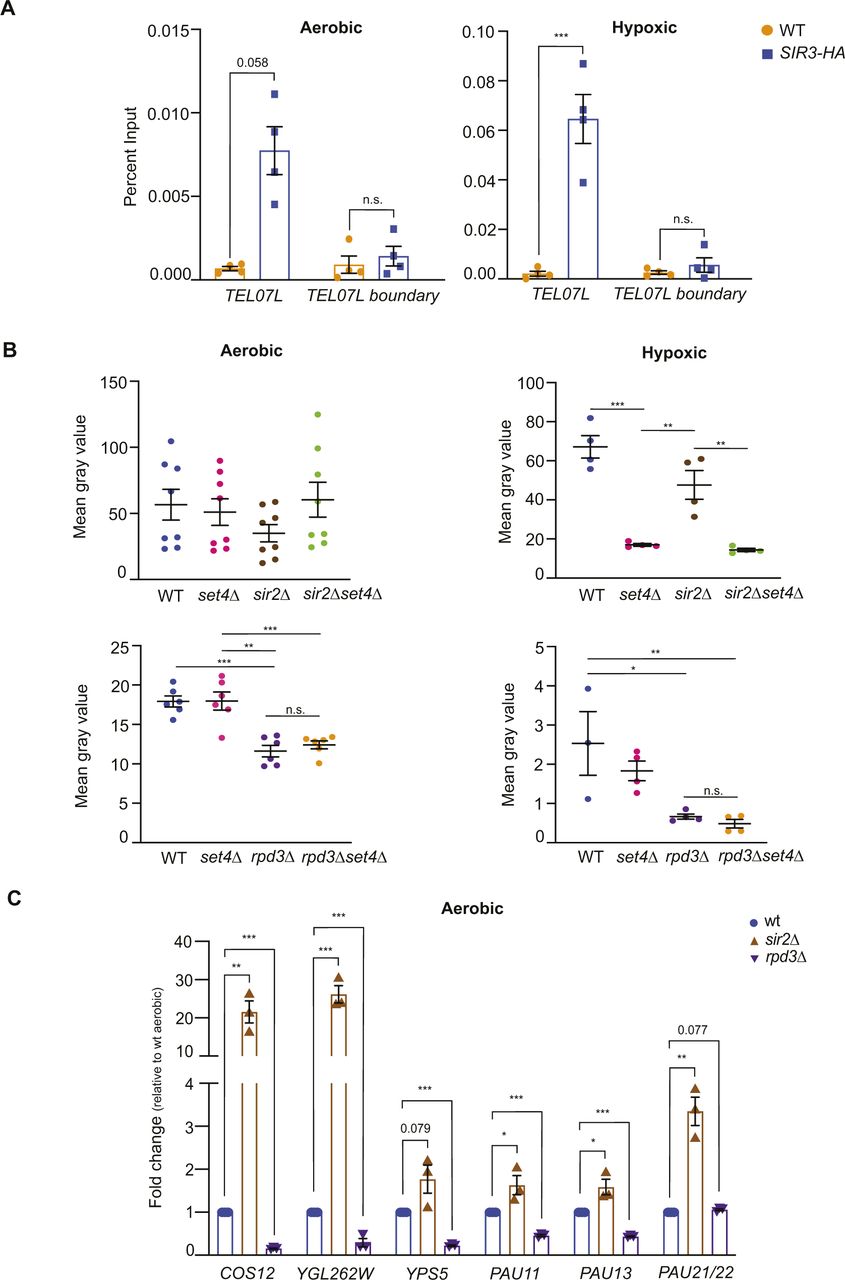
- Figure 6. Disrupted HDAC distribution at subtelomeric chromatin in the absence of Set4.
(A) chIP of wt (yEG001), SIR3-HA (yEG873), and SIR3-HA set4Δ (yEG874) strains grown to mid-log phase in YPD in hypoxic conditions. (B) chIP of wt (yEG001), RPD3-FLAG (yEG956) and RPD3-FLAG set4Δ (yEG1010) strains grown to mid-log phase in YPD in hypoxic conditions. For both panels, percent input from at least three biological replicates is shown. The error bars indicate SEM and asterisks represent P-values as calculated by one-way ANOVA and Tukey’s post hoc test (* ≤ 0.05; **≤ 0.01; *** ≤ 0.001; n.s., not significant).
- Figure S5. Analysis of sir2Δ and rpd3Δ single mutants and double mutants with set4Δ.
(A) chIP of wt (yEG001) and SIR3-HA (yEG873) strains grown to mid-log phase in YPD in aerobic and hypoxic conditions. Percent input from at least three biological replicates is shown. (B) Quantitation of yeast spot assays shown in Fig 7A was performed as described (Petropavlovskiy et al, 2020). The mean gray value taken from the images of plates for at least three biological replicates is shown for each strain and under aerobic or hypoxic conditions. (C) qRT-PCR of subtelomeric genes from wt (yEG001), sir2Δ (yEG917), and rpd3Δ (yEG921) strains grown under aerobic conditions in YPD. For all panels, the error bars indicate SEM and asterisks represent P-values as calculated by one way ANOVA and Tukey’s post hoc test (* <0.05, **<0.01, *** <0.001).
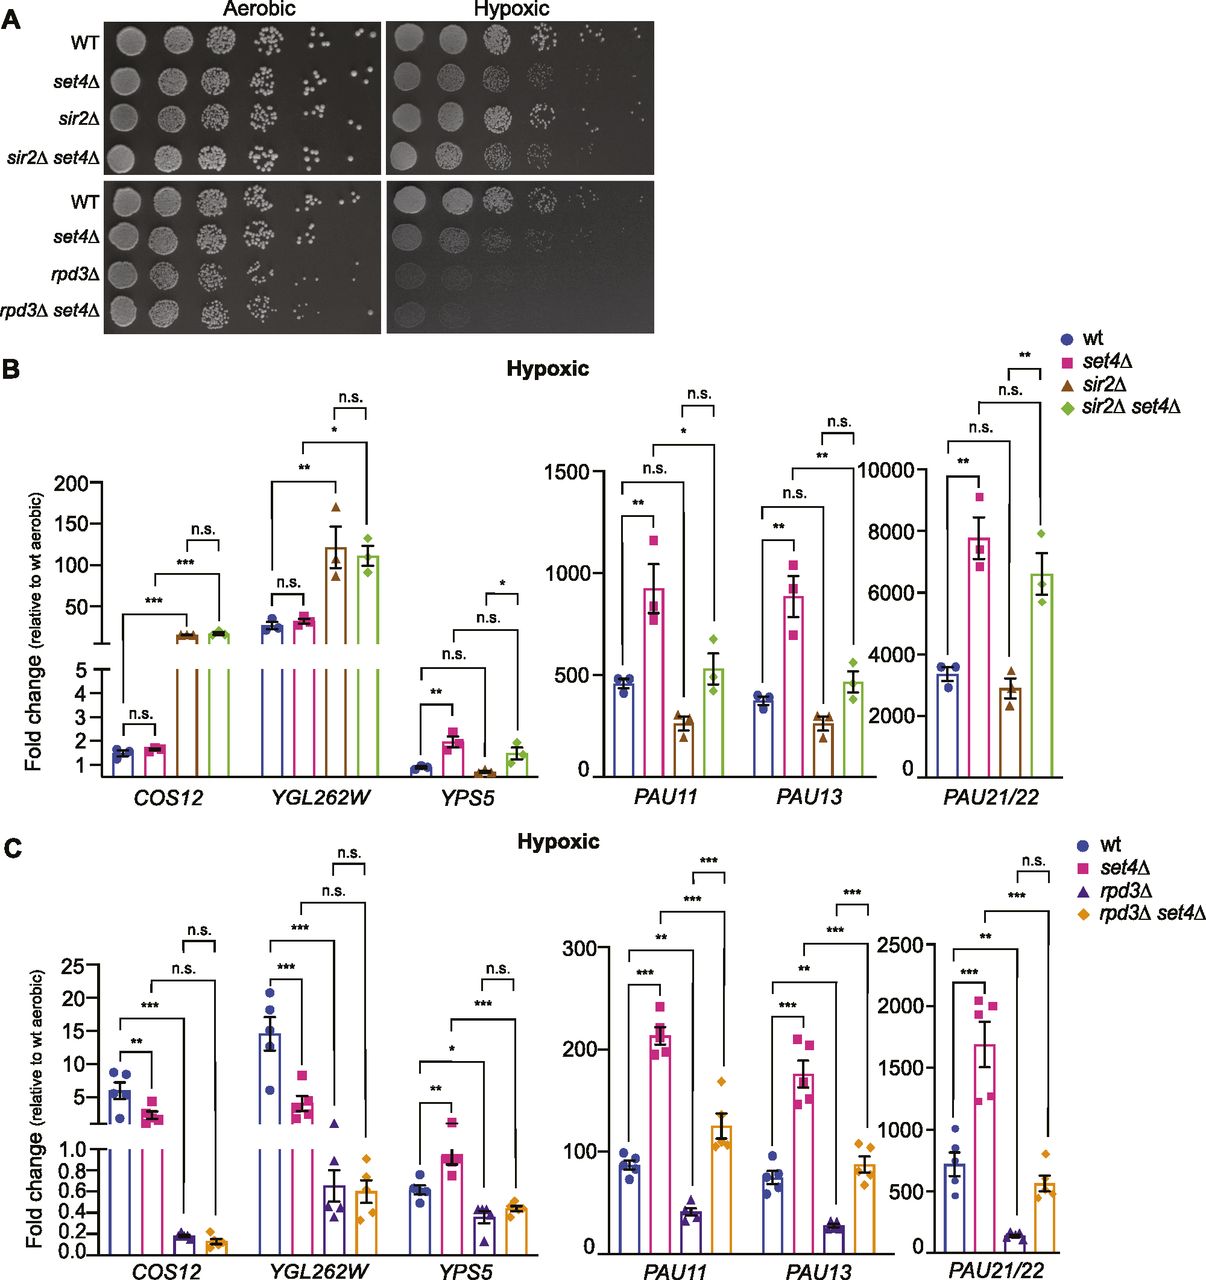
- Figure 7. Genetic interactions of Set4 with HDACs Sir2 and Rpd3 in regulating subtelomeric gene expression during stress.
(A) Ten-fold serial dilutions of wt (yEG001), set4Δ (yEG322), sir2Δ (yEG917), sir2Δ set4Δ (yEG997), and wt (yEG919), set4Δ (yEG920), rpd3Δ (yEG921), rpd3Δ set4Δ (yEG922) spotted on YPD and grown in aerobic or hypoxic conditions. Images of aerobic plates were taken after 2 d of growth at 30°C and images of hypoxic plates were taken after 8 d of growth. (B) qRT-PCR of subtelomeric genes from wt, set4Δ, sir2Δ, and set4Δ sir2Δ strains grown under hypoxic conditions in YPD. (C) qRT-PCR of subtelomeric genes from wt, set4Δ, rpd3Δ, and set4Δ rpd3Δ strains grown under hypoxic conditions in YPD. For all experiments, expression levels were normalized to TFC1 and fold-change was determined relative to wild-type expression levels in aerobic conditions. Error bars represent SEM from at least three biological replicates. For all panels, asterisks represent P-values as calculated by one-way ANOVA and Tukey’s post hoc test (* ≤ 0.05; **≤ 0.01; *** ≤ 0.001; n.s., not significant).
- Figure 8. Upc2 is required for enhanced activation of PAU genes in the absence of Set4.
qRT-PCR of subtelomeric genes from wt, set4Δ, upc2Δ, and set4Δ upc2Δ strains grown under hypoxic conditions in YPD. Expression levels were normalized to TFC1 and fold-change was determined relative to wild-type expression levels in hypoxic conditions. Error bars represent SEM from three biological replicates. Asterisks represent P-values as calculated by one-way ANOVA and Tukey’s post hoc test (* ≤ 0.05; **≤ 0.01; *** ≤ 0.001; n.s., not significant).
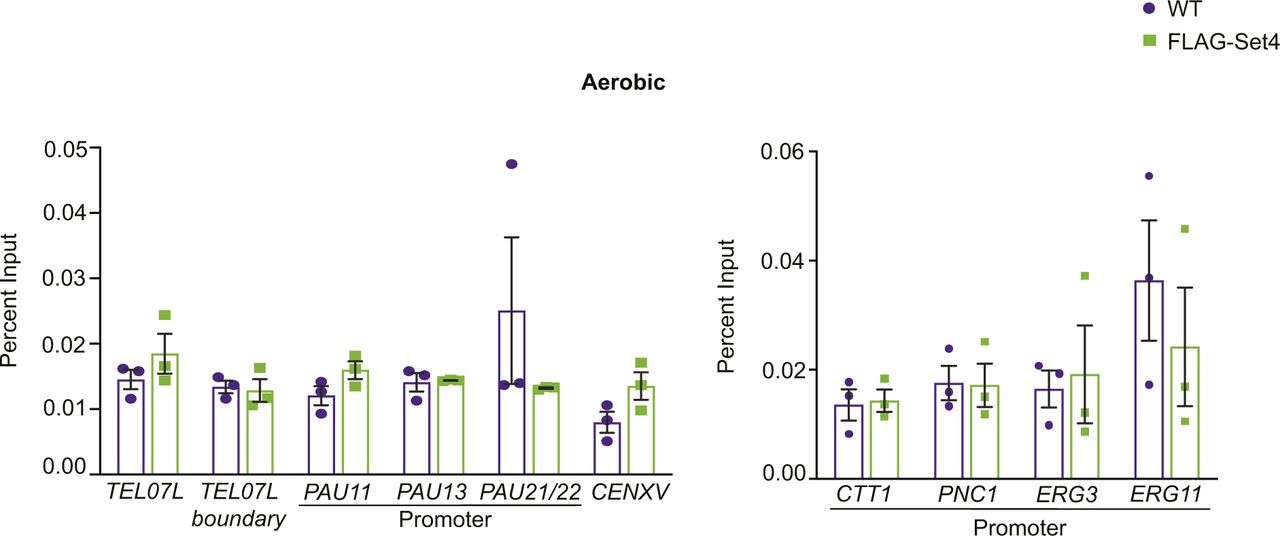
- Figure S6. Set4 is not detectable at subtelomeric regions or stress response promoters under aerobic conditions.
chIP of FLAG-Set4 from cells grown under aerobic conditions. Percent input from three biological replicates is shown. Error bars represent SEM and no significant differences were detected using an unpaired t test.
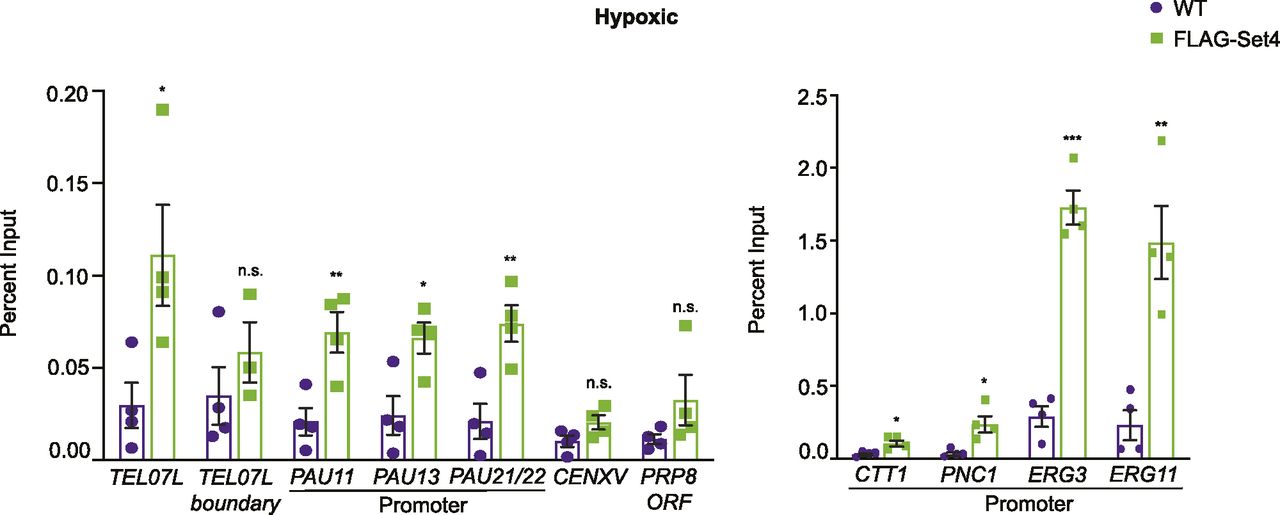
- Figure 9. Set4 localizes to subtelomeric chromatin during stress.
chIP of FLAG-Set4 from cells grown under hypoxic conditions. Percent input from three biological replicates is shown. Left graph shows regions tested in Figs 4 and 6 for histone acetylation levels and HDAC binding, as well as the negative control regions CENXV and the PRP8 ORF. Right graph shows promoter regions previously identified as binding locations under stress conditions (Serratore et al, 2018; Tran et al, 2018). Error bars represent SEM and asterisks represent P-values as calculated by an unpaired t test (* ≤ 0.05; **≤ 0.01; *** ≤ 0.001; n.s., not significant).
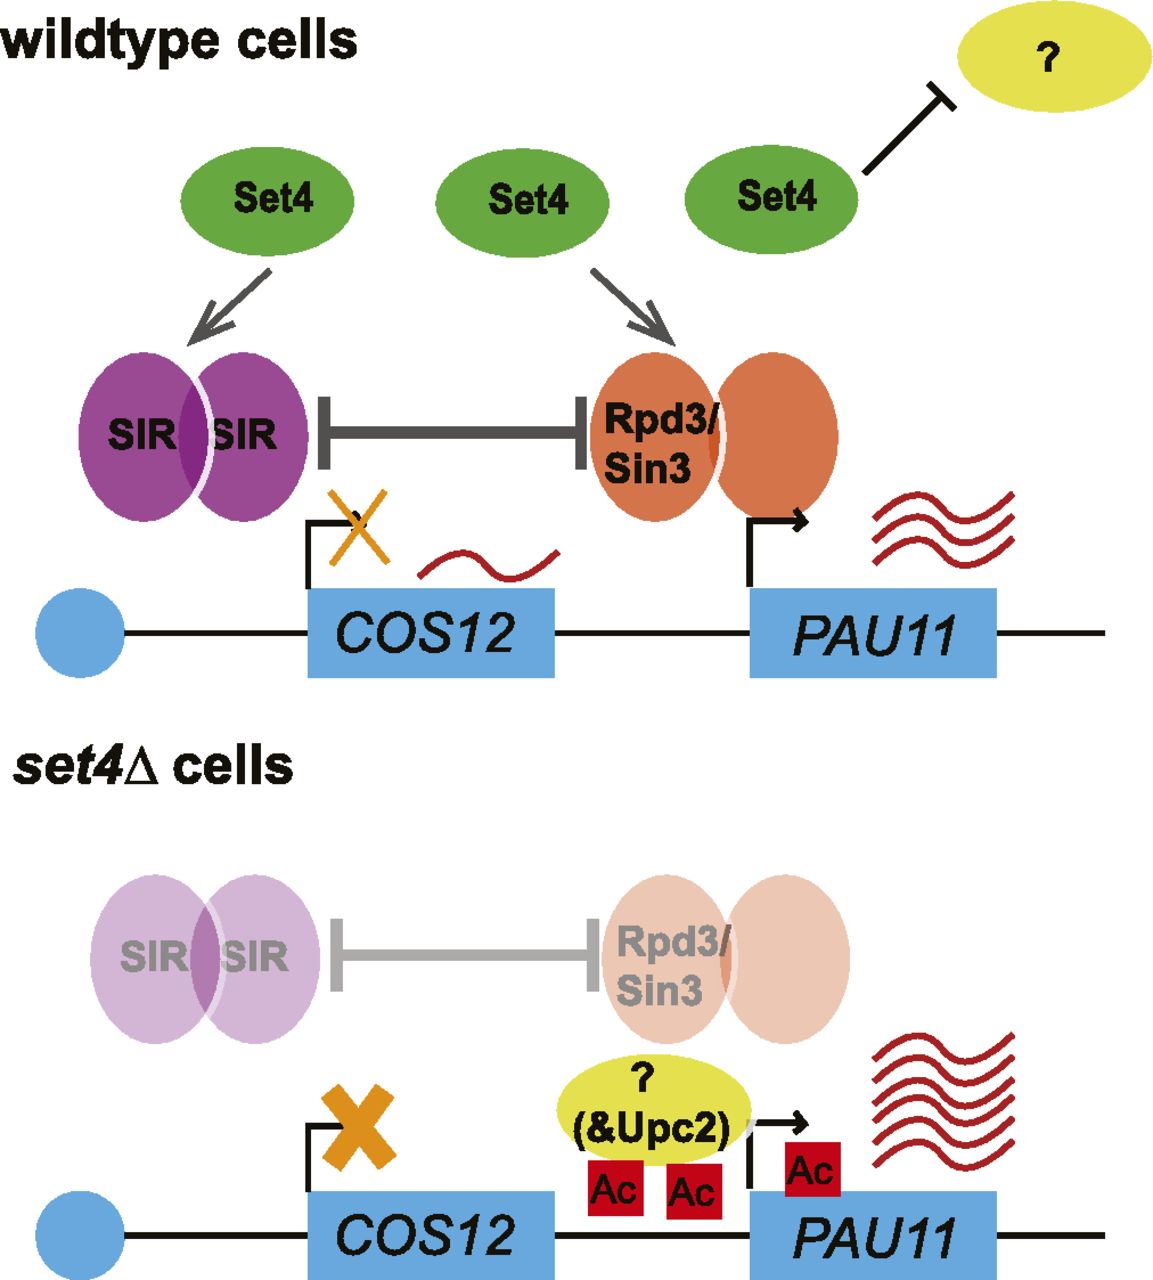
- Figure 10. Model for Set4 function in subtelomeric gene regulation during hypoxic stress.
A partial depiction of TEL07L is shown indicating genes subject to telomere position effect (TPE) silencing, such as COS12, and genes repressed under standard growth conditions and induced in stress, such as PAU11. In wild-type cells, Set4 promotes the association of the SIR complex (Sir2/3/4) and Rpd3 with subtelomeric chromatin. The presence of these HDACs represses telomere-adjacent genes subject to TPE, such as COS12, and genes induced in limiting oxygen, such as PAU11. Set4, either alone or in cooperation with the SIR complex, Rpd3, or other yet unidentified chromatin regulators, may also inhibit the binding or activity of factors important for the positive regulation of stress response genes at subtelomeres (indicated by a question mark), including the hypoxic-responsive transcriptional activator Upc2. In the absence of Set4, both the SIR complex and Rpd3 binding are diminished, resulting in increased histone acetylation and enhanced activation of PAU11 (and other PAU) genes. Genes subject to TPE, such as COS12, show increased repression upon loss of Set4, possibly because of diminishment of the antagonism between Rpd3 and the SIR complex, or because of compensation by other HDACs when Rpd3 and Sir2 levels are disrupted (Thurtle-Schmidt et al, 2016). This role for Set4 is most critical during stress, such as hypoxia when Set4 levels increase. Further genetic and physical interaction studies of Set4 at chromatin are likely to define the additional factors functioning with Set4, Rpd3, and the SIR complex in fine-tuning stress response genes within yeast subtelomeres.
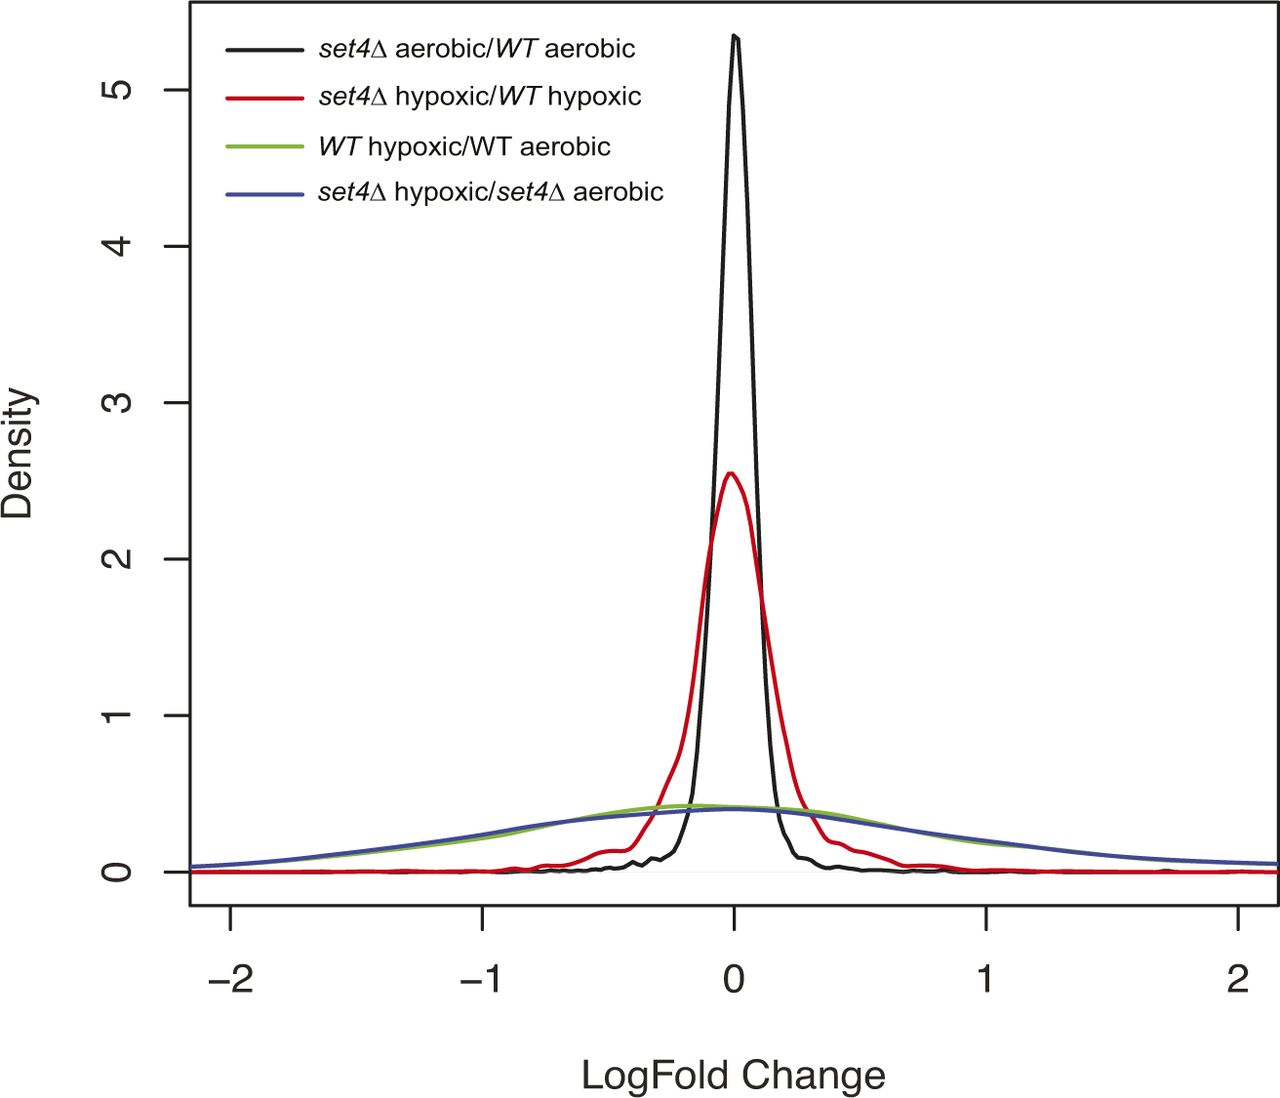
- Figure S7. Distribution of log2 fold-change for RNA-sequencing datasets.
Smoothened histogram representing log2 fold-change values for RNA-sequencing experiments comparing set4Δ aerobic/WT aerobic, set4Δ hypoxic/WT hypoxic, WT hypoxic/WT aerobic, and set4Δ hypoxic/set4Δ aerobic.


Tables
- Table 1.
Significant differentially expressed genes in set4Δ mutants compared with wild-type under aerobic and hypoxic conditions.
Total genes Up-regulated Down-regulated Aerobic 196 75 121 Cell wall organization (9 × 10−08) No enrichment Hypoxic 377 205 172 Cell wall organization (3 × 10⁻¹¹) Cell wall organization (2 × 10−04) DNA Integration (2 × 10−05) The number of significant differentially expressed genes in each category is indicated along with the enriched GO terms with P-values indicated in parentheses.
Table S3 Yeast strains used in this study.
Table S4 Oligos used in this study.


