Advertisement

Main menu

  • Home
  • Articles
    • Newest Articles
    • Current Issue
    • Methods & Resources
    • Archive
    • Subjects
  • Collections
  • Submit
    • Submit a Manuscript
    • Author Guidelines
    • License, Copyright, Fee
    • FAQ
    • Why submit
  • About
    • About Us
    • Editors & Staff
    • Board Members
    • Licensing and Reuse
    • Reviewer Guidelines
    • Privacy Policy
    • Advertise
    • Contact Us
    • LSA LLC
  • Alerts
  • Other Publications
    • EMBO Press
    • The EMBO Journal
    • EMBO reports
    • EMBO Molecular Medicine
    • Molecular Systems Biology
    • Rockefeller University Press
    • Journal of Cell Biology
    • Journal of Experimental Medicine
    • Journal of General Physiology
    • Cold Spring Harbor Laboratory Press
    • Genes & Development
    • Genome Research

User menu

  • My alerts

Search

  • Advanced search
Life Science Alliance
  • Other Publications
    • EMBO Press
    • The EMBO Journal
    • EMBO reports
    • EMBO Molecular Medicine
    • Molecular Systems Biology
    • Rockefeller University Press
    • Journal of Cell Biology
    • Journal of Experimental Medicine
    • Journal of General Physiology
    • Cold Spring Harbor Laboratory Press
    • Genes & Development
    • Genome Research
  • My alerts
Life Science Alliance

Advanced Search

  • Home
  • Articles
    • Newest Articles
    • Current Issue
    • Methods & Resources
    • Archive
    • Subjects
  • Collections
  • Submit
    • Submit a Manuscript
    • Author Guidelines
    • License, Copyright, Fee
    • FAQ
    • Why submit
  • About
    • About Us
    • Editors & Staff
    • Board Members
    • Licensing and Reuse
    • Reviewer Guidelines
    • Privacy Policy
    • Advertise
    • Contact Us
    • LSA LLC
  • Alerts
  • Follow lsa Template on Twitter
Research Article
Transparent Process
Open Access

SATB1-dependent mitochondrial ROS production controls TCR signaling in CD4 T cells

View ORCID ProfileTaku Kuwabara  Correspondence email, Fumio Ishikawa, View ORCID ProfileMasataka Ikeda, Tomomi Ide, View ORCID ProfileTerumi Kohwi-Shigematsu, View ORCID ProfileYuriko Tanaka, View ORCID ProfileMotonari Kondo
Taku Kuwabara
1Department of Molecular Immunology, Toho University School of Medicine, Tokyo, Japan
Roles: Project administration, Writing—original draft, review, and editing
  • Find this author on Google Scholar
  • Find this author on PubMed
  • Search for this author on this site
  • ORCID record for Taku Kuwabara
  • For correspondence: kuwabara@med.toho-u.ac.jp
Fumio Ishikawa
1Department of Molecular Immunology, Toho University School of Medicine, Tokyo, Japan
2Faculty of Health Sciences, Tsukuba International University, Tsuchiura, Japan
Roles: Supervision
  • Find this author on Google Scholar
  • Find this author on PubMed
  • Search for this author on this site
Masataka Ikeda
3Department of Cardiovascular Medicine, Graduate School of Medical Sciences, Kyushu University, Fukuoka, Japan
Roles: Supervision
  • Find this author on Google Scholar
  • Find this author on PubMed
  • Search for this author on this site
  • ORCID record for Masataka Ikeda
Tomomi Ide
3Department of Cardiovascular Medicine, Graduate School of Medical Sciences, Kyushu University, Fukuoka, Japan
Roles: Supervision
  • Find this author on Google Scholar
  • Find this author on PubMed
  • Search for this author on this site
Terumi Kohwi-Shigematsu
4Department of Orofacial Science, University of California San Francisco School of Dentistry, San Francisco, CA, USA
Roles: Supervision
  • Find this author on Google Scholar
  • Find this author on PubMed
  • Search for this author on this site
  • ORCID record for Terumi Kohwi-Shigematsu
Yuriko Tanaka
1Department of Molecular Immunology, Toho University School of Medicine, Tokyo, Japan
Roles: Supervision
  • Find this author on Google Scholar
  • Find this author on PubMed
  • Search for this author on this site
  • ORCID record for Yuriko Tanaka
Motonari Kondo
1Department of Molecular Immunology, Toho University School of Medicine, Tokyo, Japan
Roles: Supervision, Project administration
  • Find this author on Google Scholar
  • Find this author on PubMed
  • Search for this author on this site
  • ORCID record for Motonari Kondo
Published 28 September 2021. DOI: 10.26508/lsa.202101093
  • Article
  • Figures & Data
  • Info
  • Metrics
  • Reviewer Comments
  • PDF
Loading

Article Figures & Data

Figures

  • Figure S1.
    • Download figure
    • Open in new tab
    • Download powerpoint
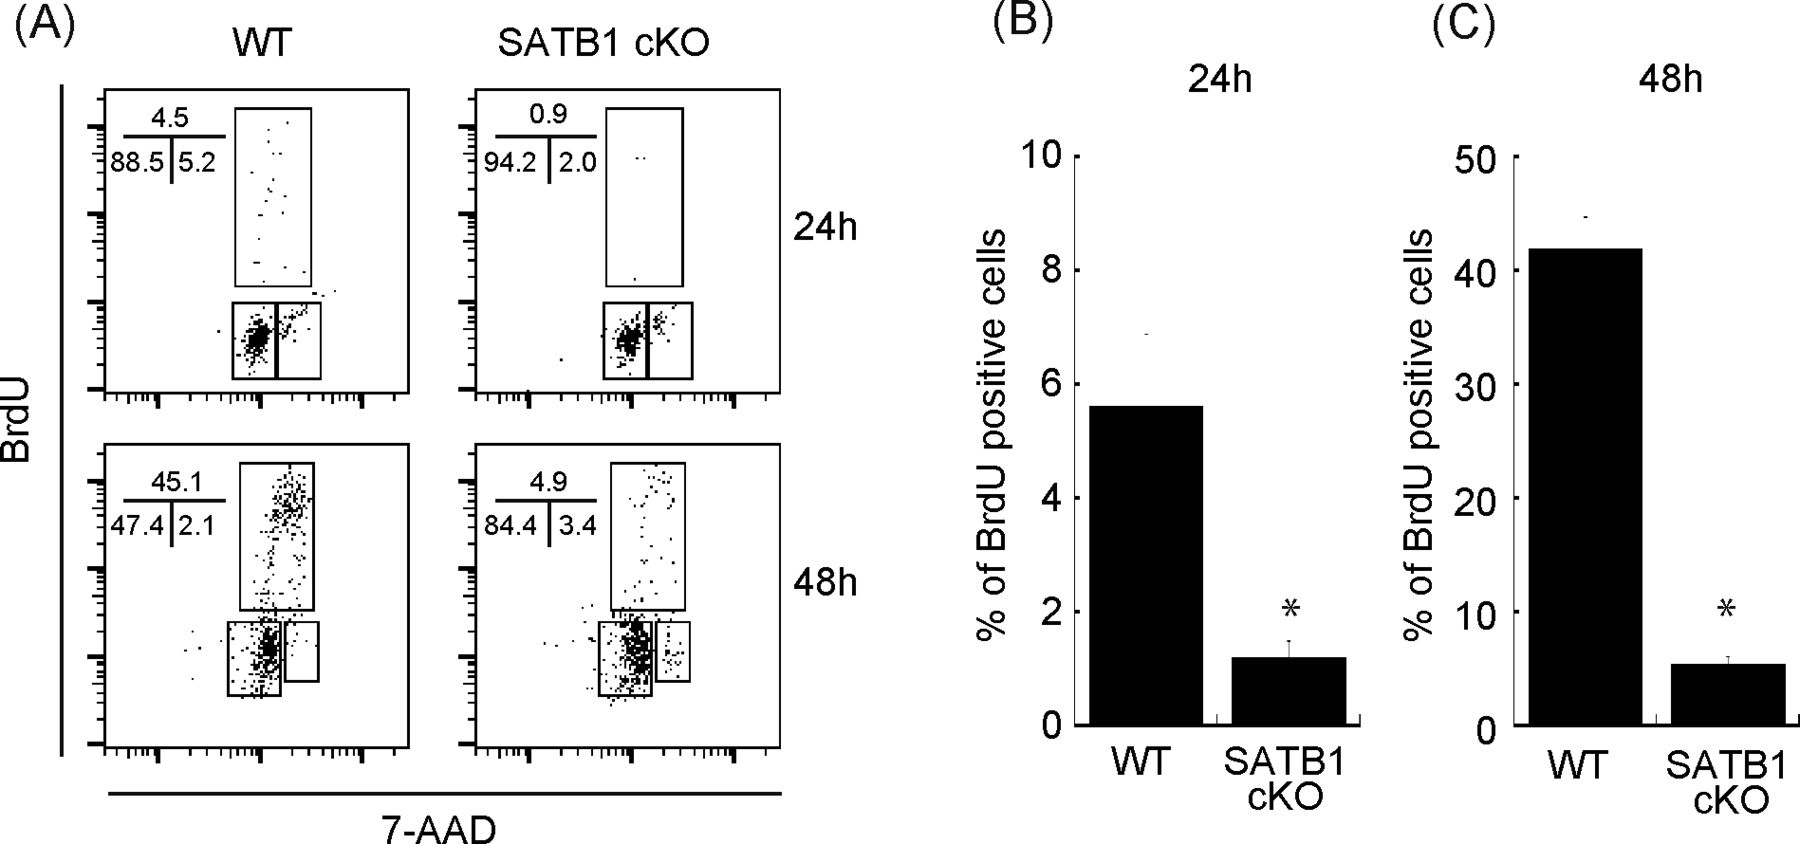
    Figure S1. Cell cycle analysis of CD4 T cells from WT and SATB1cKO mice.

    Sorted naïve CD4 T cells were stimulated with anti-CD3 and anti-CD28 antibodies for 24 and 48 h. BrdU was added to the in vitro culture for the last 30 min of incubation. (A) The cells were then fixed and stained with anti-BrdU antibody and 7-amino-actinomycin and subjected to FACS analysis (A). The percentage of cells in each cell cycle phase is shown. Data are representative for three independent experiments. (B, C) The quantification of BrdU-positive cells is shown on the right-hand side (B, C).

  • Figure 1.
    • Download figure
    • Open in new tab
    • Download powerpoint
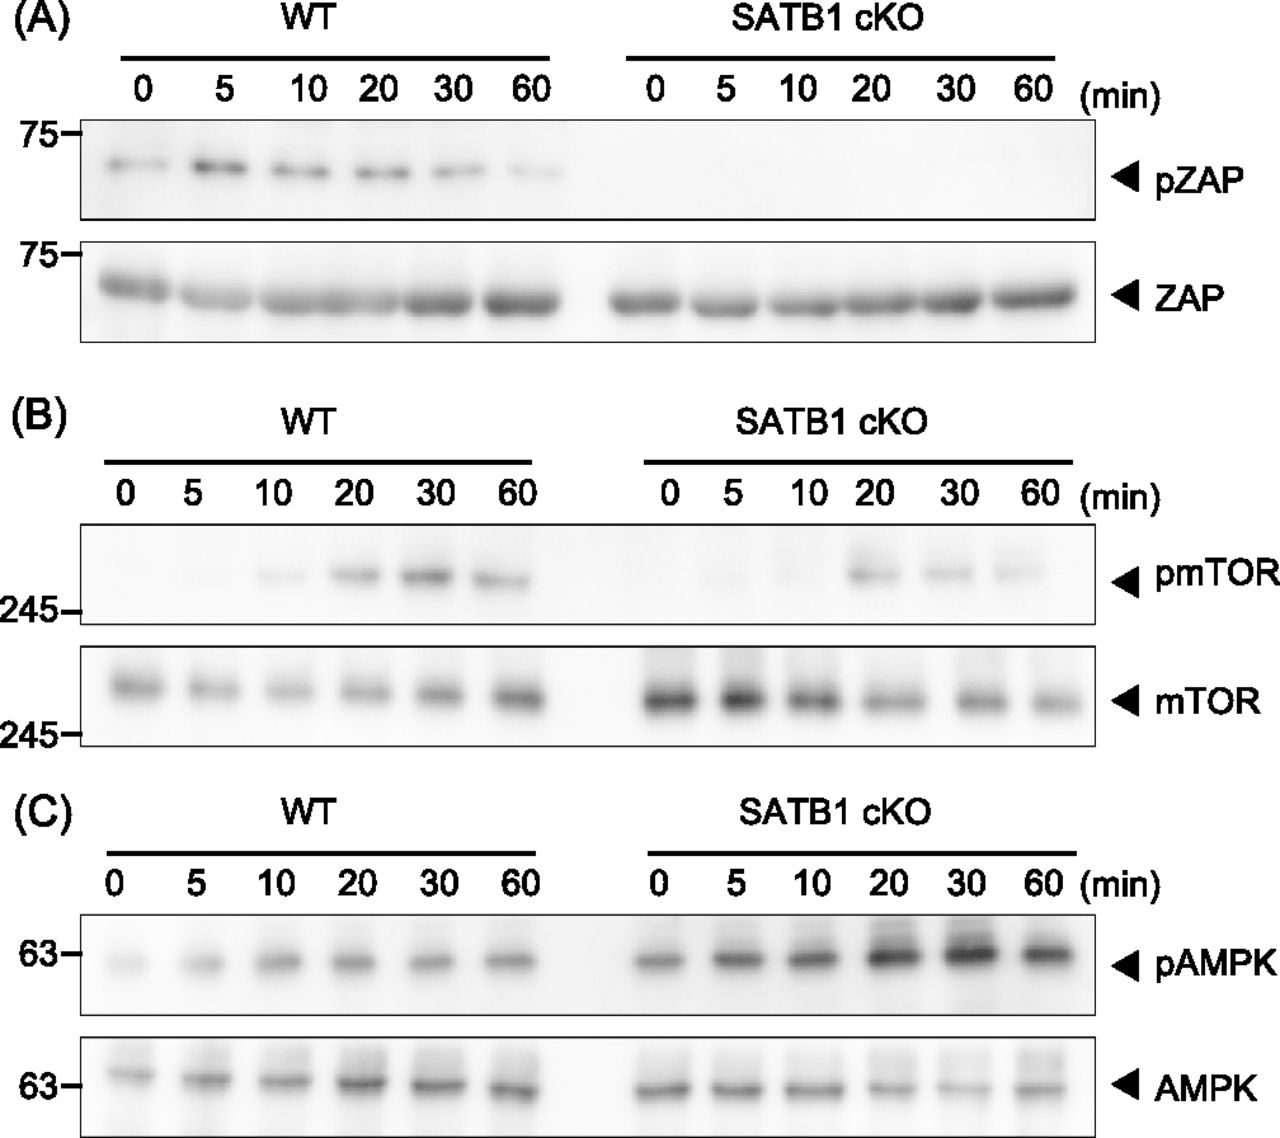
    Figure 1. SATB1 is required for T-cell activation.

    Signaling molecule phosphorylation was examined in naïve CD4 T cells from WT and SATB1cKO mice. (A, B, C) T cells were stimulated with anti-CD3 and anti-CD28 antibodies for the indicated time periods, lysed, analyzed by SDS–PAGE, and immunoblotted with anti-ZAP70, anti-phospho-ZAP70 (A), anti-mammalian target of rapamycin, anti-phospho-mammalian target of rapamycin (B), anti-AMPK, and anti-phospho-AMPK (C). Data for one experiment are representative of three independent experiments.

  • Figure S2.
    • Download figure
    • Open in new tab
    • Download powerpoint
    Figure S2. Signaling molecule phosphorylation examined in naïve CD4 T cells from WT, SATB1cKO, and SATB1cKO-TFAMTg mice.

    T cells were stimulated with anti-CD3 and anti-CD28 antibodies for the indicated periods, lysed, analyzed by SDS–PAGE, and immunoblotted with antibodies against p70S6 and phospho-p70S6 kinases. Data for one experiment representative of three independent experiments are shown.

  • Figure 2.
    • Download figure
    • Open in new tab
    • Download powerpoint
    Figure 2. SATB1-TFAM axis is required for mitochondrial homeostasis.

    (A) CD4 T cells were suspended in ATP assay buffer and incubated for 1 min at RT. Light intensity was indicative of intracellular ATP content (Lu-ATP). (B) Oxidative phosphorylation complex I enzyme activity was measured. Lysates were incubated on the plate for 3 h to capture complex I. Enzyme activity was determined by NADH oxidation to NAD+ and simultaneous dye reduction. Dye absorbance was measured with a plate reader at 450 nm. (C) Levels of mtROS in CD4 T cells from WT, and SATB1cKO mice in the control and after TCR activation were measured by DCFDA staining and flow cytometry. (D) Quantification of mean fluorescence of DCFDA. (E) Representative MitoTracker staining histograms. WT and SATB1cKO T cells in the control and after TCR activation were stained with MitoTracker and analyzed by a flow cytometer. (F) Quantification of the mean fluorescence of MitoTracker.*P < 0.01 versus WT. N = 5. Data are shown as the means ± SD.

  • Figure S3.
    • Download figure
    • Open in new tab
    • Download powerpoint
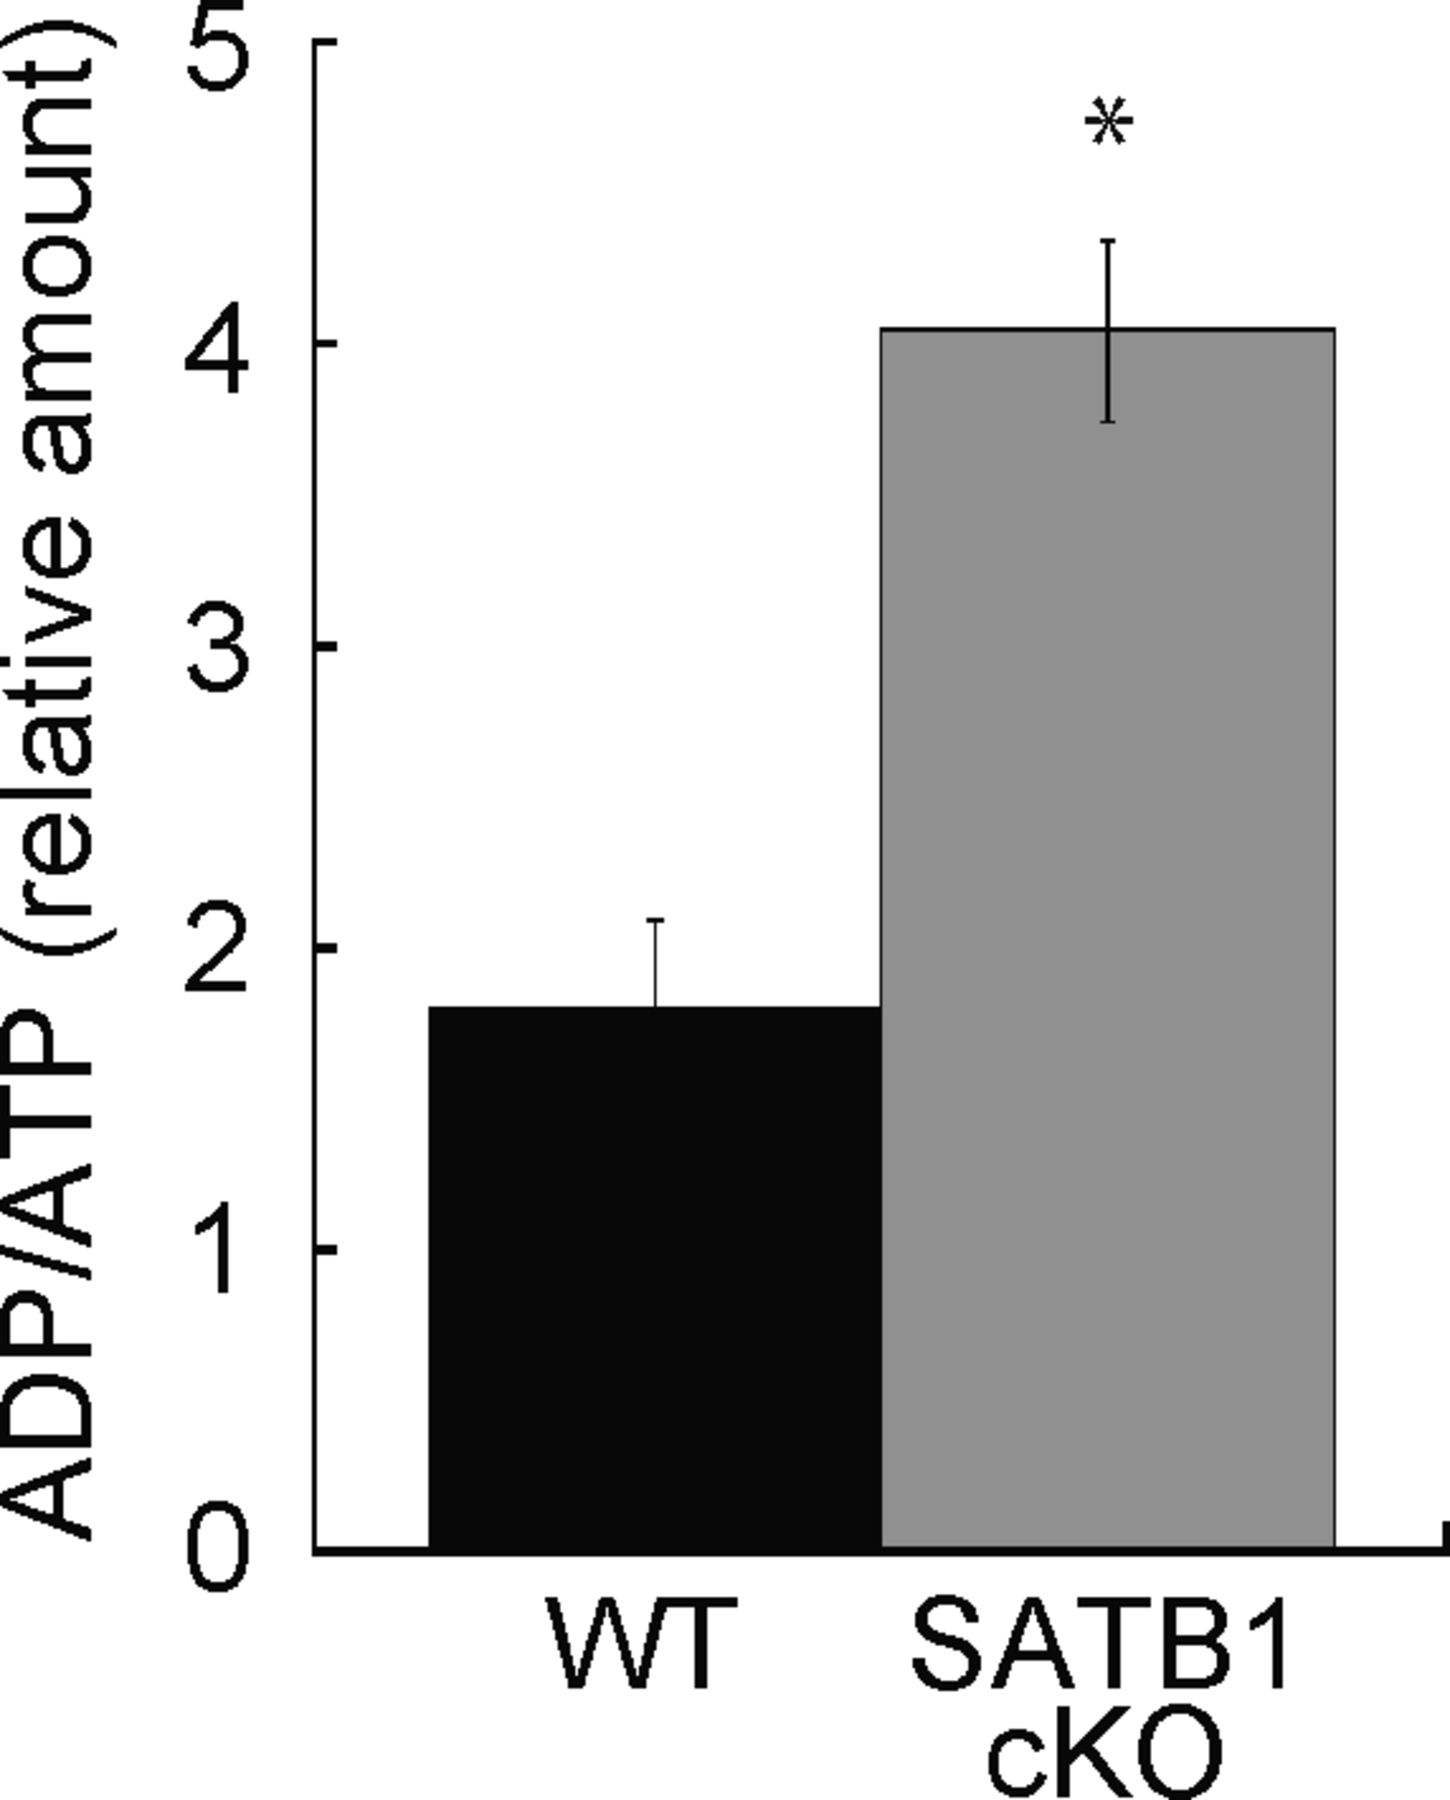
    Figure S3. ADP/ATP ratio in T cells.

    Cellular ATP was assessed. Cell lysates were incubated with ADP assay buffer for 1 min and luminescence was measured (Lu-ADP). ADP/ATP ratio was calculated as Lu-ADP/Lu-ATP. Dye absorbance was measured in a plate reader at 450 nm. *P < 0.01 versus WT. N = 5. Data are shown as the means ± SD.

  • Figure 3.
    • Download figure
    • Open in new tab
    • Download powerpoint
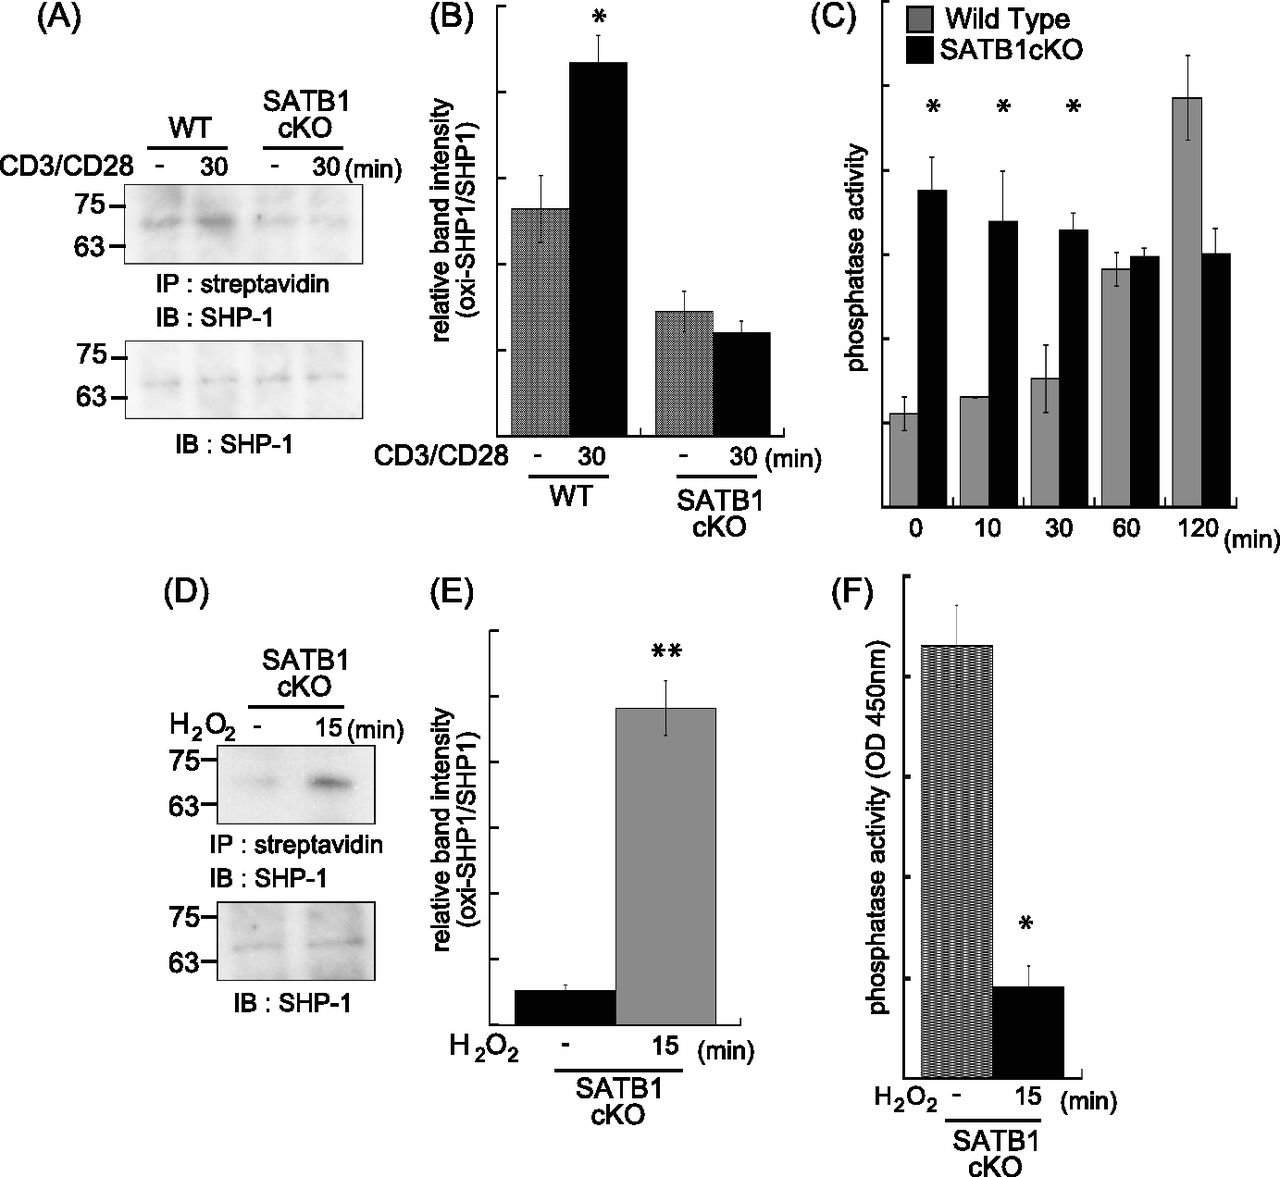
    Figure 3. Phosphatase SHP-1 is regulated by mtROS.

    WT and SATB1cKO naïve CD4 T cells were stimulated with anti-CD3 and anti-CD28 antibodies for the indicated times and lysed in sample buffer. Oxidized proteins in the cell lysates were labeled with iodoaceto-PEG biotin and immunoprecipitated. (A) Blots were probed for anti–SHP-1 antibody. (B) Band intensities were quantified with ImageJ v. 1.49. (C) Naïve CD4 T Cells were incubated for 0, 10, 20, 30, 60, and 120 min with anti-CD3 and anti-CD28 antibodies and lysed in phosphatase assay buffer. Phosphatase activity was assayed by incubation with PY containing peptide and liberated phosphate was measured by malachite green absorption at 450 nm. (D, E) Lysates of SATB1-deficient naïve CD4 T cells were incubated in the absence or presence of H2O2 for 15 min. Oxidized SHP-1 was detected by immunoblotting with antibody against SHP-1 (D). (E) Band intensities were quantified with ImageJ v. 1.49 (E). (B, F) Phosphatase activity in the presence or absence of H2O2 was measured in (B). Data are shown as the means of three experiments performed in duplicate. *P < 0.01 versus WT. **P < 0.05 versus WT. N = 5. Data are shown as the means ± SD.

  • Figure 4.
    • Download figure
    • Open in new tab
    • Download powerpoint
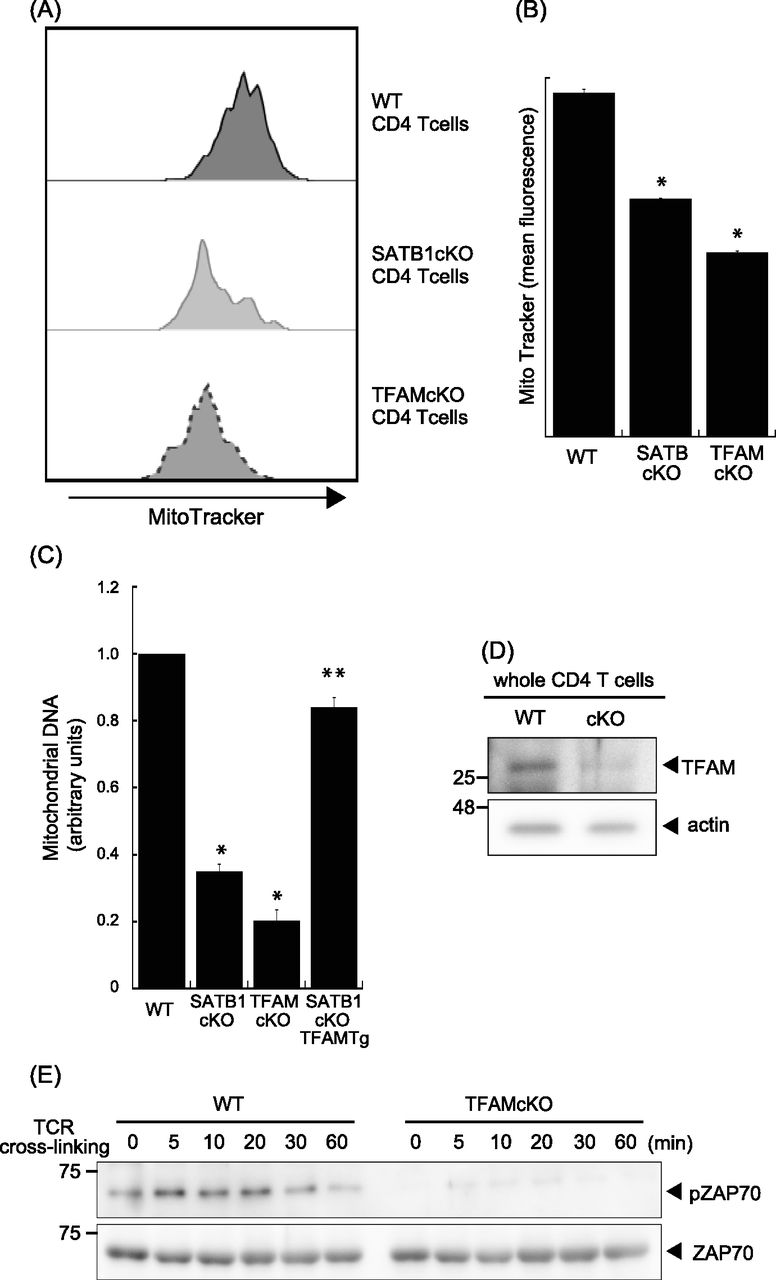
    Figure 4. Loss of TFAM expression reduces T-cell activity.

    (A) Representative MitoTracker staining histograms. WT and SATB1cKO T cells were stained with MitoTracker and analyzed by FACS. (B) Quantification of the mean fluorescence of MitoTracker is shown. (C) Mitochondrial DNA copy numbers in CD4 T cells from WT, SATB1 cKO, TFAMcKO, and SATB1cKO-TFAMTg mice were measured by RT-qPCR. The mitochondrial DNA level was normalized to the nuclear DNA level in each sample. The normalized index is indicated as an arbitrary unit (WT = 1). (D) TFAM and β-actin levels in CD4 T-cell lysates were analyzed by immunoblotting using the respective antibodies. (E) CD4 T cells were prepared from WT and TFAMcKO mice, stimulated for the indicated times with anti-CD3 and anti-CD28 antibodies, lysed, analyzed by SDS–PAGE, and immunoblotted with antibodies against phospho-ZAP70, and ZAP70. Similar results were obtained for three independent experiments. *P < 0.01 versus WT. **P < 0.01 versus SATB1cKO T cells. N = 5. Data are shown as the means ± SD.

  • Figure S4.
    • Download figure
    • Open in new tab
    • Download powerpoint
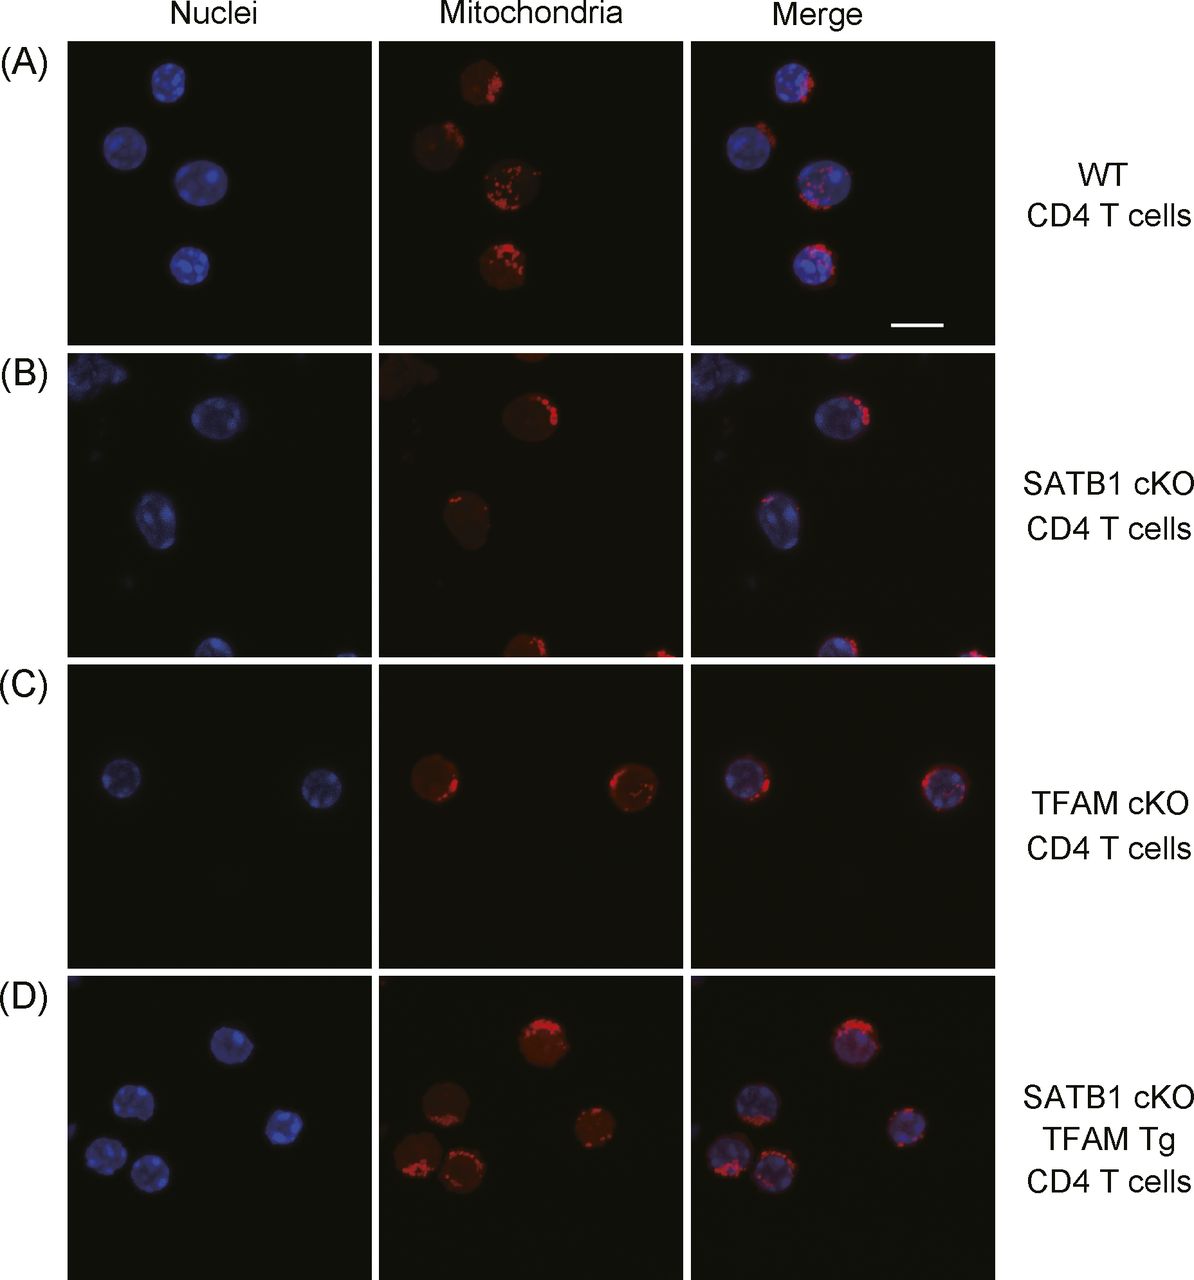
    Figure S4. Confocal imaging of mitochondria.

    (A, B, C, D) WT CD4 T cells (A), SATB1cKO CD4 T cells (B), TFAMcKO CD4 T cells (C), and SATB1cKO-TFAMTg CD4 T cells (D) were stained with MitoTracker (mitochondria) and TO-PRO3 dye (nuclei) and analyzed by confocal microscopy. Scale bar, 10 μm. Data represent three independent experiments.

  • Figure S5.
    • Download figure
    • Open in new tab
    • Download powerpoint
    Figure S5. TFAM mRNA expression was analyzed by RT-qPCR.

    TFAM mRNA transcription levels were analyzed relative to β-actin. Data are shown as the means ± SD for three experiments. *P < 0.01 versus WT.

  • Figure 5.
    • Download figure
    • Open in new tab
    • Download powerpoint
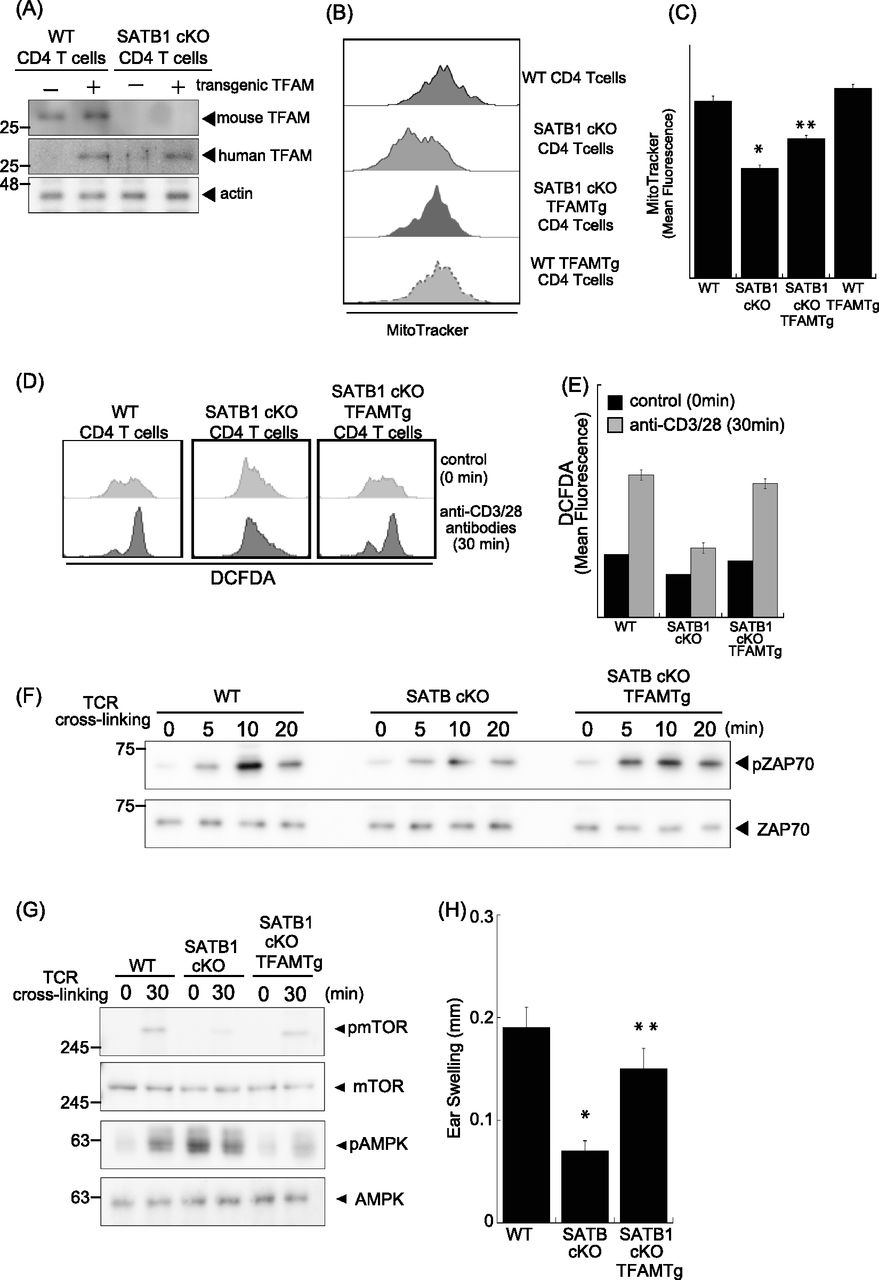
    Figure 5. TFAM expression rescues T-cell activity in SATB1cKO mice.

    (A) Immunoblot analysis of transgenic TFAM and endogenous TFAM in SATB1-sufficient or SATB1-deficinet CD4 T cells. (B) Representative MitoTracker staining histograms. WT, SATB1cKO, SATB1cKO-TFAMTg, and WT-TFAMTg T cells were stained with MitoTracker and analyzed by FACS. (C) Quantification of the mean fluorescence of MitoTracker. *P < 0.01 versus WT. **P < 0.01 versus SATB1cKO T cells. N = 5. Data are shown as the means ± SD. (D) ROS levels in CD4 T cells from WT, SATB1cKO, and SATB1cKO-TFAMTg mice in control and TCR activation treatments were measured by DCFDA staining and flow cytometry. (E) Quantification of the mean fluorescence of DCFDA. (F, G) CD4 T cells were prepared from WT, SATB1cKO, and SATB1cKO-TFAMTg mice and functionally analyzed. T cells were stimulated with anti-CD3 and anti-CD28 antibodies for the indicated times, lysed, analyzed by SDS–PAGE, and immunoblotted with antibodies against phospho-ZAP70, ZAP70, phospho-mammalian target of rapamycin, phospho-AMPK, and AMPK. Similar results were obtained for three independent experiments. (H) Mice were sensitized with 7% PCI in acetone/olive oil. After 7 d, 1% (vol/vol) PCI was applied to the right ear and vehicle alone was applied to the left ear. Ear thickness was measured after 24 h. Means ± SD for 4–5 mice are indicated. *P < 0.01 versus WT. **P < 0.01 versus SATB1cKO T cells. N = 5. Data are shown as the means ± SD.

PreviousNext
Back to top
Download PDF
Article Alerts
Sign In to Email Alerts with your Email Address
Email Article

Thank you for your interest in spreading the word on Life Science Alliance.

NOTE: We only request your email address so that the person you are recommending the page to knows that you wanted them to see it, and that it is not junk mail. We do not capture any email address.

Enter multiple addresses on separate lines or separate them with commas.
SATB1-dependent mitochondrial ROS production controls TCR signaling in CD4 T cells
(Your Name) has sent you a message from Life Science Alliance
(Your Name) thought you would like to see the Life Science Alliance web site.
CAPTCHA
This question is for testing whether or not you are a human visitor and to prevent automated spam submissions.
Citation Tools
SATB1 is necessary for T-cell function
Taku Kuwabara, Fumio Ishikawa, Masataka Ikeda, Tomomi Ide, Terumi Kohwi-Shigematsu, Yuriko Tanaka, Motonari Kondo
Life Science Alliance Sep 2021, 4 (11) e202101093; DOI: 10.26508/lsa.202101093

Citation Manager Formats

  • BibTeX
  • Bookends
  • EasyBib
  • EndNote (tagged)
  • EndNote 8 (xml)
  • Medlars
  • Mendeley
  • Papers
  • RefWorks Tagged
  • Ref Manager
  • RIS
  • Zotero
Share
SATB1 is necessary for T-cell function
Taku Kuwabara, Fumio Ishikawa, Masataka Ikeda, Tomomi Ide, Terumi Kohwi-Shigematsu, Yuriko Tanaka, Motonari Kondo
Life Science Alliance Sep 2021, 4 (11) e202101093; DOI: 10.26508/lsa.202101093
Reddit logo Twitter logo Facebook logo Mendeley logo
  • Tweet Widget
  • Facebook Like
Issue Cover

In this Issue

Volume 4, No. 11
November 2021
  • Table of Contents
  • Cover (PDF)
  • About the Cover
  • Masthead (PDF)
Advertisement

Jump to section

  • Article
    • Abstract
    • Introduction
    • Results
    • Discussion
    • Materials and Methods
    • Acknowledgements
    • References
  • Figures & Data
  • Info
  • Metrics
  • Reviewer Comments
  • PDF

Subjects

  • Immunology

Related Articles

  • No related articles found.

Cited By...

  • No citing articles found.
  • Google Scholar

More in this TOC Section

  • ERK activation blocks ciliary assembly
  • KRAS-mediated (sub)complexes
  • Preference of CAMSAP3 and expansion of microtubule lattice
Show more Research Article

Similar Articles

EMBO Press LogoRockefeller University Press LogoCold Spring Harbor Logo

Content

  • Home
  • Newest Articles
  • Current Issue
  • Archive
  • Subject Collections

For Authors

  • Submit a Manuscript
  • Author Guidelines
  • License, copyright, Fee

Other Services

  • Alerts
  • Twitter
  • RSS Feeds

More Information

  • Editors & Staff
  • Reviewer Guidelines
  • Feedback
  • Licensing and Reuse
  • Privacy Policy

ISSN: 2575-1077
© 2023 Life Science Alliance LLC

Life Science Alliance is registered as a trademark in the U.S. Patent and Trade Mark Office and in the European Union Intellectual Property Office.