


Article Figures & Data
Figures
- Figure S1. Characterization of CRISPR-KO 293T CSB cell line.
(A) The indicated gRNA sequence was used to target the CSB gene in HEK293T cells using CRISPR-Cas9 gene editing. Sequencing of the selected CSB clone revealed deletions on both CSB alleles, one 13 bp deletion and one 2 bp deletion, denoted by red dashes. (B, C) Functional knockout was validated by (B) Western blot and (C) qRT-PCR (n = 6). TUBB = tubulin. (D, E) Growth curves were constructed by counting WT and knockout cells plated at various densities and grown in (D) low glucose (5 mM) or (E) high glucose (25 mM) (n = 3). Information on the 293T XPC derivative is provided in Shuck et al (2020). ns, not significant, ****P < 0.0001.
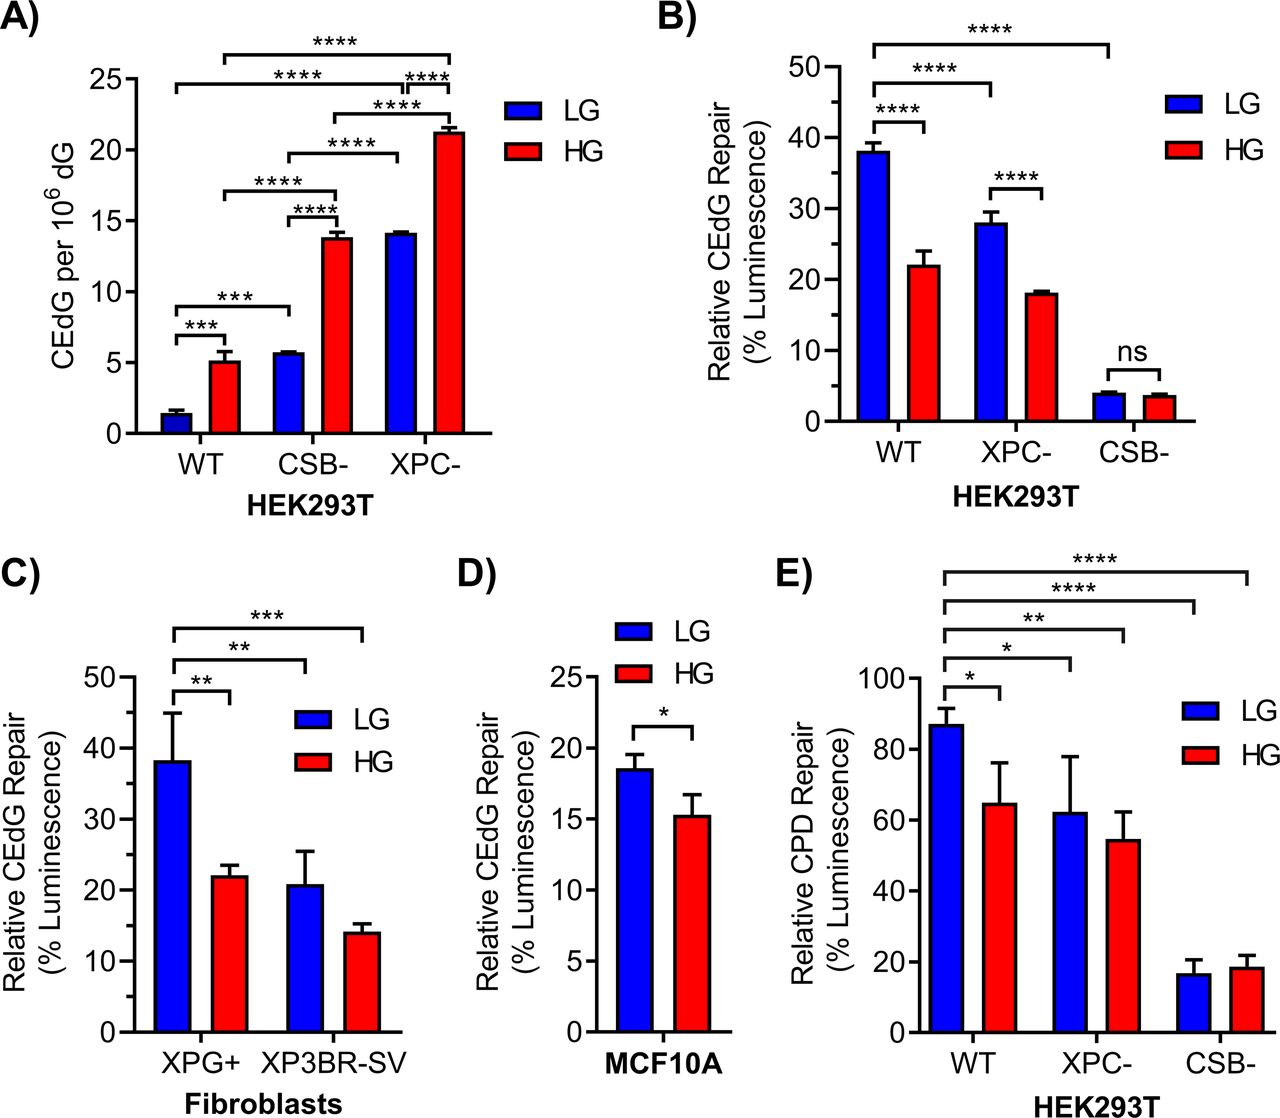
- Figure 1. Chronic elevated glucose inhibits repair of CEdG and cyclobutane pyrimidine dimers by nucleotide excision repair.
(A) CEdG in genomic DNA was quantified by LC–MS/MS in 293T WT, CSB, and XPC cells maintained in LG or HG (n = 3; two-way ANOVA with Tukey’s multiple comparisons). (B) 293T WT, XPC, and CSB cells grown in LG or HG were co-transfected with luciferase reporter plasmid containing 695 CEdG/105 dG (pM1-luc; firefly luciferase) and an undamaged transfection control plasmid (pRL-CMV; Renilla luciferase). 24 h post-transfection luminescence was quantified as a marker of repair (two-way ANOVA with Tukey’s multiple comparisons). (C, D) CEdG repair was also measured in (C) XPG+ (XPG complemented) or XP3BR-SV (XPG mutant) human fibroblasts (366 CEdG/105 dG; two-way ANOVA) and (D) MCF10A breast epithelial cells (366 CEdG/105 dG; unpaired t test). (E) Repair of UV-damaged pM1-luc containing 1.33 μM cyclobutane pyrimidine dimer in 293T WT, XPC, and CSB knockout cells grown in LG or HG (two-way ANOVA with Dunnett’s comparison to WT LG). ns, not significant (P > 0.05), *P < 0.05, **P < 0.01, ***P < 0.001, ****P < 0.0001.
- Figure S2. Repair profiles of nucleotide excision repair-proficient and nucleotide excision repair-deficient cell lines.
(A) LC–MS/MS quantification of CEdG adducts in pM1-luc reacted with MG. (A, B, C, D) Plasmids from (A) were transfected into (B) 293T WT, XPC, and CSB cells or (C) XPG+ (XPG complemented) and XP3BR-SV (repair-deficient XP-G mutant) cells or (D) MCF10A breast epithelial cells and allowed to repair for 24 h before measuring luminescence. (E) ELISA quantification of cyclobutane pyrimidine dimers in UV-damaged pM1-luc. (E, F) Plasmids from (E) were transfected into (F) 293T WT, XPC, and CSB cells and incubated for 24 h before measuring luminescence. Significant differences in WT versus knockout cells were analyzed by two-way ANOVA for each plasmid damage level. ****P < 0.0001.
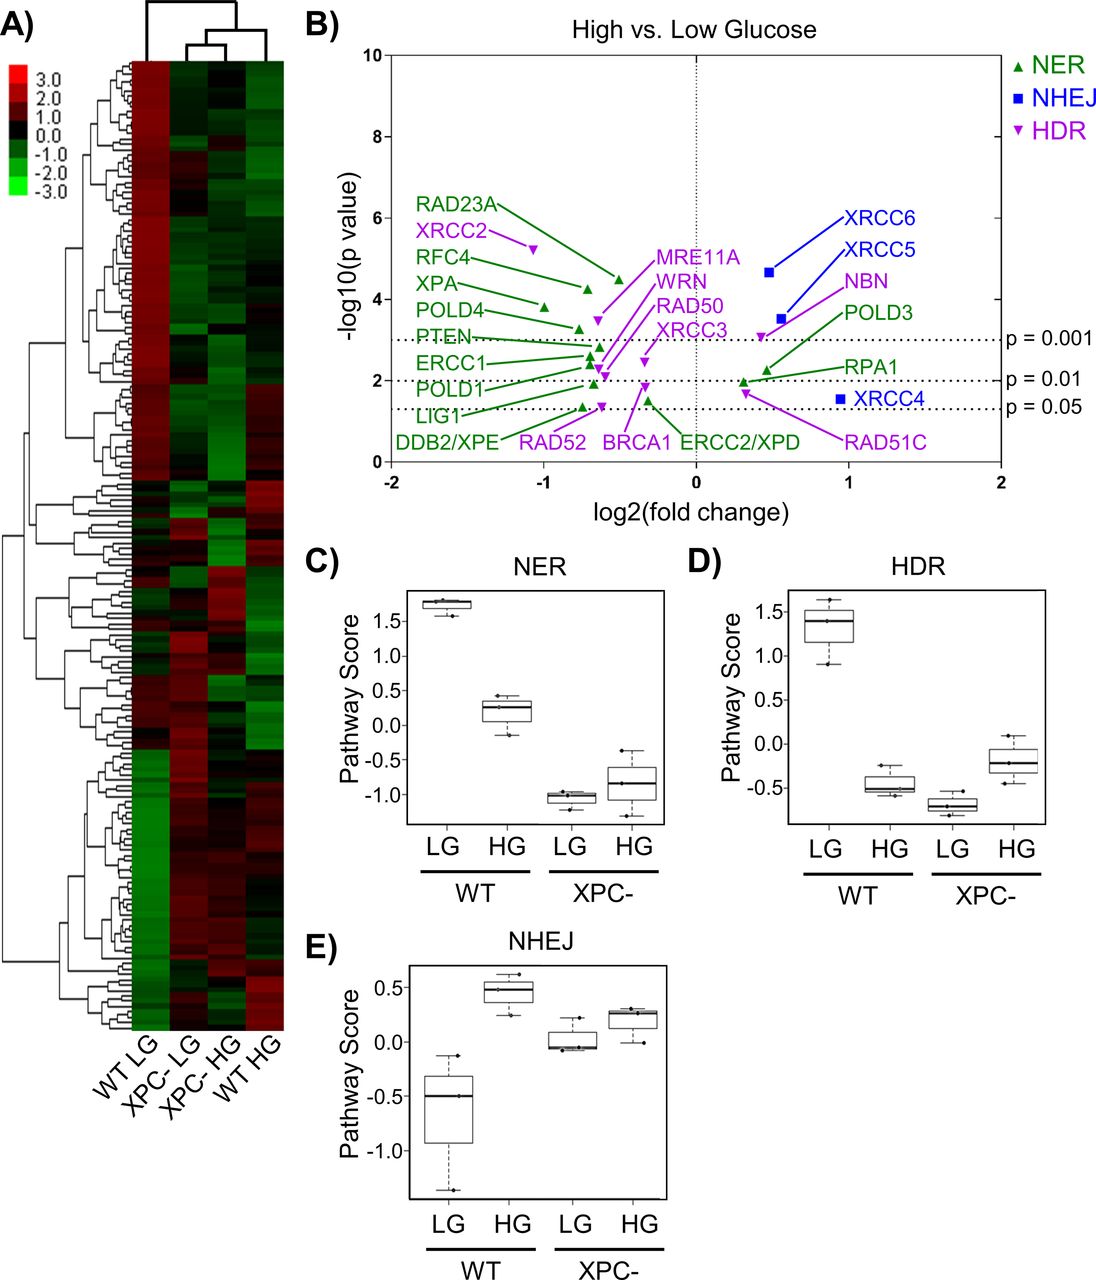
- Figure 2. Chronic elevated glucose alters the expression of DNA repair genes.
(A) Expression of DNA repair genes from 293T WT and XPC cells grown in LG or HG assessed using the NanoString DNA Damage and Repair panel. Expression is presented as the average of each group (triplicate) with high relative expression depicted in red and low relative expression in green. Genes were hierarchically grouped by agglomerative clustering. (B) Significant (P < 0.05) changes in mRNA expression of repair genes induced by elevated glucose are displayed by volcano plot. (C, D, E) Pathway scores were calculated for specific DNA repair pathways using NanoString nSolver Advanced Analysis software including: (C) nucleotide excision repair, (D) homology directed repair, and (E) non-homologous end joining.
- Figure 3. Chronic elevated glucose reduces nucleotide excision repair (NER) gene expression and protein levels.
(A) NER gene expression was assessed by qRT-PCR following culture of 293T cells in LG or HG (n = 3), normalized to tubulin. Statistical analysis by two-way ANOVA with Sidak’s multiple comparisons test. (A, B) NER gene expression measured as in (A) for MCF10A cells (n = 4). (C) Protein levels of key NER factors were measured by metal-assisted protein quantification with ICP–MS detection in 293T cells grown in LG or HG (normalized to actin). Antibody metal labels: XPA 172Yb, XPC 163Dy, XPG 155Gd, and actin 171Yb. (D) Metal-assisted protein quantification of HIF-1α (161Dy) and NER proteins in livers extracted from non-diabetic (Leprwt/wt) and diabetic (Leprdb/db) mice, normalized to actin (n = 5; multiple t tests with Holm-Sidak multiple comparisons correction).
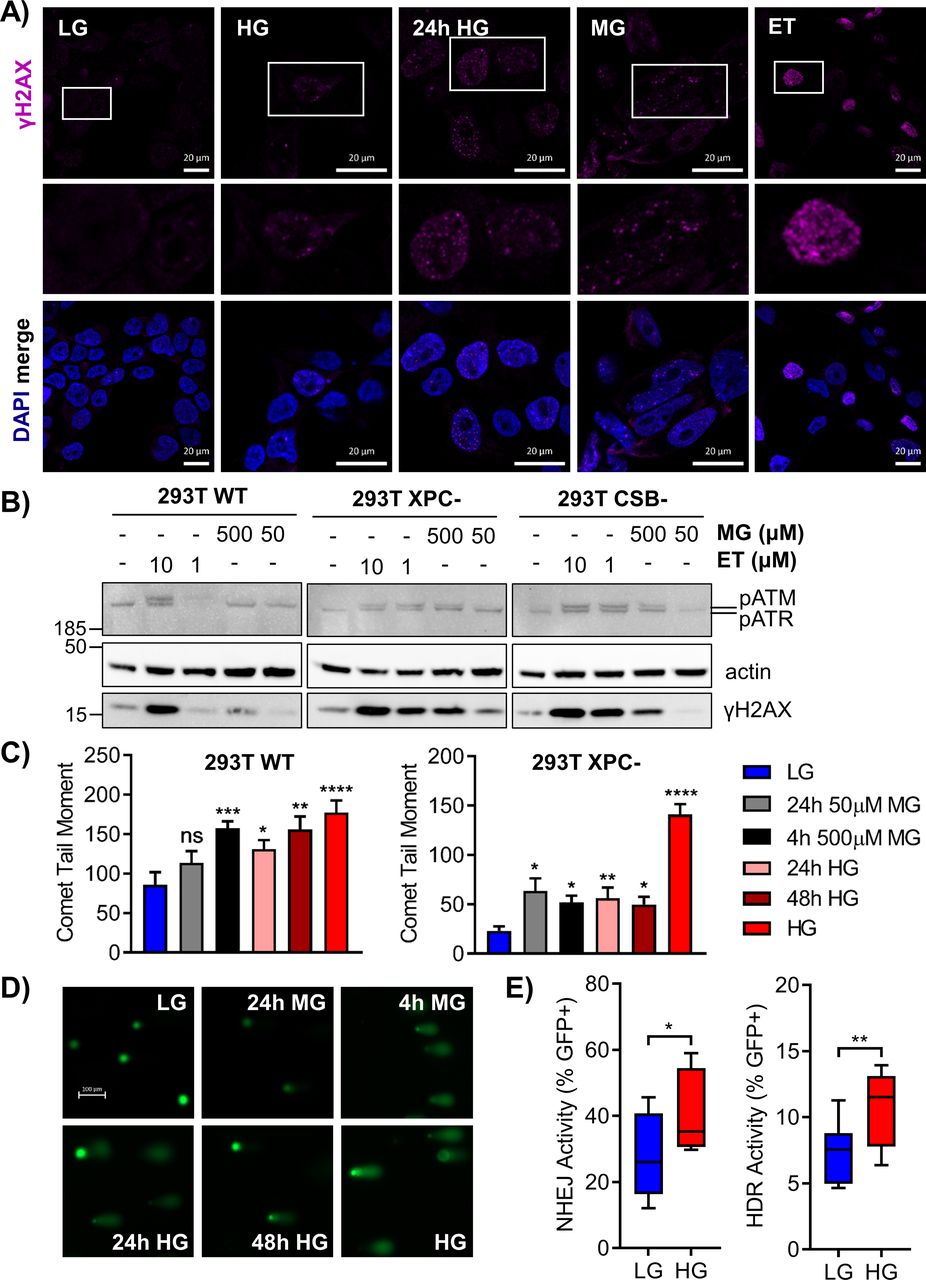
- Figure 4. Glycation stress induces DNA strand breaks, H2AX and ATR phosphorylation, and DSB repair.
(A) 293T WT cells were exposed to chronic HG, 24 h HG, 4 h MG (50 μM), or 4 h etoposide (ET; 10 μM) and γH2AX foci were analyzed by immunofluorescence. Locations of enlarged insets are depicted by white boxes (scale bar = 20 μm). (B) 293T WT and nucleotide excision repair-deficient cells were grown in LG and treated with 500 or 50 μM MG and 10 or 1 μM etoposide (ET) for 4 h. Subsequent phosphorylation of H2AX (17 kD), ATM (350 kD), and ATR (300 kD) was assessed by Western blot. (C) 293T WT and XPC cells were subjected to an alkaline comet assay after various MG or glucose treatments. Comet tail moment was quantified and graphed as mean ± SEM. (D) Representative comet images from treated WT cells; scale bar = 100 μm. (E) Non-homologous end joining and HDR activity were measured via EJ7 and DR-GFP repair assays, respectively (60 μg transfections). DSBs were induced in GFP reporter plasmids by a CRISPR-Cas9 targeting system, and repaired GFP+ cells were detected by flow cytometry. Activity is presented as %GFP+ cells normalized to a transfection control (n = 10; three independent transfections, unpaired t test).
- Figure S3. Elevated glucose increases H2AX phosphorylation, DNA strand breaks, and DSB repair in nucleotide excision repair-deficient cells.
(A) 293T XPC cells were exposed to chronic HG, 24 h HG, 4 h MG (50 μM), or 4 h etoposide (ET; 10 μM) and γH2AX foci were analyzed by immunofluorescence. Locations of enlarged insets are depicted by white boxes (scale bar = 20 μm). (B) Total H2AX and phosphorylated γH2AX protein were assessed via Western blot in 293T WT cells cultured in LG, 24 h HG, or chronic HG. (C) Levels of total ATM (350 kD), ATR (300 kD), and H2AX (17 kD) in treated 293T cells. (D) 293T CSB cells treated with 24 h MG (50 μM), 24 h HG, 48 h HG, or chronic HG were subjected to an alkaline comet assay to measure DNA strand breaks. Comet tail moment was quantified and graphed as mean ± SEM (>50 cells quantified per condition). (E, F) Non-homologous end joining activity and (F) HDR activity were measured as described using 60 and 150 μg transfections, respectively, in 293T WT, XPC, and CSB cells grown in LG or HG (n = 6; two-way ANOVA with Tukey’s multiple comparisons). ns, not significant, *P < 0.05, **P < 0.01, ***P < 0.001, ****P < 0.0001.
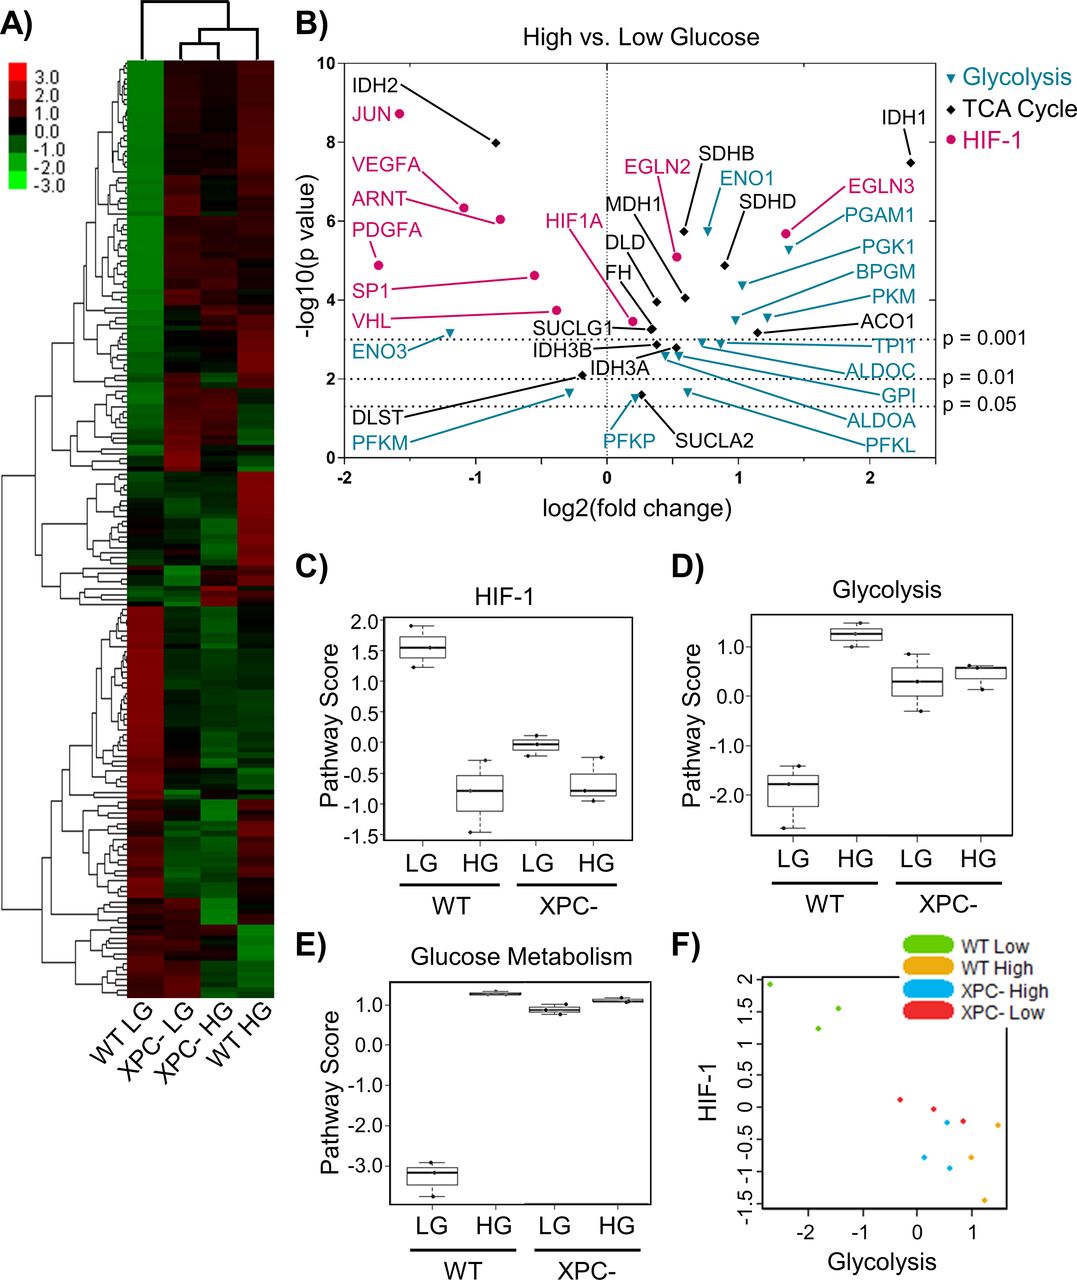
- Figure 5. Chronic elevated glucose alters the expression of metabolic genes.
(A) The expression profile of metabolic genes in 293T WT and XPC cells maintained in LG or HG was assayed using the NanoString Cancer Metabolism panel. Expression is presented as an average of each group (triplicate) with high relative expression depicted in red and low relative expression in green. Genes were hierarchically grouped by agglomerative clustering. (B) Significant (P < 0.05) changes in mRNA expression of metabolism genes induced by elevated glucose are displayed as a volcano plot. (C, D, E) Pathway scores were calculated for specific metabolic pathways using NanoString nSolver Advanced Analysis software, including: (C) HIF-1, (D) glycolysis, and (E) glucose metabolism. (F) Correlation between glycolysis and HIF-1 scores across all samples.
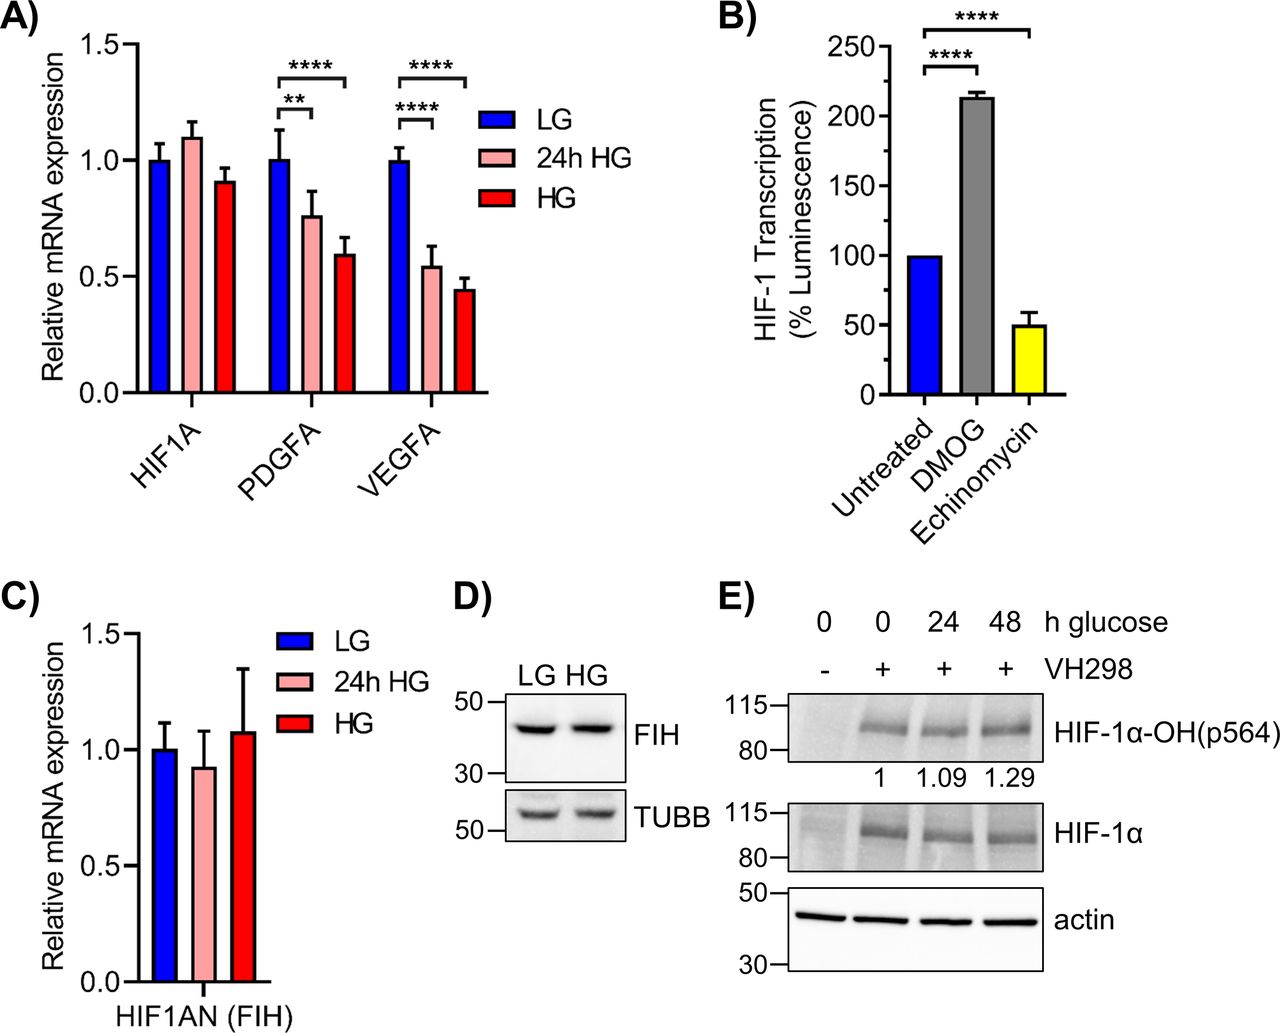
- Figure S4. Elevated glucose increases PHD-mediated HIF-1α hydroxylation without affecting FIH expression.
(A) qRT-PCR of HIF1A and its canonical targets PDGFA and VEGFA in 293T cells grown in LG, 24 h HG, or chronic HG (n = 4). (B) 293T WT cells grown in LG were treated with 250 μM DMOG or 1 μM echinomycin for 6 h. Relative HIF-1 transcription activity was measured by HRE-luciferase assay. (C) HIF1AN mRNA, which codes for FIH, was assessed via qRT-PCR in 293T WT cells exposed to LG, 24 h HG, or chronic HG (n = 3). Statistical analysis by one-way ANOVA with Dunnett’s multiple comparisons. (D) FIH (40 kD) and TUBB (55 kD) protein levels in 293T WT cells maintained in LG or HG. (E) 293T WT LG cells were exposed to elevated glucose for 24 or 48 h and treated with VH298, a VHL inhibitor, at 50 μM for 2 h. HIF-1α and its hydroxylation at pro564 were assessed via Western blot, with densitometric quantitation normalized to β-actin. **P < 0.01, ****P < 0.0001.
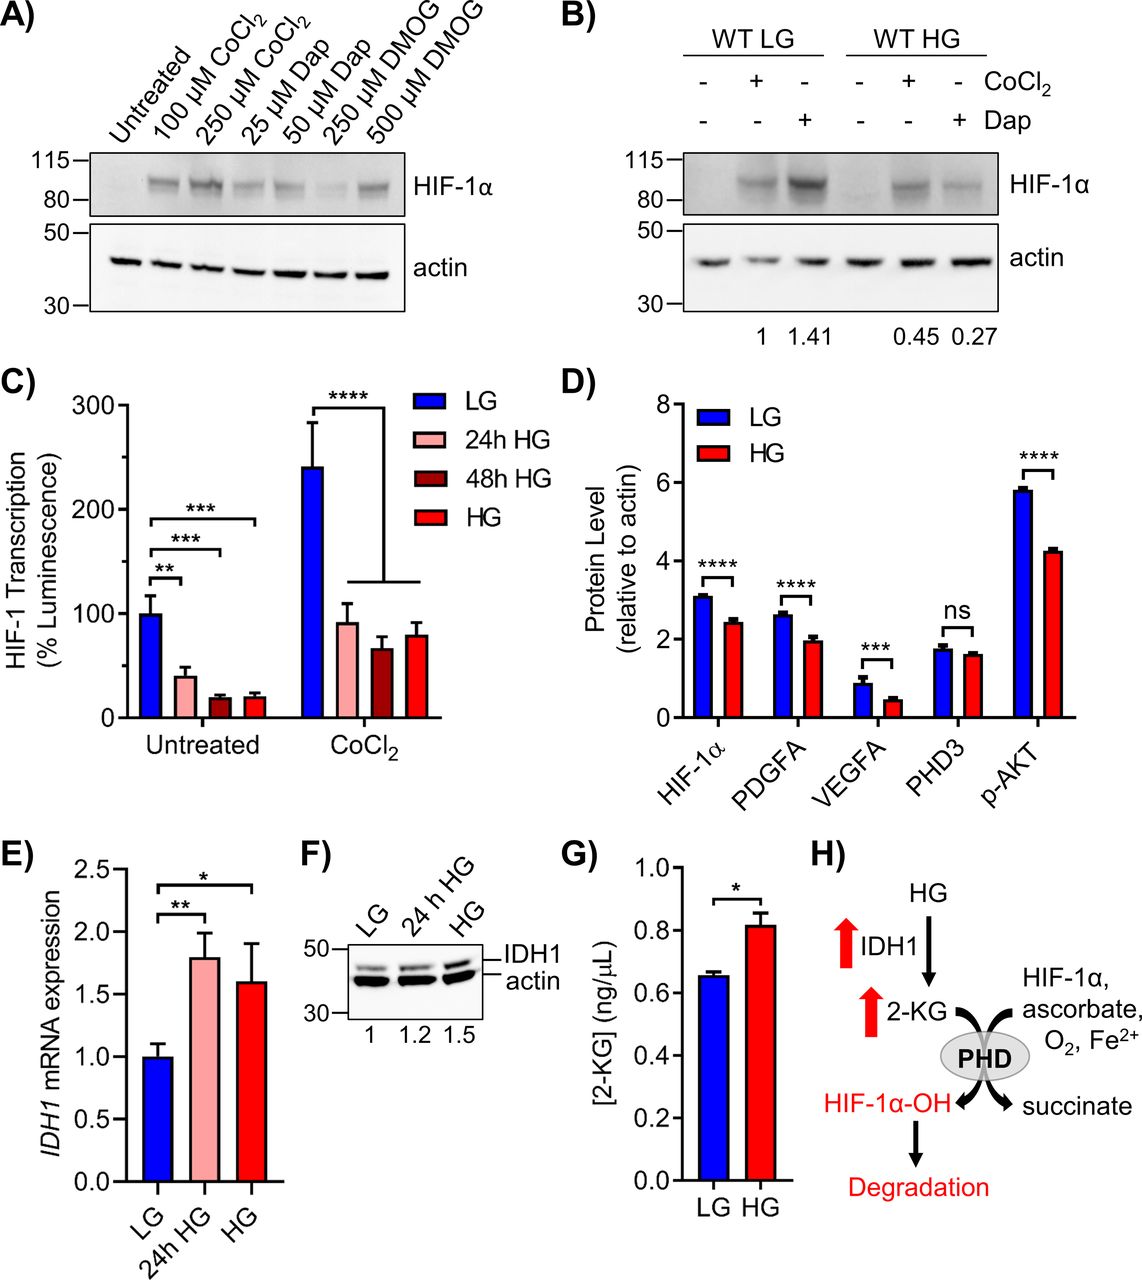
- Figure 6. Elevated glucose destabilizes HIF-1α through increased PHD activity.
(A) 293T WT cells in LG were treated with the indicated doses of PHD inhibitors CoCl2, daprodustat (Dap), and DMOG for 6 h to stabilize HIF-1α protein. (B) 293T WT cells in LG or HG were treated with 100 μM CoCl2 or 50 μM daprodustat and HIF-1α was assessed by Western blot. Relative changes in HIF-1α expression, normalized to β-actin by densitometry, are shown below the blot. (C) HRE-luciferase plasmid was transfected into 293T WT cells exposed to acute or chronic glucose and/or treated with 100 μM CoCl2 for 24 h. Changes in HIF-1 transcriptional activity were measured via relative luminescence (normalized to transfection control) and analyzed by two-way ANOVA with Sidak’s multiple comparisons. (D) Metal-assisted protein quantification of HIF-1α and downstream target proteins from WT cells grown in LG or HG. Antibody metal labels: HIF-1α 161Dy, PDGFA 165Ho, VEGFA 164Dy, PHD3 151Eu, p-AKT 159Tb, and actin 171Yb. (E) qRT-PCR analysis of IDH1 mRNA in 293T WT cells grown in LG, 24 h HG, or chronic HG (n = 3, one-way ANOVA). (F) Corresponding IDH1 (47 kD) protein analysis. (G) ELISA quantification of 2-KG in 293T WT LG or HG cells. (H) Schematic showing the up-regulation of IDH1 and 2-KG production in HG, leading to PHD-mediated hydroxylation and degradation of HIF-1α.
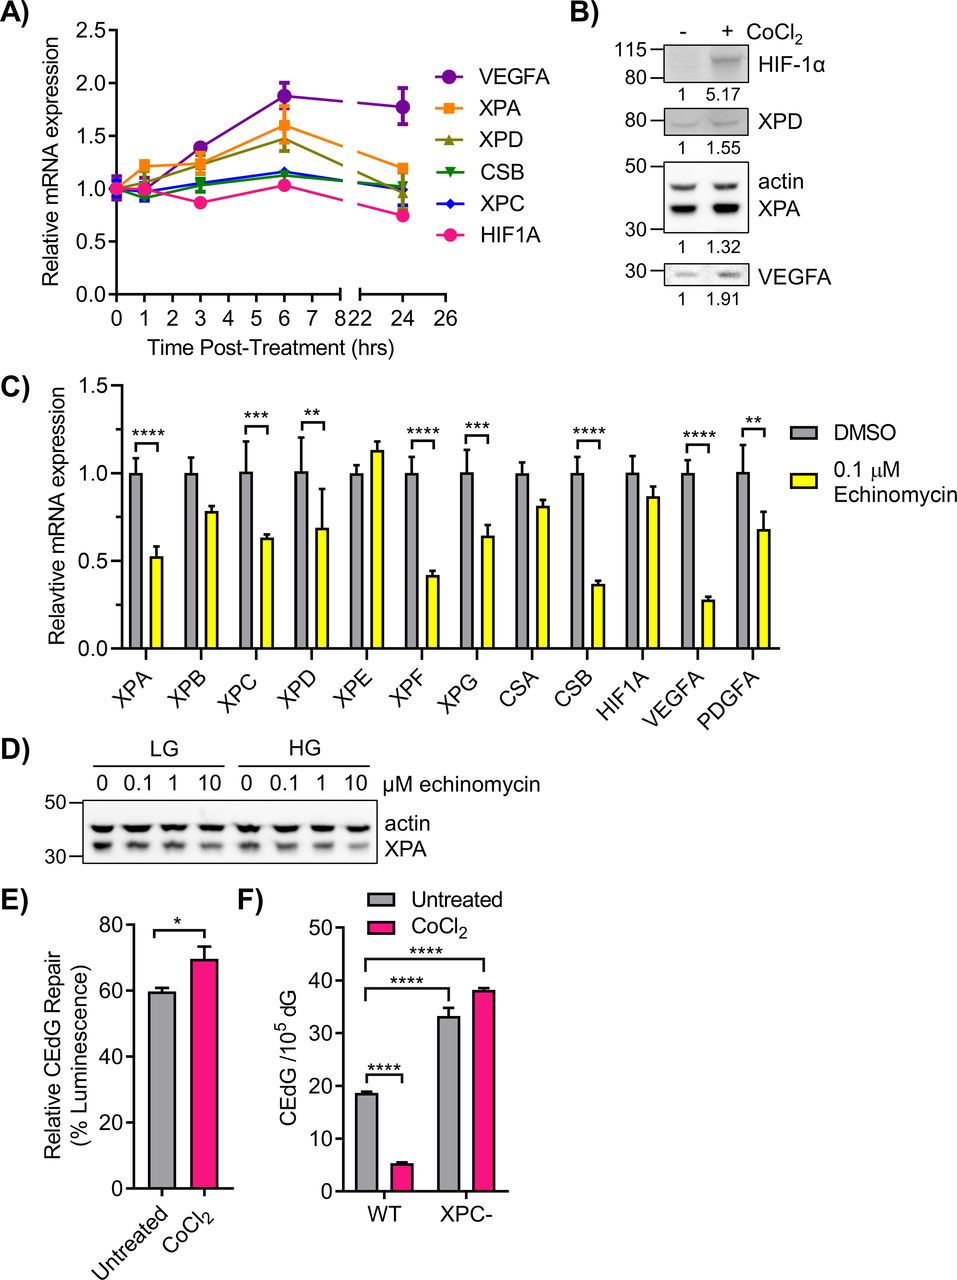
- Figure 7. Nucleotide excision repair (NER) gene expression and function are regulated by HIF-1α.
(A) 293T WT HG cells were treated with 50 μM daprodustat for 0–24 h to stabilize HIF-1α. NER genes were monitored via qRT-PCR (n = 2). (B) 293T WT cells in HG were treated with 100 μM CoCl2 for 6 h. HIF-1α, XPD, XPA, and VEGFA proteins were detected by Western blot and quantified by densitometry, normalized to β-actin. (C) qRT-PCR measurement of NER gene expression in cells treated for 6 h with DMSO (vehicle) or 0.1 μM echinomycin, an inhibitor of HIF-1α binding to HREs (n = 3). (D) 293T WT cells in LG or HG were treated with increasing doses of echinomycin and XPA protein was assessed by Western blot. (E) 293T HG cells were transfected with CEdG-modified pM1-luc (366 CEdG/105 dG) and treated with CoCl2 6 h before measuring luminescence (paired t test). (F) WT cells in HG and XPC cells in LG were treated with CoCl2 for 24 h before measurement of CEdG in genomic DNA by LC–MS/MS (one-way ANOVA with Tukey’s multiple comparisons, technical triplicate).
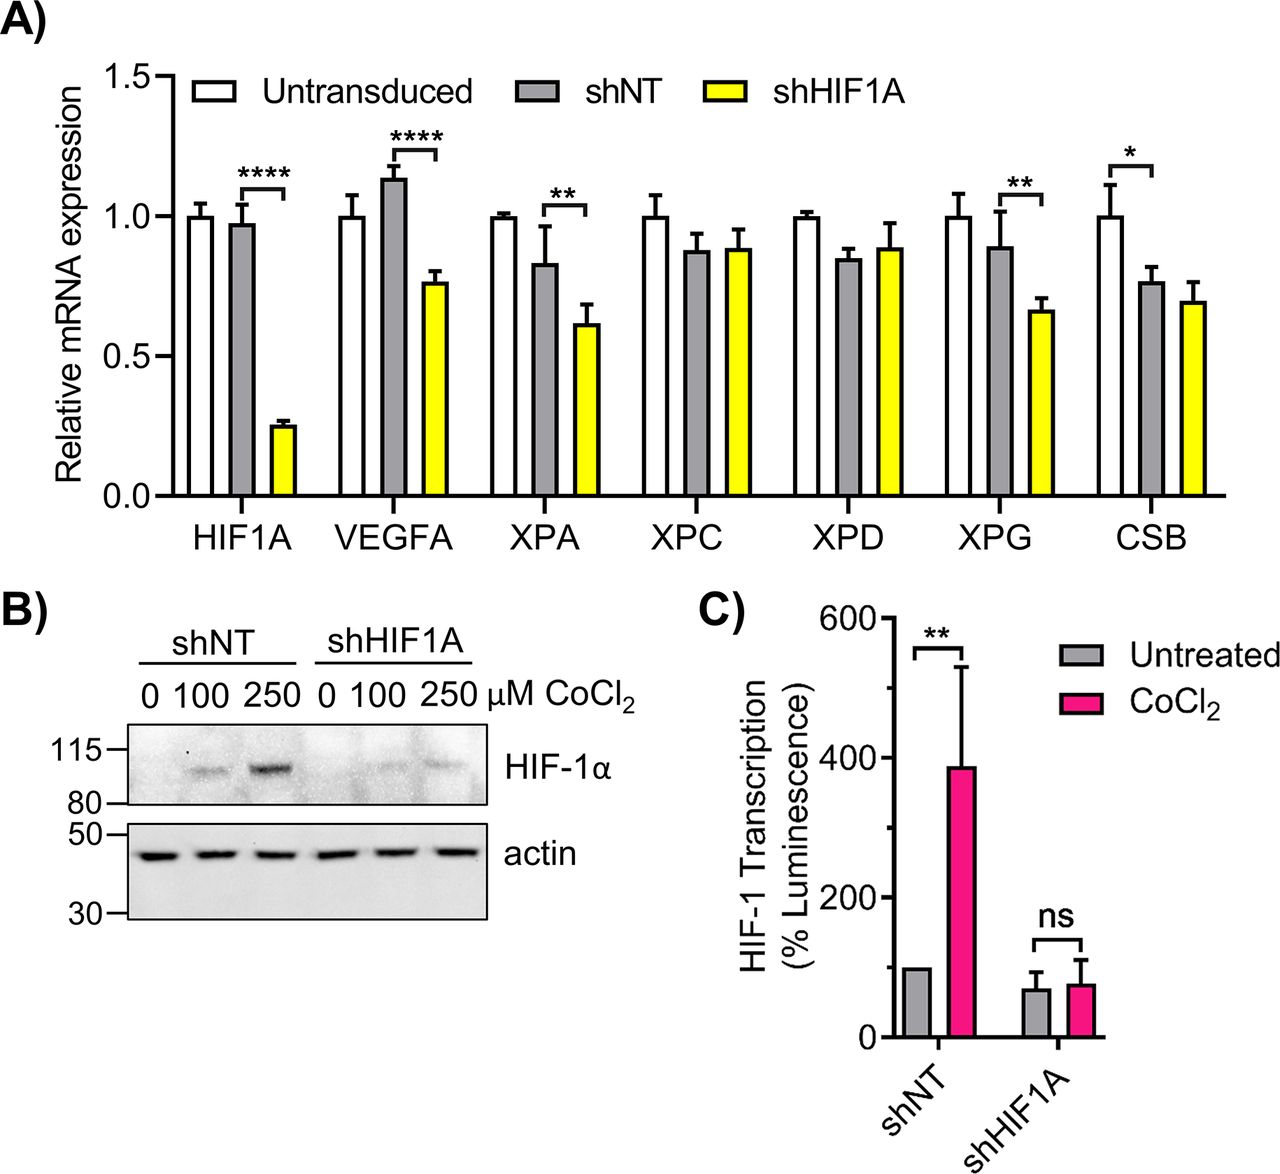
- Figure S5. Knockdown of HIF1A impairs nucleotide excision repair gene expression.
(A) 293T cells were transduced with lentivirus containing non-targeting shRNA (shNT) or HIF1A-targeted shRNA (shHIF1A). HIF1A and nucleotide excision repair genes were analyzed by qRT-PCR (n = 3; two-way ANOVA with Sidak’s multiple comparisons). (B, C) 293T shNT and shHIF1A cells were treated with CoCl2 and (B) HIF-1α protein was measured by Western blot and (C) HIF-1 transcriptional activity was measured by the HRE luciferase assay. ns, not significant, *P < 0.05, **P < 0.01, ***P < 0.001, ****P < 0.0001.
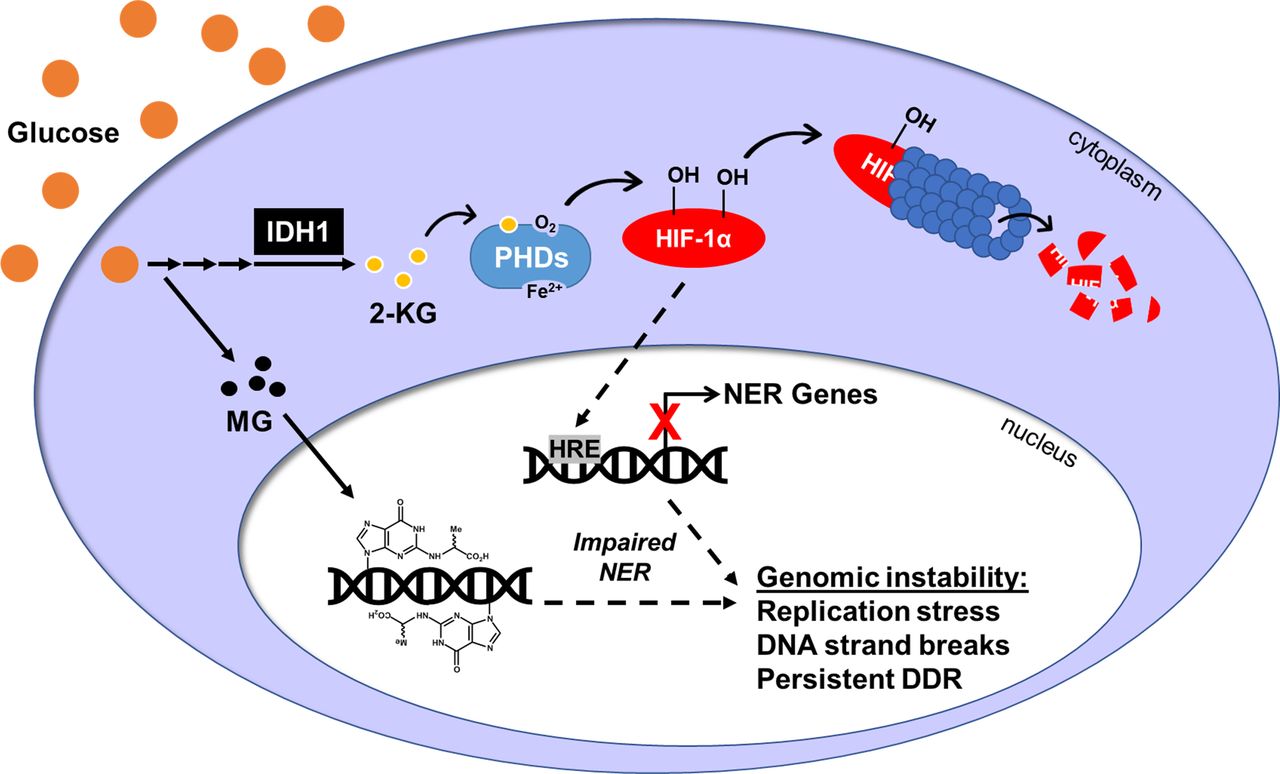
- Figure 8. Hyperglycemia induces DNA damage and inhibits its repair.
Exposure to chronic high glucose up-regulates cytoplasmic IDH1 enzyme leading to an accumulation of 2-KG, which enhances PHD activity. PHDs hydroxylate HIF-1α, targeting it for proteasomal degradation. Reduction in HIF-1α protein attenuates the expression of HRE-inducible genes, including many genes in the nucleotide excision repair (NER) pathway. Transcriptional and subsequent translational loss of NER factors impairs NER efficiency, which allows MG-induced CEdG lesions to remain in the genome. CEdG accrual can lead to replication stress, DNA strand breaks, and activation of the DNA damage response. Overall, this will increase genomic instability and elevate cancer risk in individuals with hyperglycemia.


Supplementary Materials
Table S1 Primers for qRT-PCR analyses.
Supplemental Data 1.
NanoString DNA damage and repair panel.[LSA-2021-01159_Supplemental_Data_1.xlsx]
Supplemental Data 2.
NanoString cancer metabolism panel.[LSA-2021-01159_Supplemental_Data_2.xlsx]


In this Issue
Subjects
Related Articles
Cited By...
- No citing articles found.