


Article Figures & Data
Figures
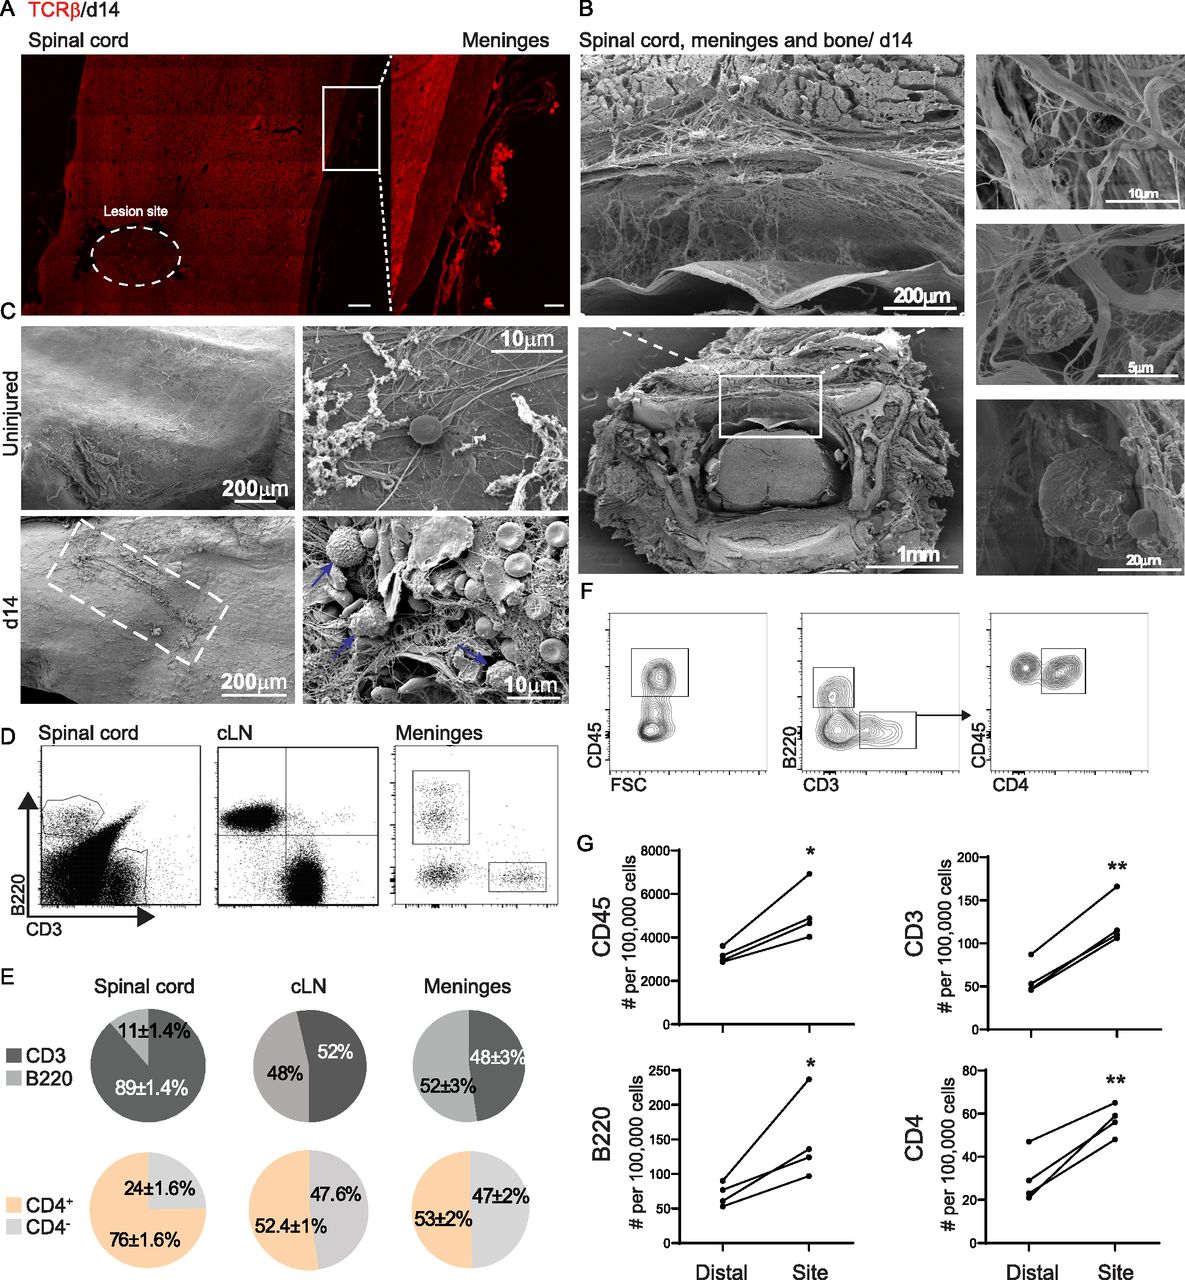
- Figure 1. Lymphocyte aggregation in the spinal cord meninges after spinal cord injury (SCI).
(A) Representative immunofluorescent staining of TCRβ+ cells in the spinal cord parenchyma and the adjacent meninges 14 d following SCI; scale bar: 100, 20 μm inset. (B) Transverse scanning electron microscopy image of spinal cord including the bone 14 d after SCI, showing separation of meningeal layers and the presence of cells on the meninges. (C) Scanning electron microscopy images of spinal cord meninges derived from uninjured animals (upper panel) and at day 14 after SCI (lower panel), taken at different magnifications. (D) Representative flow cytometry plots demonstrating the composition of B and T cells at the spinal cord parenchyma, draining cervical lymph node, and spinal cord meninges. n = 4; each sample represents a pool of two animals. (E) Flow cytometry quantification of T and B cell ratio out of total lymphocytes (upper panel), and of CD4+ and CD4- out of total T cells (lower panel) in the spinal cord parenchyma, cervical lymph node and spinal cord meninges at day 14 following SCI. n = 4; each sample represents a pool of two animals. Data shown are representative of at least three independent experiments. (F) Representative flow cytometry plots demonstrating the gating strategy for characterization of the leukocyte and lymphocyte populations in the spinal cord meninges. n = 4; each sample represents a pool of two animals. (G) Flow cytometry quantification of leukocytes and lymphocyte populations present at the lesion site meninges versus those located distally to the lesion site; each sample represents pooled tissue from two animals. *P < 0.05. **P < 0.01. Data are presented as mean ± SEM.
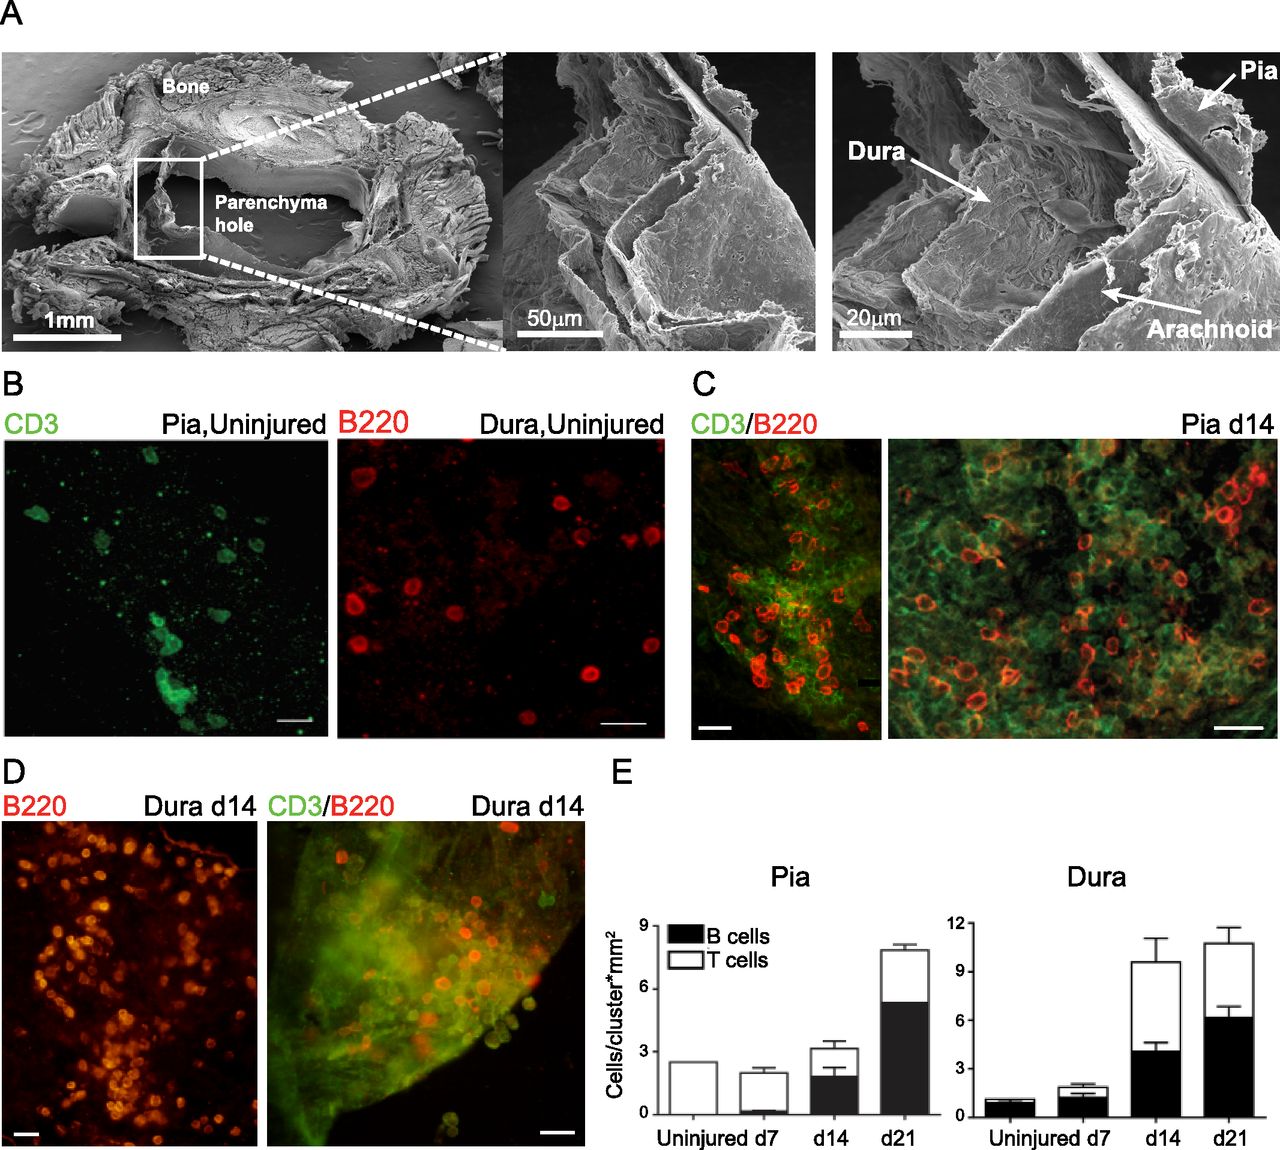
- Figure 2. Segregation of the meningeal lymphocyte niche into the anatomical layers.
(A) Representative scanning electron microscopy (SEM) images showing separation of the three spinal cord meningeal layers. (B) Representative immunofluorescent whole-mount staining of the spinal cord pia and dura meningeal layers, for T cells and B cells under uninjured conditions. Scale bar: 20 μm. (C, D) Representative immunofluorescent whole-mount staining of the pia (C), and dura (D) meningeal B- and T-cell clusters at d 14 after SCI. Scale bar; 50 μm. (E) Whole-mount quantification of the number of B cells (black) or T cells (white) in each cluster present at the pia and dura layers of uninjured mice, and along different time points following SCI. (E) Results are pooled from three animals at each time point, and normalized to the indicated area.
- Figure S1. Microdissection of the three spinal cord meningeal layers.
(A) Representative SEM images showing separation of spinal cord meningeal layers attached to the bones, and to the spinal cord parenchyma. Scale bar: 500 μm, 1 mm. (B) Representative SEM images showing morphology of spinal cord meningeal layers pia, arachnoid and dura. Scale bar: 20 μm. (C) Macro-photographs of spinal cord meninges during microdissection.
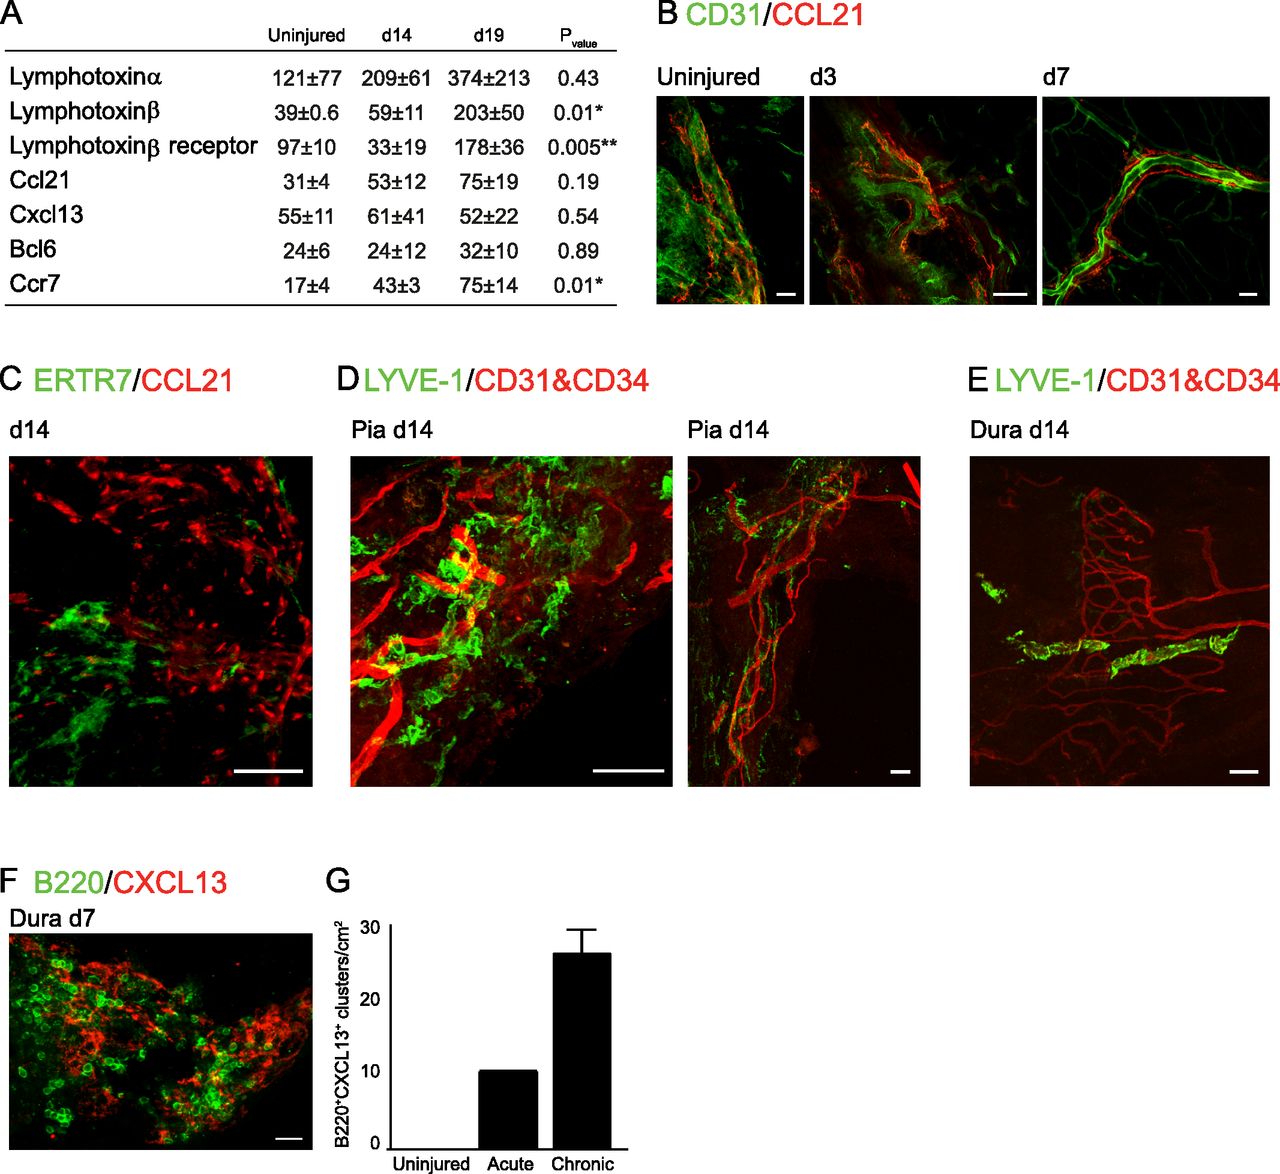
- Figure 3. Presence of lymphogenesis factors in the spinal cord meninges.
(A) Gene expression evaluation of lymphogenesis factors in spinal cord meninges adjacent to the injury site, at different time points after the insult, and in uninjured mice, n = 2–4; each sample represents a pool of three animals. ANOVALtα; F = 1.1, P = 0.43. ANOVALtβ; F = 12.9, P = 0.01. ANOVACcl21; F = 2.3, P = 0.18. ANOVACxcl13; F = 0.7, P = 0.54. ANOVABcl6; F = 0.11, P = 0.89. ANOVACcr7; F = 10.3, P = 0.01. ANOVALtβr; F = 14.5, P = 0.005. (B) Whole-mount staining of CD31 and CCL21 in brain meninges, at days 3 and 7 after SCI, and in uninjured mice. Uninjured and day 3 sections: scale bar; 50 μm; day 7 section: scale bar; 100 μm. (C) Immunofluorescent whole-mount staining of spinal cord meninges 14 d after SCI for reticular fibroblasts (ERTR7) and the T-cell chemoattractant molecule, CCL21. Scale bar: 50 μm. (D, E) Immunofluorescent whole-mount staining of spinal cord meninges 14 d after SCI for lymphatic vessels (LYVE-1) and endothelium (CD31, CD34) in the pia (D), and the dura (E). Scale bar; 50 μm. (F, G) Immunofluorescent whole-mount staining of dura mater at d 7 after SCI for B220+ B cells, and for the B cell-associated chemokine, CXCL13, and (G) quantification of the number of co-localized B cell clusters with CXCL13 expression, under uninjured conditions, and at acute (day 7 after SCI) and chronic (days 14 and 21 after SCI) phases of the response to the injury. Results are pooled from three animals at each time point, and normalized to the tissue area. Scale bar; 50 μm. Asterisk in (A) indicates statistically significant differences after ANOVA post-hoc analysis using Tukey’s honestly significant difference (*, relative to uninjured; ** in LTβr, relative to d 14 after SCI) *P < 0.05. **P < 0.01. Data are presented as mean ± SEM.
- Figure 4. Meningeal lymphocytes are activated and share features of tertiary lymphoid structures.
(A) Gene expression analysis of isolated B220+ B and CD4+ T cells, from the spinal cord meninges and cervical lymph node 14 d after SCI, for evaluation of cytokines and transcription factors associated with inflammation and lymphocyte activation. Tissues from 20 animals were pooled; data shown are representative of two independent experiments; red and blue indicate high and low relative expression, respectively. (B) Quantification of B220low and B220high cells at the meninges in uninjured animals (black) and at day 14 after SCI (white); n = 2–4; each sample represents a pool of four animals. Data shown are representative of four independent experiments. (C, D) Immunofluorescent whole-mount staining of spinal cord meninges for IgD+ (C), and IgM+ (D) B cells at d 14 after SCI. Scale bar; 50 μm. (E) Flow cytometry plots indicating composition of IgM+ and IgD+ cells out of B220low and B220high B-cell subsets at the spinal cord meninges, n = 2 samples; each sample represents a pool of two animals. Data shown are representative of two independent experiments. (F) Density flow cytometry plot demonstrating the presence of PNA+GL7+ GC B cells at the meninges at d 14 after SCI. Meningeal tissues were pooled from four animals. (G) Representative immunofluorescent whole-mount staining at d 14 after SCI, of dura mater samples for proliferating Ki67+ cells and B cells. Asterisks indicate non-proliferating B cells. Scale bar; 50 μm. (H) Representative immunofluorescent whole-mount staining of meninges, demonstrating the proliferating BrdU+CD3+ T cells. Asterisks indicate non-proliferating T cells. Scale bar; 50 μm. (I) Representative immunofluorescent whole-mount staining of meningeal CD11c+ DC in close proximity to CD3+ T cells at d 14 after SCI. Scale bar; 50 μm. (J) Flow cytometry density plots of CD4+ T cells isolated from cLN and meninges adjacent to the lesion site 14 d after SCI, comparing the composition of CD44high memory T cells, and the subpopulations of central-like and effector-like memory T cells. Results are representative of two experiments, n = 2; each sample represents a pool of four animals. **P < 0.01; Data are presented as mean ± SEM.
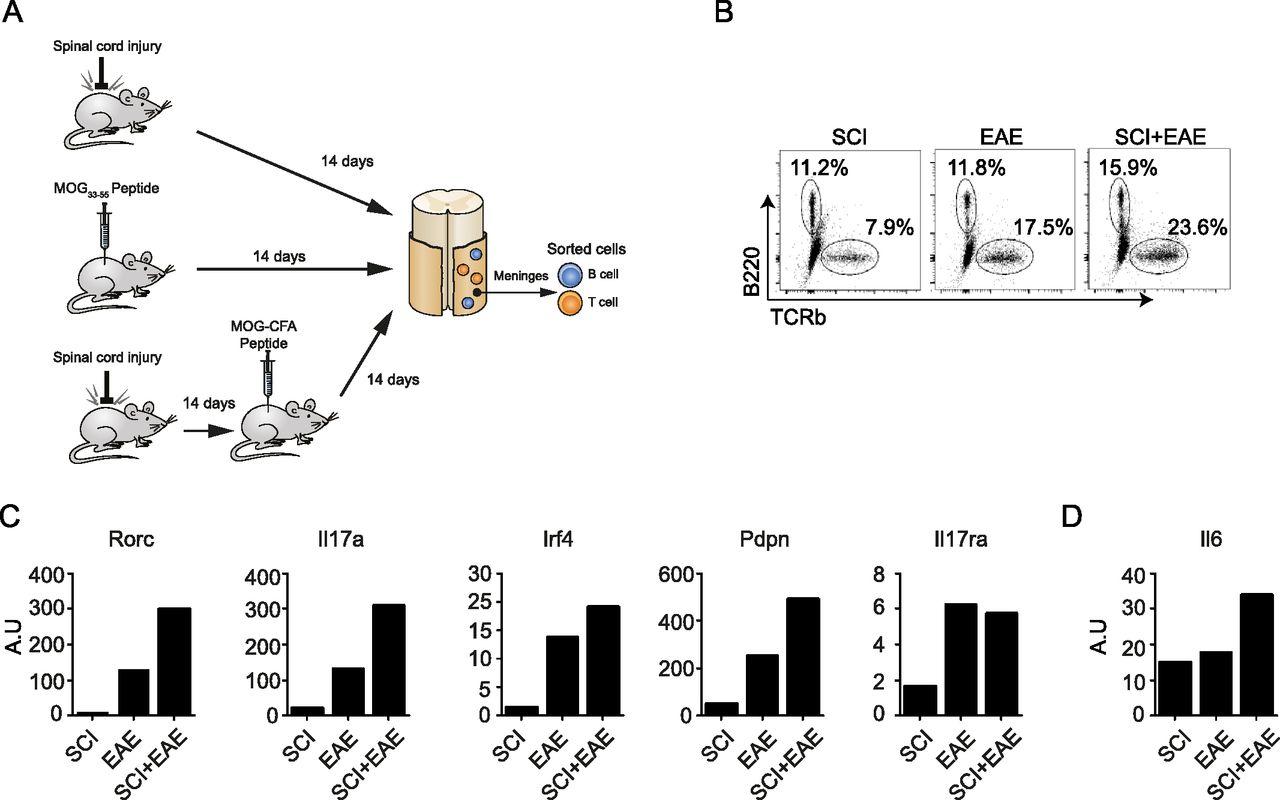
- Figure 5. Meningeal TLS following spinal cord injury affects the spine meminges inflammatory response occurring in EAE pathology.
(A) A scheme depicting the experimental design of Myelin Oligodendrocyte Glycoprotein (MOG) immunization after SCI. Naïve WT mice (EAE), or mice 14 d after SCI (SCI+EAE) were immunized with the encephalitogenic MOG peptide. Animals subjected to SCI-only served as controls (SCI); cells were sorted by fluorescence activated cell sorting 14 d after MOG immunization, or after SCI (controls). (B) Flow cytometry plots showing TCRβ+ T cells and B220+ B cells isolated from spinal cord meninges under the different conditions detailed in (A). (C, D) qRT-PCR results for selected genes expressed by meningeal CD4+ T cells (C), and B220+ B cells (D) derived from spinal cord meninges under the different conditions detailed in (A). Each condition represents a pool of 10 mice.
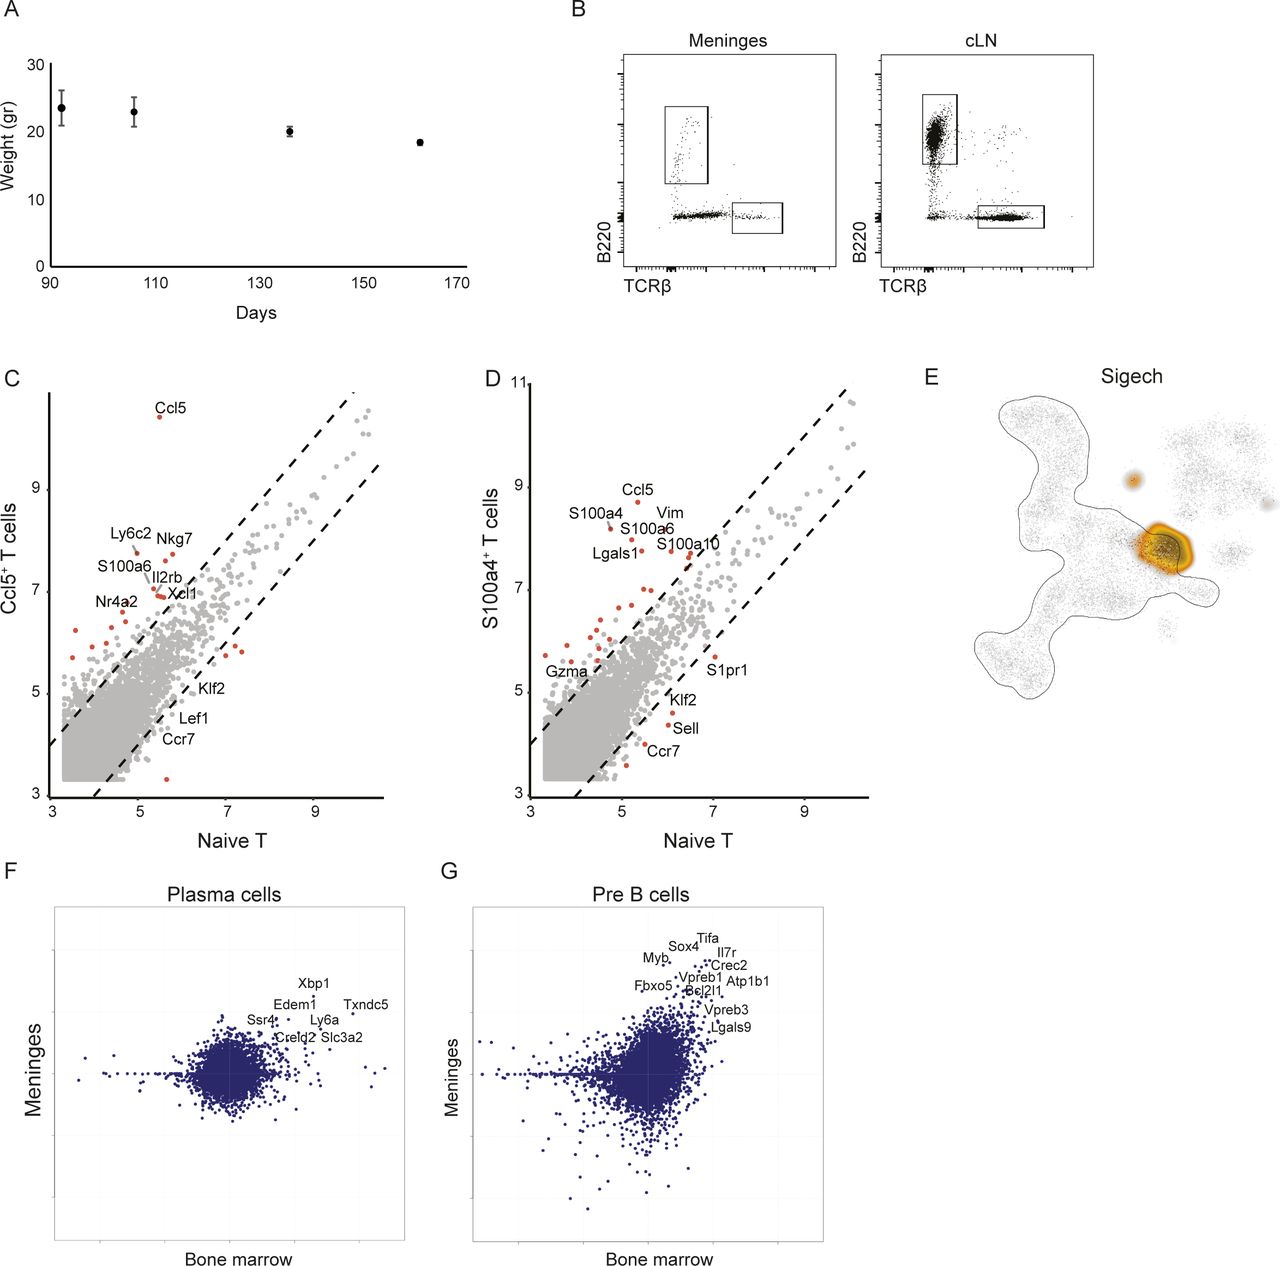
- Figure S2. Unique lymphocyte niche develops at the meninges of SOD1 mice but not at the peripheral cLN.
(A) Body weight evaluation of mSOD1 mice along different time points of disease progression. (B) Representative FACS dot plots showing B and T cell populations sorted from spine meninges and cLN of mSOD1 mice. (C, D) Differential gene expression between naïve T cells and Ccl5+ T cells (C), and between naïve T cells and S100a4+ T cells (D). (E) A two-dimensional representation of the metacell analysis of CD45+ immune cells isolated from adult mouse bone marrow, showing the Siglech expressing cells for pDC annotation. (F, G) Scatter plots showing differential gene expression (log2 FC) between meningeal plasma (F) and pre-B (G) cells versus rest of meningeal B cells (y-axis), plotted against (log2 FC) of their bone marrow mutual nearest neighbors versus rest of bone marrow cells.
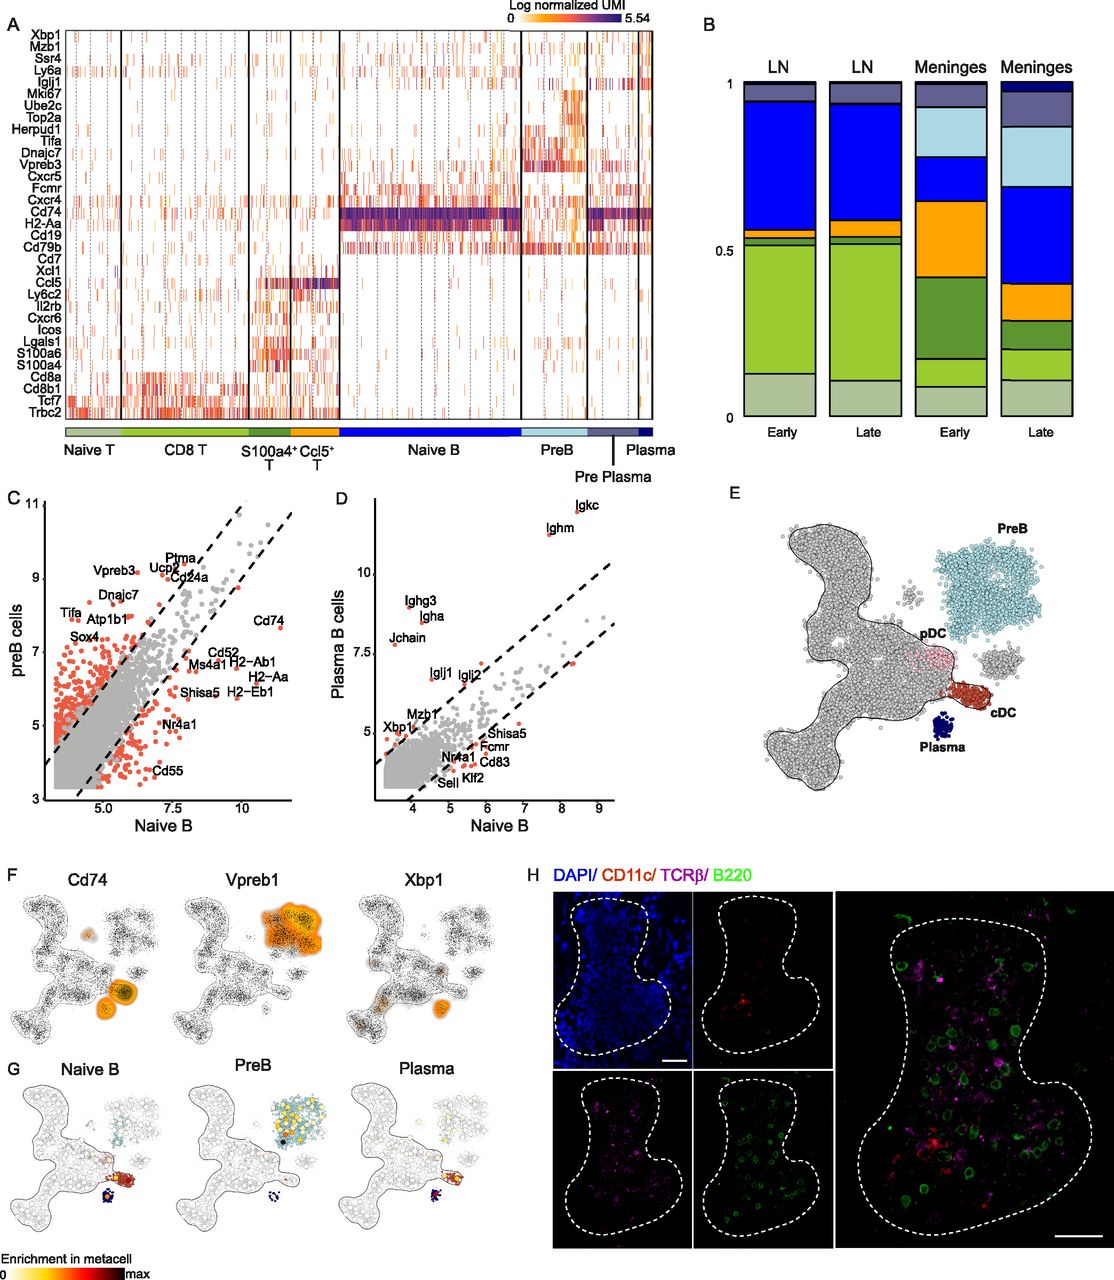
- Figure 6. Unique lymphocyte niche develops at the meninges of SOD1 mice but not at the peripheral cLN.
(A) TCRβ+ T cells and B220+ B cells were single cell sorted from spinal cord meninges and cLN of SOD1 mice at different ages (92, 106, 136, and 161 d). Gene expression profiles of CD4+ T cells and B220+ B cells were annotated based on specific cellular subtypes. (B) Cell type distribution of CD4+ T and B220+ B cells in the spinal cord meninges (right bars) and cLN (left bars), at relatively early (92 and 106 d old) and late (136 and 161 d old) stages of disease progression. Color scale is according to cell annotation in (A). (C, D) Differential gene expression between naïve B cells and pre-B cells (C), and between naïve B cells and plasma B cells (D). (E, F) A two-dimensional representation of the metacell analysis of CD45+ immune cells isolated from adult mouse bone marrow (E). MetaCells related to B cell lineages were annotated according to hallmark gene expression (F). (G) Mutual nearest neighbor projection of meningeal naïve B, pre-B, and plasma B cells on the two-dimensional representation of the metacell analysis of CD45+ immune cells isolated from adult mouse bone marrow. (H) Representative immunofluorescent whole-mount staining of meninges derived from 145 d old SOD1 mouse. Scale bar; 30 μm. Ntotal = 16 mice; n = 4–12 mice for each time point.


In this Issue
Subjects
Related Articles
Cited By...
- No citing articles found.