Advertisement

Main menu

  • Home
  • Articles
    • Newest Articles
    • Current Issue
    • Methods & Resources
    • Archive
    • Subjects
  • Collections
  • Submit
    • Submit a Manuscript
    • Author Guidelines
    • License, Copyright, Fee
    • FAQ
    • Why submit
  • About
    • About Us
    • Editors & Staff
    • Board Members
    • Licensing and Reuse
    • Reviewer Guidelines
    • Privacy Policy
    • Advertise
    • Contact Us
    • LSA LLC
  • Alerts
  • Other Publications
    • EMBO Press
    • The EMBO Journal
    • EMBO reports
    • EMBO Molecular Medicine
    • Molecular Systems Biology
    • Rockefeller University Press
    • Journal of Cell Biology
    • Journal of Experimental Medicine
    • Journal of General Physiology
    • Cold Spring Harbor Laboratory Press
    • Genes & Development
    • Genome Research

User menu

  • My alerts

Search

  • Advanced search
Life Science Alliance
  • Other Publications
    • EMBO Press
    • The EMBO Journal
    • EMBO reports
    • EMBO Molecular Medicine
    • Molecular Systems Biology
    • Rockefeller University Press
    • Journal of Cell Biology
    • Journal of Experimental Medicine
    • Journal of General Physiology
    • Cold Spring Harbor Laboratory Press
    • Genes & Development
    • Genome Research
  • My alerts
Life Science Alliance

Advanced Search

  • Home
  • Articles
    • Newest Articles
    • Current Issue
    • Methods & Resources
    • Archive
    • Subjects
  • Collections
  • Submit
    • Submit a Manuscript
    • Author Guidelines
    • License, Copyright, Fee
    • FAQ
    • Why submit
  • About
    • About Us
    • Editors & Staff
    • Board Members
    • Licensing and Reuse
    • Reviewer Guidelines
    • Privacy Policy
    • Advertise
    • Contact Us
    • LSA LLC
  • Alerts
  • Follow lsa Template on Twitter
Research Article
Transparent Process
Open Access

The actin regulator profilin 1 is functionally associated with the mammalian centrosome

Michaela Nejedlá, View ORCID ProfileAnastasiya Klebanovych, Vadym Sulimenko, View ORCID ProfileTetyana Sulimenko, View ORCID ProfileEduarda Dráberová, View ORCID ProfilePavel Dráber  Correspondence email, View ORCID ProfileRoger Karlsson  Correspondence email
Michaela Nejedlá
1Department of Molecular Biosciences, The Wenner-Gren Institute, Stockholm University, Stockholm, Sweden
  • Find this author on Google Scholar
  • Find this author on PubMed
  • Search for this author on this site
Anastasiya Klebanovych
2Department of Biology of Cytoskeleton, Institute of Molecular Genetics of the Czech Academy of Sciences, Prague, Czech Republic
  • Find this author on Google Scholar
  • Find this author on PubMed
  • Search for this author on this site
  • ORCID record for Anastasiya Klebanovych
Vadym Sulimenko
2Department of Biology of Cytoskeleton, Institute of Molecular Genetics of the Czech Academy of Sciences, Prague, Czech Republic
  • Find this author on Google Scholar
  • Find this author on PubMed
  • Search for this author on this site
Tetyana Sulimenko
2Department of Biology of Cytoskeleton, Institute of Molecular Genetics of the Czech Academy of Sciences, Prague, Czech Republic
  • Find this author on Google Scholar
  • Find this author on PubMed
  • Search for this author on this site
  • ORCID record for Tetyana Sulimenko
Eduarda Dráberová
2Department of Biology of Cytoskeleton, Institute of Molecular Genetics of the Czech Academy of Sciences, Prague, Czech Republic
  • Find this author on Google Scholar
  • Find this author on PubMed
  • Search for this author on this site
  • ORCID record for Eduarda Dráberová
Pavel Dráber
2Department of Biology of Cytoskeleton, Institute of Molecular Genetics of the Czech Academy of Sciences, Prague, Czech Republic
  • Find this author on Google Scholar
  • Find this author on PubMed
  • Search for this author on this site
  • ORCID record for Pavel Dráber
  • For correspondence: paveldra@img.cas.cz
Roger Karlsson
1Department of Molecular Biosciences, The Wenner-Gren Institute, Stockholm University, Stockholm, Sweden
  • Find this author on Google Scholar
  • Find this author on PubMed
  • Search for this author on this site
  • ORCID record for Roger Karlsson
  • For correspondence: roger.karlsson@su.se
Published 12 November 2020. DOI: 10.26508/lsa.202000655
  • Article
  • Figures & Data
  • Info
  • Metrics
  • Reviewer Comments
  • PDF
Loading

Article Figures & Data

Figures

  • Figure 1.
    • Download figure
    • Open in new tab
    • Download powerpoint
    Figure 1. Profilin is present in centrosomes throughout the cell cycle.

    Fluorescence microscopy revealed the co-localization of profilin and γ-tubulin. (A) Ab staining of profilin and γ-Tb in B16 cells after a brief pretreatment with 0.1% Triton X-100 before fixation (see text). High-resolution confocal microscopy (AiryScan). (B) B16 cells expressing citrine-profilin (a, d, g; green) were captured at different cell cycle stages. Cells were permeabilized with 10 μM digitonin, fixed, and stained for γ-tubulin (b, e, h; red). Superposition of images in (c, f, i). The cell in (d, e, f) was captured at an early G2-stage of the cell cycle and the one in (g, h, i) at late G2/prophase. Micrographs were obtained by spinning disk microscopy. Scale bars (A) and (B): 10 μm.

  • Figure S1.
    • Download figure
    • Open in new tab
    • Download powerpoint
    Figure S1. Profilin accumulates in centrosomes during mitosis.

    Immunofluorescence staining of profilin and γ-tubulin in B16 cells followed by intensity measurements of centrosomal fluorescence reveals increased labeling of Pfn in mitotic cells. (A) Cells captured during interphase (top) and during metaphase (bottom). Wide-field microscopy after simultaneous staining for Pfn, γ-tubulin (γ-Tb) and DNA (DAPI). The centrosomal region is shown at higher magnification at the bottom left corner (inset); the arrow points to the centrosome. (B) Bar graph illustrating fluorescence intensity of Pfn labeling in a standardized circular area (1.2 μm2) around the centrosomes in interphase (n = 31) and metaphase cells (n = 44) as determined by wide-field microscopy. Mean ± SEM, **P < 0.01. (C) High-resolution confocal microscopy (AiryScan) of a metaphase cell after simultaneous staining for Pfn, α-tubulin (α-Tb), and DNA (DAPI). Scale bars 10 μm.

  • Figure 2.
    • Download figure
    • Open in new tab
    • Download powerpoint
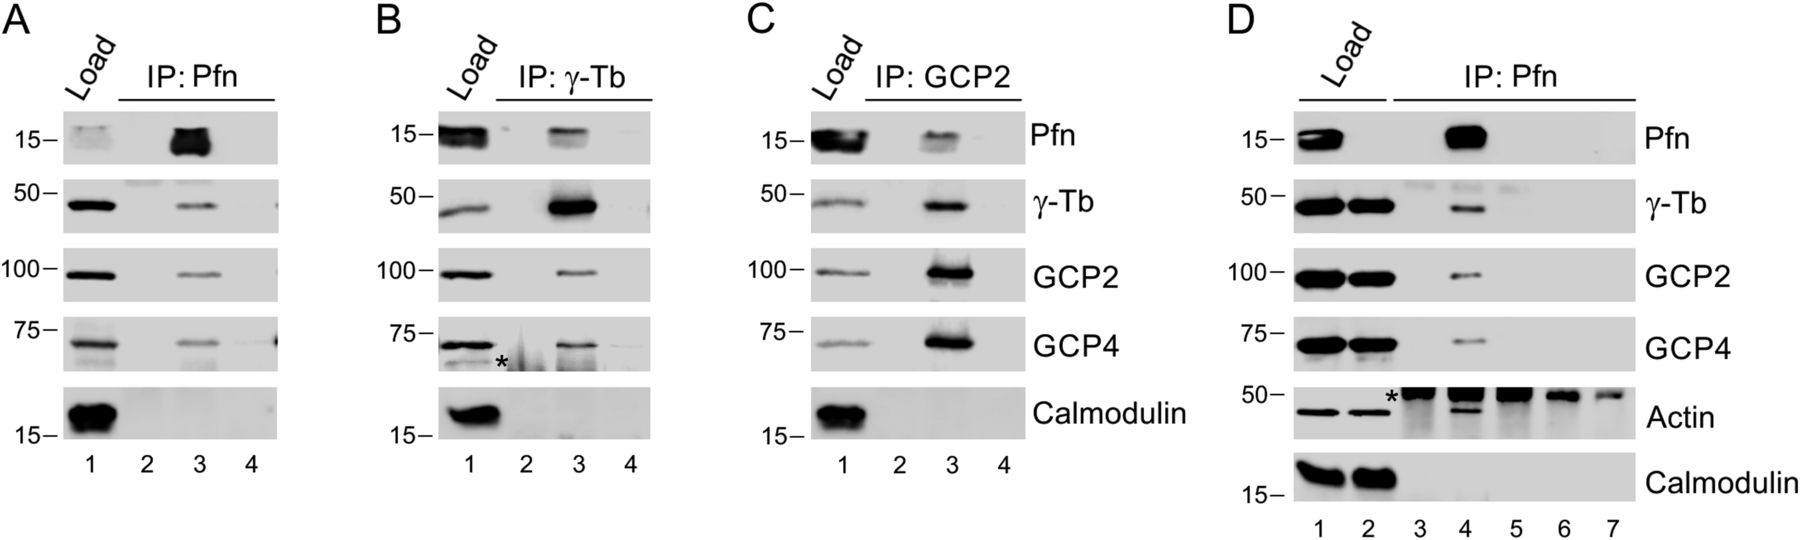
    Figure 2. Profilin interacts with γ-TuRC.

    (A, B, C) Extracts of B16 cells were precipitated with immobilized Abs to profilin (A), γ-tubulin (B) or GCP2 (C), followed by Western blotting and probing with Abs against profilin (Pfn), γ-tubulin (γ-Tb), GCP2, GCP4, and calmodulin (negative control) as indicated (C). In each blot (A, B, C), the sample lanes denoted 1–4 show: total cell extract, gel load (1); no cell extract (2); precipitated proteins (3); and Ab-free carrier (4). Note reciprocal precipitation in all three cases. (D) Extracts of B16 control (1, 4, 6) and profilin knock-out KO27 (2, 5, 7) cells were precipitated with immobilized Abs to profilin, followed by Western blotting and probing with Abs against profilin (Pfn), γ-tubulin (γ-Tb), GCP2, GCP4, actin, and calmodulin (negative control) as indicated. The sample lanes denoted 1–7 show: total cell extract, gel load (1, 2); no cell extract (3); precipitated proteins (4–5); and Ab-free carrier (6–7). Note co-precipitation of γ-tubulin, GCP2, GCP4, and actin with profilin Ab occurs in B16 cells solely. (B, D) Asterisks (*) in panels (B) and (D), lanes 2 and 3, and 3–5, respectively, denote cut off bands reflecting precipitating Abs.

  • Figure S2.
    • Download figure
    • Open in new tab
    • Download powerpoint
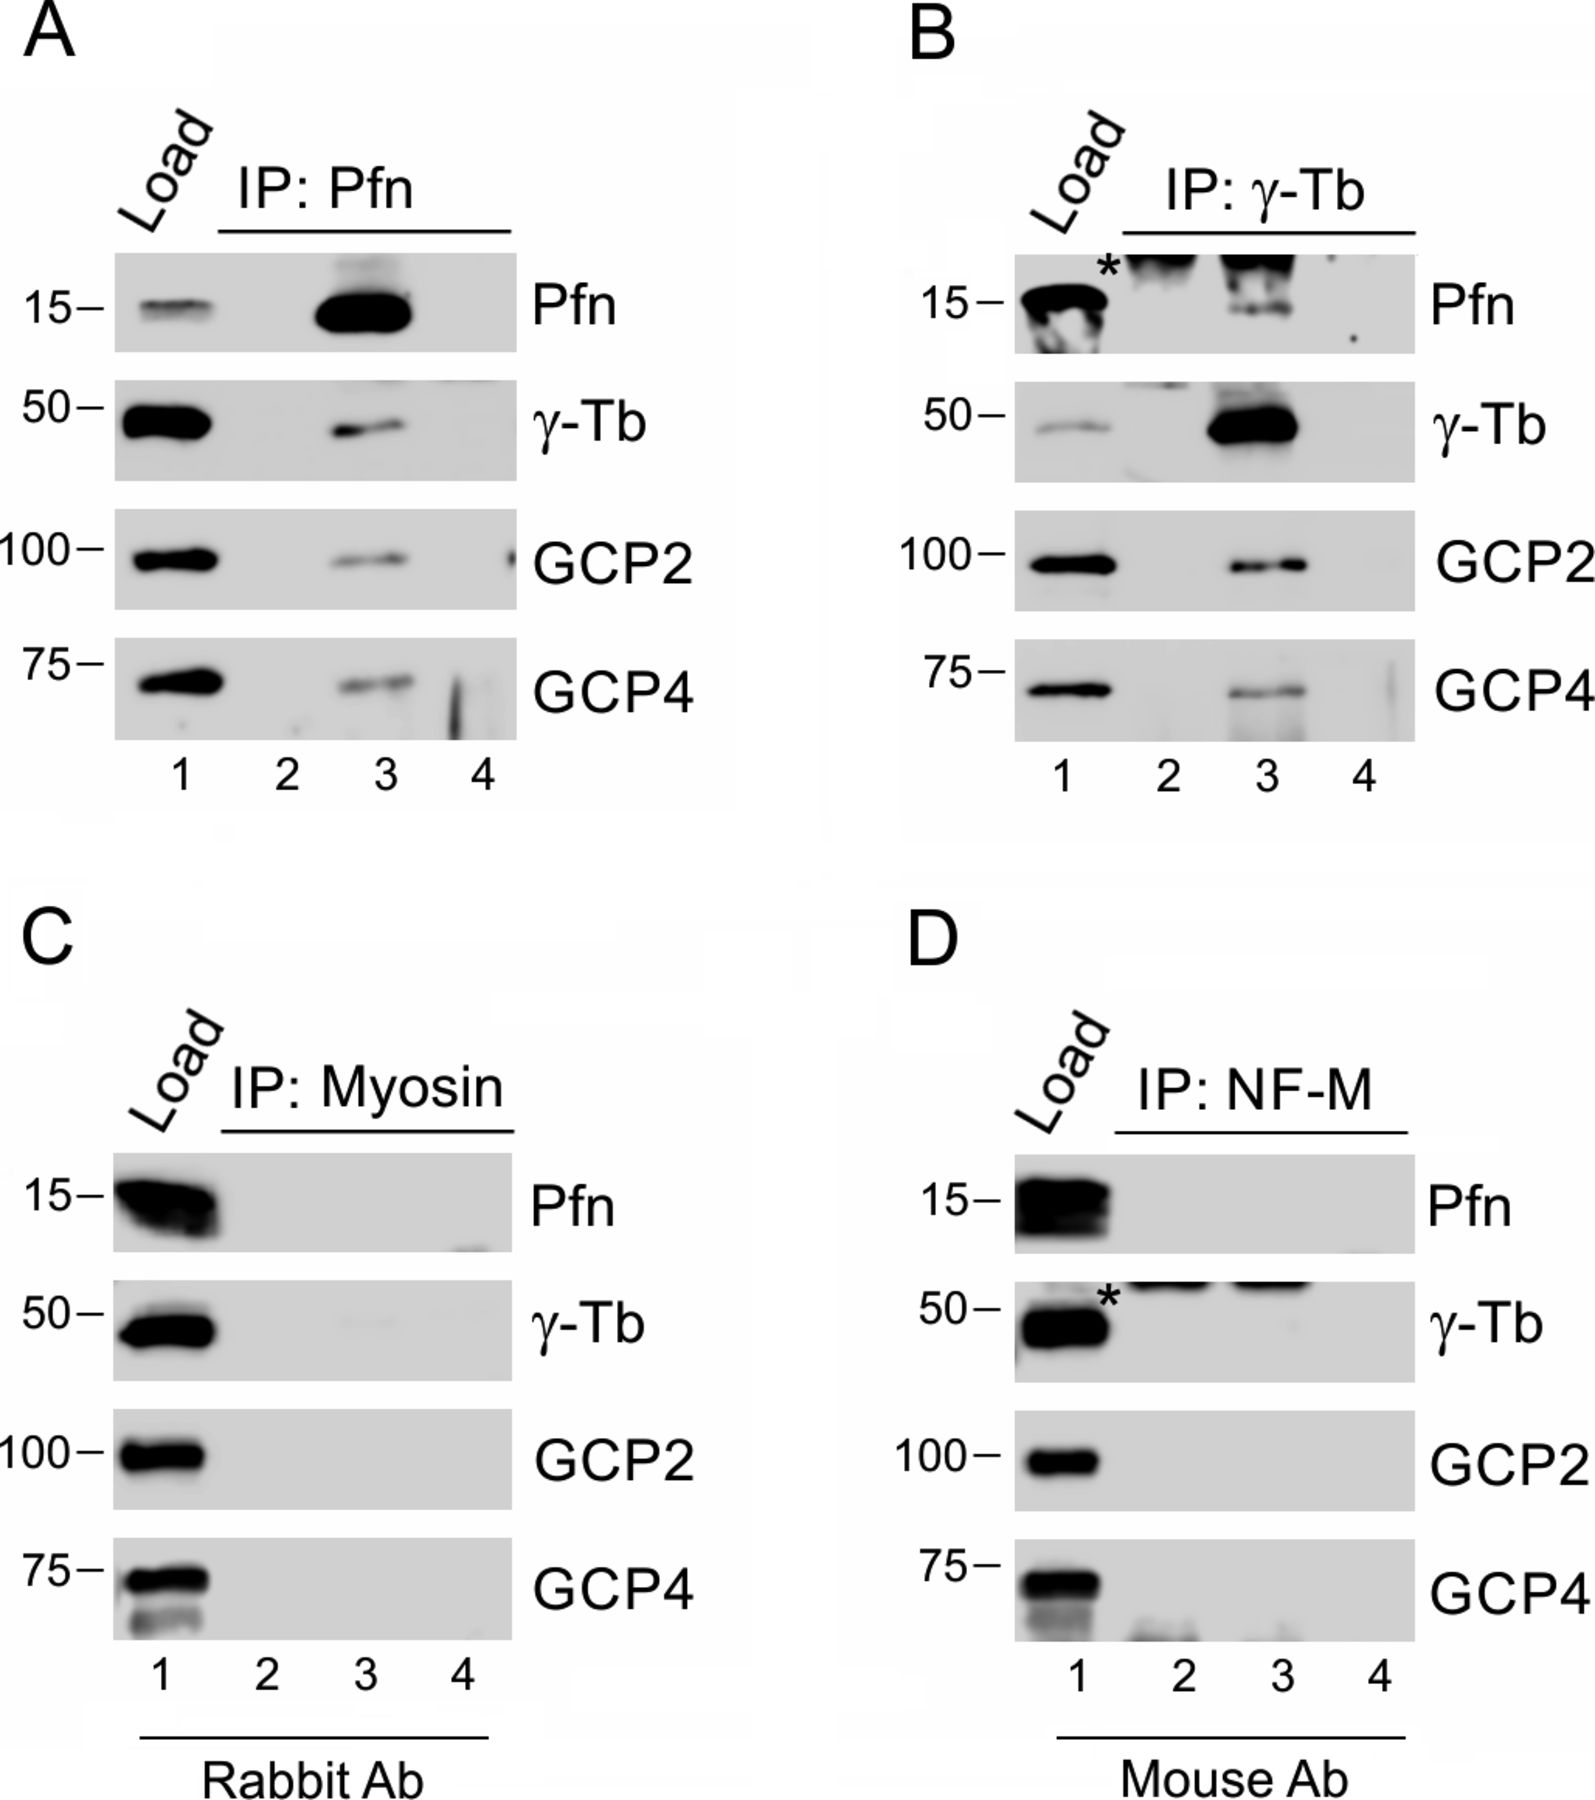
    Figure S2. Profilin associates with γ-tubulin complex proteins in Caco-2 cells, and isotype controls of immunoprecipitations are negative.

    (A, B) Extracts from Caco-2 cells were precipitated with immobilized Abs to profilin (A) and γ-tubulin (B), respectively, followed by Western blot analysis, using Abs against profilin (Pfn), γ-tubulin (γ-Tb), GCP2 and GCP4. Sample lanes 1–4 represent: total cell extract, gel load (1); no cell extract (2); precipitated proteins (3); carrier without Ab (4). (C, D) extracts of B16 cells were incubated with immobilized isotype control Abs, using rabbit Ab to myosin (C) and mouse mAbs (IgG2a) to neurofilament NF-M (D), respectively. (A, B) Subsequent Western blotting and analyzes were performed as in (A, B), using the same sample denotations. (B, D) Asterisks (*) in panels (B) and (D), lanes 2 and 3 denote cut off bands reflecting precipitating Ab.

  • Figure 3.
    • Download figure
    • Open in new tab
    • Download powerpoint
    Figure 3. Profilin modulates microtubule regrowth.

    (A) B16 control and profilin knock-out (KO27) cells visualized after nocodazole washout and 2 min of recovery in drug-free medium at 37°C followed by processing for fluorescence labeling of microtubules (α-tubulin; α-Tb) and centrosomes (γ-tubulin; γ-Tb). Note the more prominent array of nascent microtubules extending from the centrosome in the KO27 cells compared with the control. Scale bar: 10 μm. (B) Box plots illustrating the distribution of α-tubulin fluorescence intensity (arbitrary units, AU) determined 3 min after drug washout at 28°C within a 1.0-μm region of interest in B16 control and KO27 cells, respectively; n = 330 (control; Ctr) and 322 (KO27; Pfn KO). (C) As in (B), but γ-tubulin fluorescence intensity; n = 339 (control) and 284 (KO27). The data in (B, C) are based on three independent experiments and >90 cells for each experimental condition. The thick and thin lines within each box represent the mean and median (50th percentile), respectively, whereas bottom and top represent the 25th and 75th percentiles. The whiskers below and above the box indicate the 10th and 90th percentiles; ****P < 0.0001. (D) Microtubule nucleation rate in KO27 cells relative to control cells. Three independent experiments with at least 13 cells counted in each experiment, n = 39 (control) and 55 (KO27). The thick and thin lines within the dot box plots represent mean ± SD; ****P < 0.0001. (E) Time-lapse imaging of control and KO27 cells expressing EB3-mNeonGreen. Tracks of EB3 comets captured during 10 s are shown. Scale bar: 10 μm.

  • Figure S3.
    • Download figure
    • Open in new tab
    • Download powerpoint
    Figure S3. Nocodazole-resistant microtubules and microtubule organization in profilin knock-out cells (KO27).

    (A) Nocodazole-resistant microtubules in B16 control (Ctr) and KO27 (Pfn KO) cells simultaneously stained by Abs to α-tubulin (α-Tb) and γ-tubulin (γ-Tb). Fixation F/Tx/M (see the Materials and Methods section). Scale bar, 10 μm. (B) Microtubule organization in B16 control (Ctr) and KO27 (Pfn KO) cells stained by Ab to α-tubulin (α-Tb). Arrowheads in left panel (Ctr) denote the tip of the cell edge. Scale bar, 10 μm. (C) Bar graph showing increased α-tubulin fluorescence in two randomly picked areas of standardized size (144 μm2) in the lamellae of control (n = 29) and KO27 (n = 33) cells, respectively. Mean ± SEM, ***P < 0.001.

  • Figure 4.
    • Download figure
    • Open in new tab
    • Download powerpoint
    Figure 4. Phenotypic rescue of increased microtubule nucleation in KO27 cells.

    (A) Immunoblot analysis of whole-cell lysates of B16 control cells expressing citrine-cathepsin B (Ctr+Citrine-Cath), profilin knock-out KO27 cells expressing citrine-cathepsin B (Pfn KO+Citrine-Cath), and KO27 cells rescued by citrine-profilin (Pfn KO+Citrine-Pfn). Blots were probed with Abs to GFP to detect citrine-tagged proteins, to EB1 to detect co-expressed EB1-tdTomato, profilin (Pfn), and to actin (loading control). (B) Comparison of the microtubule nucleation rate observed in KO27 (Pfn KO) cells expressing Citrine-cathepsin B and Citrine-profilin, respectively, and in control cells (Ctr) expressing Citrine-cathepsin B. Three independent experiments and at least 10 cells analyzed in each experiment, n = 36 (Ctr+Citrine-Cath), n = 31 (Pfn KO+Citrine-Cath), and n = 30 (Pfn KO+Citrine-profilin); abbreviations as in left panel. The thick and thin lines within dot box plots represent mean ± SD; ****P < 0.0001.

PreviousNext
Back to top
Download PDF
Article Alerts
Sign In to Email Alerts with your Email Address
Email Article

Thank you for your interest in spreading the word on Life Science Alliance.

NOTE: We only request your email address so that the person you are recommending the page to knows that you wanted them to see it, and that it is not junk mail. We do not capture any email address.

Enter multiple addresses on separate lines or separate them with commas.
The actin regulator profilin 1 is functionally associated with the mammalian centrosome
(Your Name) has sent you a message from Life Science Alliance
(Your Name) thought you would like to see the Life Science Alliance web site.
CAPTCHA
This question is for testing whether or not you are a human visitor and to prevent automated spam submissions.
Citation Tools
Profilin 1 associates with the mammalian centrosome
Michaela Nejedlá, Anastasiya Klebanovych, Vadym Sulimenko, Tetyana Sulimenko, Eduarda Dráberová, Pavel Dráber, Roger Karlsson
Life Science Alliance Nov 2020, 4 (1) e202000655; DOI: 10.26508/lsa.202000655

Citation Manager Formats

  • BibTeX
  • Bookends
  • EasyBib
  • EndNote (tagged)
  • EndNote 8 (xml)
  • Medlars
  • Mendeley
  • Papers
  • RefWorks Tagged
  • Ref Manager
  • RIS
  • Zotero
Share
Profilin 1 associates with the mammalian centrosome
Michaela Nejedlá, Anastasiya Klebanovych, Vadym Sulimenko, Tetyana Sulimenko, Eduarda Dráberová, Pavel Dráber, Roger Karlsson
Life Science Alliance Nov 2020, 4 (1) e202000655; DOI: 10.26508/lsa.202000655
Reddit logo Twitter logo Facebook logo Mendeley logo
  • Tweet Widget
  • Facebook Like
Issue Cover

In this Issue

Volume 4, No. 1
January 2021
  • Table of Contents
  • Cover (PDF)
  • About the Cover
  • Masthead (PDF)
Advertisement

Jump to section

  • Article
    • Abstract
    • Introduction
    • Results
    • Discussion
    • Materials and Methods
    • Acknowledgements
    • References
  • Figures & Data
  • Info
  • Metrics
  • Reviewer Comments
  • PDF

Subjects

  • Cell Biology

Related Articles

  • No related articles found.

Cited By...

  • No citing articles found.
  • Google Scholar

More in this TOC Section

  • Dimeric mtHsp60 with Inactive ATPase Activity
  • Mechanics of cardiac pacemaker cell development
  • Interaction hub for telomerase function
Show more Research Article

Similar Articles

EMBO Press LogoRockefeller University Press LogoCold Spring Harbor Logo

Content

  • Home
  • Newest Articles
  • Current Issue
  • Archive
  • Subject Collections

For Authors

  • Submit a Manuscript
  • Author Guidelines
  • License, copyright, Fee

Other Services

  • Alerts
  • Twitter
  • RSS Feeds

More Information

  • Editors & Staff
  • Reviewer Guidelines
  • Feedback
  • Licensing and Reuse
  • Privacy Policy

ISSN: 2575-1077
© 2023 Life Science Alliance LLC

Life Science Alliance is registered as a trademark in the U.S. Patent and Trade Mark Office and in the European Union Intellectual Property Office.