


Article Figures & Data
Figures
- Figure 1. Identification of IFNλ-responsive cell populations in PBMCs.
(A) PBMCs were stimulated for 15 min with 1,000 IU/ml IFNα or 100 ng/ml of IFNλ1. Western blot detection of phosphorylated STAT1 (pY-STAT1), total STAT1, and actin protein in total cell lysates of PBMCs obtained from three different donors. (B) Purified human PBMCs were stimulated with 100 ng/ml of IFNλ1 for 15, 30, and 60 min or 1,000 IU/ml of IFNα for 15 min (left panel) or with 50, 100, and 200 ng/ml of IFNλ1 or 1,000 IU/ml of IFNα for 15 min. Shown are representative blots from two different donors. (A, C) Total PBMCs and purified CD19+ B cells, CD3+ cells, CD8+ T cells, CD4+ T cells, CD3−/CD16+ NK cells, and CD14+ monocytes were stimulated for 15 min with 1,000 IU/ml IFNα or 100 ng/ml IFNλ1 and analyzed as described in (A). A representative blot from two experiments is shown. (A, D) PBMC-derived CD19+ B cells and CD8+ T cells were stimulated for 15 min with 1,000 IU/ml IFNα, 100 ng/ml IFNλ1, or 100 ng/ml IFNλ4 and analyzed as described in (A). (E) qRT-PCR analysis of IFNLR1, IFNAR1, and IL10RB transcripts in total RNA isolated from the indicated PBMC subpopulations and primary human hepatocytes. Transcript levels are expressed as the ΔΔCT relative to GAPDH. Results are shown as mean ± SEM; n = 3.
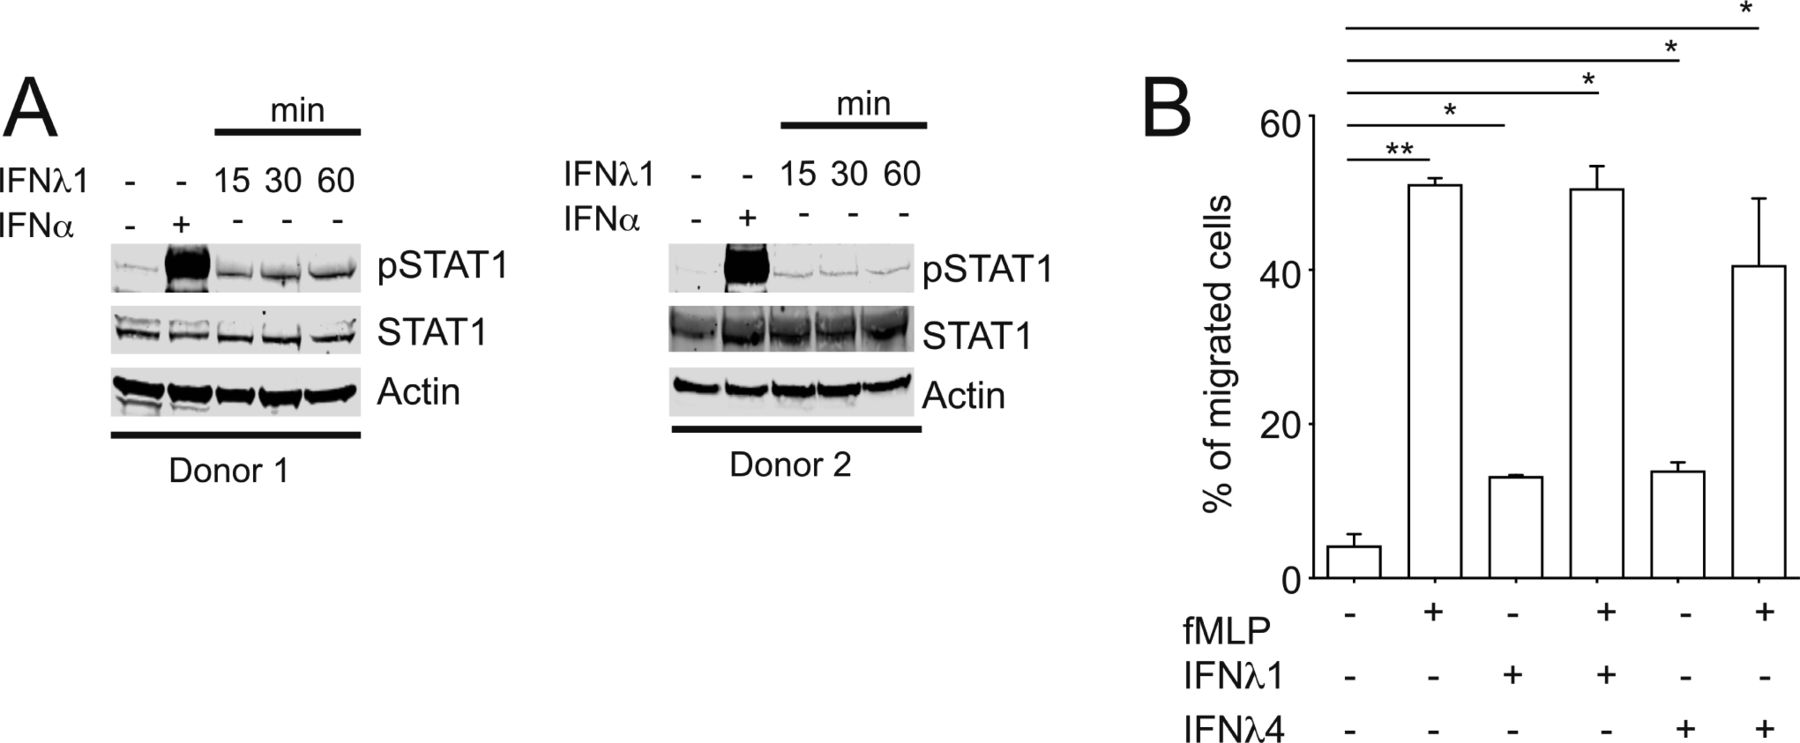
- Figure S1. IFNλ4 induces STAT1 phosphorylation and weakly stimulates neutrophil migration.
(A) Neutrophils were stimulated with IFNλ1 (100 ng/ml) for 15, 30 and 60 min or 1,000 IU/ml of IFNα for 15 min. (B) Neutrophils were placed in Transwell plate and stimulated with IFNλ1 (100 ng/ml) and IFNλ4 (100 ng/ml) alone and in the presence of fMLP (100 nM) for 4 h. Cell supernatants were collected and migrated neutrophils were counted using FACS. Results shown as mean ± SEM from two independent experiments.
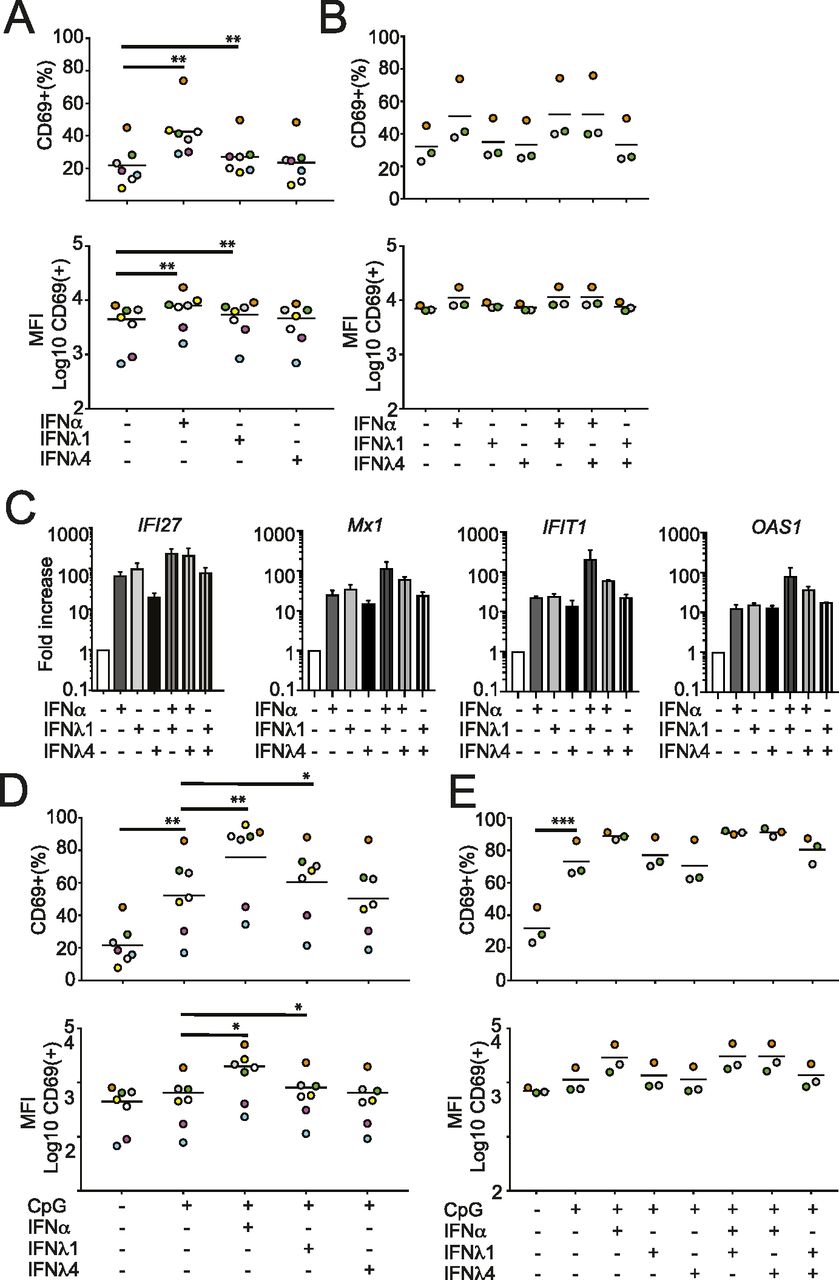
- Figure 2. IFNλ4 has no co-stimulatory activity on B-cell activation.
B cells were isolated from PBMCs and stimulated with IFN and/or CpG ODN2006 for 48 h and analyzed for B-cell activation. (A) B cells isolated from seven donors were stimulated with IFNα (1,000 IU/ml), IFNλ1 (100 ng/ml) and IFNλ4 (100 ng/ml), fixed, and analyzed by CD69-specific mAbs by FACS. Percentages of CD69+ cells within the B-cell population (upper panel) or median fluorescence intensity (MFI) of CD69+ cells within the B-cell population (lower panel) are shown. Significant changes between IFN-treated and control samples are denoted by a thick line. (A, B) B cells isolated from three donors were stimulated with IFNα (1,000 IU/ml), IFNλ1 (100 ng/ml), and IFNλ4 (100 ng/ml) alone or in combination and analyzed as described in (A). Significant changes between IFN-treated and control samples as well as combination versus single IFN treatment are denoted by a thick line. (C) IFI27, MX1, OAS1, and IFIT1 transcript levels in B cells stimulated with individual or combinations of IFNα, IFNλ1, and IFNλ4 were analyzed by qRT-PCR of total RNA. Results are shown as ΔΔCT relative to GAPDH (mean ± SEM; n = 2). (D, E) B cells were stimulated with IFNα (1,000 IU/ml), IFNλ1 (100 ng/ml), and IFNλ4 (100 ng/ml) alone (D) or in combination (E) in the presence or absence of CpG (0.8 μg/ml). (A) Cells were analyzed as described in (A). (A, B, D, E) Colors depict individual donors and thin horizontal lines indicate the mean; n = 7 for (A) and (D); n = 3 for (B) and (E). *P < 0.05, **P < 0.01, and ***P < 0.001 (paired t test).
- Figure 3. IFNλ4 induces IL-10 production in B cells.
(A) B cells (n = 4) were stimulated with IFNα (1,000 IU/ml), IFNλ1 (100 ng/ml), and IFNλ4 (100 ng/ml) alone or in combination and in the presence or absence of CpG (2.5 μg/ml) for 48 h. Cell supernatants were collected and released IL-10 was determined by ELISA. Results shown as ± SEM from two independent experiments. Significant changes between IFN-treated and control samples as well as IFN combinations versus single IFN treatment are denoted by a thick line. (B) Memory (CD27+ CD19+) and naïve (CD27− CD19+) B cells were stimulated with IFNα (1,000 IU/ml), IFNλ1 (100 ng/ml), and IFNλ4 (100 ng/ml) alone or in combination for 48 h either in the absence or presence of CpG (2.5 μg/ml). IL-10 present in supernatants of TLR9-stimulated and unstimulated cells in the presence of IFN was analyzed by ELISA. Results show mean ± SEM concentration (n = 4). (C) Memory B cells were treated with IFNα (1,000 IU/ml), IFNλ1 (100 ng/ml) or IFNλ4 (100 ng/ml) in the presence of CpG (2.5 μg/ml) for 48 h. The presence of IgG in the supernatants of stimulated and unstimulated controls was analyzed by ELISA. Results show the mean ± SEM concentration (n = 4). *P < 0.05, **P < 0.01, and ***P < 0.001 compared with the control condition (paired t test).
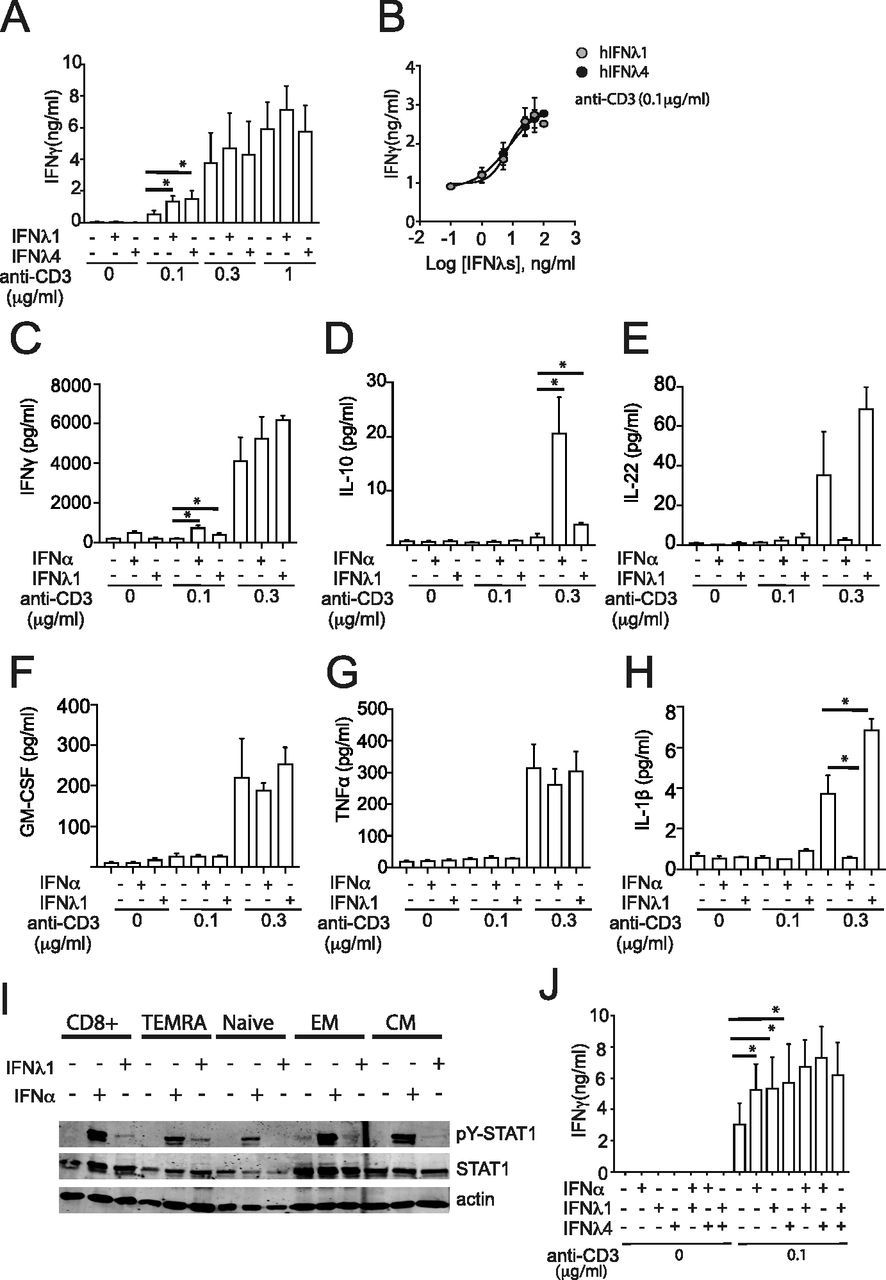
- Figure 4. IFNλ4 provides a co-stimulatory role during CD8+ T-cell activation.
(A, B) CD8+ T cells were plated for 48 h either (A) on a 96-well plate pre-coated with three different concentrations of anti-CD3 (0.1; 0.3 and 1 μg/ml) in the presence of IFNα (1,000 IU/ml), IFNλ1 (100 ng/ml), or IFNλ4 (100 ng/ml) or (B) on a 96-well plate pre-coated with 0.1 μg/ml of anti-CD3 in the presence of increasing doses of IFNλ1 and IFNλ4. Released IFNγ was determined by ELISA. Data are representative of three independent experiments. (C, D, E, F, G, H) CD8+ T cells were plated for 48 h either on a 96-well plate pre-coated with three different concentrations of anti-CD3 (0.1 and 0.3 μg/ml) in the presence of IFNα (1,000 IU/ml) or IFNλ1 (100 ng/ml). (C, D, E, F, G, H) Released IFNγ (C), IL-10 (D), IL-22 (E), GM-CSF (F), TNFα (G), and IL-1β (H) were determined using Meso Scale Discovery assay. Data are representative of three independent experiments. (I) Total CD8+ and purified TEMRA, naïve, EM, and CM CD8+ T-cell populations were stimulated with IFNα (1,000 IU/ml) or IFNλ1 (100 ng/ml) for 15 min. Phosphorylated STAT1 (pY-STAT1), total STAT1, and actin protein were analyzed by Western blotting using total cellular extracts. A representative blot from two independent experiments is shown. (B, J) CD8+ T cells were treated with individual or combinations of IFNα (1,000 IU/ml), IFNλ1 (100 ng/ml), and IFNλ4 (100 ng/ml) for 48 h in the presence or absence of anti-CD3 mAbs stimulation and analyzed as described in (B). (A, D) Mean ± SEM from three independent experiments (n = 3 for A, D) are shown. *P < 0.05, **P < 0.01, and ***P < 0.001 (paired t test).
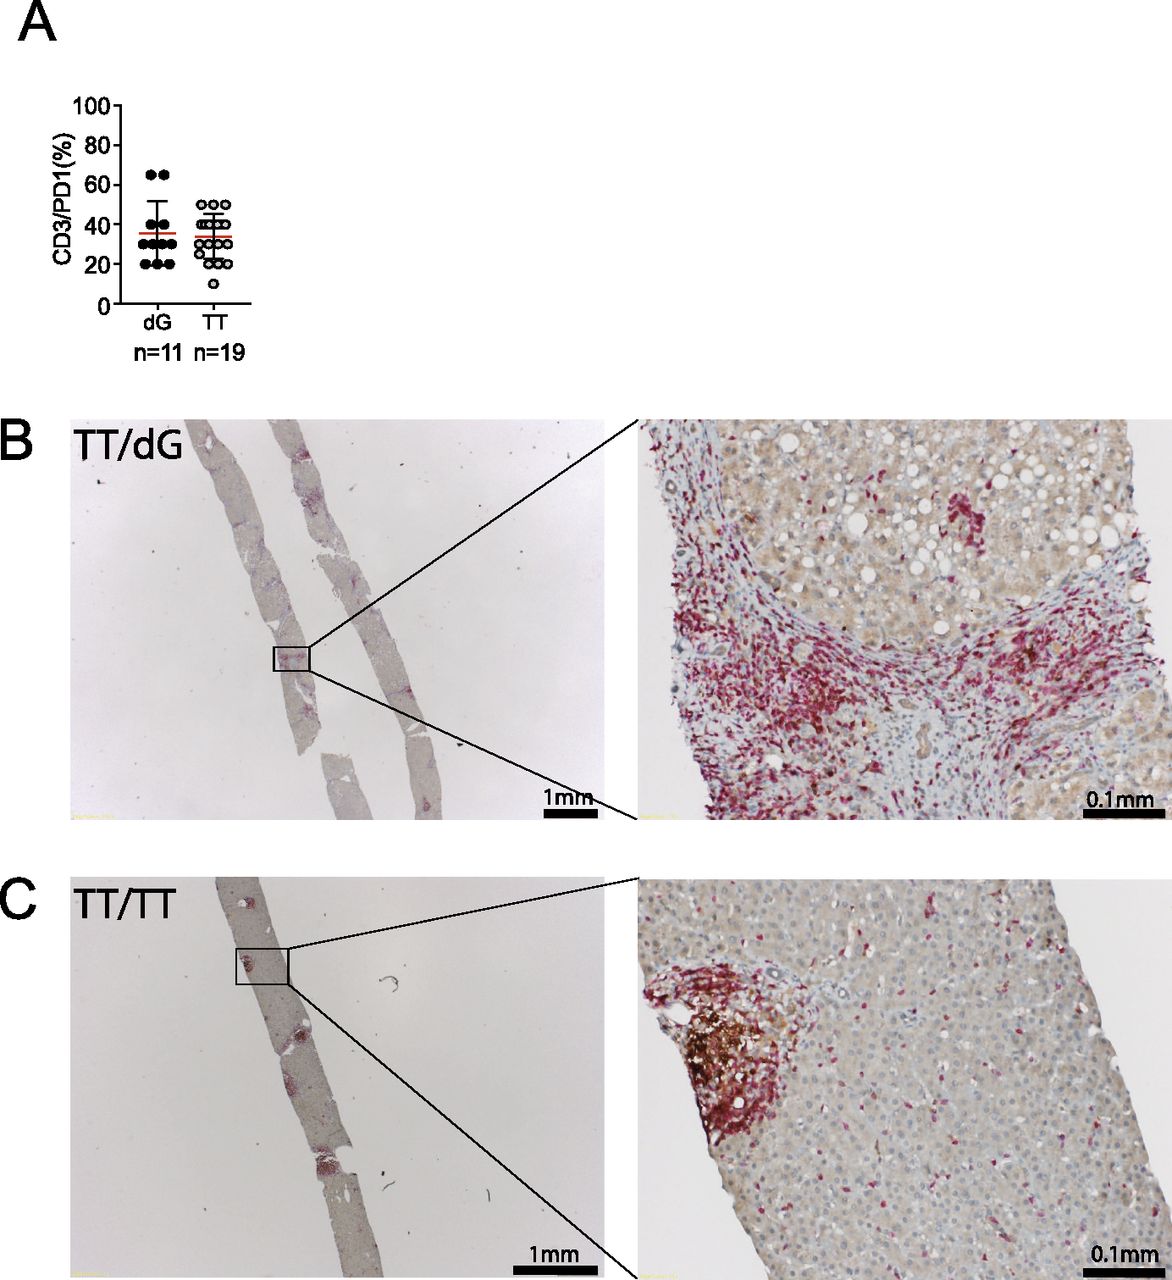
- Figure 5. Detection of CD3+/PD1+ cells in the liver of chronic hepatitis C patients.
(A) Paraffin-embedded liver biopsies were stained using mAbs specific for CD3 and PD1 (A) Frequency of CD3+/PD1+ cells in the liver of chronic hepatitis C patients with ΔG and TT IFNλ4 genotype. (B, C) Representative bright-field images of CD3 and PD1 staining of liver sections of a patient of TT/ΔG genotype and (C) TT/TT genotype. Red, CD3 signal; brown, PD1 signal.
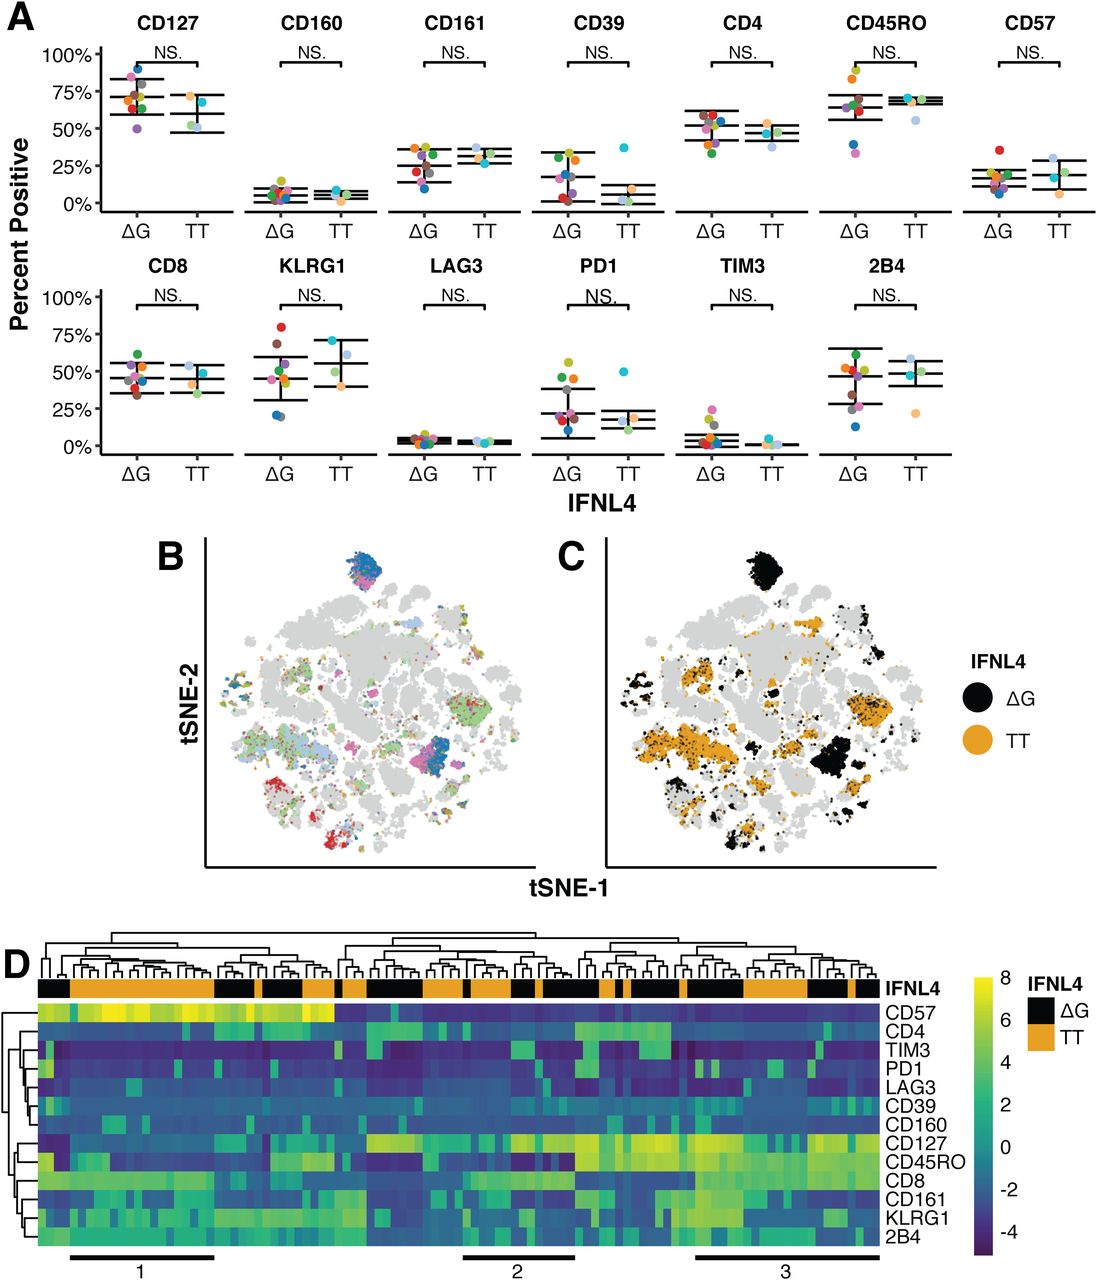
- Figure 6. Phenotypic characterization and multidimensional analysis of patient liver biopsies.
Intrahepatic lymphocytes (IHLs) were isolated from fresh liver biopsy tissue obtained from chronically hepatitis C virus–infected patients either carrying the IFNλ4 ΔG or TT allele. IHLs were subjected to multicolor FACS analysis. (A) t tests identified no significant differences (P > 0.05) in the percent of cells with a positive phenotype for any cell surface marker between patients with ΔG (n = 9) or TT (n = 4) IFNλ4 alleles. (B, C) tSNE dimensional reduction and clustering enabled identification of clusters enriched for either IFNλ4 allele (C) using a Poisson test (false discovery rate < 0.001; colored dots) while maintaining within-cluster representation of patients with each IFNλ4 allele (B). Cells not selected for further analysis are gray. (B, C, D) Hierarchical clustering of the median marker expression of selected clusters from (B) and (C), revealing three groups (1, 2, 3) of CD8+ clusters with opposing expression of exhaustion and senescence markers CD57, CD127, KLRG1, PD1, and 2B4.
- Figure 7. Pseudotime ordering of CD8+, CD4+, and double-negative cell populations indicates differentiation state-dependent changes in exhaustion and senescence markers.
IFNλ4 allele enriched clusters were embedded by diffusion mapping and temporally ordered based on the co-expression of CD57, KLRG1, PD1, and TIM3. Curves fitted to the temporally ordered cells indicate smoothed average of marker expression.
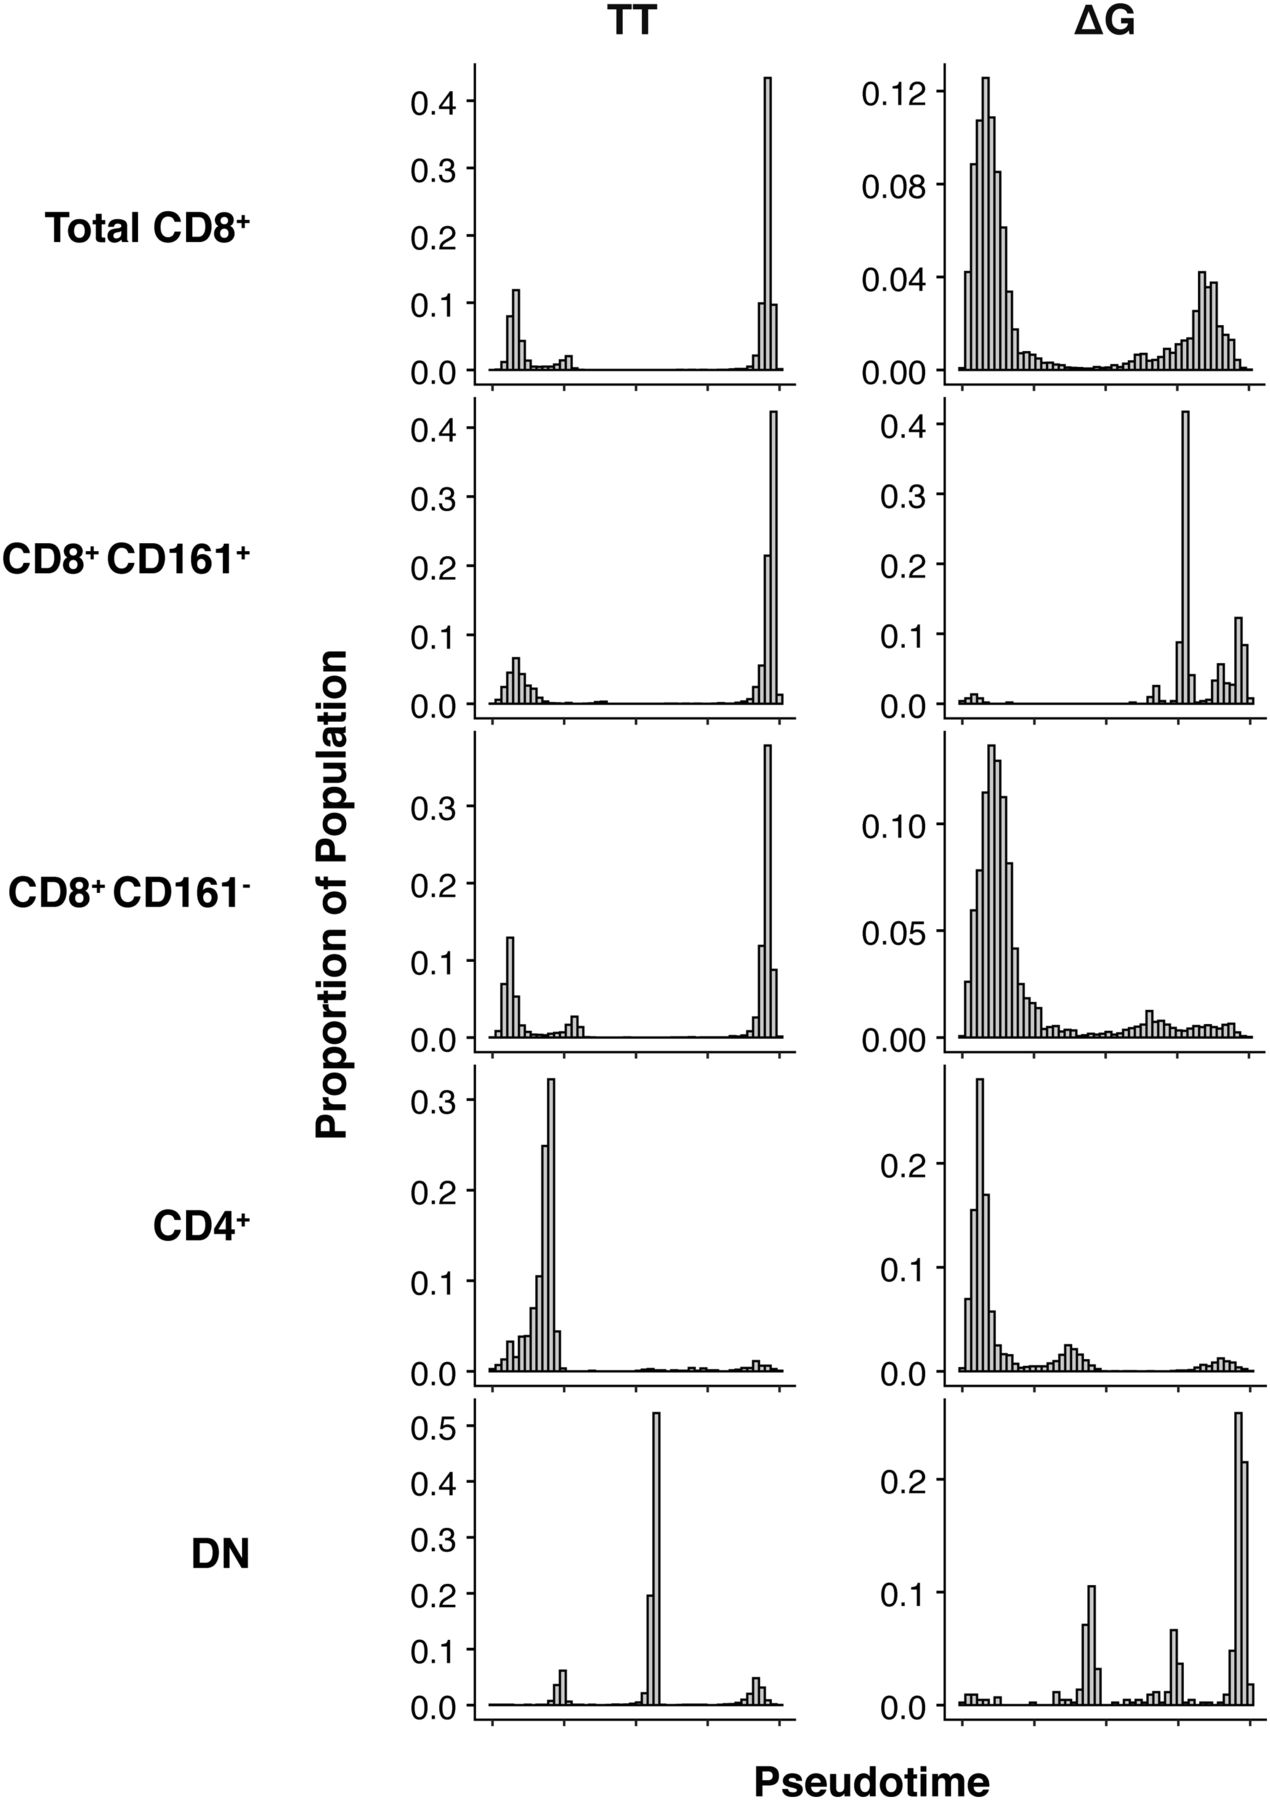
- Figure 8. Distribution of cells across pseudotime.
The proportion of cells is differentially distributed across pseudotime in a lineage-dependent manner. Total CD8+ TT cells (n = 14,081) are distributed late in the temporal ordering, whereas total CD8+ ΔG cells (n = 6,230) are distributed earlier. No difference was observed in the temporal distribution of CD8+ CD161+ TT or ΔG cells (n = 4,226 and 513, respectively). In contrast, an IFNλ4-dependent differential distribution of cells was observed in CD8+ CD161− TT and ΔG cells (n = 9,855 and 5,717, respectively). CD4+ TT and ΔG cells (n = 1,591 and 6,959, respectively) were temporally distributed similarly to CD8+ TT cells. Double-negative (DN) TT and ΔG cells (n = 6,722 and 437, respectively) were distributed similarly to CD8+ CD161+ cells.


Tables
Nr Gender Age at biopsy rs815 (IFNL4) HCV genotype Log10 (viral load) Metavir FACS Immunohistochemistry 1 f 64 ΔG/ΔG 1b 5.44 A2/F1 X X 2 m 58 ΔG/ΔG 3a 5.47 A3/F3 X X 3 m 24 ΔG/ΔG 1 4.81 A1/F0 X X 4 m 49 ΔG/ΔG 4 6.50 A1/F1 X 5 m 61 ΔG/ΔG 1b n.a A2/F2 X 6 m 51 ΔG/ΔG 1b 5.75 A2/F4 X 7 m 40 ΔG/ΔG 3a 5.66 A1/F1 X 8 f 53 ΔG/ΔG 4a/c/d 5.90 A3/F3 X 9 m 48 ΔG/ΔG 4a/c/d 6.03 A2/F2 X 10 m 30 ΔG/ΔG 1a 5.03 A1/F1 X 11 m 24 ΔG/ΔG 1a 5.26 A1/F0 X 12 m 52 TT/ΔG 3a 6.69 A2/F2 X X 13 m 56 TT/ΔG 3a 5.75 A3/F4 X X 14 m 50 TT/ΔG 1a 6.92 A3/F2 X X 15 f 37 TT/ΔG 1a n.a A1/F2 X X 16 m 46 TT/ΔG 4a/c/d 5.06 A3/F4 X X 17 m 45 TT/ΔG 1b 5.25 A1/F1 X X 18 M 15 TT/ΔG 1a 5.44 A1/F1 X 19 f 47 TT/ΔG 1a 6.78 A2/F4 X 20 m 45 TT/ΔG 1a 6.21 A2/F2 X 21 m 42 TT/TT 3a 6.98 A2/F1 X X 22 f 52 TT/TT 4 n.a A2/F2 X X 23 m 77 TT/TT 1b 5.92 A2/F3 X X 24 m 61 TT/TT 1a n.a A2/F1 X X 25 m 43 TT/TT 1 5.97 A1/F1 X 26 f 45 TT/TT 3a 5.06 A1/F1 X 27 f 45 TT/TT 1b 6.38 A2/F1 X 28 m 53 TT/TT n.a 6.47 A2/F2 X 29 f 52 TT/TT 1a 6.09 A2/F1 X 30 m 36 TT/TT 3a 5.90 A1/F1 X 31 m 43 TT/TT 1a 3.60 A1/F1 X 32 m 39 TT/TT 3a 6.41 A1/F1 X 33 f 41 TT/TT 1b 6.44 A2/F3 X 34 m 50 TT/TT 3a 6.52 A2/F1 X 35 m 53 TT/TT 3a 6.52 A3/F4 X 36 m 56 TT/TT 1a 6.80 A3/F3 X 37 m 45 TT/TT 3a 5.87 A2/F4 X 38 f 37 TT/TT 1a 6.19 A2/F3 X 39 m 53 TT/TT 4 6.12 A1/F1 X
Table S1 Reagents and antibodies.


