


Article Figures & Data
Figures
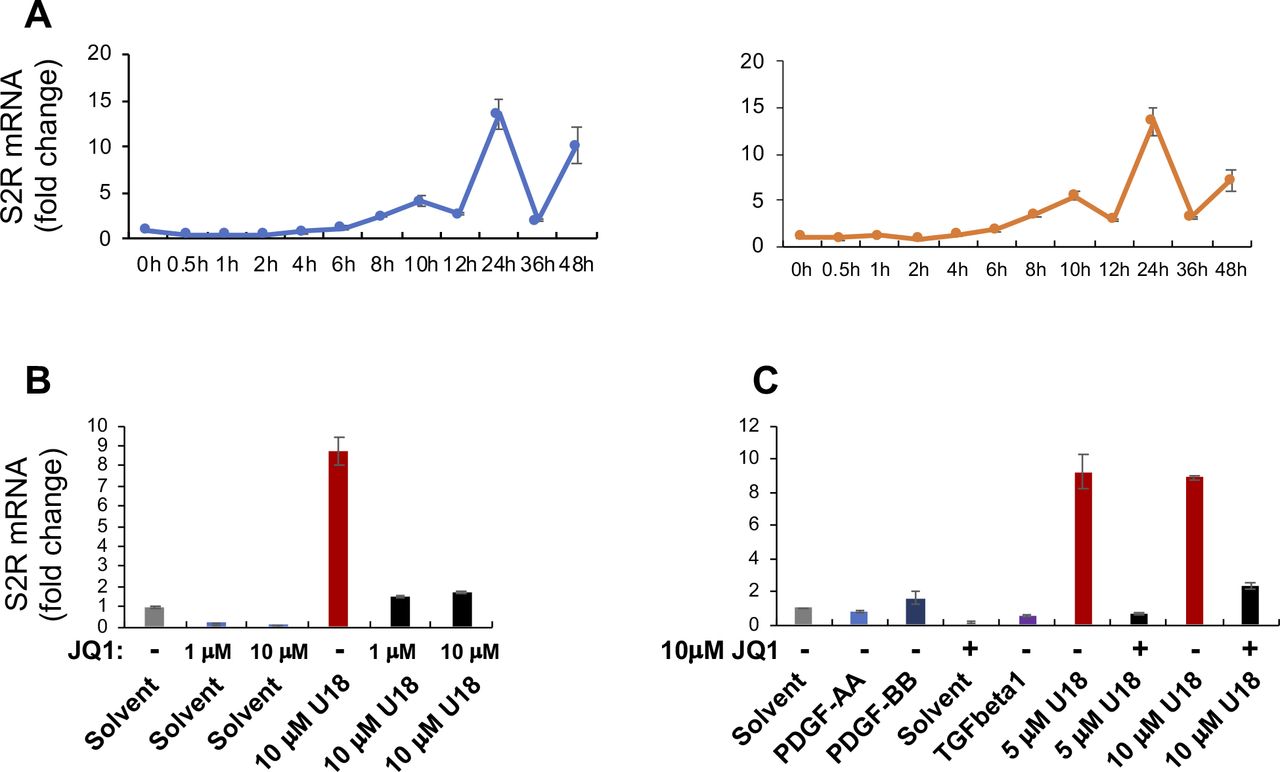
- Figure S1. U18 induces up-regulation of sigma-2 receptor (S2R) mRNA in ARPE19 cells.
Experiments were performed as described in Fig 1 except for the various conditions indicated in this figure. For each data point or bar, triplicate samples were used. Before staining, the cells were cultured and treated as described in Fig 1. (A) Time course of U18 treatment of ARPE19 cells (two repeat experiments). The data indicate that S2R mRNA levels were maximally increased by U18 (5 μM) at 24 h after treatment. (B, C) Effects of cytokines and different concentrations of U18 and JQ1 on S2R mRNA expression. PDGF-AA, 20 ng/ml; PDGF-BB, 20 ng/ml; TGFβ1, 20 ng/ml. PDGF-AA (Cat. no. 1055AA050), and PDGF-BB (Cat. no. 520BB050) were from R&D Systems. Human recombinant TGFβ1 was from Thermo Fisher Scientific (Cat. no. PHG9214). The data indicate that treatments with 5 and 10 μM U18 were equally effective in inducing S2R mRNA up-regulation, and 1 μM JQ1 was as potent as 10 μM in blocking U18-induced S2R up-regulation.
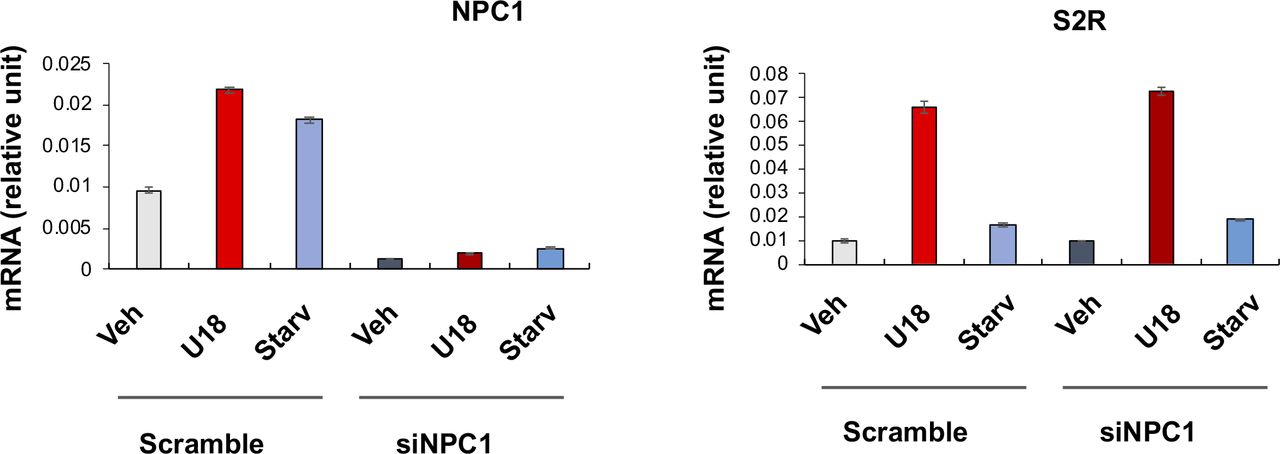
- Figure S2. Effect of NPC1 silencing on sigma-2 receptor expression.
Experiments were performed as described for Fig 1G and F except that NPC1-specific siRNA was used. Quantification: Mean ± SD, n = 3 repeats. Each plot represents one of two similar independent experiments. Statistics: one-way ANOVA with Bonferroni post hoc test; n = 4 independent repeat experiments; *P < 0.05, **P < 0.01, ***P < 0.001, compared between specific silencing and its control (dark and light bars of the same color).
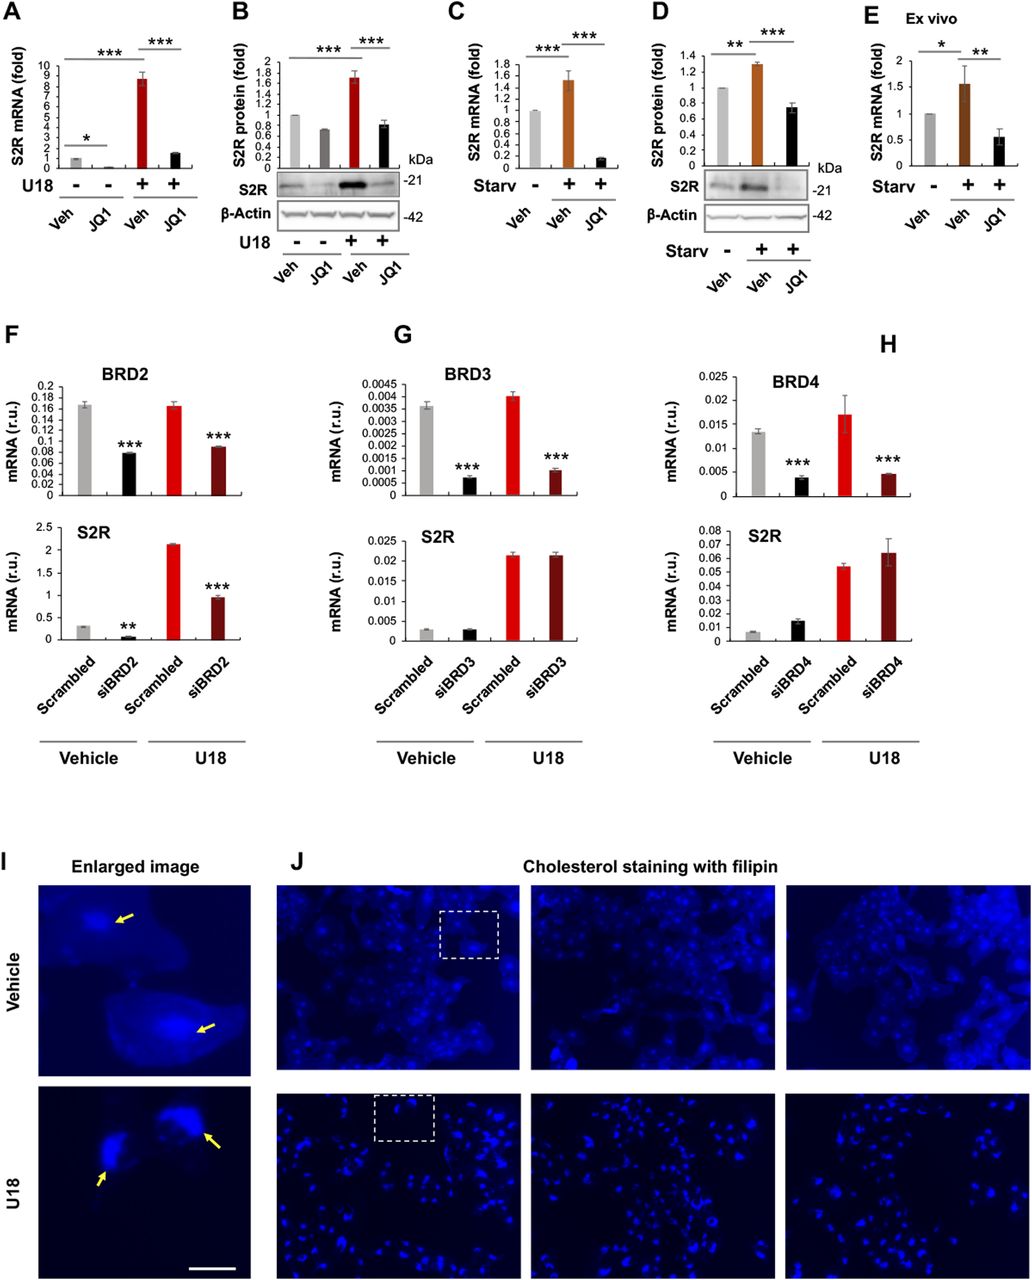
- Figure 1. Pan-BET inhibition prevents sigma-2 receptor (S2R) up-regulation upon cholesterol deprivation.
(A, B, C, D) Effect of JQ1 pretreatment of ARPE19 cells on S2R mRNA and protein levels. (E) Effect of ex vivo JQ1 treatment of mouse eyecups. (F, G, H) BRD2 but not BRD3 or BRD4 silencing reduces S2R mRNA levels in ARPE19 cells. (I, J) Filipin staining of cholesterol. Enlarged boxes from (J) are shown in (I); arrows point to perinuclear lysosomes; the nuclei are profiled by ring-like structures. Note that without U18 treatment, filipin staining appeared as blue haze in the cytosol (or ER network), which diminished after U18 treatment and instead accumulated in the perinuclear lysosomes. Scale bar: 5 μm. ARPE19 cells were cultured to an ∼70–80% confluency in the DMEM/F12 medium containing 10% FBS. The cells were transfected with a scrambled or specific siRNA, and then incubated with U18666A (abbreviated as U18, final 5 μM) for 24 h before qRT-PCR or Western blot assay. For starvation treatment, the medium was changed, which contained 0% FBS instead. For inhibition of BETs, JQ1 (1 μM) or vehicle control (equal amount of DMSO) was included in the cell culture during the treatment with U18 or starvation. For the ex vivo experiment (E), mouse eyes were dissected to remove the retina and expose the retinal pigment epithelium layer. Eyecups were incubated in the HBSS buffer with or without 10% FBS (i.e., starvation) for 24 h, and retinal pigment epithelium cell total RNA was extracted from the eyecups using the Trizol reagent for qRT-PCR assay. Quantification: At least three independent repeat experiments were performed; data were normalized to GAPDH (qRT-PCR) or β-actin (Western blot) and then to the basal control (vehicle, no U18, no starvation). The normalized data were averaged (n ≥ 3) to calculate mean ± SEM. For the ex vivo experiments, data from three mice were averaged (mean ± SEM, n = 3). Each plot in (F, G, H) represents one of two similar experiments (mean ± SD, n = 3 replicates in the same experiment). Statistics: one-way ANOVA with Bonferroni post hoc test; *P < 0.05, **P < 0.01, ***P < 0.001. For simplicity, non-significant difference is not labeled throughout the figures; r.u., relative units.
Source data are available for this figure.
Source Data for Figure 1[LSA-2019-00540_SdataF1_F7.tif]
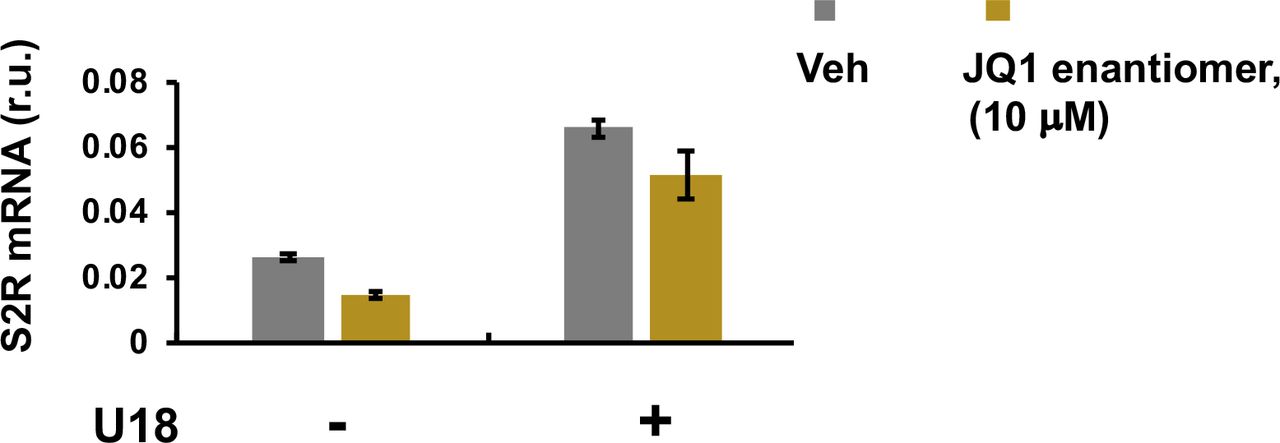
- Figure S3. Effect of NPC1 silencing on sigma-2 receptor expression.
Experiments were performed as described for Fig 1A except that the enantiomer of JQ1, also called JQ1(-), was used instead of JQ1 with a concentration of 10 μM. Quantification: Mean ± SD, n = 3 repeats.
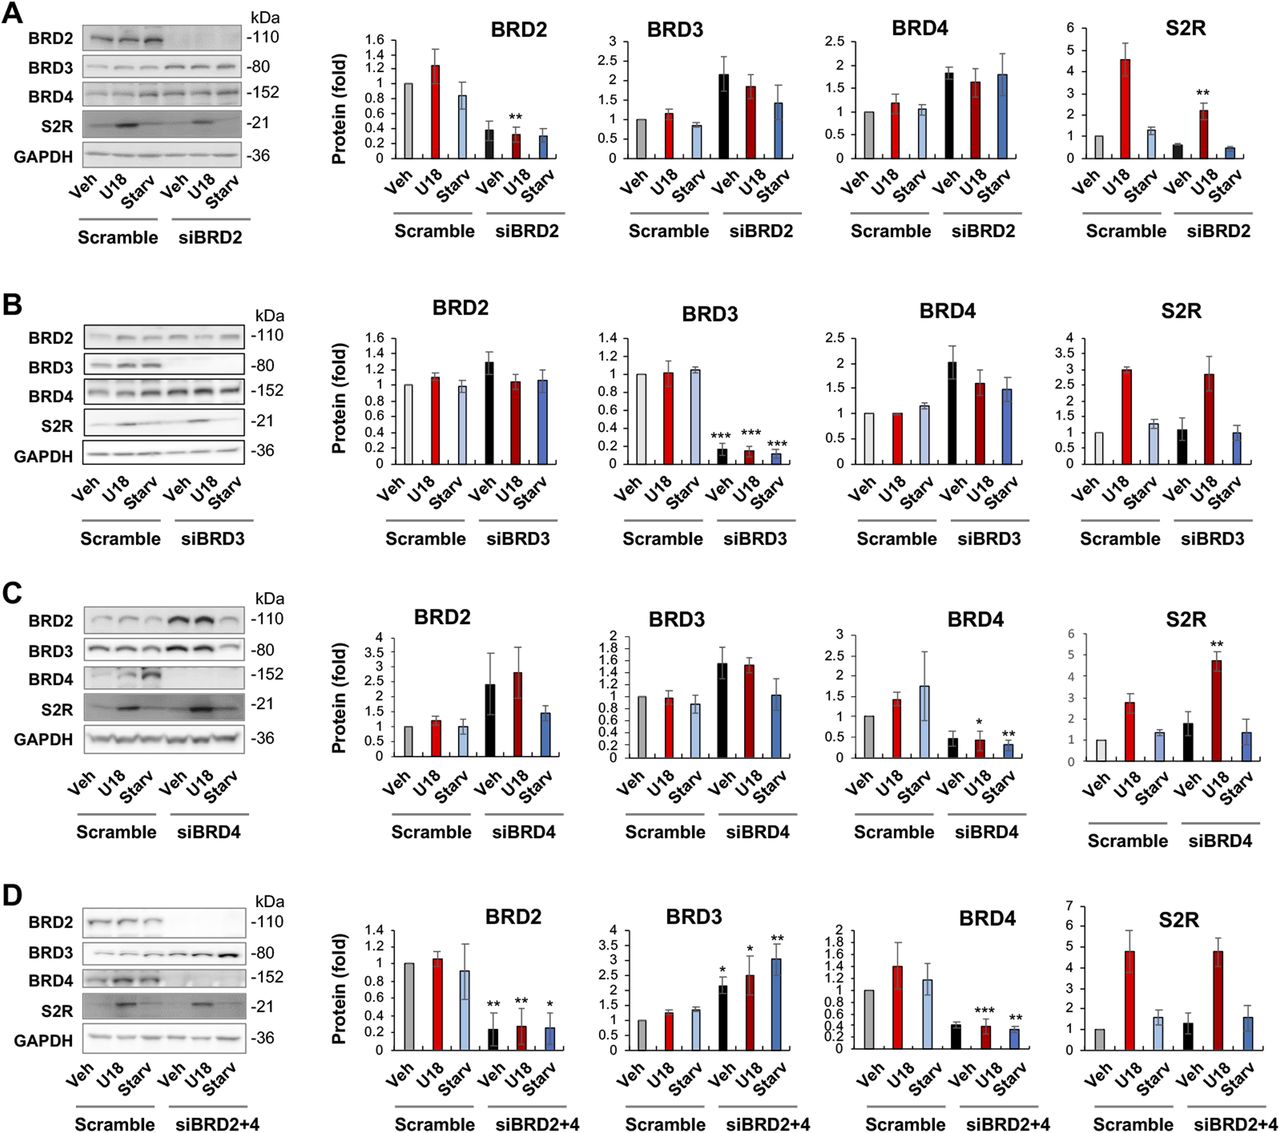
- Figure 2. BRD2 but not BRD3 or BRD4 silencing reduces sigma-2 receptor protein.
(A, B, C) BRD2, BRD3, and BRD4 silencing, respectively. (D) BRD2 and BRD4 double silencing. ARPE19 cells were transfected with a scrambled (control) or specific siRNA for BRD2, BRD3, or BRD4 in DMEM/F12 containing 10% FBS. The cells were then treated with U18 (or vehicle) or starvation (DMEM containing 0% FBS) for 24 h before harvest for Western blot analysis. Quantification: at least three independent repeat experiments were performed; densitometry was normalized to GAPDH and then to the basal control (vehicle, scrambled). The normalized data were averaged to calculate mean ± SEM. Statistics: one-way ANOVA with Bonferroni post hoc test; n ≥ 3 independent repeat experiments; *P < 0.05, **P < 0.01, ***P < 0.001, compared between gene-specific silencing and the corresponding control of scrambled siRNA (dark and light bars of the same color).
- Figure 3. BRD2 but not BRD3 or BRD4 gain-of-function up-regulates sigma-2 receptor mRNA.
(A) BRD2 and BRD3 gain-of function (plotted together). (B) BRD4 gain-of function. Experiments were performed as described for Fig 2. For gain-of-function, ARPE19 cells were transfected with a vector to express GFP (control) or BRD2-GFP or BRD3-GFP or BRD4-GFP. Data are presented as mean ± SD, n = 3 replicates. Each plot represents one of two similar experiments. Statistics: one-way ANOVA with Bonferroni post hoc test; ***P < 0.001, compared between BRD2 (or 3 or 4) overexpression and its corresponding GFP control (dark and light bars of the same color).
- Figure 4. BRD2 but not BRD3 or BRD4 gain-of-function up-regulates sigma-2 receptor protein.
(A, B, C) BRD2, BRD3, and BRD4 gain-of-function, respectively. Experiments and Western blot data quantification were performed as described for Fig 2. ARPE19 cells were transfected with a vector to express GFP (control) or BRD2-GFP or BRD3-GFP or BRD4-GFP. Statistics: one-way ANOVA with Bonferroni post hoc test; n = 4 independent repeat experiments; *P < 0.05, **P < 0.01, ***P < 0.001, compared between BRD2 (or 3 or 4) overexpression and its corresponding GFP control (dark and light bars of the same color).
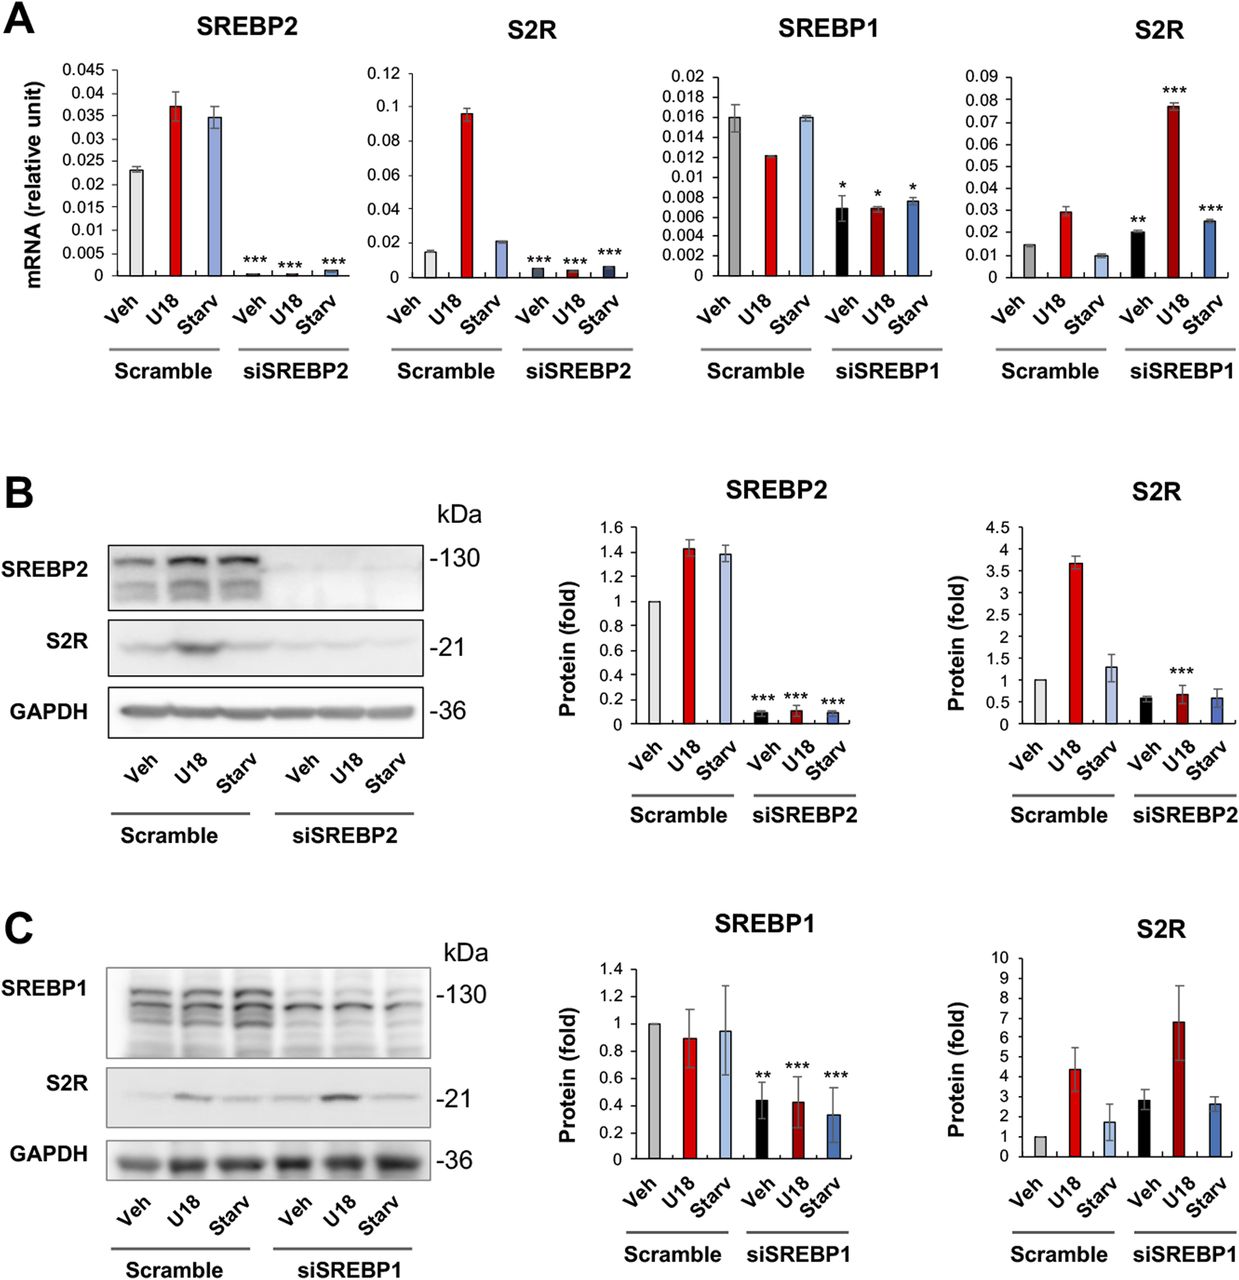
- Figure 5. SREBP2 but not SREBP1 silencing reduces sigma-2 receptor mRNA and protein expression.
(A) mRNA levels (qRT-PCR). Quantification: Mean ± SD, n = 3 replicates. Each plot represents one of two similar experiments. (B, C) Protein levels (Western blot). Experiments with ARPE19 cells and data quantification were performed as described for Fig 2. Statistics: one-way ANOVA with Bonferroni post hoc test; n = 4 independent repeat experiments; *P < 0.05, **P < 0.01, ***P < 0.001, compared between gene-specific silencing and its corresponding control of scrambled siRNA (dark and light bars of the same color).
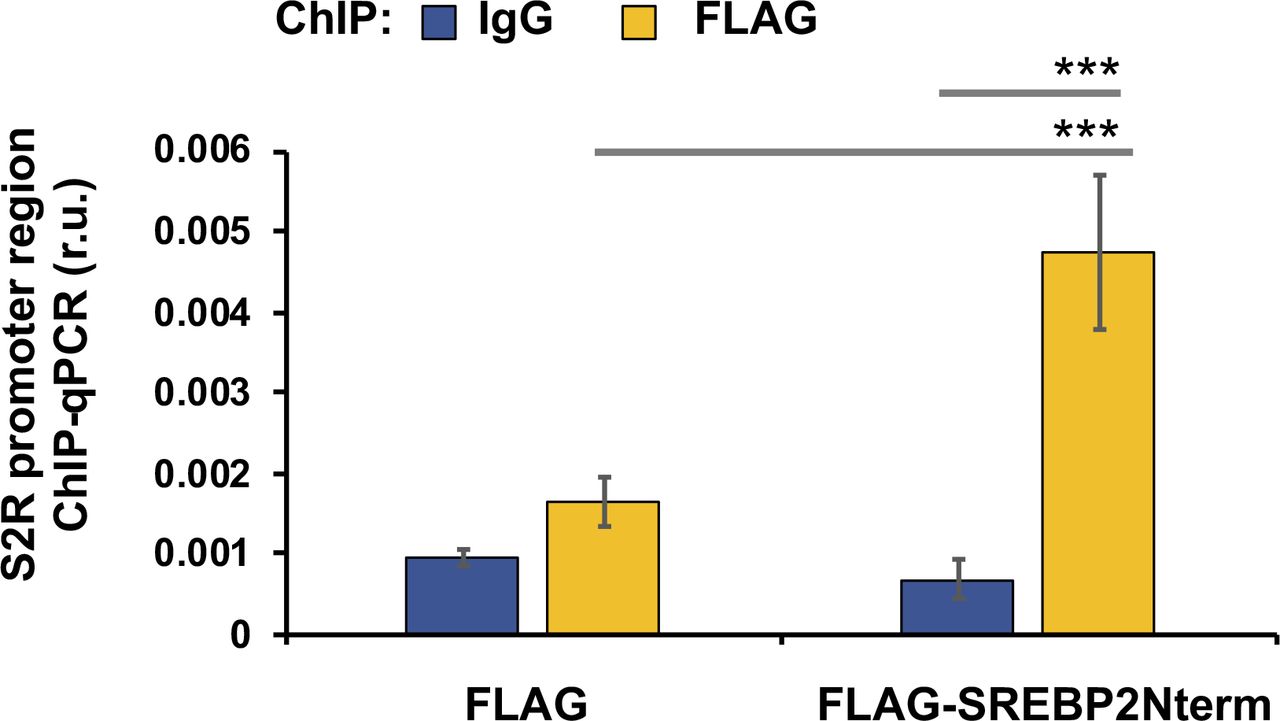
- Figure S4. Cells were transfected with a vector to express FLAG-GFP (control) or FLAG-GFP-SREBP2Nterm.
ChIP was performed using a FLAG antibody. qPCR was performed to detect a software-predicted SREBP-binding region (∼1,000 bp from the Transcription Start Site) in the sigma-2 receptor gene promoter. IgG was used for negative control. Quantification: mean ± SD; n = 3 replicates. Statistics: one-way ANOVA with Bonferroni post hoc test; ***P < 0.001.
- Figure 6. BRD2 and SREBP2 double silencing diminishes sigma-2 receptor expression.
(A) Representative Western blots. (B) Quantified data. Experiments and Western blot data quantification were performed as described for Fig 2. BRD2-specific and SREBP2-specific siRNAs were used separately or in combination for gene silencing. Statistics: one-way ANOVA with Bonferroni post hoc test; n = 4 independent repeat experiments; ***P < 0.001, compared between gene-specific silencing and the scrambled siRNA control (dark and light bars of the same color).
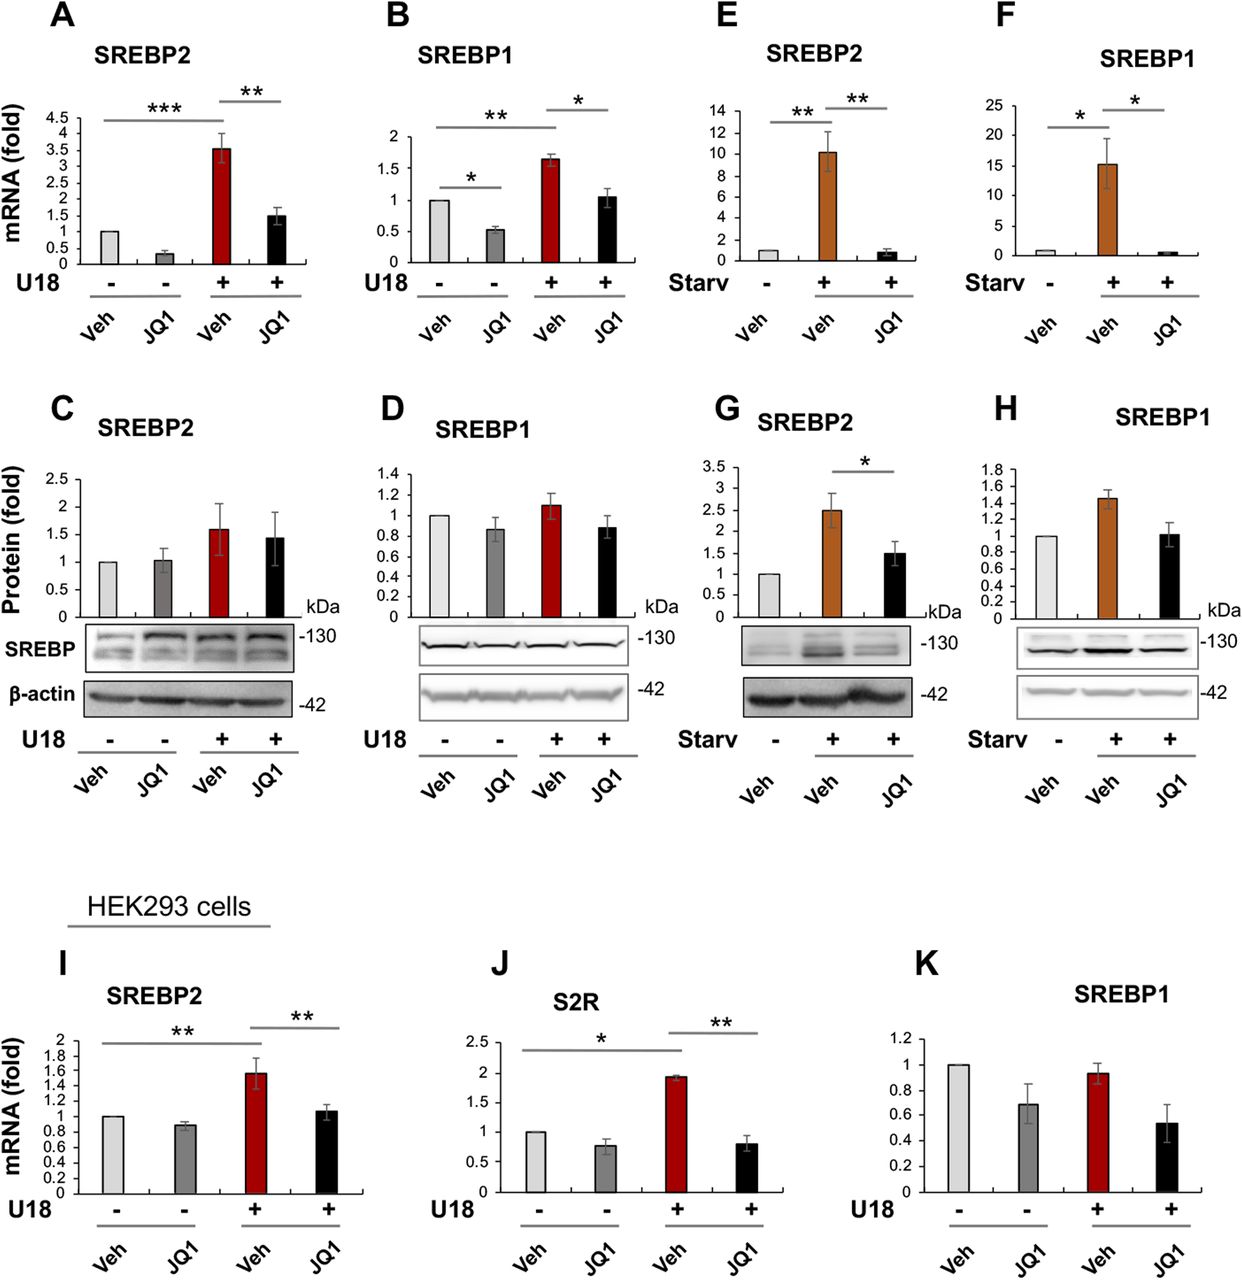
- Figure 7. BET inhibition suppresses the transcription of SREBPs.
(A, B) Effect of JQ1 on SREBP2 and SREBP1 mRNA levels in U18-treated ARPE19 cells. (C, D) Effect of JQ1 on SREBP2 and SREBP1 protein levels in U18-treated ARPE19 cells. (E, F) Effect of JQ1 on SREBP2 and SREBP1 mRNA levels in starved ARPE19 cells. (G, H) Effect of JQ1 on SREBP2 and SREBP1 protein levels in starved ARPE19 cells. (I, J, K) Effect of JQ1 on SREBP2, sigma-2 receptor, and SREBP1 mRNA levels, respectively, in HEK293 cells. Experimental procedures and data quantification were performed as described for Fig 1. Statistics: one-way ANOVA with Bonferroni post hoc test; n = 3 (qRT-PCR) or 4 (Western blot) independent repeat experiments; *P < 0.05, **P < 0.01, ***P < 0.001; for simplicity, nonsignificant comparison is not labeled.
Source data are available for this figure.
Source Data for Figure 7[LSA-2019-00540_SdataF1_F7.tif]
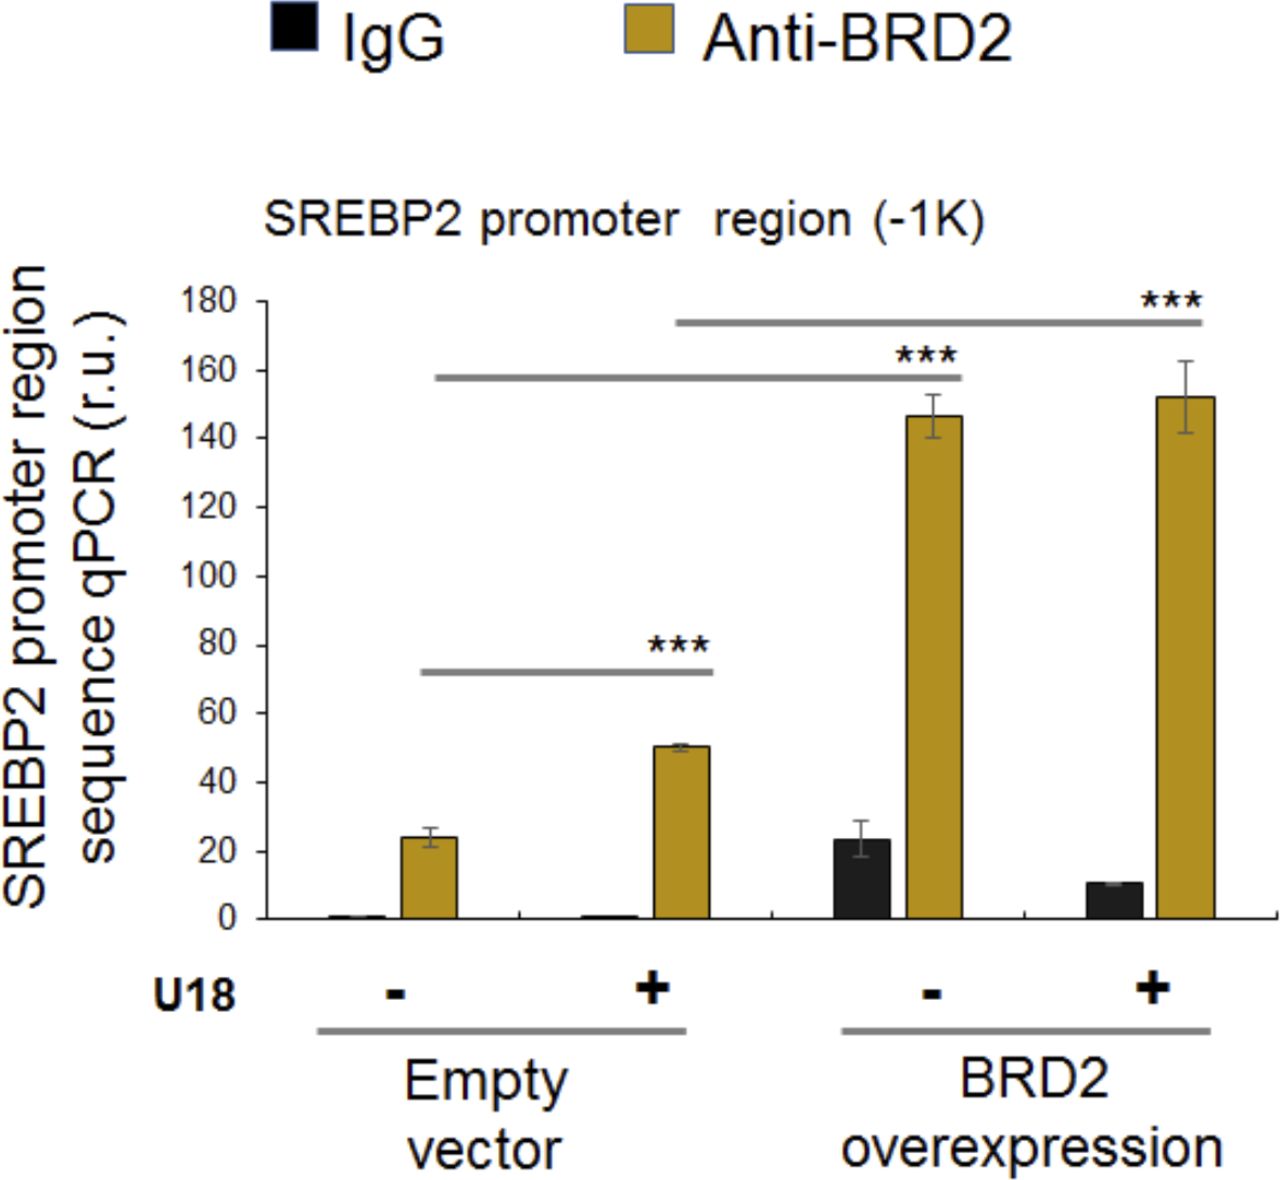
- Figure S5. BRD2 antibody immunoprecipitates a SREBP2 gene promoter region.
ChIP-qPCR was performed as described in Fig 9C. Shown is the experiment for the detection of BRD2 occupancy at the SREBP2 gene promoter instead. The data indicate that SREBP2 gene promoter (region) DNA was immunoprecipitated together with BRD2 by ChIP.
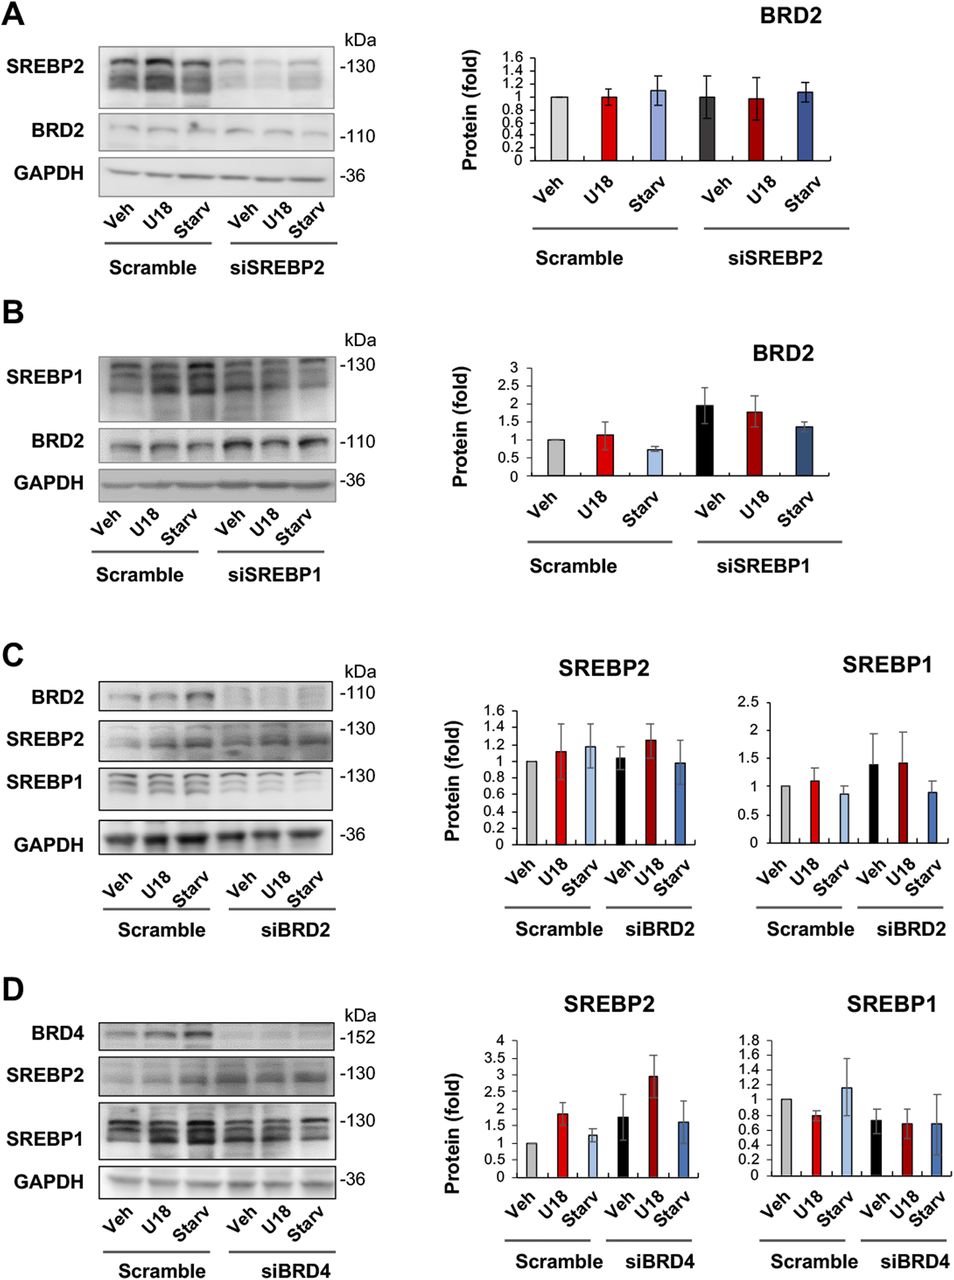
- Figure 8. SREBP2 silencing does not alter BRD2 protein levels.
(A) Effect of SREBP2 silencing on BRD2 protein levels. (B) Effect of SREBP1 silencing on BRD2 protein levels. (C) Effect of BRD2 silencing on SREBP2 and SREBP1 protein levels. (D) Effect of BRD4 silencing on SREBP2 and SREBP1 protein levels. ARPE19 cells were transfected with a scrambled or specific siRNA, treated for 24 h with U18 or starvation, and then harvested for Western blot assay. Data (mean ± SEM) were quantified as described for Fig 1. Statistics: one-way ANOVA with Bonferroni post hoc test; n = 4 independent repeat experiments. Nonsignificant difference is not labeled.
- Figure S6. Effect of SREBP2 silencing on BRD2 mRNA expression.
Experiments were performed as described for Fig 1G and F except that SREBP2-specific siRNA was used. Quantification: mean ± SD, n = 3 repeats. Each plot represents one of two similar independent experiments. Statistics: one-way ANOVA with Bonferroni post hoc test.
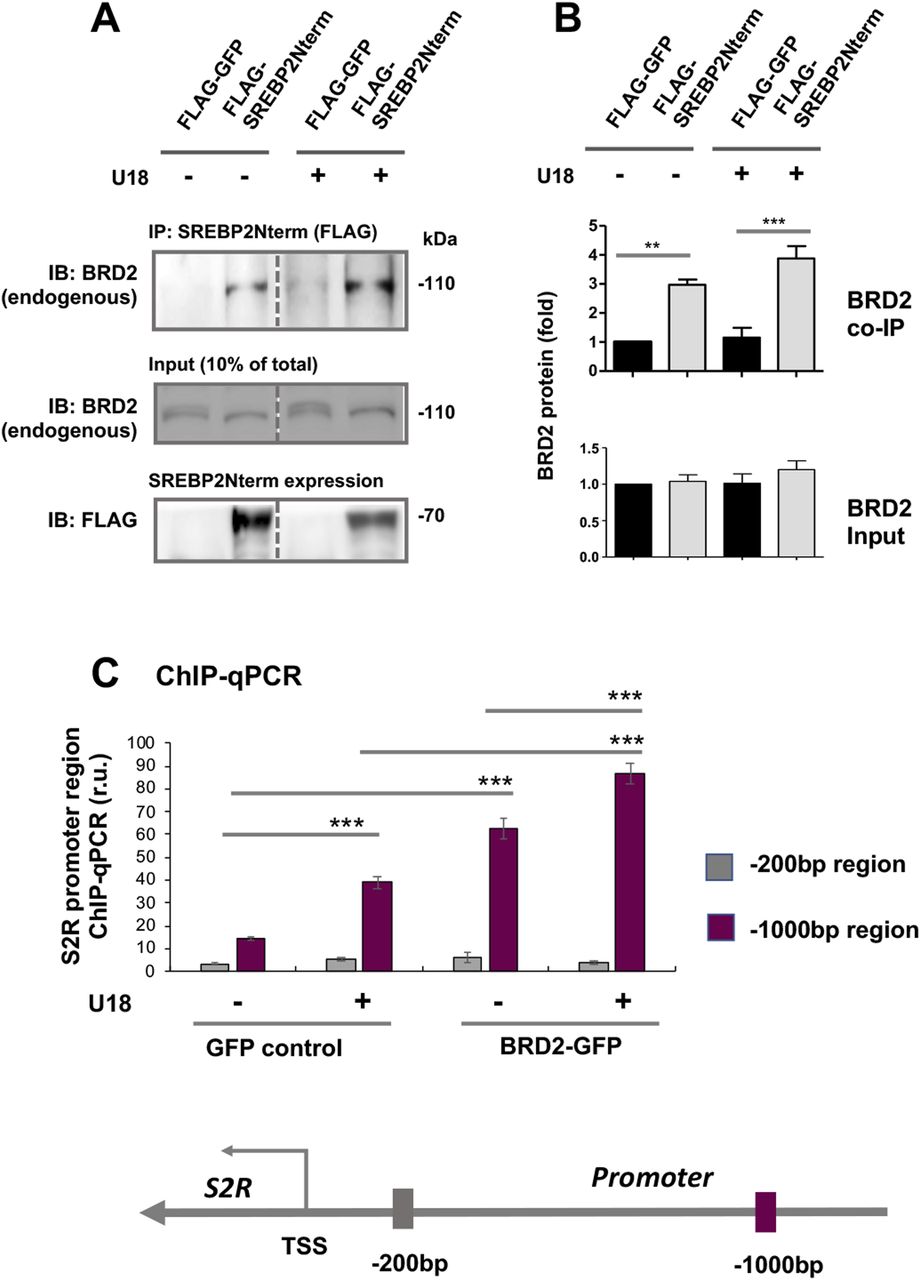
- Figure 9. Endogenous BRD2 co-immunoprecipitates with the SREBP2 N-terminal half molecule and sigma-2 receptor gene promoter DNA.
(A, B) Co-immuoprecipitation (Co-IP). ARPE19 cells were transfected with a vector to express FLAG-GFP (control) or FLAG-SREBP2Nterm (the transcriptionally active N-terminal half molecule). IP was performed with an anti-FLAG antibody and immunoblotting (IB) with an antibody against endogenous BRD2. Quantification: mean ± SEM; n = 3 independent repeat experiments. The value of basal control (FLAG-GFP, no U18) was used to normalize data. Statistics: one-way ANOVA with Bonferroni post hoc test; **P < 0.01, ***P < 0.001. (C) ChIP-qPCR. Cells were transfected with a vector to express GFP (control) or BRD2-GFP. ChIP was performed using an antibody against endogenous BRD2. qPCR was performed to detect a software-predicted SREBP-binding region (∼1,000 bp from the Transcription Start Site, TSS) in the sigma-2 receptor gene promoter and a relatively unrelated region (∼200 bp) for negative control. The value from the basal control was used to normalize the ChIP-qPCR data. Quantification: mean ± SD; n = 3 replicates. Statistics: one-way ANOVA with Bonferroni post hoc test; ***P < 0.001.
Source data are available for this figure.
Source Data for Figure 9[LSA-2019-00540_SdataF9.tif]
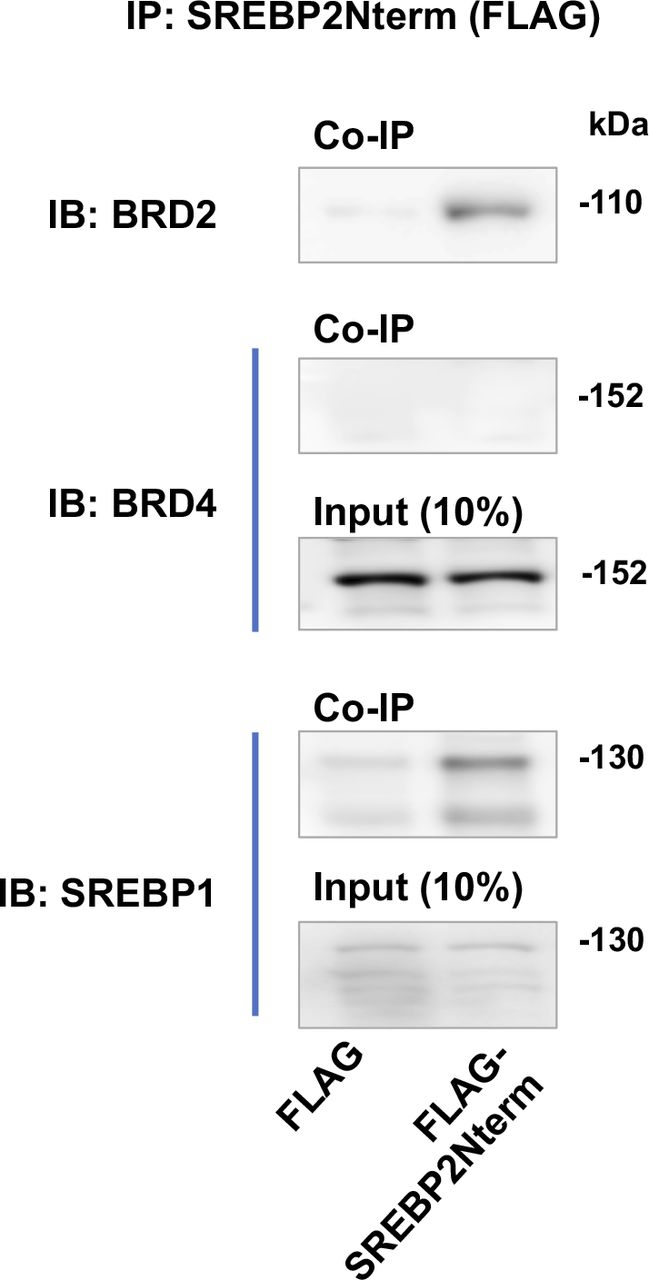
- Figure S7. BRD4 does not co-immunoprecipitate with SREBP2Nterm.
The experiment was performed as in Fig 9A. ARPE19 cells were transfected with a vector to express FLAG-GFP (control) or FLAG-GFP-SREBP2Nterm (the transcriptionally active N-terminal half molecule). IP was performed with an anti-FLAG antibody and immunoblotting (IB) with an antibody against endogenous BRD2, BRD4, or SREBP1. Shown are representative Western blots from one of two repeat experiments.
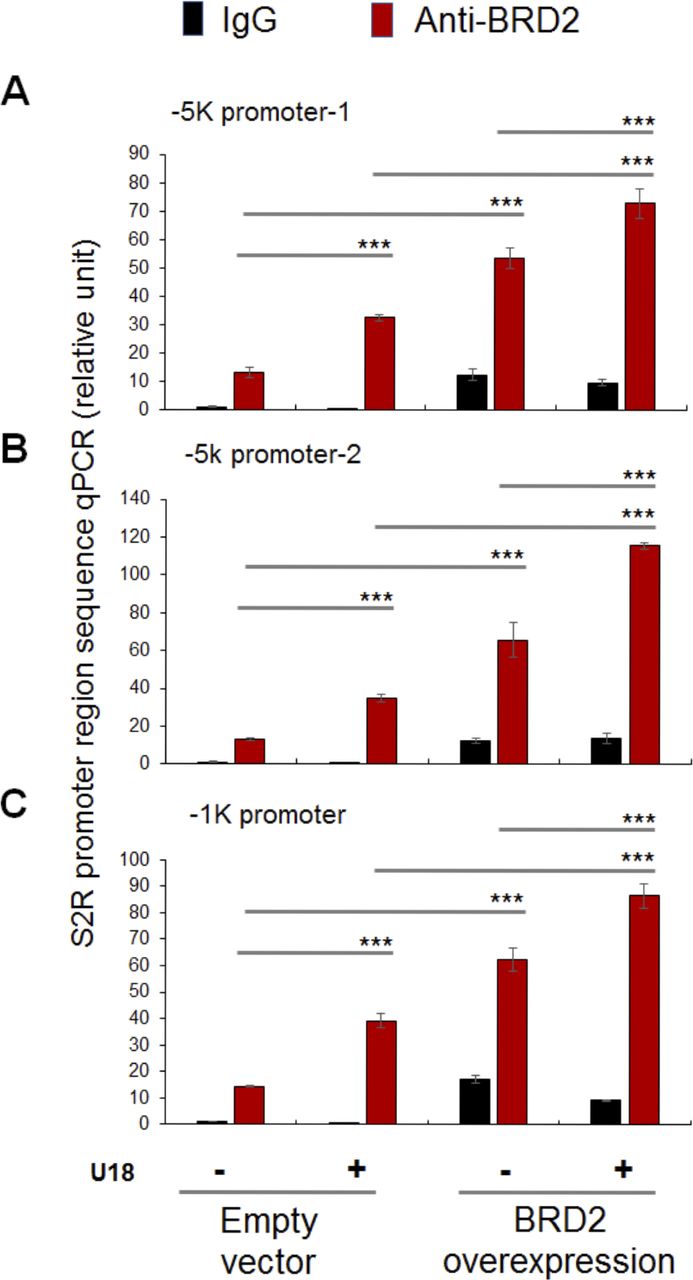
- Figure S8. BRD2 occupies sigma-2 receptor gene promoter regions.
ChIP-qPCR was performed as described in Fig 9C. (A, B, C) show the results from three experiments to detect BRD2 occupancy at three different sigma-2 receptor gene promoter sites, respectively, one of which (C) is presented in Fig 9C.
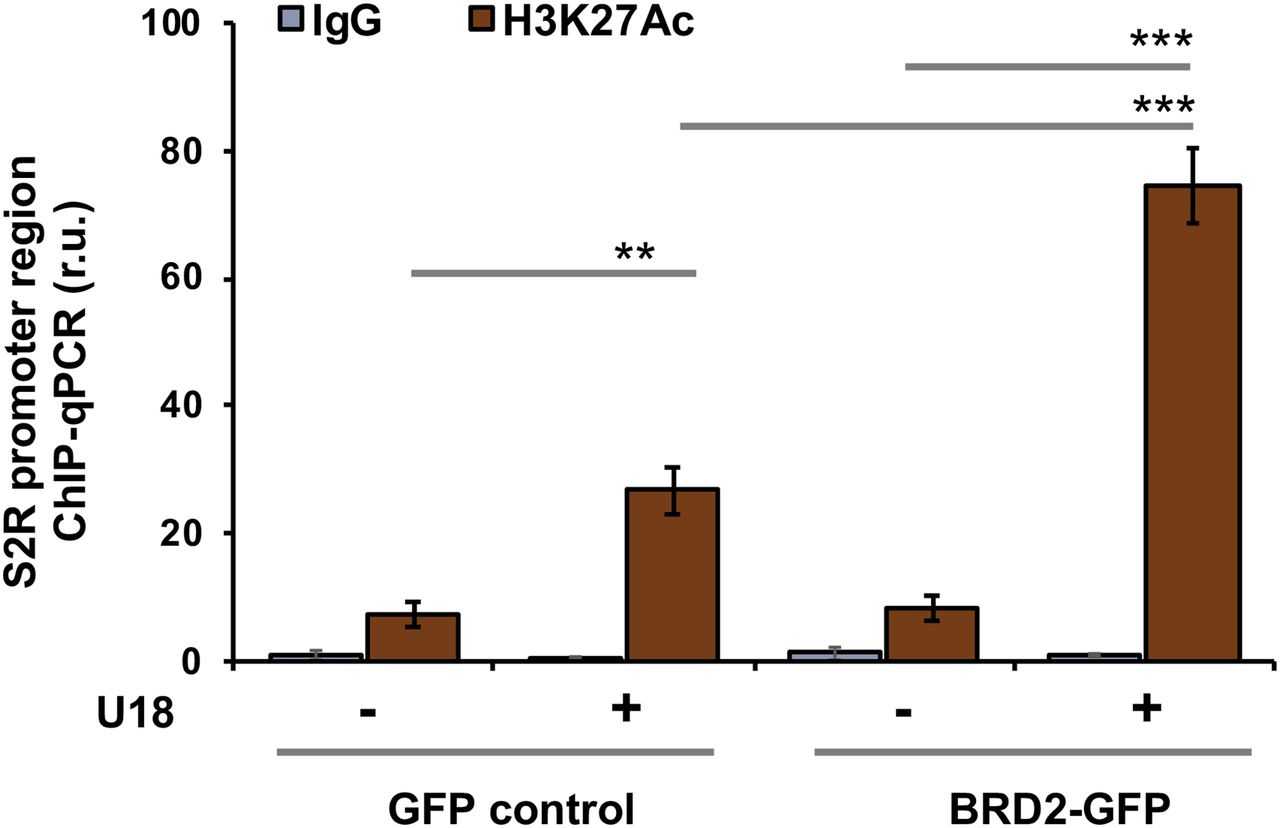
- Figure 10. H3K27Ac co-immunoprecipitates the sigma-2 receptor gene promoter DNA.
Cells were transfected with a vector to express GFP (control) or BRD2-GFP. ChIP was performed using an antibody against H3K27Ac. qPCR was performed to detect a software-predicted SREBP-binding region (∼1,000 bp from the Transcription Start Site, the same as in Fig 9C) in the sigma-2 receptor gene promoter. The value from the basal control was used to normalize the ChIP-qPCR data. Quantification: mean ± SD; n = 3 replicates. Statistics: one-way ANOVA with Bonferroni post hoc test; ***P < 0.001, **P < 0.01.
- Figure 11. Localization of BRD2 and SREBP2 in the nucleus.
To confirm the nuclear localization of overexpressed proteins, ARPE19 cells were transfected with a vector to express SREBP2Nterm or BRD2, each tagged with GFP or mCherry. Confocal microscopy was performed for imaging. Co-localization of these two proteins is shown by merged images and also by their similar profiles of fluorescence intensity (along the dashed line). By contrast, GFP or mCherry alone is evenly distributed throughout the whole cell. Scale bar: 5 μm. (A, B, C, D, E) show different protein tagging; (B, D) show nuclear fluorescence distribution profiles (along the dashed line); (E) shows nonspecific distribution of GFP or mCherry alone (not in fusion).
- Figure 12. Schematic model of BRD2/SREBP2 cooperative regulation of sigma-2 receptor (S2R) transcription.
Treatment of ARPE19 cells with U18, a NPC1 inhibitor, blocks cholesterol export from lysosomes thereby generating an intracellular environment where ER cholesterol is deprived. Sensing this cholesterol level change, SREBP2 is activated. Its inhibitory C-terminal half is cleaved off and the N-terminal half (SREBP2Nterm) is able to enter the nucleus to bind an SRE in the S2R gene promoter. At the same genomic loci, BRD2 is enriched by binding to acetylated histone while interacting with the SREBP2Nterm, directly or indirectly through co-factors (to be determined). This complex facilitates activation of S2R gene expression via the transcription machinery.
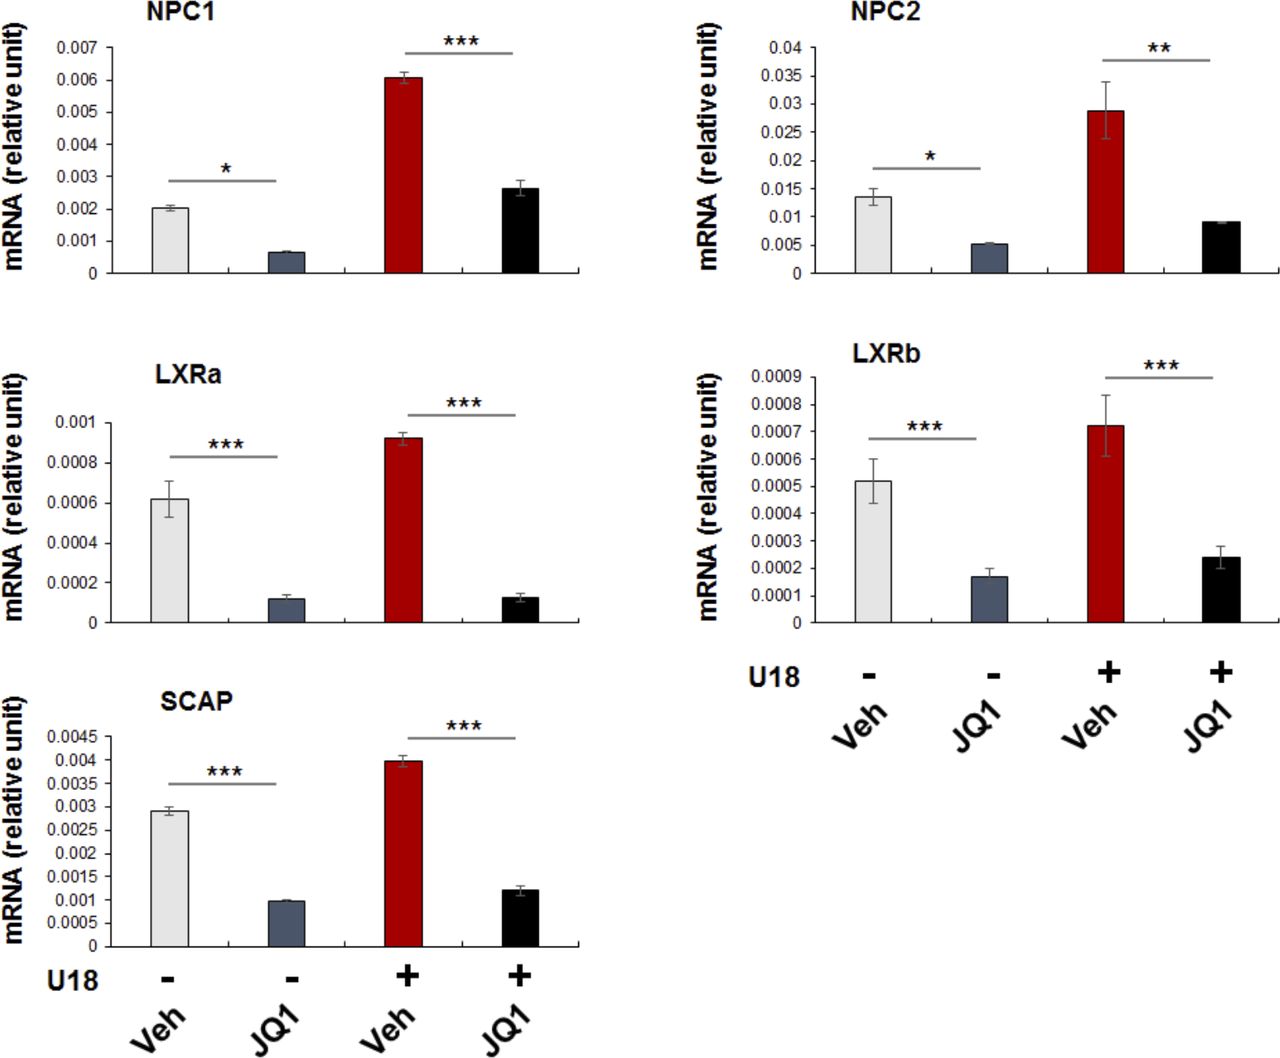
- Figure S9. Pan-BET inhibition attenuates the expression of SREBP target genes.
Experiments were performed as described in Fig 1 except that several SREBP target gene mRNAs were assayed by qRT-PCR. Shown is each representative of two similar yet independent experiments. Statistics: mean ± SD, n = 3. one-way ANOVA with Bonferroni post hoc test; *P < 0.05, **P < 0.01, ***P < 0.001.


Supplementary Materials
Table S1 Primers used for qRT-PCR.
Table S3 Antibodies for Western blotting.
Table S4 Primers for ChIP-qPCR.


In this Issue
Subjects
Related Articles
Cited By...
- No citing articles found.