


Article Figures & Data
Figures
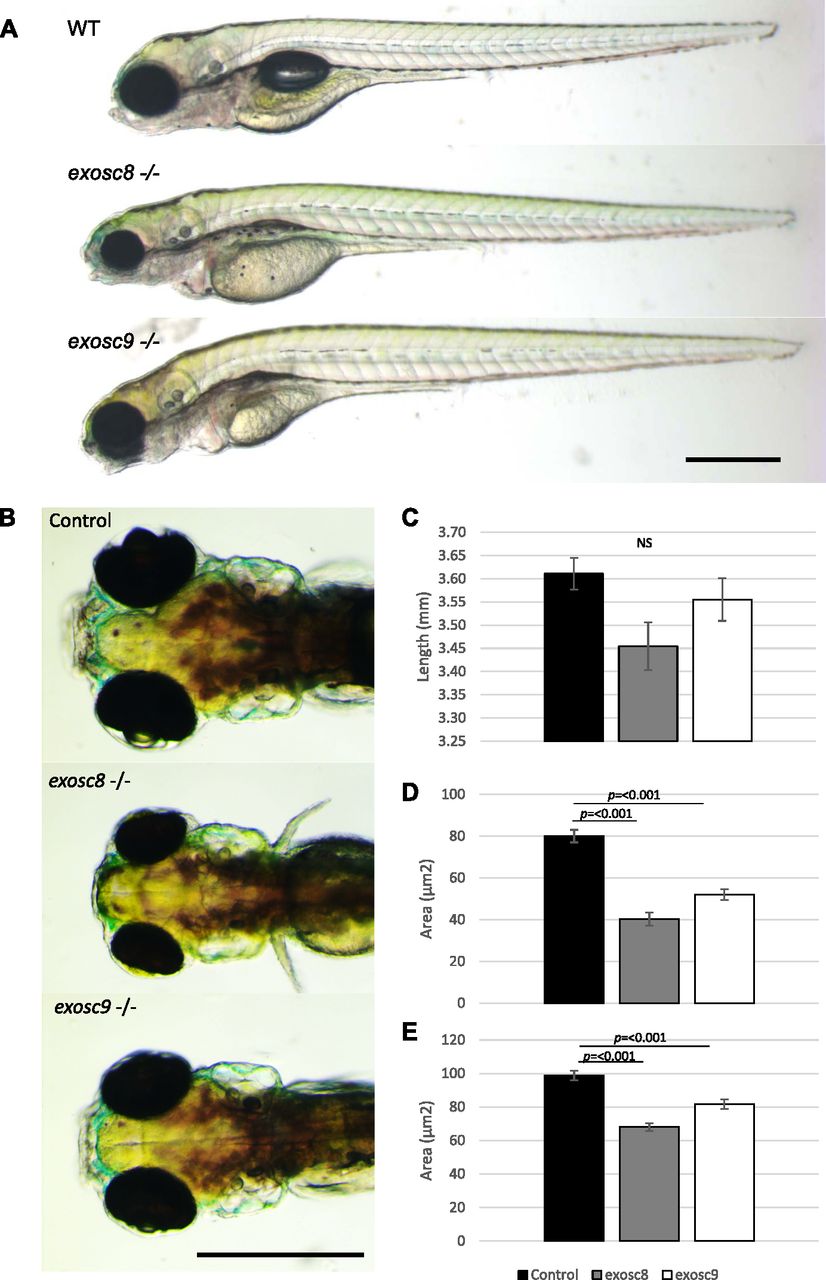
- Figure 1. exosc8 and exosc9 homozygous mutant zebrafish develop microcephaly.
(A) Gross anatomy of 5-dpf wild-type, exosc8 homozygous mutant and exosc9 homozygous mutant zebrafish embryos; lateral view, anterior to the left. Scale bar: 500 μm. (B) Dorsal view of wild-type, exosc8 homozygous mutant and exosc9 homozygous mutant zebrafish embryos. Scale bar: 500 μm. (C, D, E) Standard length, (D) area of eyes, and (E) area of head in 5-dpf wild-type, exosc8 homozygous mutant and exosc9 homozygous mutant zebrafish embryos. 13 control, 8 exosc8 (c.26_27del), and 5 exosc9 (c.198_208del) homozygous larvae were measured for the quantification. Error bars represent the standard error (±SEM), and statistical analysis was performed using unpaired t tests (exosc8 versus wt and exosc9 versus wt, respectively). NS, not significant.
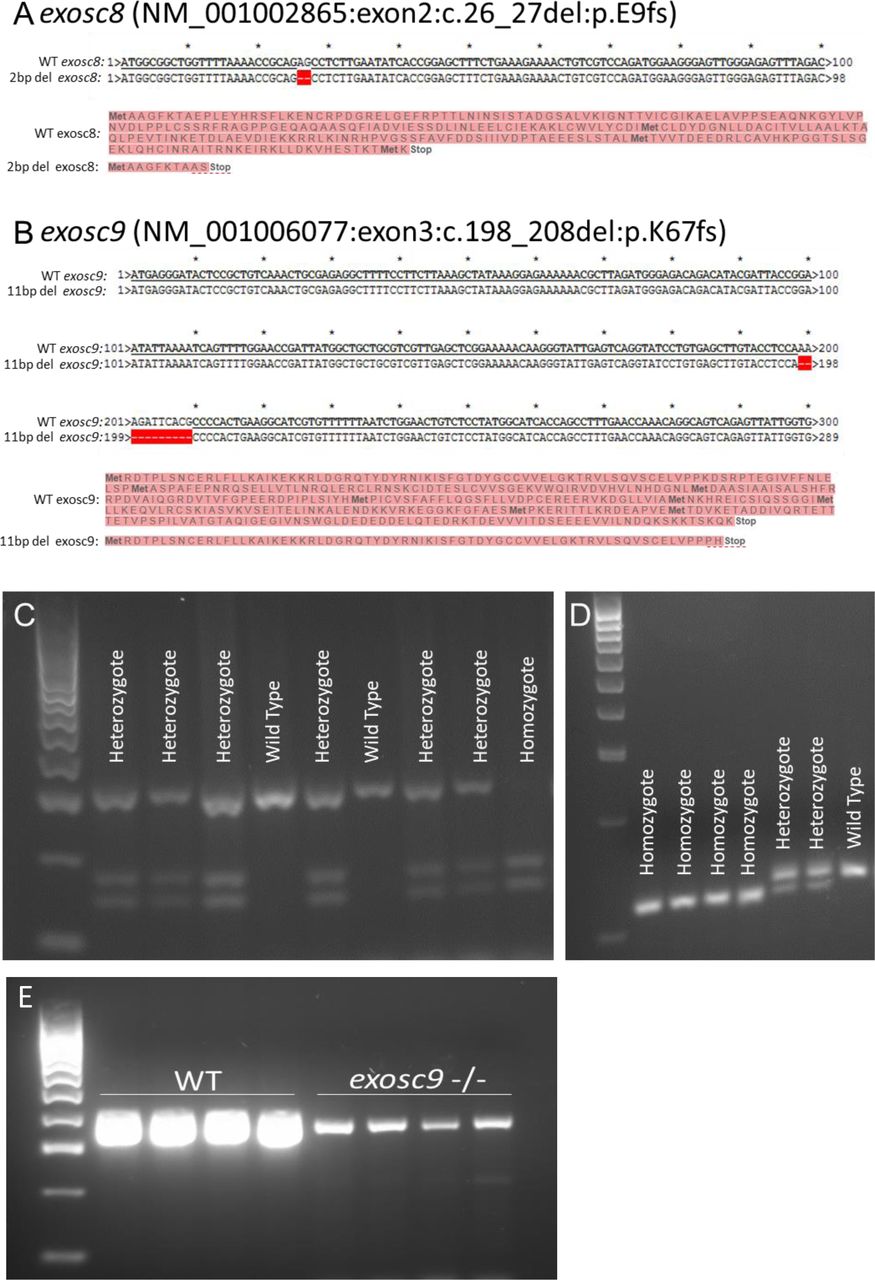
- Figure S1. PCR and sequencing of exosc8 and exosc9 in zebrafish.
(A) CRISPR/Cas9 was used to create a 2-bp deletion in exon 2 of exosc8. This would cause a frameshift and result in a premature stop codon and significantly truncated protein or degradation of the mRNA via nonsense-mediated decay. (B) CRISPR/Cas9 was used to create an 11-bp deletion in exon 3 of exosc9. This would cause a frameshift and result in a premature stop codon and significantly truncated protein or mRNA degradation via nonsense-mediated decay. (C) The 2-bp deletion generated in exosc8 could be identified by PCR of genomic DNA, followed by a restriction digest using TseI and then gel electrophoresis to genotype zebrafish. The wild-type allele remains uncut, whereas a new TseI restriction site appears in the mutant allele (GCAGC, TseI site is GCWGC). (D) The 11-bp deletion generated in exosc9 could be identified by PCR of genomic DNA, followed by gel electrophoresis to genotype zebrafish. The 11-bp difference between the wild -type band and the shorter mutant band can be visualised on a high percentage agarose gel. (E) RT-PCR for exosc9 in wild-type and exosc9 homozygous mutant fish reveals a reduction of exosc9 transcript in the mutants. The RT-PCR is not quantitative but shows a reduced band intensity in the exosc9 fish.
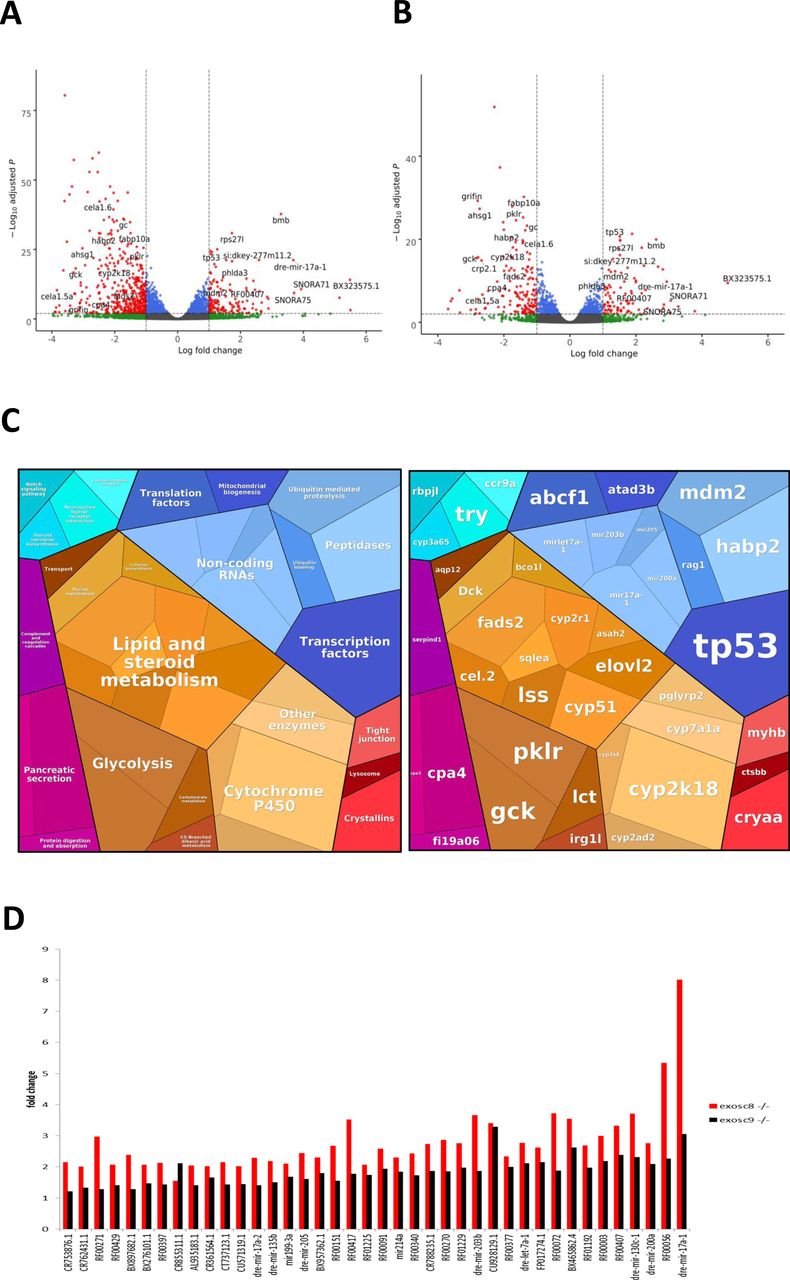
- Figure S2. RNAseq performed on 5-dpf wild-type, exosc8 homozygous mutant, and exosc9 homozygous mutant zebrafish embryos.
(A) Volcano plot showing the differential expression of transcripts in exosc8 homozygous mutants versus controls, with statistical significance (P-value) on the y-axis versus the magnitude of change (fold change) on the x-axis. The exosc8 mutant zebrafish embryos appear to be the main driver for the excessive number of genes, showing a decrease in steady-state RNA transcript levels compared with a smaller number of genes showing an overall increase in transcript levels. (B) Volcano plot showing the differential expression of transcripts in exosc9 homozygous mutants versus controls. The volcano plot showing the combined differential expression for exosc8 and exosc9 mutants versus controls is shown in Fig 2E of the main manuscript. (C) Pathways where RNA steady state was significantly altered (exosc8 and exosc9 versus controls). (D) Selected non-coding RNAs where increased levels were observed in exosc8 and exosc9 homozygous mutant zebrafish.
- Figure 2. exosc8 and exosc9 homozygous mutant zebrafish have increased non-coding RNA expression and differences in gene expression.
Summary of RNAseq performed on 5-dpf wild-type, exosc8 homozygous mutant and exosc9 homozygous mutant zebrafish embryos. (A) Gene set over-representation analysis of RNAs that were significantly increased or decreased in both homozygous mutant exosc8 and exosc9 zebrafish embryos compared with controls. (B) Selected GO terms and number of transcripts associated with them among the increased protein-coding RNAs in the mutant zebrafish lines. GO term analysis was performed on http://pantherdb.org/. (C) Log2 ratios of cumulative, normalised RNA read counts for different non-coding RNA types in exosc8 or exosc9 homozygous mutant embryos versus controls. (D) Correlation of exosc8 and exosc9 log2 ratios of cumulative, normalised read counts for individual non-coding RNA genes. (E) Volcano plot showing the differential expression of transcripts in exosc8 and exosc9 homozygous mutants versus controls, with statistical significance (P-value) on the y-axis versus the magnitude of change (fold change) on the x-axis. (F) Selected mRNAs where increased levels were observed in eoxsc8 and exosc9 homozygous mutant zebrafish. (F, G) Validation of changes in gene expression via qRT-PCR for the mRNAs represented in (F). Error bars represent the standard error (±SEM), and statistical analysis was performed using unpaired t tests (exosc8 versus wt and exosc9 versus wt, respectively). Values have been normalised to a housekeeping gene and to wt fish; wt level has been set to one and is represented by the dotted line. *P-value < 0.05, **P-value < 0.01, NS, not significant.
- Figure 3. exosc8 and exosc9 homozygous mutant zebrafish develop cerebellar atrophy.
(A) Immunofluorescence in 5-dpf wild-type, exosc8 homozygous mutant and exosc9 homozygous mutant zebrafish embryos with antibodies raised against HuC (green) and Pvalb7 (red) Pvalb7 is a marker for Purkinje cells in the cerebellum, HuC is an early neuronal marker. Scale bar: 500 μm. (B, C) Quantification of (B) HuC-positive area and (C) Pvalb7-positive area in 5-dpf wild-type, exosc8 homozygous mutant and exosc9 homozygous mutant zebrafish embryos. Three control, six exosc8 (c.26_27del), and six exosc9 (c.198_208del) homozygous larvae were measured for the HuC quantification. 6 control, 7 exosc8 (c.26_27del), and 11 exosc9 (c.198_208del) homozygous larvae were measured for the Pvalb7 quantification. Error bars represent the standard error (±SEM) and statistical analysis was performed using unpaired t tests (exosc8 versus wt and exosc9 versus wt, respectively). Labelling: C, cerebellum; F, forebrain; H, hindbrain and spinal cord; M, midbrain.
- Figure S3. exosc8 and exosc9 homozygous mutant zebrafish have reduced motor neuron density.
(A) Immunofluorescence in 5-dpf wild-type, exosc8 homozygous mutant, and exosc9 homozygous mutant zebrafish larvae with an antibody raised against SV2 to stain presynaptic vesicles (red) and alpha bungarotoxin conjugated to Alexa Fluor 488 (green, staining postsynaptic acetylcholine receptors). (B) Quantification of the SV2-positive area in 5-dpf wild-type, exosc8 homozygous, mutant and exosc9 homozygous mutant zebrafish larvae. 5-dpf motor axons manage to migrate to neuromuscular junctions. However, there is significantly less motor axon branching in the exosc8 (c.26_27del) and exosc9 (c.198_208del) homozygous larvae than WT and heterozygous clutchmates. Seven control, nine exosc8 (c.26_27del), and 8 exosc9 (c.198_208del) homozygous larvae were measured for the quantification. Error bars represent the standard error (±SEM), and statistical analysis was performed using unpaired t tests (exosc8 versus wt and exosc9 versus wt, respectively). Scale bar: 50 μm.
- Figure S4. exosc8 and exosc9 homozygous mutant zebrafish develop muscular atrophy.
Immunofluorescence in 5-dpf wild-type, exosc8 homozygous mutant, and exosc9 homozygous mutant zebrafish larvae with phalloidin conjugated to Alexa Fluor 594. Phalloidin staining at 5 dpf showed that the exosc8 (c.26_27del) and exosc9 (c.198_208del) homozygous larvae appeared to have thinner tails than WT and heterozygous clutchmates (representative images shown here). Muscle fibres appeared disorganized and not straight with gaps between fibres in the exosc8 (c.26_27del) and exosc9 (c.198_208del) homozygous larvae compared with WT and heterozygous clutchmates. Scale bar: 50 μm.
- Figure 4. exosc8 and exosc9 homozygous mutant zebrafish have increased apoptosis.
(A) Acridine orange staining performed on 48-hpf wild-type, exosc8 homozygous mutant and exosc9 homozygous mutant zebrafish embryos. Representative images of each category are shown here. Four different clutches of offspring with 24 embryos each have been analysed; the acridine orange staining has been performed and evaluated first (without knowledge of the genotype), followed by genotyping of all embryos that were stained. Scale bar: 500 μm. (B) Quantification of acridine orange positive spots. Spots were counted in 36 images of wild-type or heterozygous embryos and 18 images of homozygous mutant embryos. Bright spots in the yolk sac were not counted. Error bars represent the standard error (±SEM) and statistical analysis was performed using the unpaired t test. ****P < 0.0001.
- Figure 5. RNAi-mediated core exosome subunit down-regulation in HCT116 cells leads to a 5S RNP-dependent increase in p53 protein levels and a G2/M cell cycle arrest.
(A) HCT116 cells were treated with siRNAs targeting the EXOSC8 or EXOSC9 mRNA or a control siRNA targeting firefly luciferase for 60 h. Protein levels were analysed by immunoblotting using antibodies specific for EXOSC8 or EXOSC9 (left panel), p53 (right panel) or karyopherin as loading control (both panels) and at least three independent repeat experiments were quantified using ImageQuant (GE Healthcare) software. (B) HCT116 cells were treated with siRNAs targeting EXOSC9 and/or core 5S RNP component RPL5 mRNA or a control siRNA targeting firefly luciferase for 60 h. Protein levels were analysed by immunoblotting using antibodies specific for EXOSC9 (upper panel), p53 (middle panel), or karyopherin as loading control (lower panel), and at least three independent repeat experiments were quantified using ImageQuant (GE Healthcare) software. (C, D) Cell cycle analysis was performed using the FACS Canto II flow cytometer and evaluated using FACSDIVA software. (B) Following actinomycin D (ActD, 4 nM, 18 h) or siRNA treatment (as in panel B), the cells were fixed using 70% ethanol, and DNA was stained using propidium iodide. (C) Representative profiles are shown in panel (C). (D) The graph in panel (D) shows the average percentage levels of G0/G1 (dark grey), S (light grey), or G2/M (grey) phase of at least three experimental repeats. (A, B, D) Error bars represent the standard error (±SEM), and statistical analysis was performed using unpaired t tests. Comparison of significance was performed against the respective control knockdown as indicated or against the plain HCT116 cells for ActD treatment. Absence of significance values indicates no significant differences to the control. *P-value < 0.05, **P-value < 0.01, ***P-value < 0.001.
Source data are available for this figure.
Source Data for Figure 5[LSA-2020-00678_SdataF5.pptx]
- Figure S5. Example of conversion of fibroblasts to induced neuronal progenitor cells (iNPCs) and qPCR.
(A, B, C, D, E, F) Cell morphology at different stages of the direct conversion procedure. (A) Day 0 fibroblasts before infection with Sendai virus. (B) Day 2 after Sendai virus infection and switch to neural induction medium. (C) Day 9. (D) Day 16. (E) Day 21. (F) Day 29. All scale bars: 50 μm. (G) qPCR to characterise expression of fibroblast, stem cell, and neuronal markers in iNPC colonies; the cells shown in this example are the EXOSC3 iNPCs. Expression levels were normalised to GAPDH and the respective fibroblast line (here EXOSC3). The neural stem cell markers were Sox2, Sox1, nestin, and Pax6; the fibroblast markers were Col1a1 and Col3a1. (H) Protein levels of control and patient fibroblasts and iNPCs were also analysed by immunoblotting using antibodies specific for EXOSC9, p53, and karyopherin or GAPDH as loading controls.
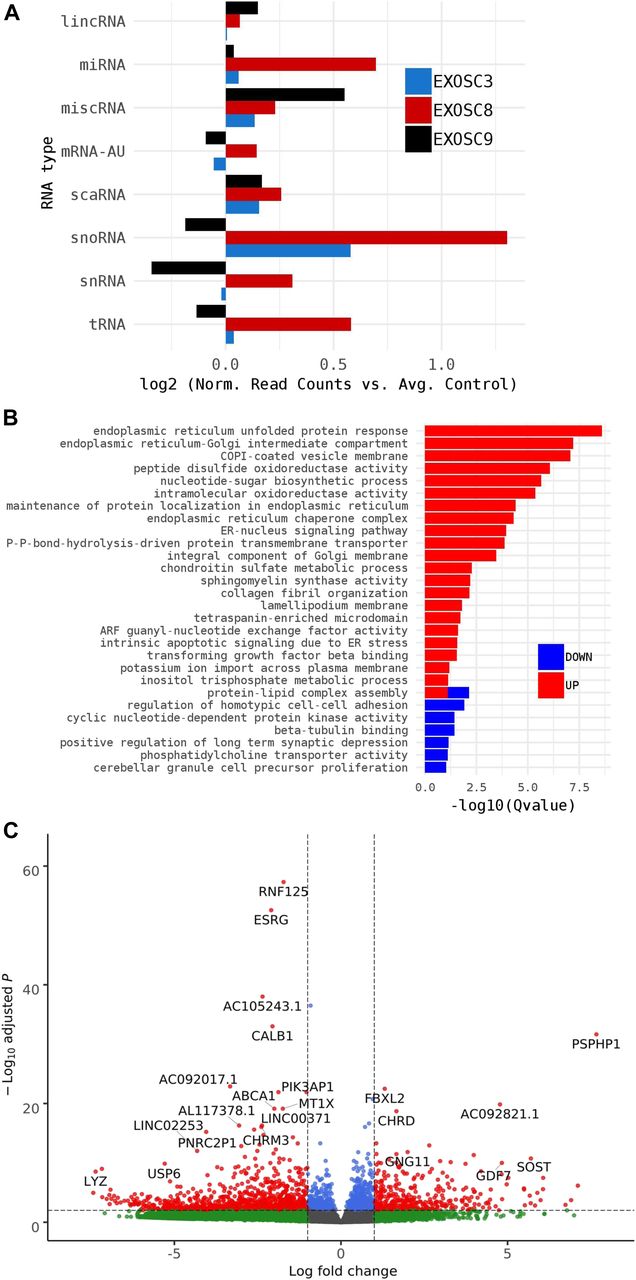
- Figure 6. EXOSC3, EXOSC8, and EXOSC9 mutant–induced neuronal progenitor cells (iNPCs) have alterations in non-coding RNA expression that correlate with zebrafish mutants.
Summary of RNAseq performed on iNPCs converted from fibroblasts carrying either EXOSC3, EXOSC8, or EXOSC9 mutations or controls. (A) Log2 ratios of cumulative, normalised RNA read counts for different non-coding RNA types in EXOSC3, EXOSC8, or EXOSC9 mutant iNPCs versus the average of controls. (B) Gene set over-representation analysis of RNAs that showed a significant difference in expression between EXOSC8 versus control iNPCs. (C) Volcano plot showing the differential expression of transcripts in EXOSC3, EXOSC8, and EXOSC9 mutant iNPCs versus controls, with statistical significance (P-value) on the y-axis versus the magnitude of change (fold change) on the x-axis.
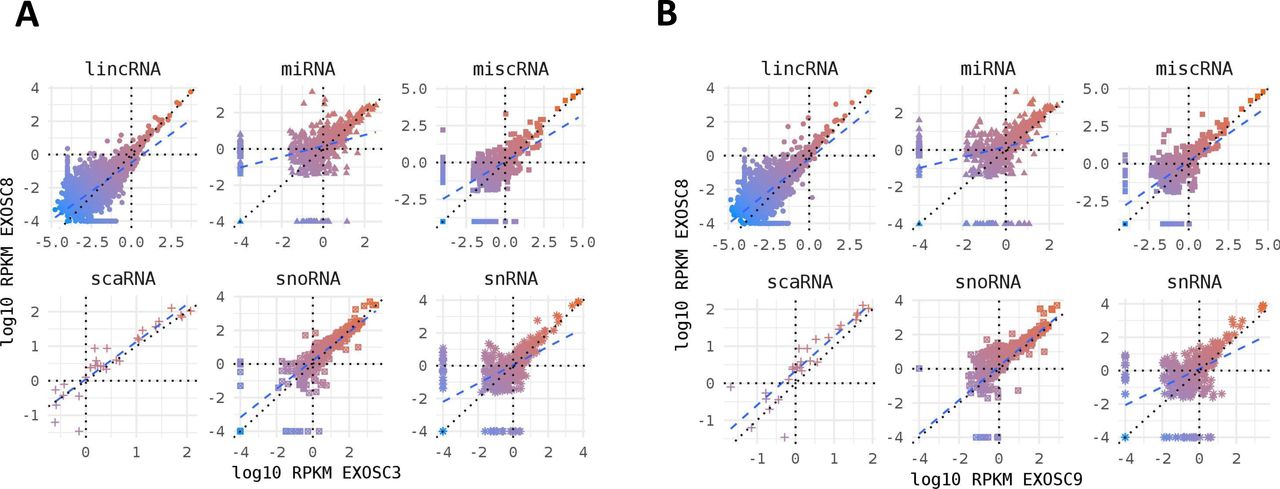
- Figure S6.
Non-coding RNA species in mutant iNPC lines. (A, B) Strong positive correlation between normalised per gene RNAseq read counts (log10 reads per kilobase million) across all different categories of non-coding RNA species for (A) EXOSC8 versus EXOSC3 and (B) EXOSC8 versus EXOSC9-induced neuronal progenitor cell lines. Normalisation was to the average of total RNA reads for the three control-induced neuronal progenitor cell lines.
- Figure S7. Log2 ratios per gene of normalised RNAseq read counts from EXOSC3, EXOSC8, EXOSC9, and three control-induced neuronal progenitor cell lines versus the average read counts per gene for the three controls for different species of non-coding RNAs and AU-rich mRNAs.
RNA read counts were normalised to the average of total reads for the three control-induced neuronal progenitor cell lines.
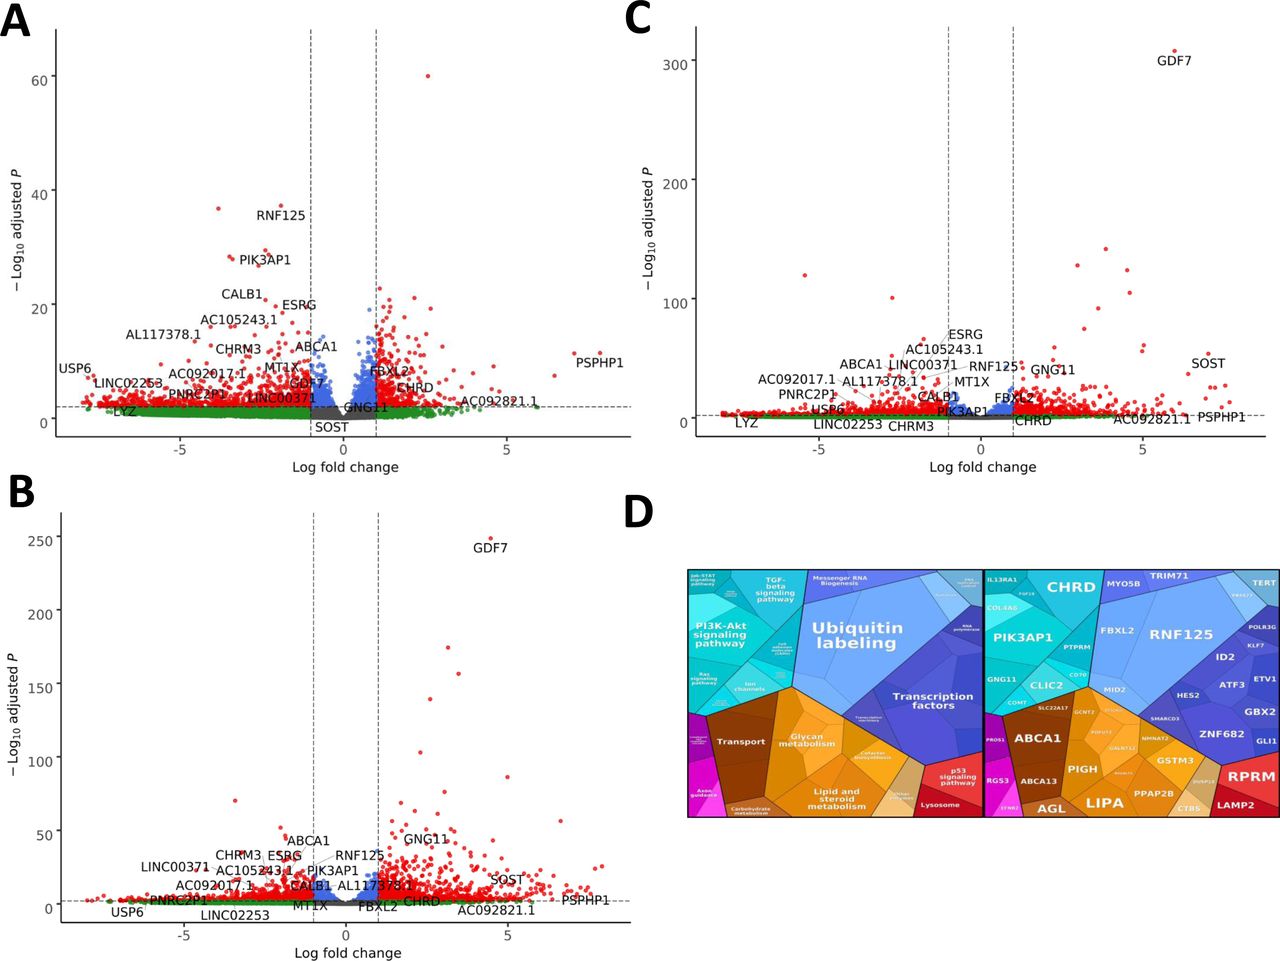
- Figure S8. Summary of the RNAseq results performed on EXOSC3, EXOSC8, and EXOSC9-induced neuronal progenitor cells compared with control-induced neuronal progenitor cells.
(A) Volcano plot showing the differential expression of transcripts in EXOSC3 mutant cells versus controls, with statistical significance (P-value) on the y-axis versus the magnitude of change (fold change) on the x-axis. (B) Volcano plot showing the differential expression of transcripts in EXOSC8 mutants versus controls. (C) Volcano plot showing the differential expression of transcripts in EXOSC9 mutants versus controls. The volcano plot showing the combined differential expression of all three mutant cell lines versus controls is shown in Fig 6 in the main manuscript. (D) Pathways where RNA steady state was significantly altered (EXOSC3, EXOSC8, and EXOSC9 versus controls).
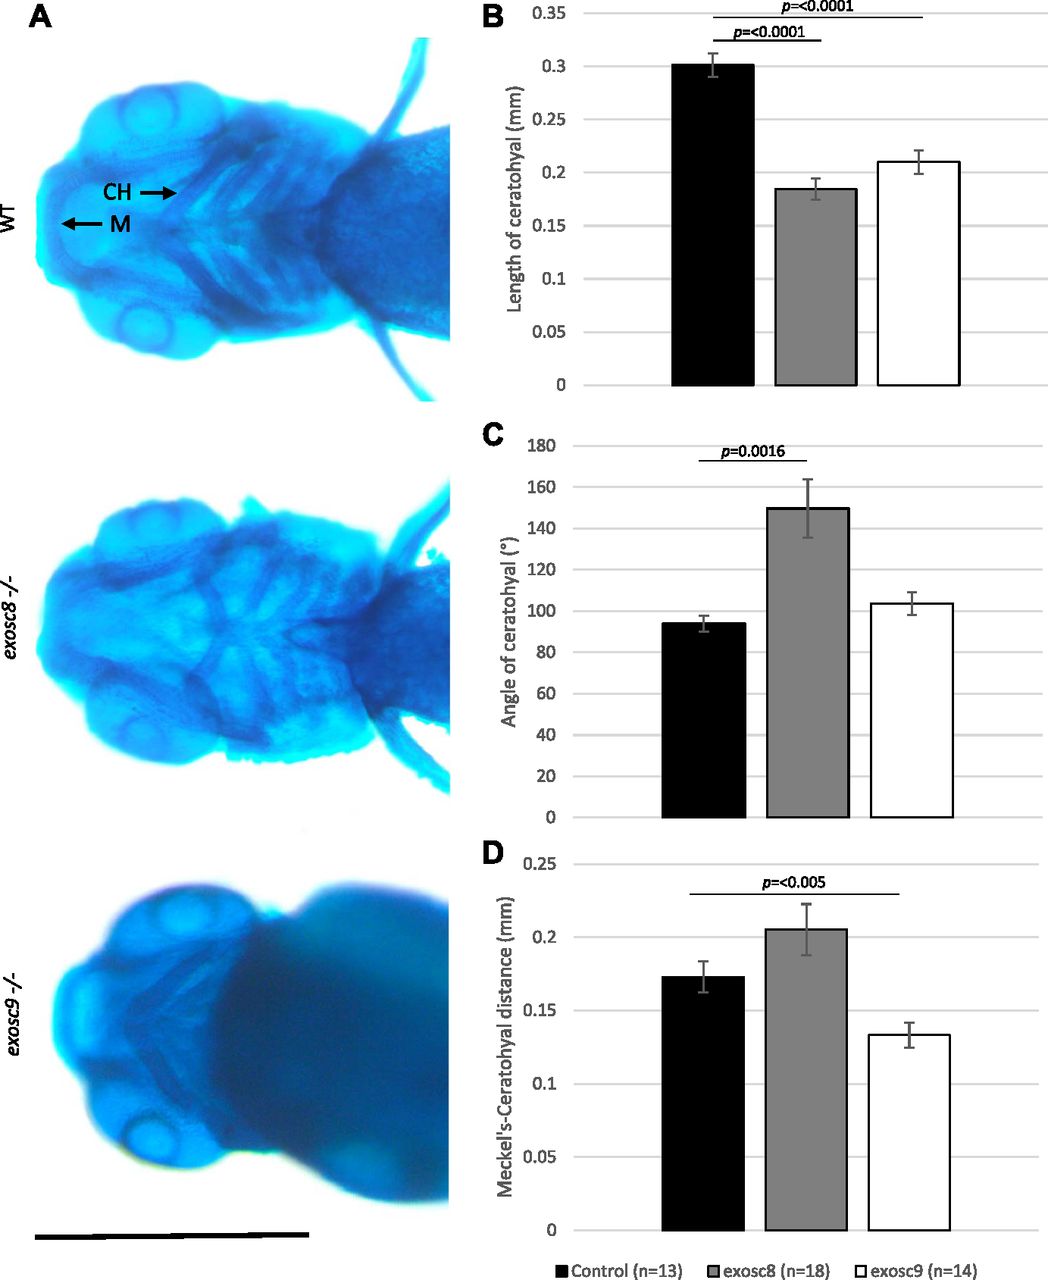
- Figure 7. exosc8 and exosc9 homozygous mutant zebrafish develop craniofacial abnormalities.
(A) Alcian blue staining in 5-dpf wild-type, exosc8 homozygous mutant, and exosc9 homozygous mutant zebrafish embryos. Scale bar: 500 μm. (B, C, D) Length of ceratohyal, (C) angle of ceratohyal, and (D) distance from Meckel’s cartilage to the ceratohyal in exosc8 homozygous mutant and exosc9 homozygous mutant zebrafish embryos. (B, C, D) 13 control, 18 exosc8 (c.26_27del), and 14 exosc9 (c.198_208del) homozygous larvae were measured for the quantification in (B, C, D). Error bars represent the standard error (±SEM), and statistical analysis was performed using unpaired t tests (exosc8 versus wt and exosc9 versus wt, respectively). The difference between mutant and wt is not significant where no P-value is given. Abbreviations: CH, ceratohyal; M, Meckel’s cartilage.
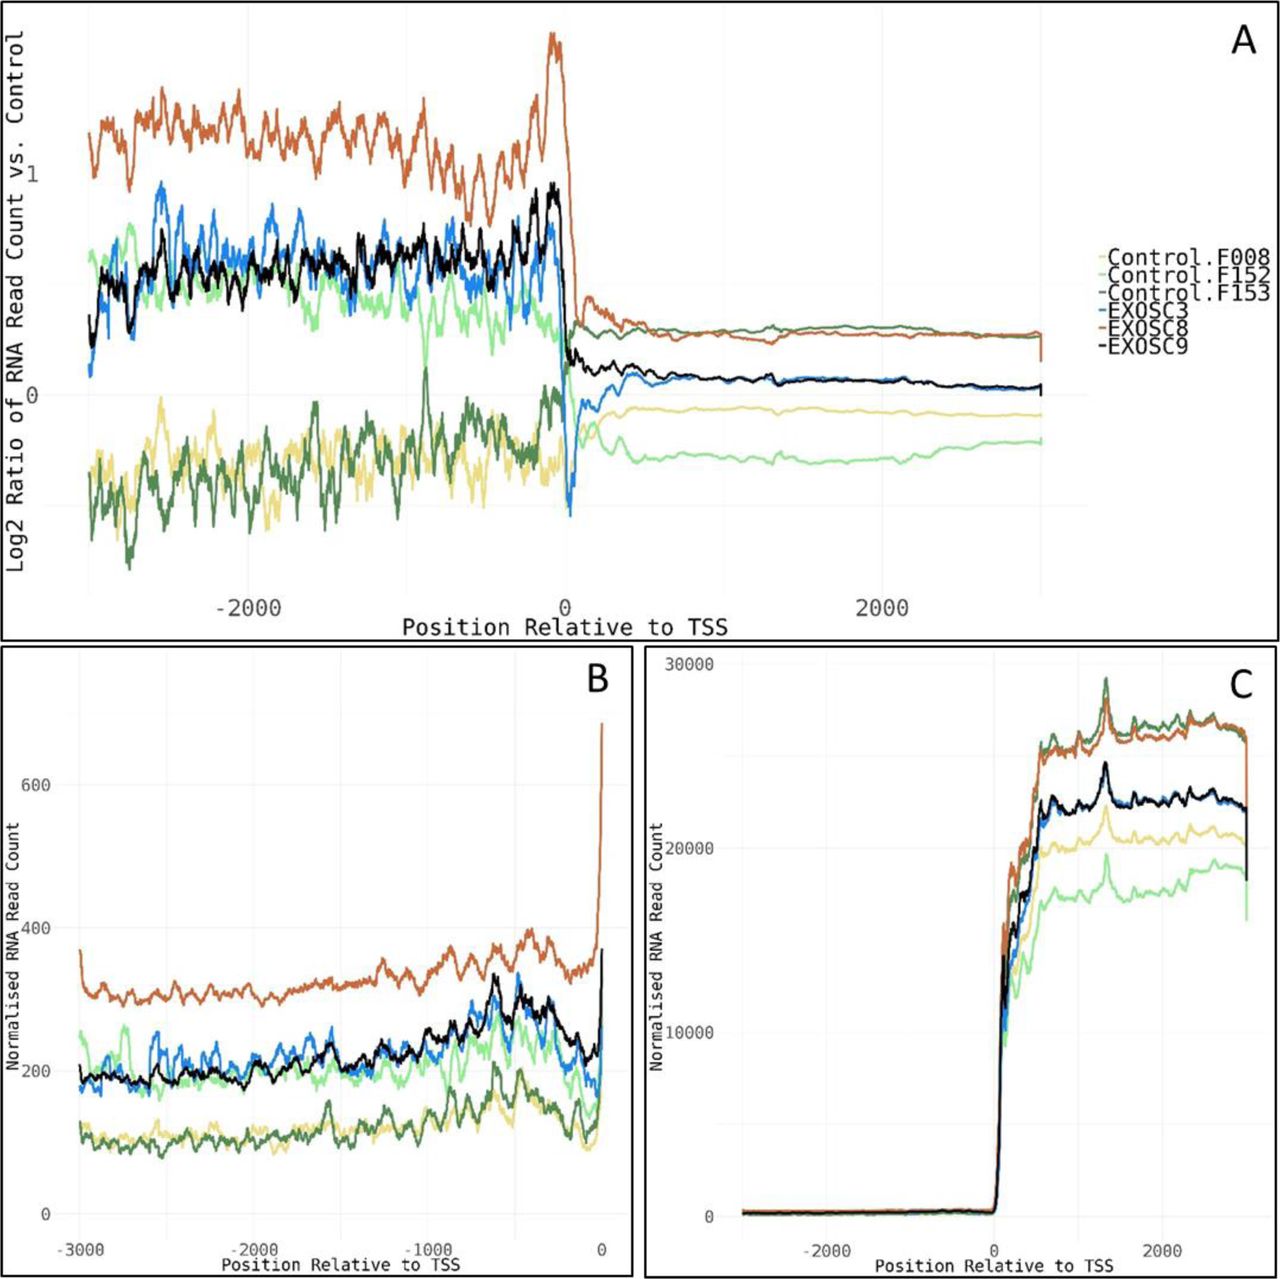
- Figure S9. PROMPTs.
(A) Log2 ratios of normalised cumulative RNAseq read counts for 77 genes with >2-fold increase in average read counts 3,000-bp upstream of transcription start sites in EXOSC3, -8, and/or -9 induced neuronal progenitor cells versus controls. (B, C) Cumulative normalised RNA read counts (B) 3,000-bp upstream of the transcription start site and (C) 3,000-bp up-/downstream of transcription start site for the 77 genes. Normalisation was to the average of total RNA reads for the three control-induced neuronal progenitor cell lines. The 77 genes show enrichment for mRNA splicing pathway (U2SURP, LSM6, LSM8, SNRPD1, POLR2F, HNRNPA0, and SNRPF), small nucleolar ribonucleoprotein complex (GO:0005732, SNRPF, RPP30, LSM6, and NOP58), spliceosomal complex (GO:0005681, FRG1, SNRPD1, SNRPF, LSM6, LSM8, RBMXL1, and PRPF4B), and respiratory chain complex (GO:0098803, NDUFA9, NDUFB6, NDUFA13, and UQCRQ).


Supplementary Materials


In this Issue
Related Articles
Cited By...
- No citing articles found.