


Article Figures & Data
Figures
- Figure 1. Adult brain electroporation as an approach for studying the relationship of ventricle-contacting ventricular zone (VZ) cells and the activated neural stem cell population.
(A) Anatomical organization and potential relationships between ventricle-contacting ependymal cells, B1 GFAP+ cells, and non–B1 GFAP+ cells (VZ compartment) and neurosphere-forming neural stem cells (SVZ compartment). (B) Table comparing key characteristics of these VZ cell types. (C, D, E, F, G) Electroporation to target ventricle contacting cells. (C) Experimental paradigm using hGFAPCreERT2-Tom mice. (D, E) Representative micrograph of Tomato+ cells following tamoxifen induction (D) or electroporation of hGFAP-driven Cre plasmid (E). Note that electroporated cells are only located adjacent to the ventricular surface. (F, G) Representative micrograph of ventricular (V)-SVZ neurosphere cultures 1 wk after tamoxifen induction (F) or electroporation of hGFAP-Cre plasmid (G). Both conditions contain small Fluorescent colonies (arrowheads) but full-sized fluorescent neurospheres are present only in cultures from the tamoxifen-injected mice. Circles outline non-fluorescent neurospheres. References: (a) Codega (2014), (b) Mirzadeh (2008), (c) Obernier (2018), (d) Shah (2018). (D, E, F, G) Scale bars represent 30 μm in (D, E) and 100 μm in (F, G).
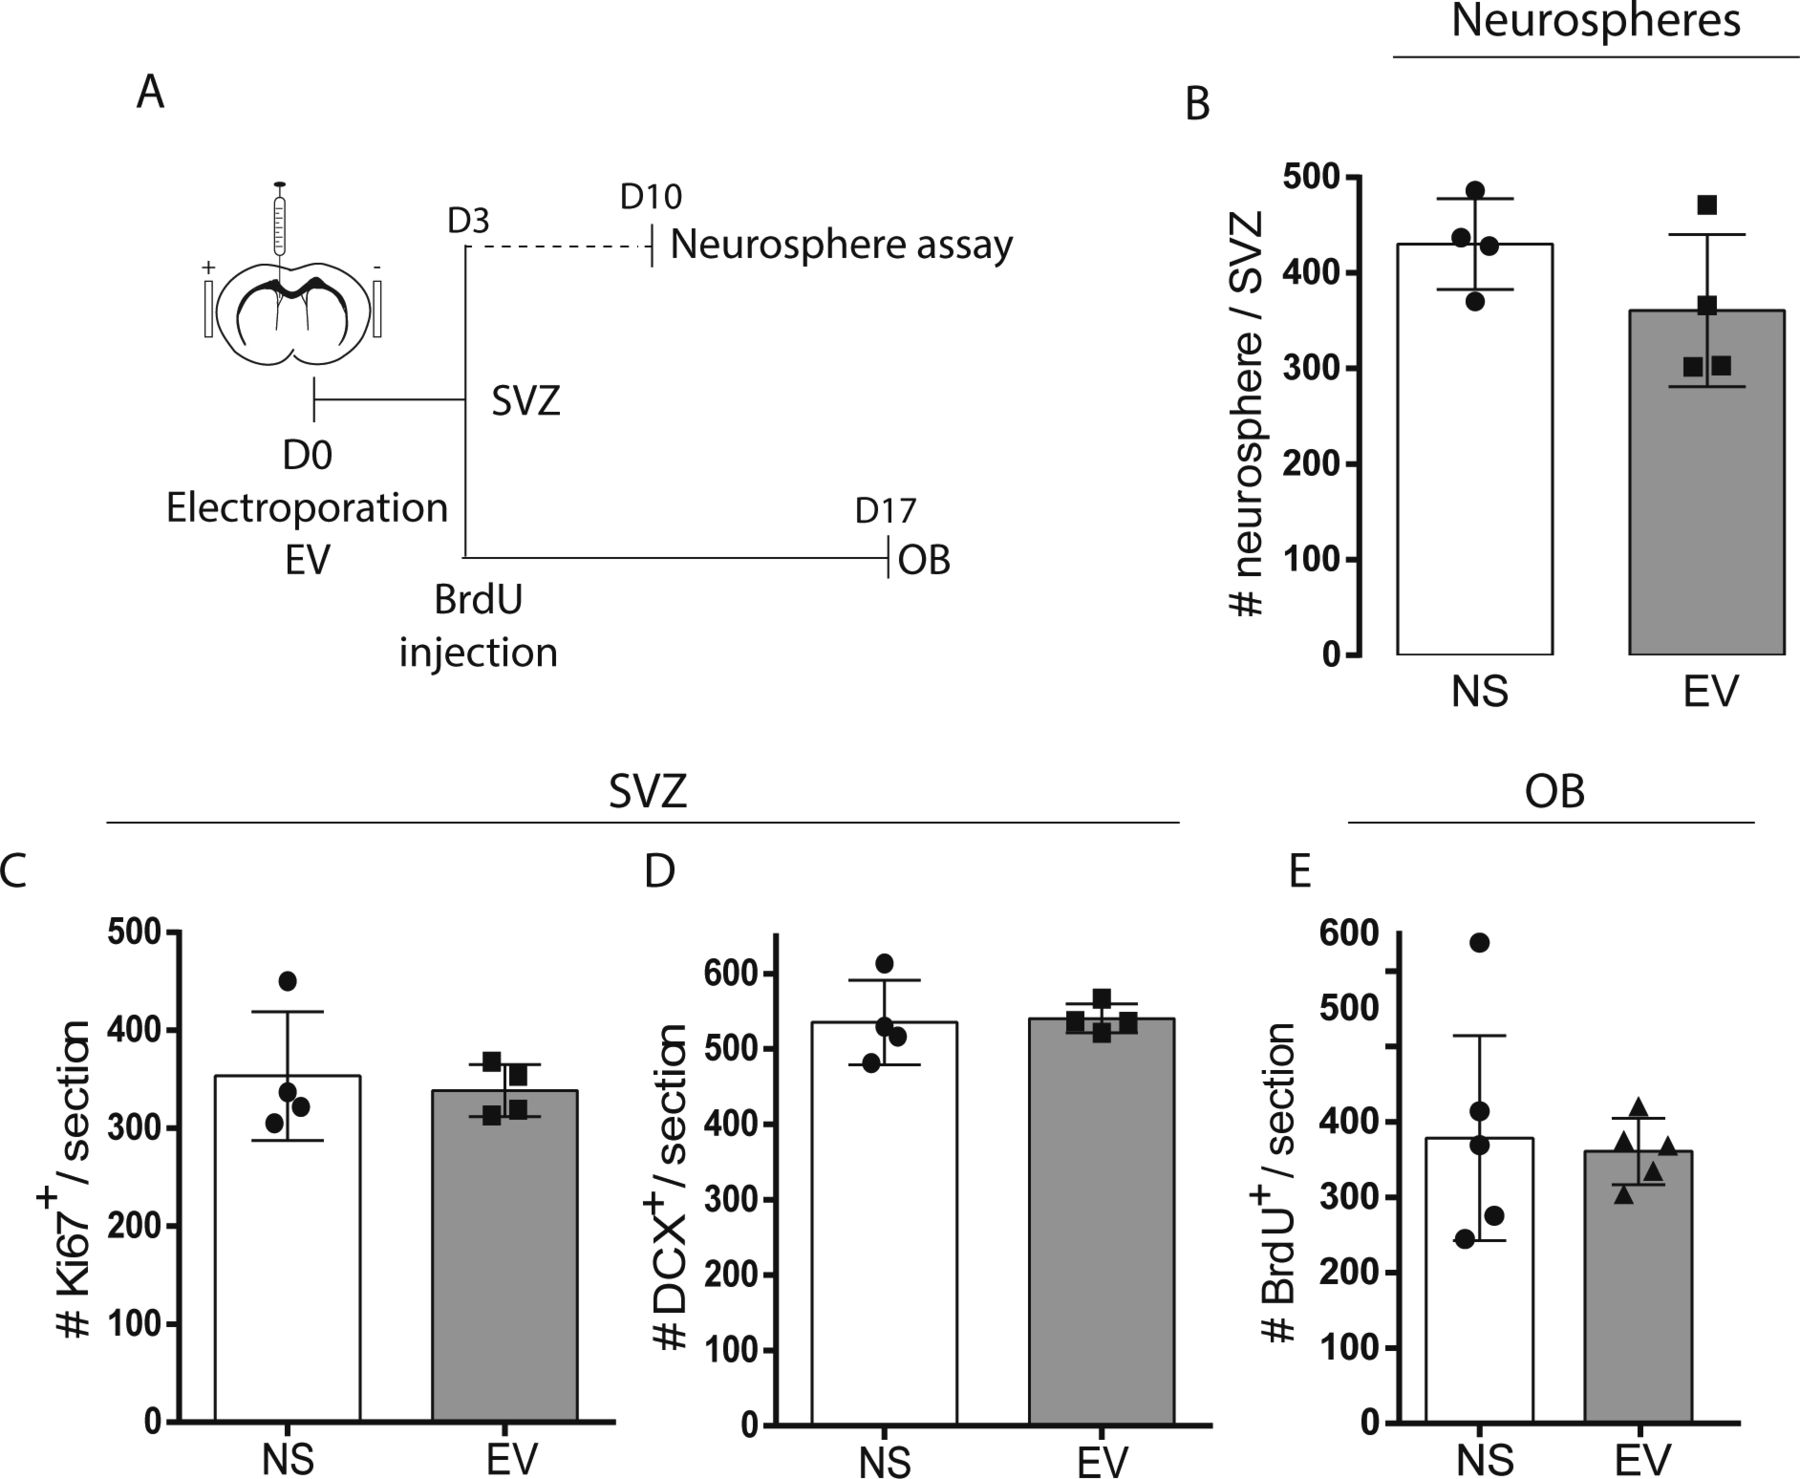
- Figure S1. Neurogenesis is maintained after electroporation. (A, B, C, D, E) Electroporation control experiments.
(A) Timelines of neurosphere, subventricular zone (SVZ), and OB analyses. (B) Neurosphere assays from no surgery (NS) and empty vector (EV) electroporated mice (n = 4/group, unpaired t test). (C, D, E) Total Ki67+ proliferating cells (C) and DCX+ neuroblasts (D) in the ventricular (V)-SVZ at 3 d post-surgery (n = 4/group, unpaired t test). (E) Total BrdU+ cells in the OB at 17 d post-surgery (n = 5/group, unpaired t test).
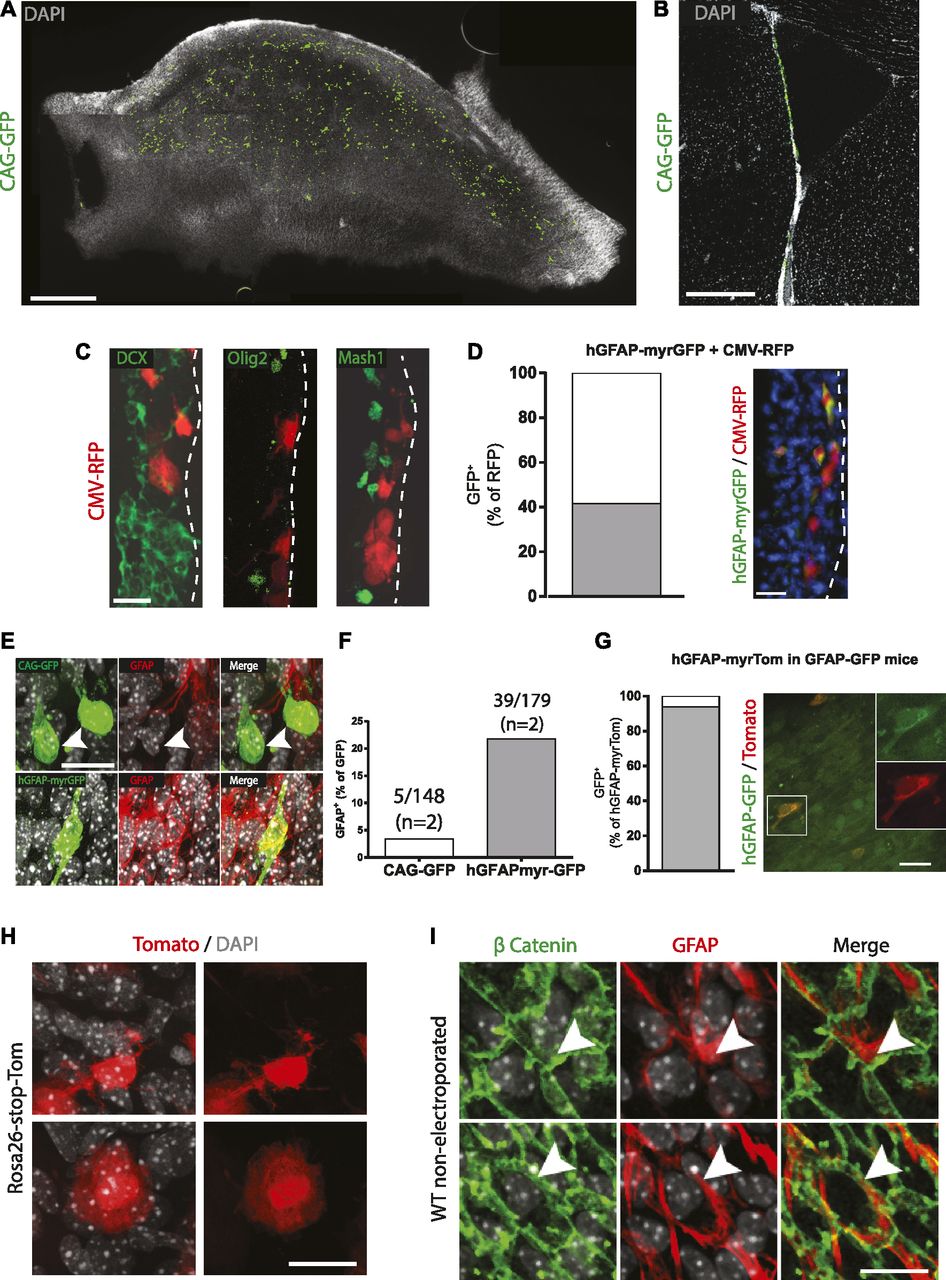
- Figure 2. Characteristics of ventricle-contacting ventricular zone cells targeted by adult brain electroporation.
(A, B, C) Adult brain electroporation using plasmids driven by non–cell-specific CMV regulatory elements. (A, B) Distribution of electroporated cells within the ventricular–subventricular zone are shown on a (A) whole-mount and (B) coronal section. (C) Immunostaining of electroporated cells after 3 d showing no co-localization with sub-ependymal DCX-, Olig2-, or Mash1-positive cells (n = 5). (D, E, F, G, H, I) Electroporation using reporter plasmids driven by the hGFAP promoter. (D) Co-electroporation of hGFAP-myrGFP with CMV-RFP plasmids. Quantification of the RFP+ cells expressing GFP and micrograph of a coronal section. (E) Immunostaining of WT mice electroporated with CAG-GFP (GFAP negative, arrowhead, upper panels) or hGFAP-myrGFP (GFAP positive, lower panels) plasmids in WT mice. (F) Quantification of GFP+ cells unambiguously expressing high levels GFAP protein. (G) Electroporation of hGFAP-myrTom plasmids in hGFAP::GFP transgenic mice. Quantification of Tomato+ cells expressing GFP and micrograph of a whole-mount. (H) Representative images of the two morphologies of cells electroporated with hGFAP-driven plasmid: B1-like cells with small cell bodies and extensions toward the ventricular surface (upper panels) and non-B1 cells having larger cell bodies located directly at the ventricular surface (lower panels). (I) Micrographs of a ventricular–subventricular zone whole-mount from a non-electroporated animal, stained with β catenin and GFAP, also showing the presence of B1 and non–B1 GFAP+ cells (arrowheads in the upper and lower panels, respectively). (A, B, C, D, E, G, H, I) Scale bars represent 500 μm in (A), 250 μm in (B), 25 μm in (C, D, E), 20 μm in (G) and 15 μm in (H, I).
- Figure 3. Neurogenic properties of ventricle-contacting GFAP+ cells genetically targeted by adult brain electroporation.
(A, B, C, D) hGFAP-Cre–mediated recombination model. (A) Paradigm. 3-mo-old Rosa26-stop-EYFP reporter mice were electroporated with 5 μg hGFAP-myrTom and 5 μg hGFAP-Cre plasmids and analyzed after 3 or 7 d. (B) Quantification of the proportion of YFP+ cells that expressed Tom. Note that Cre-induced recombination of YFP expression occurred in the vast majority of Tom+ cells by 3 d and virtually all Tom+ cells by 7 d. (C, D) After analysis at 28 d post-electroporation, representative micrographs of recombined cells that incorporated EdU (arrowhead) (C) or expressed the neuroblast marker DCX (arrowhead) (D) in the ventricular–subventricular zone (V-SVZ). (E, F, G, H) Time-course of neurogenesis by recombined cells up to 72 weeks post-electroporation of hGFAP-Cre plasmids in 3-mo-old ROSA-stop-EYFP reporter mice. (E) YFP+ cells after 1 (n = 3), 4 (n = 4), 8 (n = 5), 12 (n = 5), 16 (n = 4), 21 (n = 5), or 72 (n = 5) weeks post-electroporation. (F) YFP+DCX+ neuroblasts in terms of percentage of YFP+ cells (y1-axis) and estimated total numbers (y2-axis). (G, H) In the OB, (G) micrograph and (H) quantification of YFP+ cells at the 4-, 12-, 21-, and 72-wk time points. Age, age at sacrifice (months); WPE, weeks post-electroporation. One-way ANOVA, Tukey’s multiple comparisons test. (C, D, G) Scale bars represent 30 μm in (C, D, G). *P ≤ 0.05 **P ≤ 0.01.
- Figure S2. Dorso-ventral distribution of recombined YFP+ cells. (A, B) Dorsoventral distribution of YFP+ cells 4 wk post electroporation.
(A) Representation of YFP+ cells distribution (n = 4, 6 sections/n) along the lateral ventricle and their quantification (B), the animal with a high number of YFP+ cells/section is represented in red on the graph in (B). (C, D) Dorsoventral distribution of YFP+ cells 12 wk post electroporation. (C, D) Representation of YFP+ cells distribution (n = 5, 6 sections/n) along the lateral ventricle and their quantification (D), the animal with a high number of YFP+ cells/section is represented in red on the graph in (D).
- Figure 4. Electroporated ventricular zone (VZ) cells do not produce neurosphere-forming activated neural stem cells in vitro or in vivo.
(A) Paradigms. 3-mo-old ROSA-stop-EYFP reporter mice were electroporated with Cre-expressing plasmids and traced in vivo for short-term or long-term periods (1 or 8 wk, respectively) before conducting neurosphere-forming assays. (B) No recombined neurospheres were generated, regardless of whether lineage-traced in vivo for 1- or 8-wk and electroporated with Nestin-Cre, hGFAP-Cre, or CAG-Cre plasmids. (C) For the passaging experiment, ventricular–subventricular zone (V-SVZ) cultures were generated 1-wk after electroporation with hGFAP-Cre plasmid, re-fed with EGF-containing condition, and passaged after 2 wk in vitro. Fluorescent colonies were lost upon passaging, and fluorescent neurospheres were not generated. (D) Cells that recombined after hGFAP-Cre electroporation only formed small YFP+ colonies (left, arrows), which disappeared over time, regardless of growth factor combination used (right) (n = 3 per condition). Circles outline non-fluorescent neurospheres. (D) Scale bars represent 100 μm in (D).
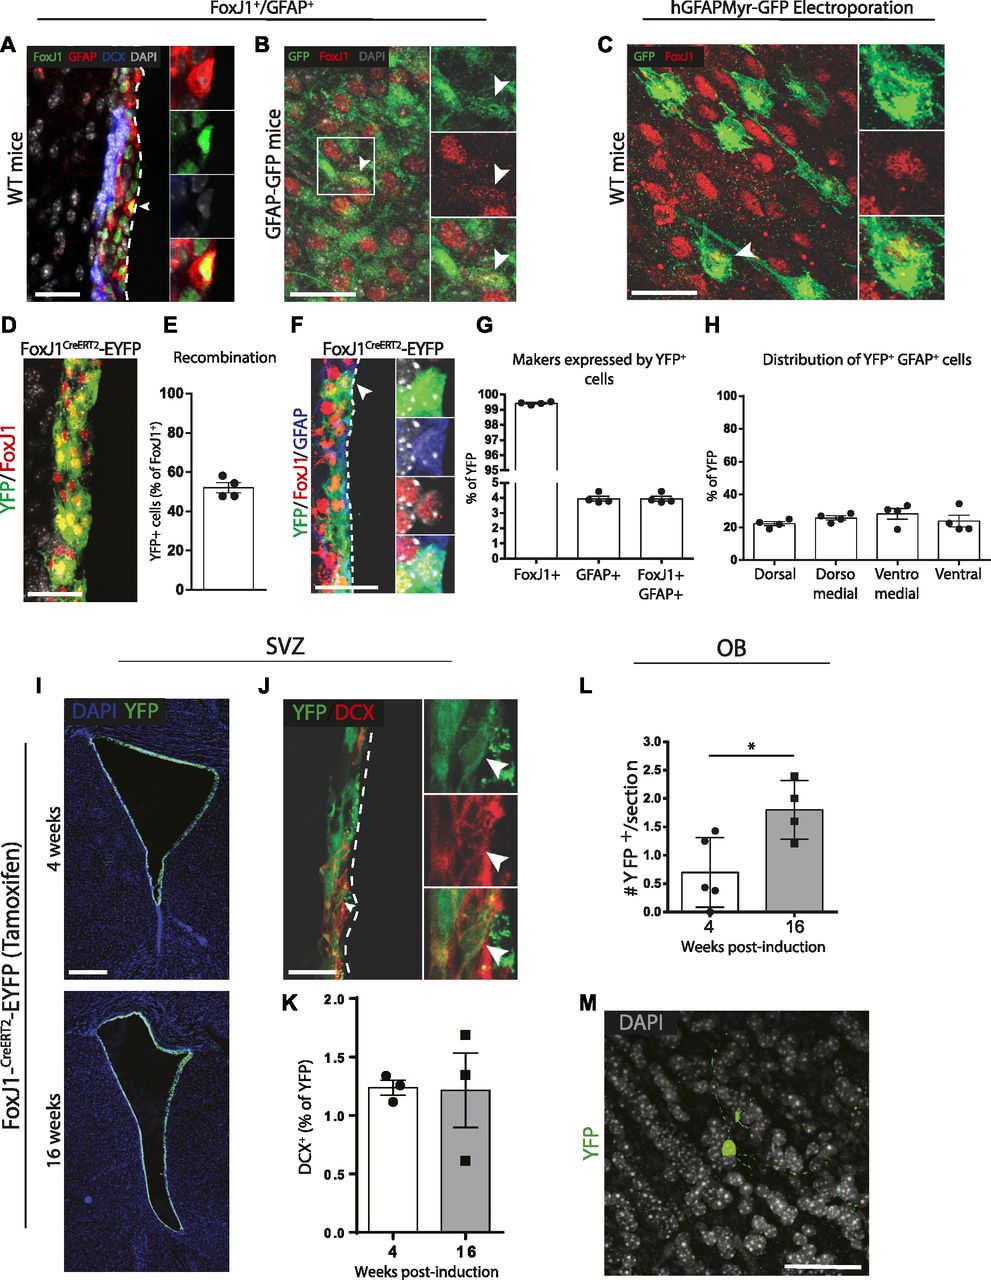
- Figure 5. The adult FoxJ1+ population contains neurogenic cells.
(A, B, C) FoxJ1+GFAP+ cells are present in the ventricular zone (VZ). (A) In WT mice, FoxJ1 protein is detectable in some cells expressing GFAP protein (arrowhead). (B) In ventricular–subventricular zone (V-SVZ) whole-mounts of GFAP-GFP transgenic mice, a subpopulation of GFP+ cells expresses low levels of FoxJ1 protein (arrowhead). (C) After electroporation with GFAP-myrGFP, a subset of GFP+ cells at the ventricular surface of whole-mounts express FoxJ1 protein (arrowhead). (D, E, F, G, H, I, J, K, L, M) In vivo neurogenesis by FoxJ1+ cells. Young adult FoxJ1CreERT2-EYFP compound transgenic mice were administered tamoxifen for 1 wk and euthanized after 4 or 16 wk (n = 3/group). (D) Representative micrograph showing YFP is recombined in a large portion of FoxJ1-expressing cells. (E) Quantification of recombination in the FoxJ1-expressing population. (F) Representative micrograph of an YFP+ cell that expresses GFAP and FoxJ1 proteins (arrowhead). (G) Quantification of GFAP and FoxJ1 expression in the YFP+ population. (H) Dorsoventral distribution of YFP+ cells that are FoxJ1+GFAP+. (I, J, K, L, M) Representative micrographs of (I) the recombined cells surrounding the lateral ventricles, (J) an YFP+DCX+ neuroblast (arrowhead), and (K) quantification of the YFP+DCX+ neuroblasts. (L, M) In the OB, (L) quantification of the numbers of YFP+ cells and (M) a representative micrograph. (A, B, C, D, F, M, J, I) Scale bars represent 25 μm in (A, B, C, D, F, M), 35 μm in (J), and 200 μm in (I). *P ≤ 0.05, unpaired t tests.
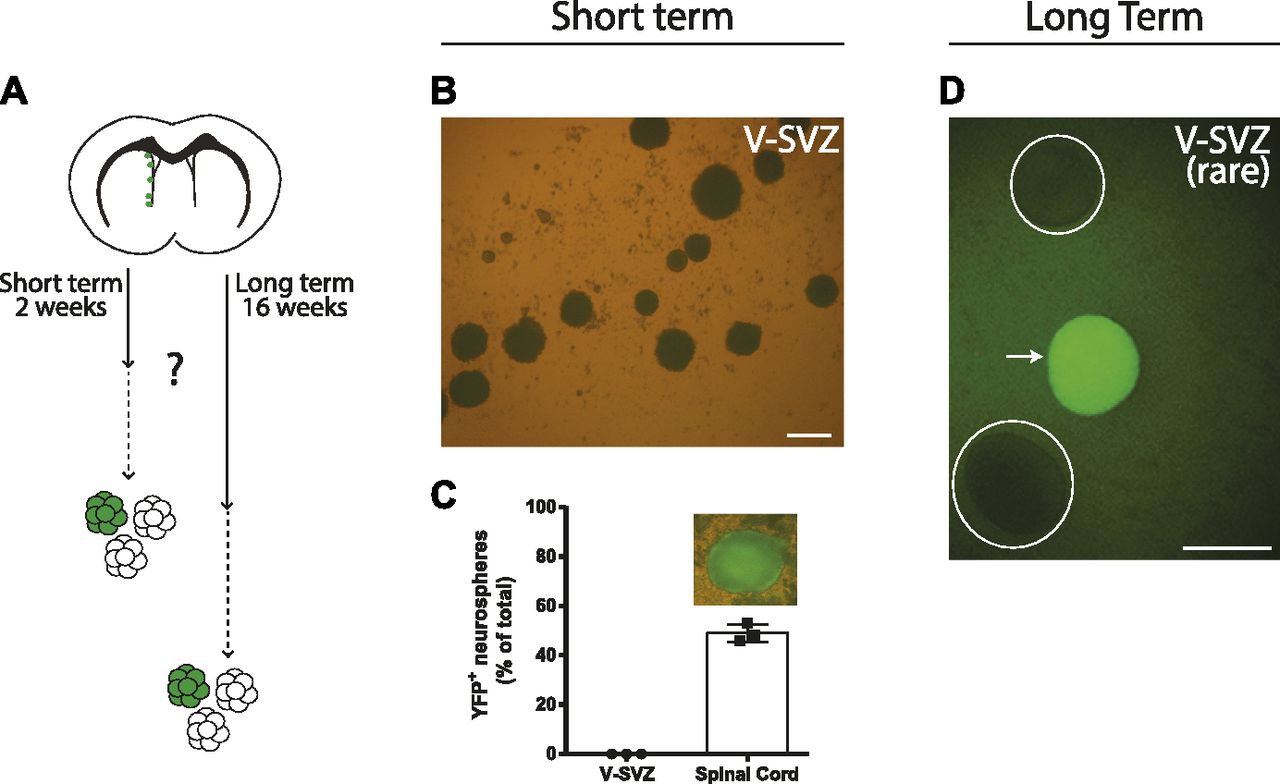
- Figure 6. Neurogenic FoxJ1+ cells are not neurosphere-forming activated neural stem cells.
(A, B, C, D) FoxJ1+ cells in the ventricular–subventricular zone (V-SVZ) are not a significant source of neurosphere-forming neural stem cells. (A) Recombined cells in tamoxifen-treated FoxJ1CreERT2-EYFP mice were traced in vivo for short- or long-term periods before conducting neurosphere-forming assays, as indicated in (A). (B, C) In the short-term paradigm, (B) representative micrographs of neurospheres grown from the V-SVZ and spinal cord and (C) quantifications of the neurospheres that were YFP+. (D) In the long-term paradigm, (D) a micrograph of one of the extremely rare recombined neurospheres that was obtained from the V-SVZ after 4-mo of in vivo lineage-tracing (arrow). Circles outline non-fluorescent neurospheres. (B, D) Scale bars represent 100 μm in (B, D).
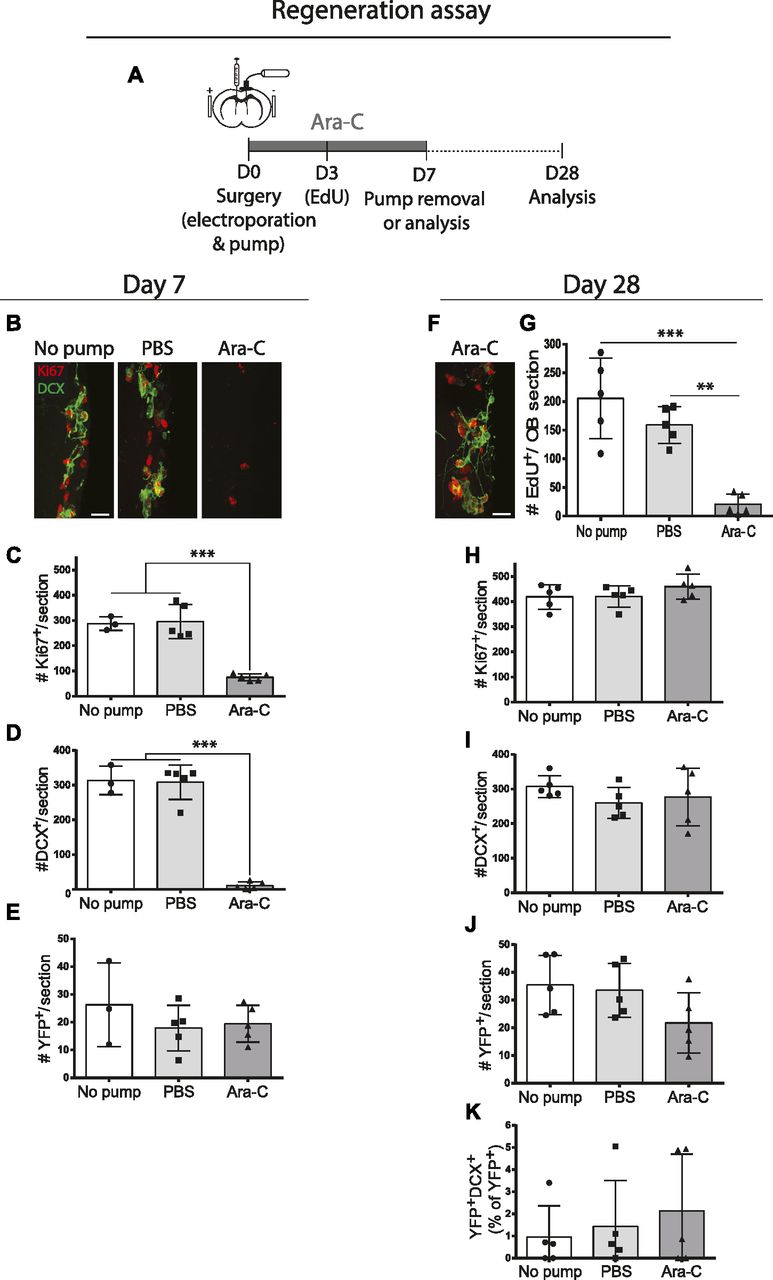
- Figure 7. hGFAP+ B1 cells are not recruited in the Ara-C model of ventricular–subventricular zone (V-SVZ) depletion and regeneration.
(A) Ara-C experimental paradigm after electroporation of hGFAP-Cre plasmids in 3-mo-old ROSA-stop-EYFP reporter mice. (B, C, D, E) Analysis at Day 7. (B) Immunostaining for Ki67 and DCX in the V-SVZ of no pump, PBS, and Ara-C mice. (C, D, E) Quantification of numbers of V-SVZ cells that were immunoreactive for (C) Ki67, (D) DCX, or (E) YFP. One-way ANOVA. (F, G, H, I, J, K) Analysis at Day 28. (F) Immunostaining for Ki67 and DCX in the V-SVZ of Ara-C mice. (G) Numbers of EdU+ cells in the OB, confirming that V-SVZ neurogenesis had been ablated in Ara-C mice. (H, I, J, K) Quantification of numbers of V-SVZ cells that were immunoreactive for (H) Ki67, (I) DCX or (J) YFP, and (K) the proportion of YFP+ cells expressing DCX (n = 5 per time point and per condition). One-way ANOVA. (B, F) Scale bar represents 20 μm in (B) and (F). *P ≤ 0.05 **P ≤ 0.01, ***P ≤ 0.001.
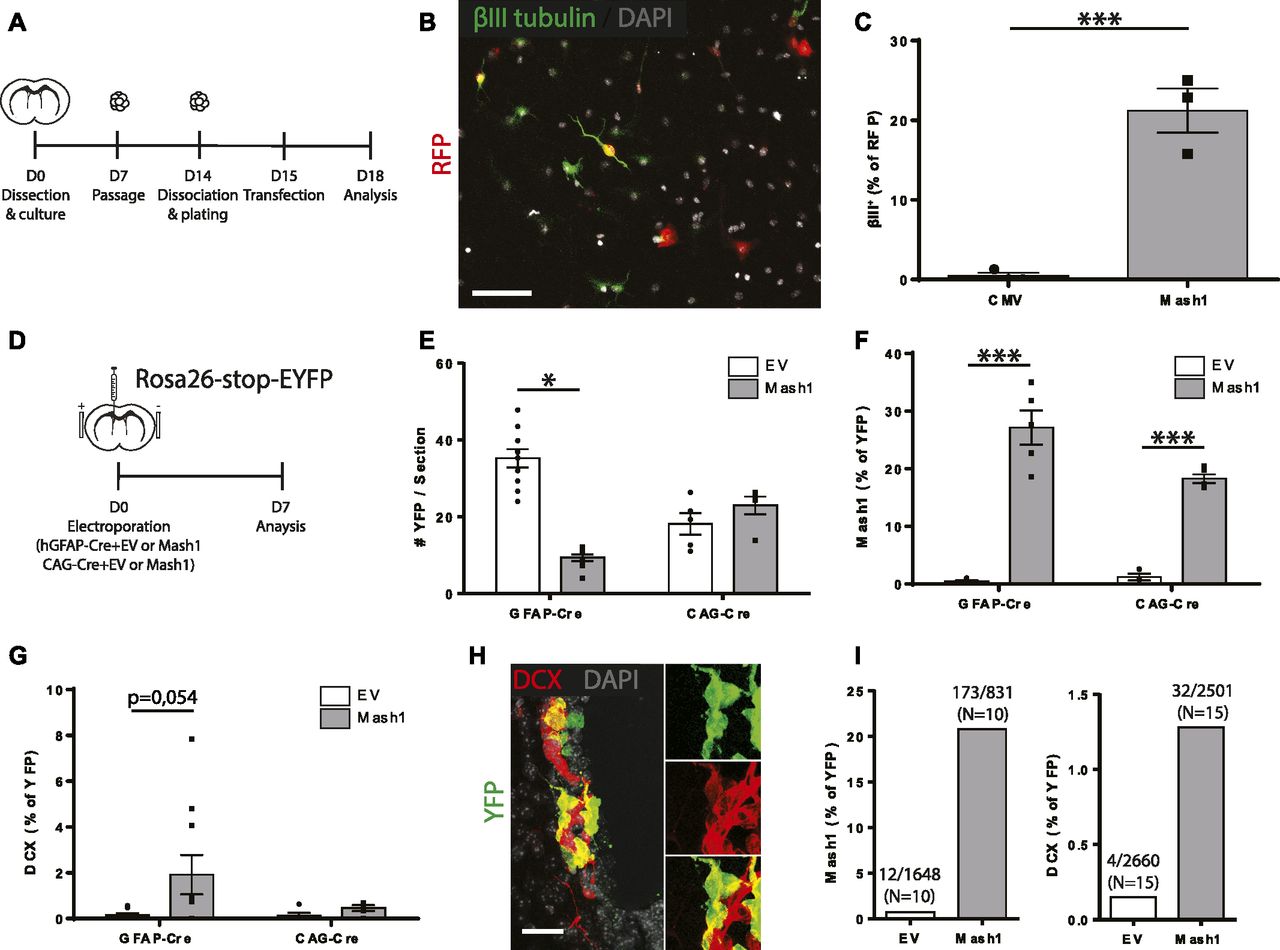
- Figure 8. Overexpression of Mash1 in electroporated GFAP+ ventricular zone cells.
(A, B, C) Co-transfection of neurosphere-derived stem/progenitor cells with RFP and empty vector or Mash1 plasmids in vitro. (A) Experimental paradigm. (B, C) Micrograph of transfected RFP+ cells expressing βIII tubulin and (C) quantification of RFP+ cells expressing βIII tubulin. Unpaired t test (n = 3/condition). (D, E, F, G, H, I, J) Co-electroporation of ventricular zone cells with CAG- (n = 5/condition) or GFAP-Cre (n = 10/condition) plasmids along with empty vector or Mash1 plasmids in vivo. (D) Experimental paradigm. (E, F, G) Quantifications of the number of YFP+ cells (E), YFP+Mash1+ cells (F) and YFP+DCX+ cells (G). (H) Micrograph of a representative YFP+DCX+ cluster, observed only with Mash1 overexpression. (I, J) Quantification of YFP+Mash1+ cells (I) and YFP+DCX+ cells (J), combined from both groups of electroporations. Note that Mash1 overexpression increases the expression of the neuroblast marker DCX in electroporated cells. Two-way ANOVA, Tukey’s multiple comparison post hoc test. (B, H) Scale bar in (B) represents 50 and 25 μm in (H). *P ≤ 0.05 **P ≤ 0.01, ***P ≤ 0.001.
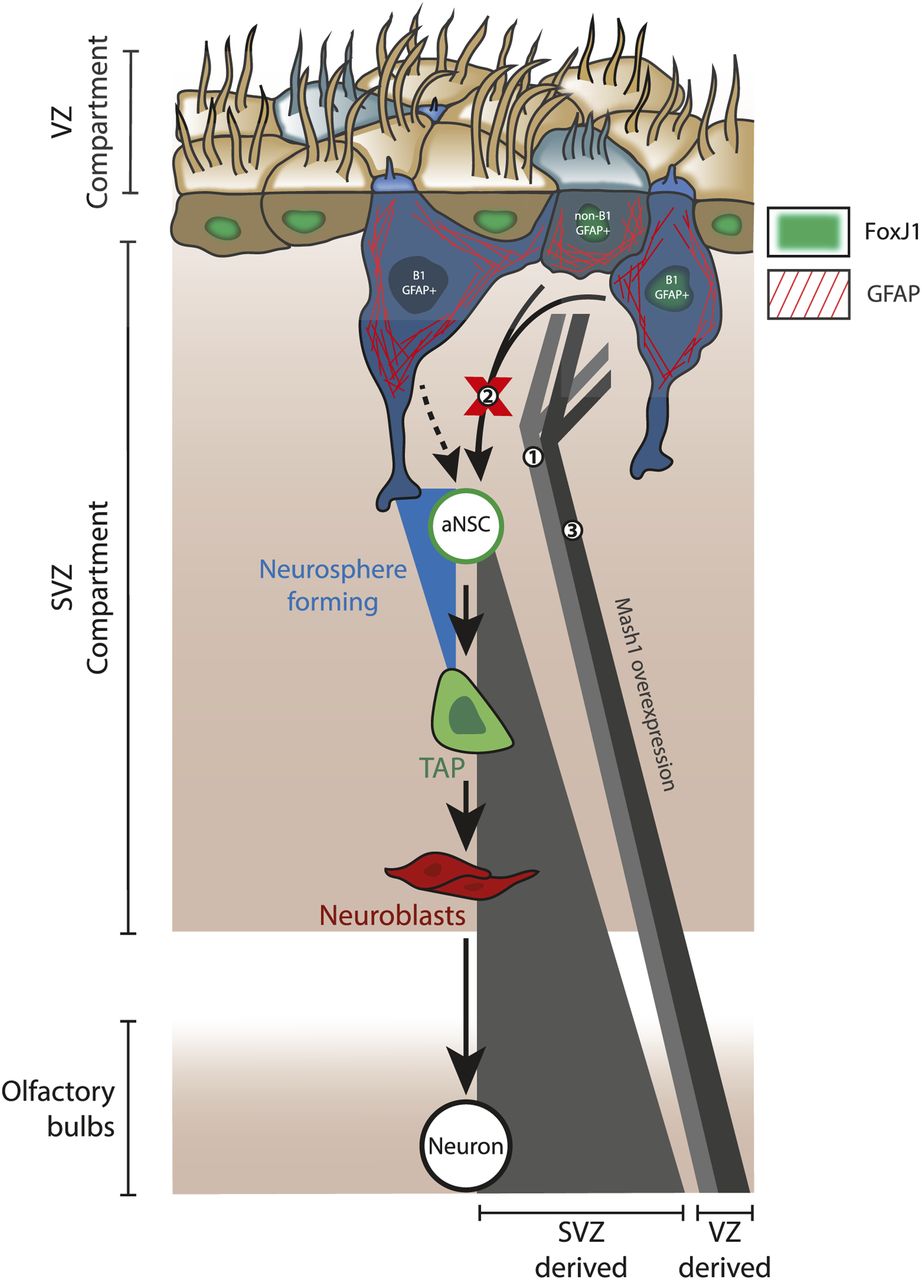
- Figure 9. Summary and proposed relationships between GFAP+ ventricular zone cells and neurogenesis in the adult ventricular–subventricular zone (V-SVZ) niche.
(A) Diagram summarizing main findings. Fate-mapping using hGFAP-driven plasmid electroporation and/or FoxJ1-driven transgenic approaches labeled a population of neurogenic ventricular zone cells that contributes small numbers of neurons to the olfactory bulbs during adulthood (1), yet they do not show evidence of acting via the neurosphere-forming neural stem cell pool (2). These data do not exclude the possible existence of B1 cells that can produce activated neural stem cells in vivo (dotted arrow) but indicate that such cells would be resistant to electroporation and FoxJ1-negative, and that such a capacity is not generalizable to the entire B1 population. Mash1 overexpression promotes a modest increase in neurogenesis by hGFAP-electroporated cells (3); it remains to be determined whether this originates with the B1 or non-B1 GFAP+ cells that are electroporated.
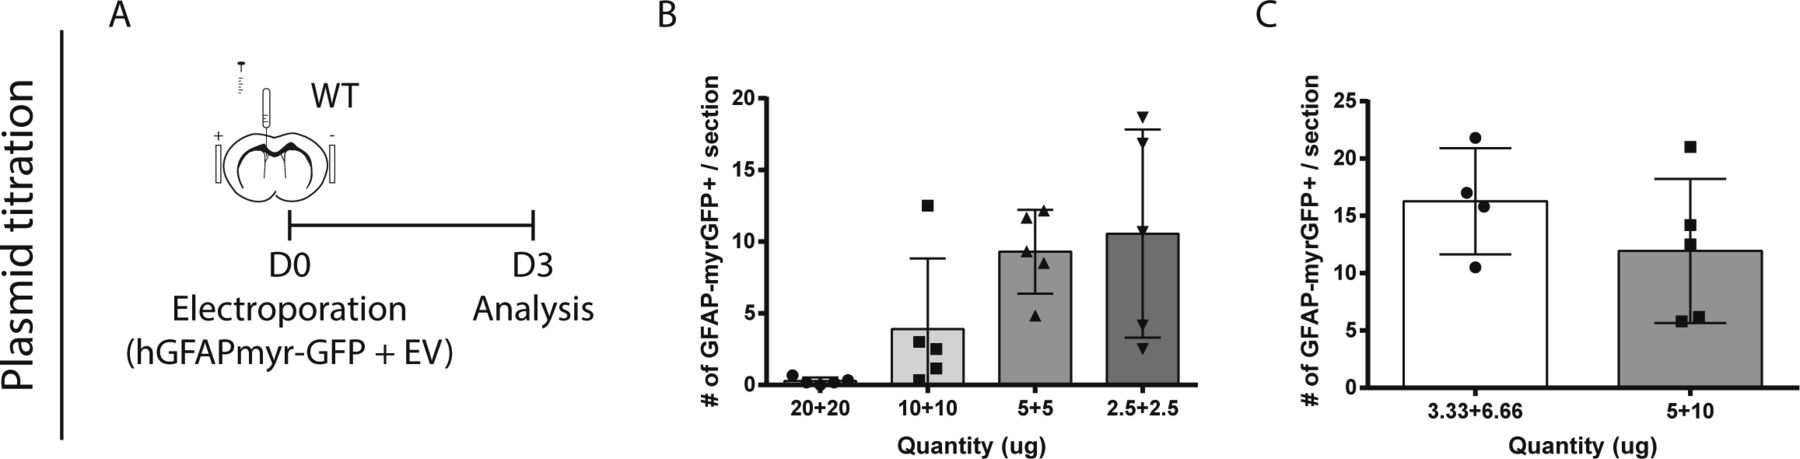
- Figure S3. Assessment of neurogenesis across the entire V-SVZ. (A, B, C) Plasmid titration tests.
(A) Paradigm. (B) Mice were electroporated after injection of 40, 20, 10, or 5 μg of total DNA, consisting of equal amounts of hGFAP-myrGFP and empty vector (EV) plasmids. (C) Mice were electroporated with either 10 μg total DNA (3.33 μg of hGFAP-myrGFP) or 15 μg total DNA (5 μg GFAP-myrGFP).
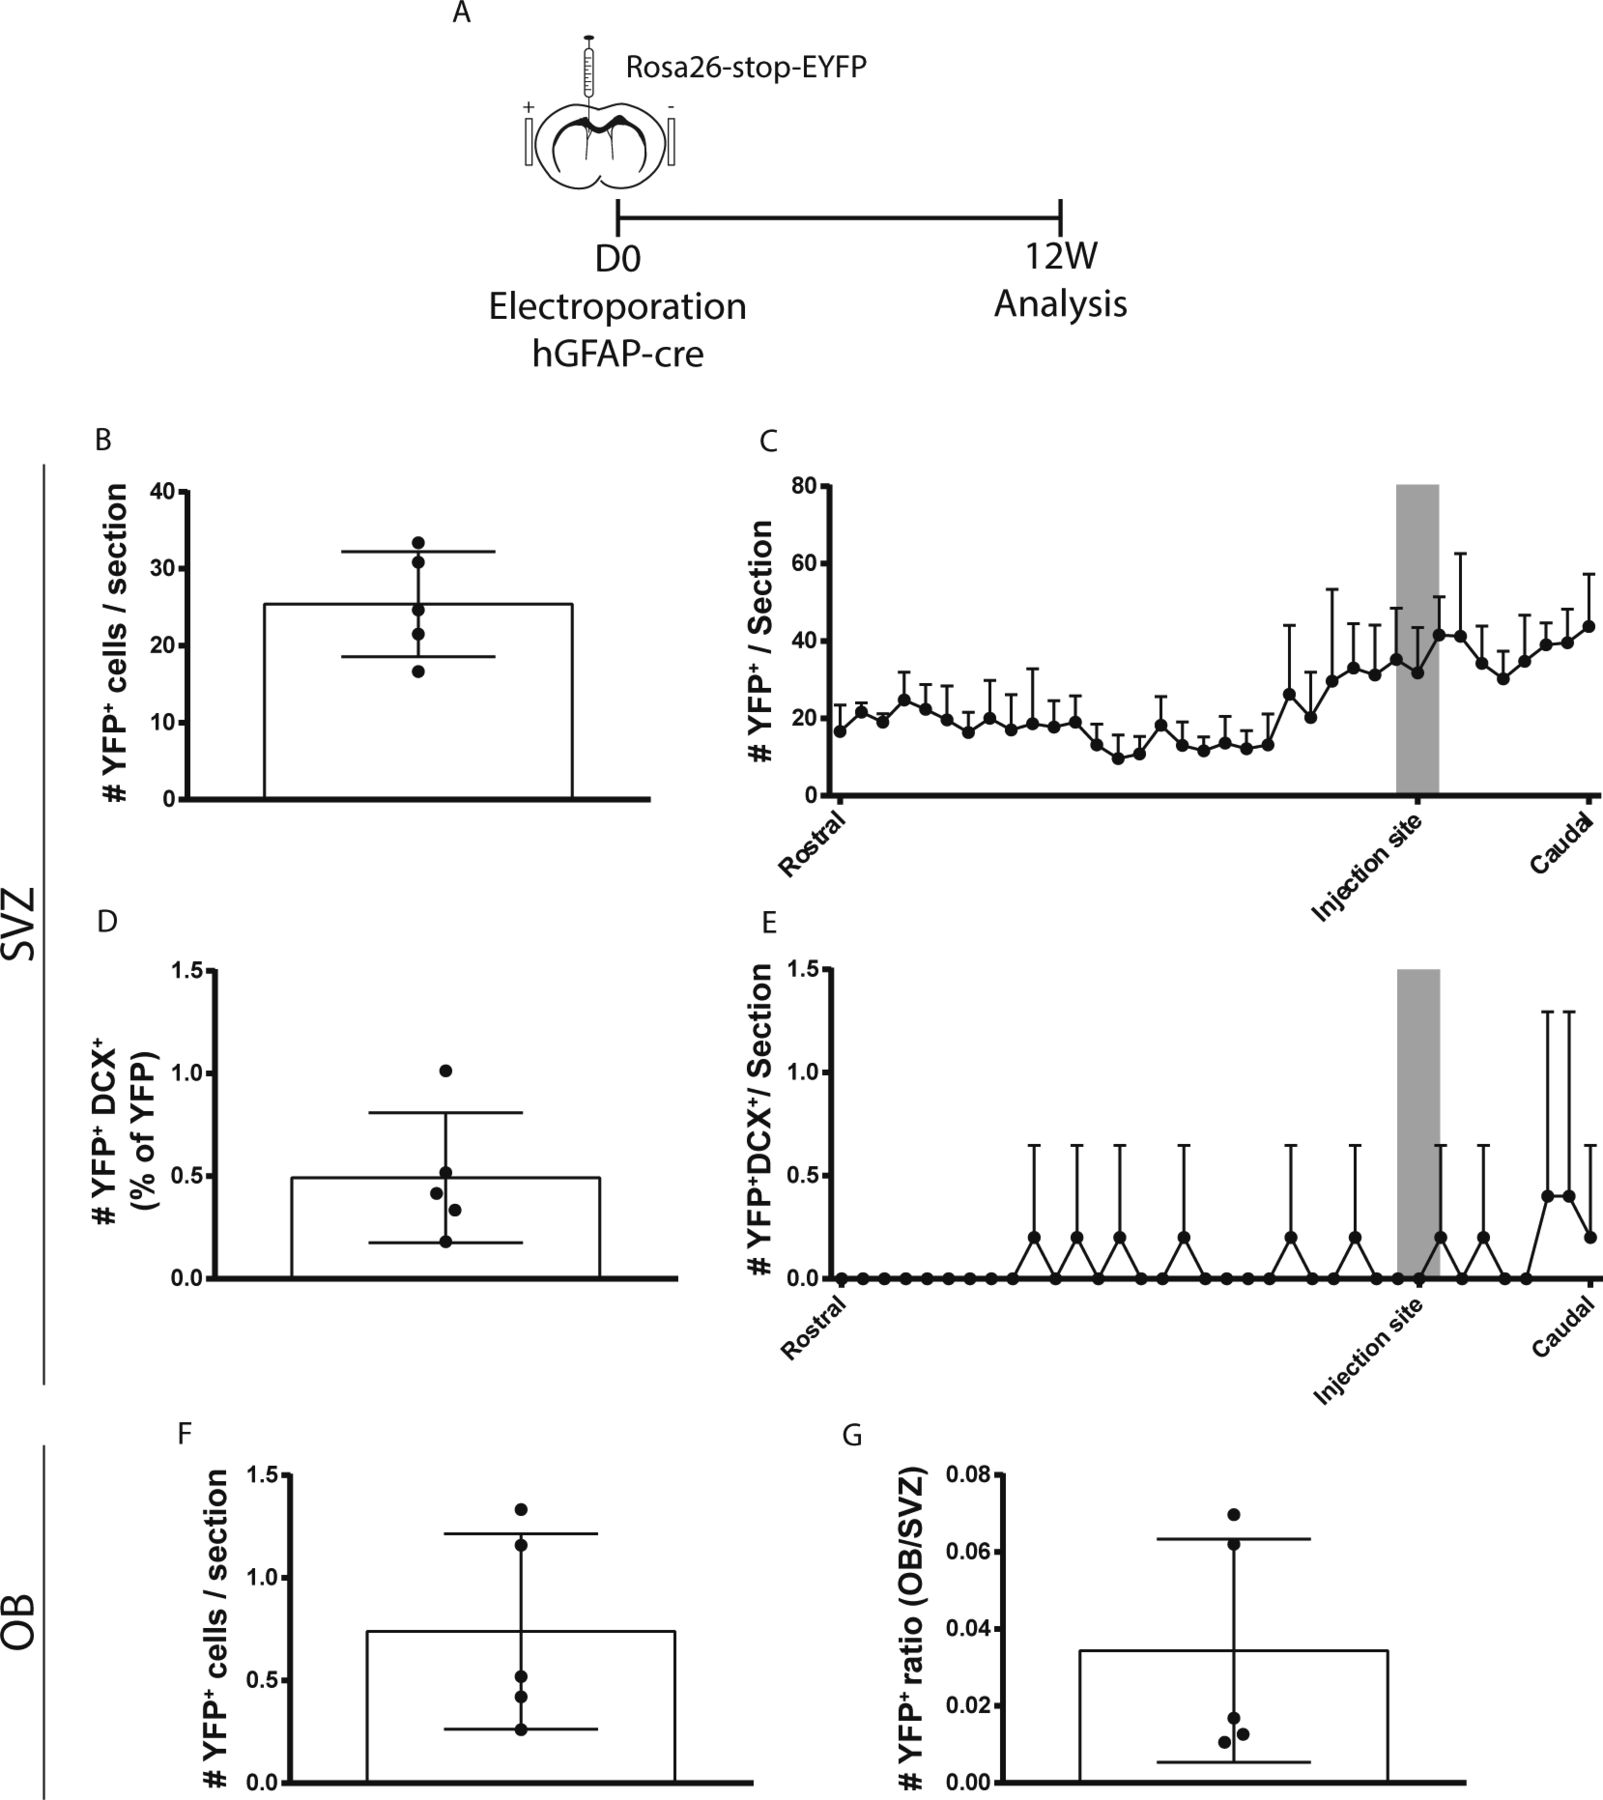
- Figure S4. Plasmid titration for in vivo electroporation. (A, B, C, D, E, F, G)
Neurogenesis assessment at 12 wk post-electroporation by counting the entire number of recombined cells across the complete ventricular–subventricular zone (V-SVZ) and OB. (A) Experimental paradigm. (B, C, D, E) In the V-SVZ, quantification of (B) YFP+ cells, (C) their distribution along the rostrocaudal axis (n = 5, 36 sections/n), and (D) YFP+DCX+ neuroblasts and (E) their distribution along the rostrocaudal axis (n = 5, 36 sections/n). (F, G) In the OB, quantification of (F) YFP+ cells, and (G) the OB/V-SVZ ratio of YFP+ cells (n = 5, 19–25 sections/n). Note that the results are consistent with quantifications made by quantifying every sixth section through the SVZ and every fifth section through the OB.


Tables
Name Regulatory elements Gene Company Gift of: CAG-Cre CAG Cre Addgene (# 13775) Connie Cepko hGFAP-Cre hGFAP Cre Addgene (# 40591) Albee Messing hGFAPmyrGFP hGFAP myrGFP Addgene (# 22672) Robert Benezra hGFAPmyrTomato hGFAP myrTomato Addgene (# 22671) Robert Benezra Mash1 CMV ASCL1 OriGene (RC201123) N/A Name Specie Company Dilution BrdU Rat AbDSerotec 1:800 DCX Guinea Pig Chemicon 1:3,000 DCX Goat Santa Cruz Biotech 1:250 FoxJ1 Mouse Sigma-Aldrich 1:250 GFP Chicken Aves Lab 1:2,000 GFAP Chicken Novus Biologicals 1:1,000 GFAP Rabbit Dako Diagnostic 1:500 GFAP Mouse Chemicon 1:1,000 Ki67 Mouse BD Biosciences 1:100 Mash1 Mouse BD Biosciences 1:50 Olig2 Rabbit Chemicon 1: 250 S100B Mouse/Rabbit Sigma-Aldrich 1:1,000 Sox2 Rabbit Chemicon 1:1,000 βIII tubulin Mouse Covance 1:200 Secondary Ab (Alexa) Goat, Donkey Invitrogen 1:1,000


In this Issue
Subjects
Related Articles
Cited By...
- No citing articles found.