


Article Figures & Data
Figures
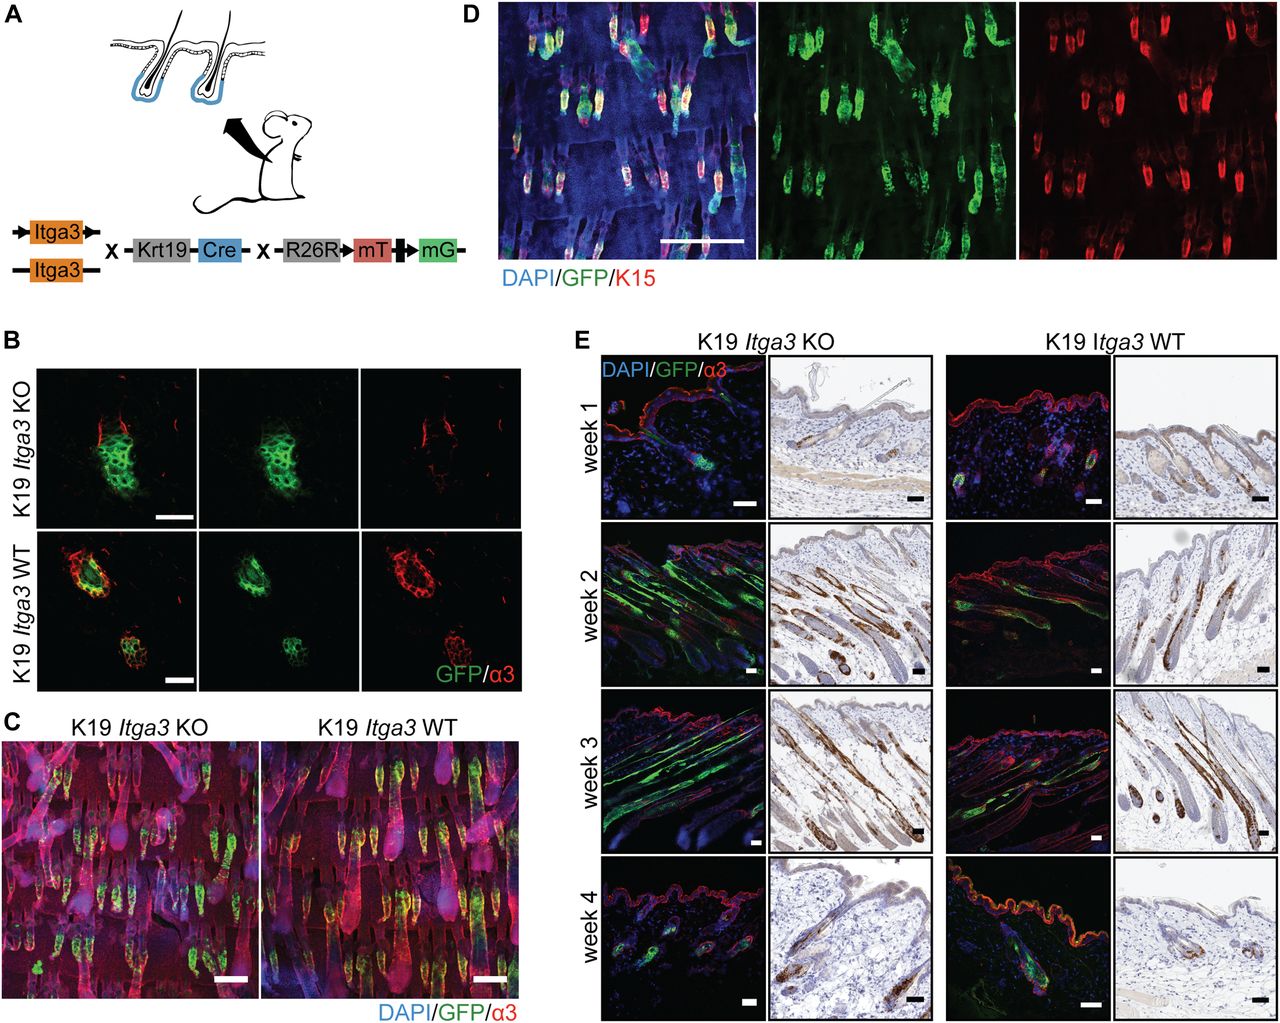
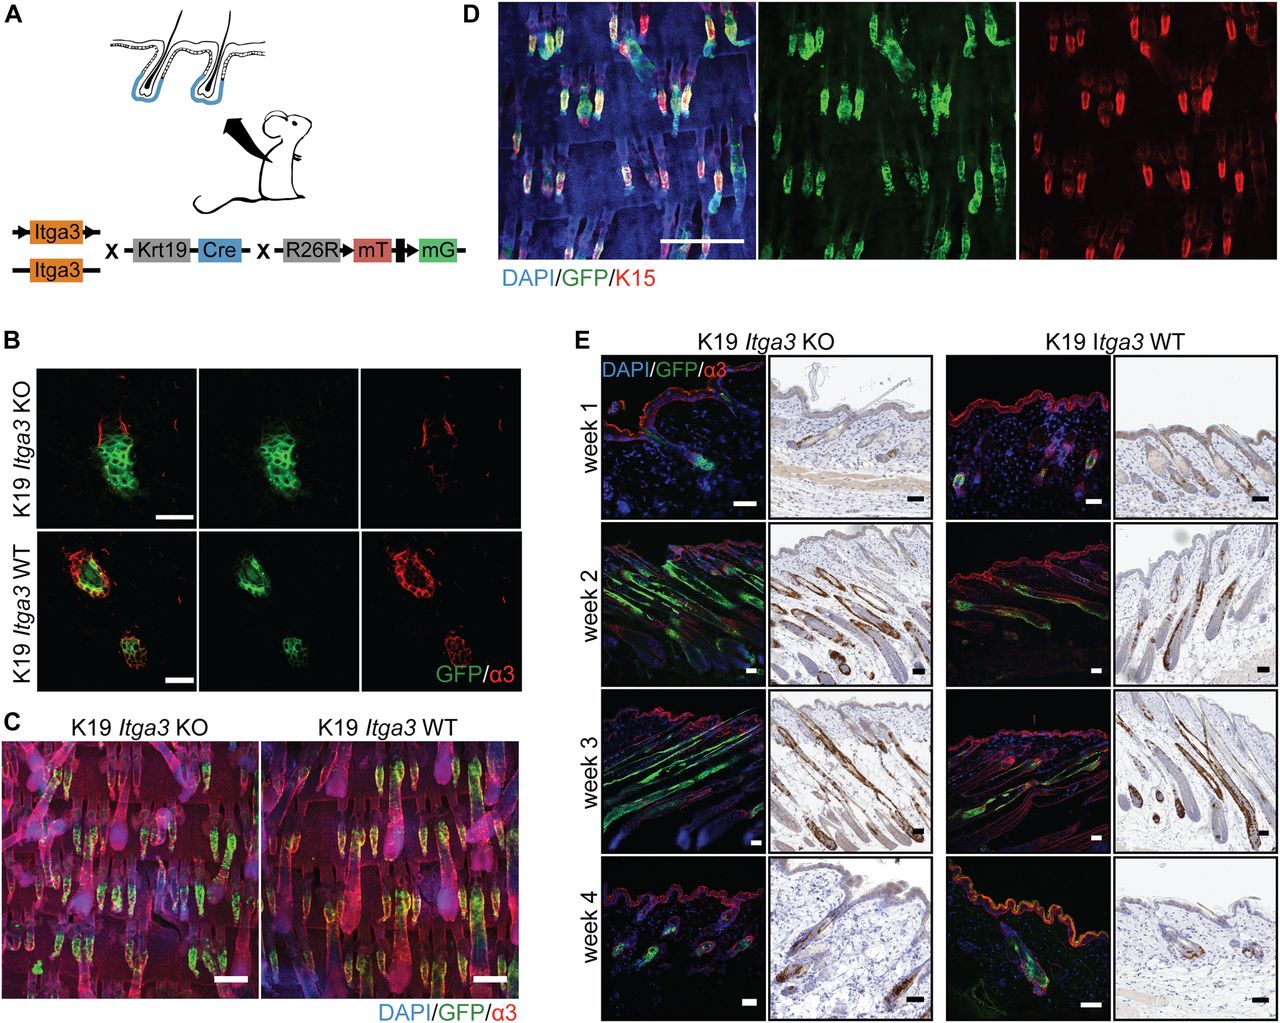
- Figure 1. HB keratinocytes lacking integrin α3β1 stay confined within their niche and contribute normally to hair cycle.
(A) Overview of the K19 Itga3 KO and WT mouse models. (B) Integrin α3β1 is expressed in Cre-induced GFP-positive keratinocytes of K19 Itga3 WT mice and efficiently deleted in GFP-positive keratinocytes of 7-wk-old K19 Itga3 KO mice 1 wk after tamoxifen treatment (back skin, scale bar: 30 μm). (C) Linage tracing of GFP-positive HB keratinocytes showing localization within their niche in K19 Itga3 KO and WT mice 1 wk after tamoxifen treatment (whole mounts of tail epidermis, scale bar: 200 μm). Linage tracing of up to 4 wk can be found in Fig S1B. (D) Whole mount of tail epidermis of K19 Itga3 WT mouse showing co-localization of Cre-induced GFP-positive cells and K15 marker in HBs (scale bar: 500 μm). (E) Linage tracing of GFP-positive HB SCs Cre-induced in telogen (P21) and followed for up to 4 wk over whole hair cycle (until P49) in the back skin of K19 Itga3 KO and WT mice. Representative images of two to three mice per condition are shown (scale bar: 50 μm).
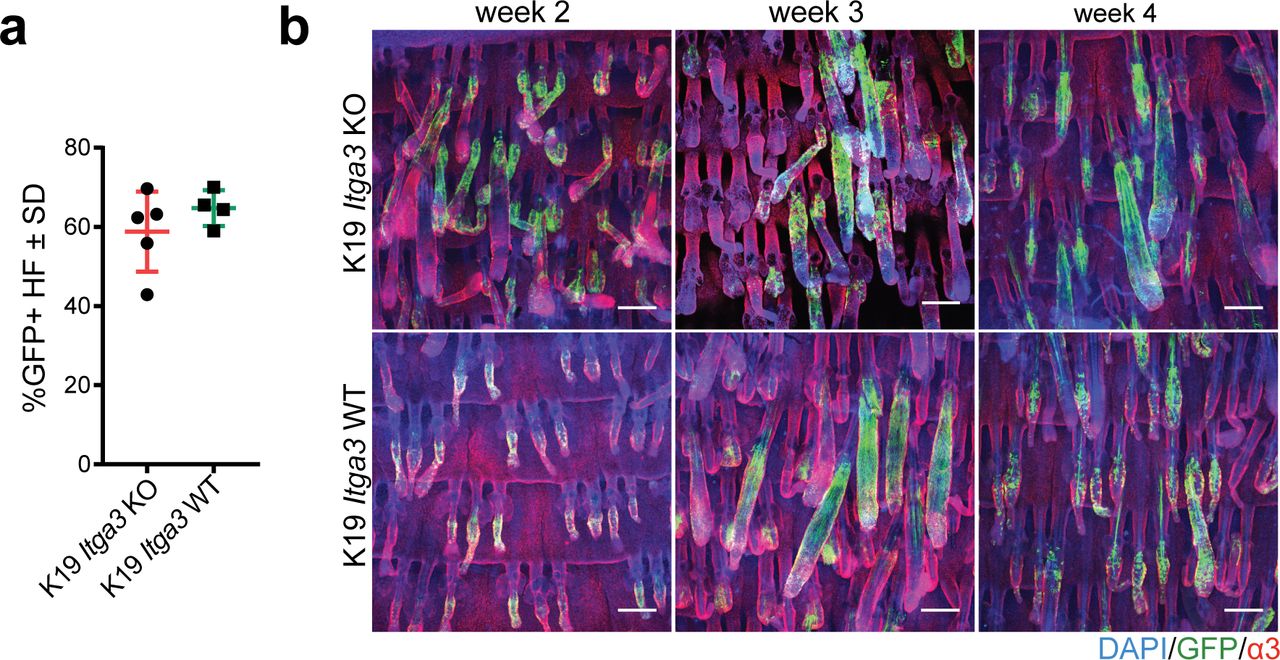
- Figure S1. HB keratinocytes lacking integrin α3β1 stay confined within their niche.
(A) Quantification of the percentage of GFP-positive HFs in the back skin of 7-wk-old K19 Itga3 KO and WT mice 1 wk after tamoxifen treatment. Each dot represents a mouse (mean ± SD, unpaired t test). (B) Linage tracing of GFP-positive HB keratinocytes in K19 Itga3 KO and WT mice at up to 4 wk after tamoxifen treatment (whole mounts of tail epidermis, scale bar: 200 μm).
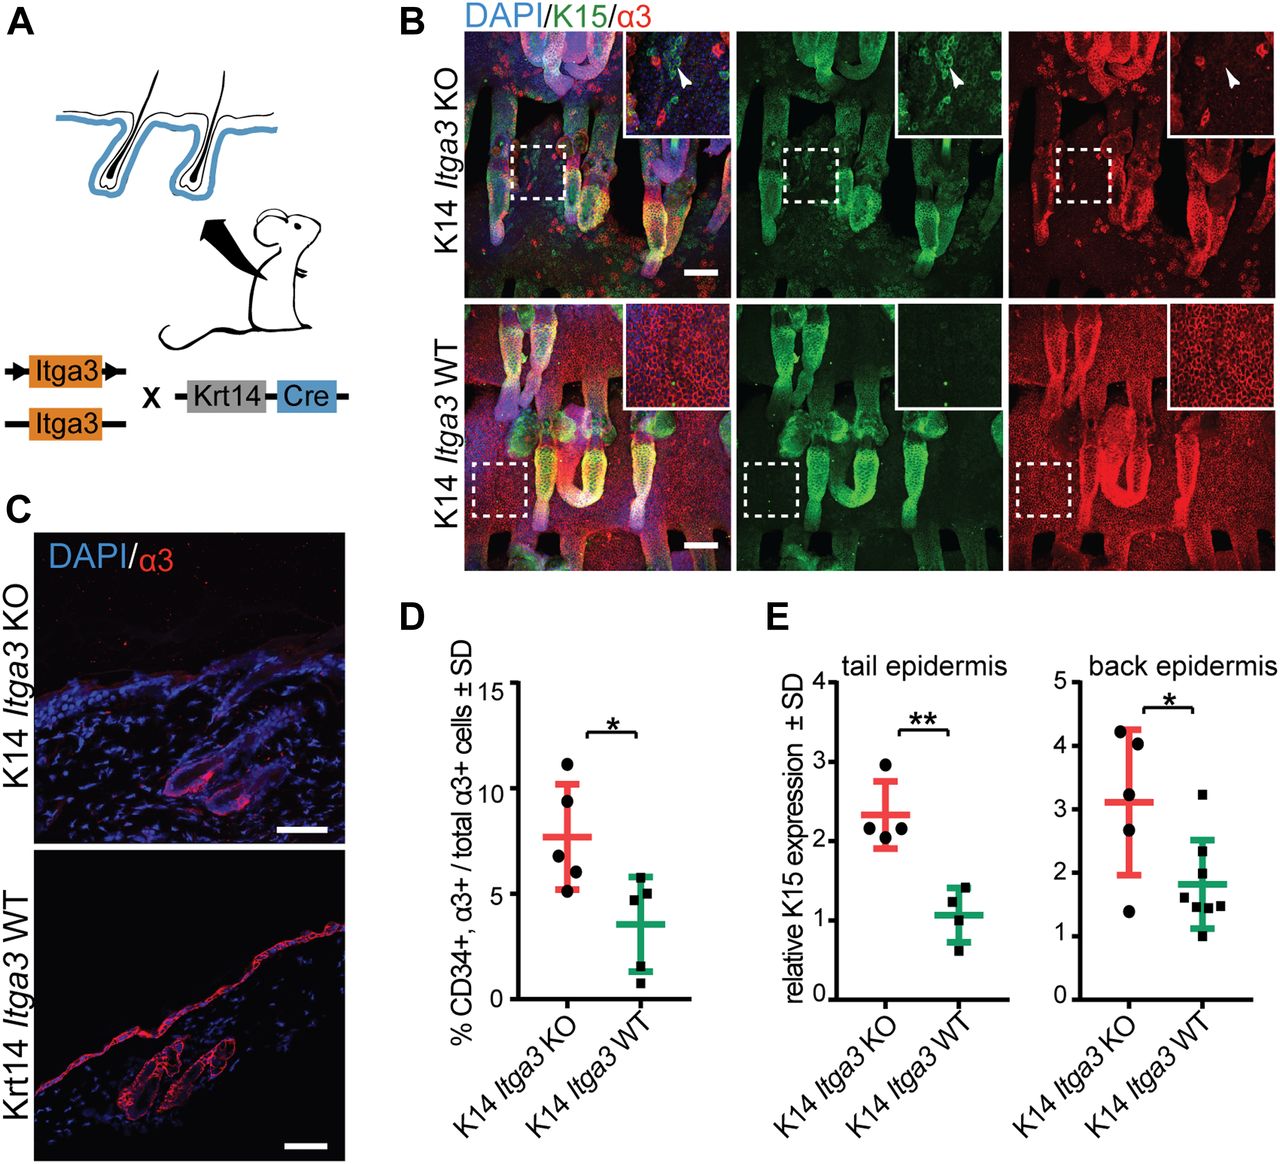
- Figure 2. Epidermal deletion of α3β1 causes de novo expression of K15 outside of HBs.
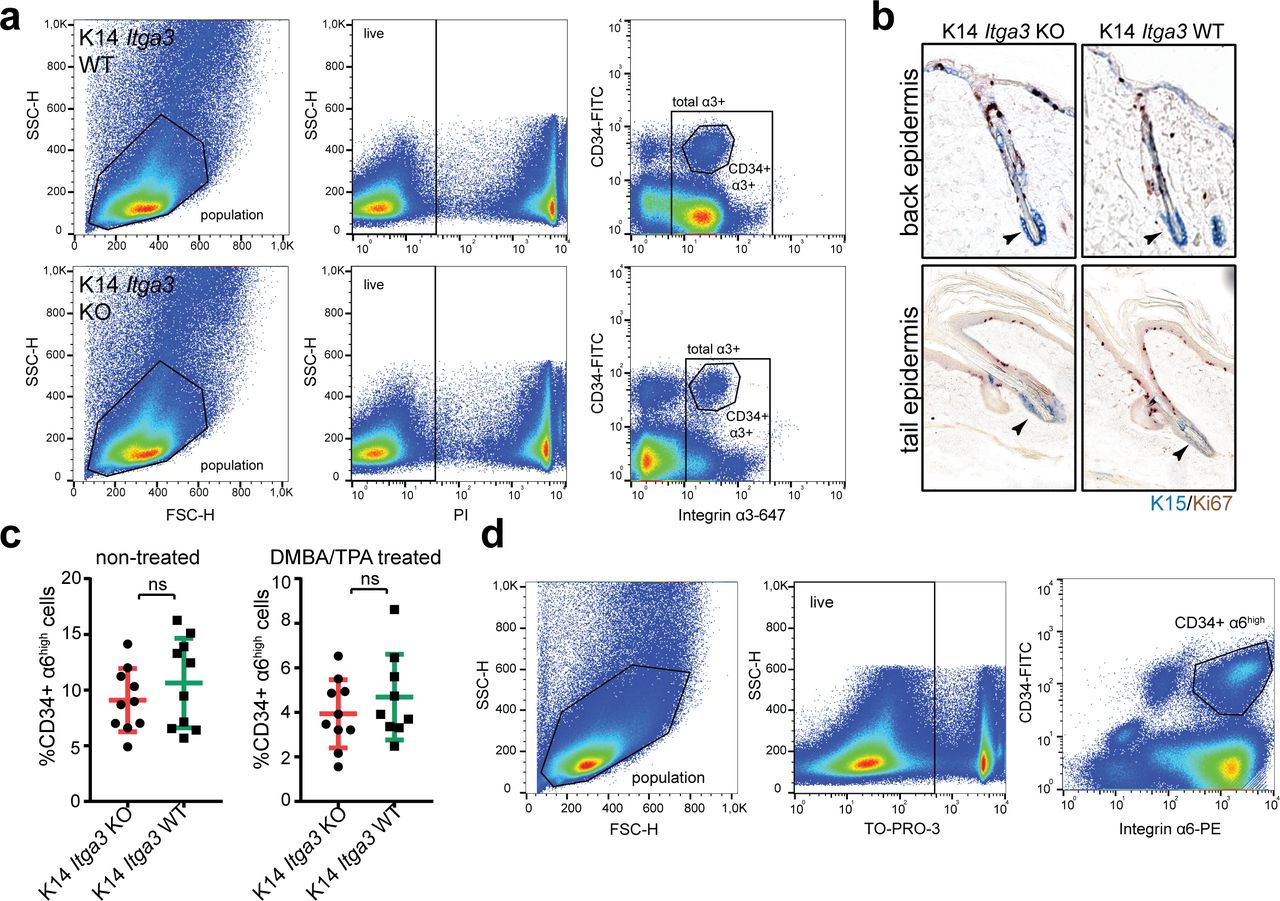
(A) Overview of the K14 Itga3 KO and WT mouse models. (B) Whole mounts of tail epidermis show the presence of α3β1-depleted K15-positive keratinocytes in upper parts of hair follicles and IFE of K14 Itga3 KO mice (white arrow heads). Remaining α3β1-positive keratinocytes in K14 Itga3 KO mice are preferentially localized to HBs (scale bar: 100 μm). (C) Staining for integrin α3 shows HB localization of α3β1-positive keratinocytes in the back skin of 7-wk-old K14 Itga3 KO mice. α3β1 is found in all basal keratinocytes of K14 Itga3 WT mice of similar age (scale bar: 50 μm). (D) FACS analysis of keratinocytes isolated from back skin epidermis. The chart shows the percentages of α3-positive HB cells (CD34-positive) in the total α3-positive population. Each dot represents a mouse. Gating strategy can be found in Fig S2A (mean ± SD, unpaired t test, *P < 0.05). (E) GAPDH-normalized relative mRNA expression of K15 is increased in the epidermis of back and tail skin of K14 Itga3 KO compared with WT mice. Each dot represents a mouse and is an average of technical duplicate or triplicate (mean ± SD, unpaired t test, *P < 0.05, **P < 0.005).
Source data are available for this figure.
Source Data for Figure 2[LSA-2020-00645_SdataF2.xlsx]
- Figure S2. Epidermal deletion of α3β1 causes de novo expression of K15 outside of HBs.
(A) Gating strategy of Fig 2D. (B) Double IHC staining for proliferation marker Ki67 and HB marker K15 shows the absence of proliferation of K15-positive HBs in the back and tail epidermis of K14 Itga3 KO and WT mice. (C) FACS quantification of the HB population (CD34+, α6high) in the back skin of K14 Itga3 KO and WT mice in homeostatic conditions and after short-term DMBA/TPA treatment (mean ± SD, unpaired t test). (D) Gating strategy of Fig S2C.
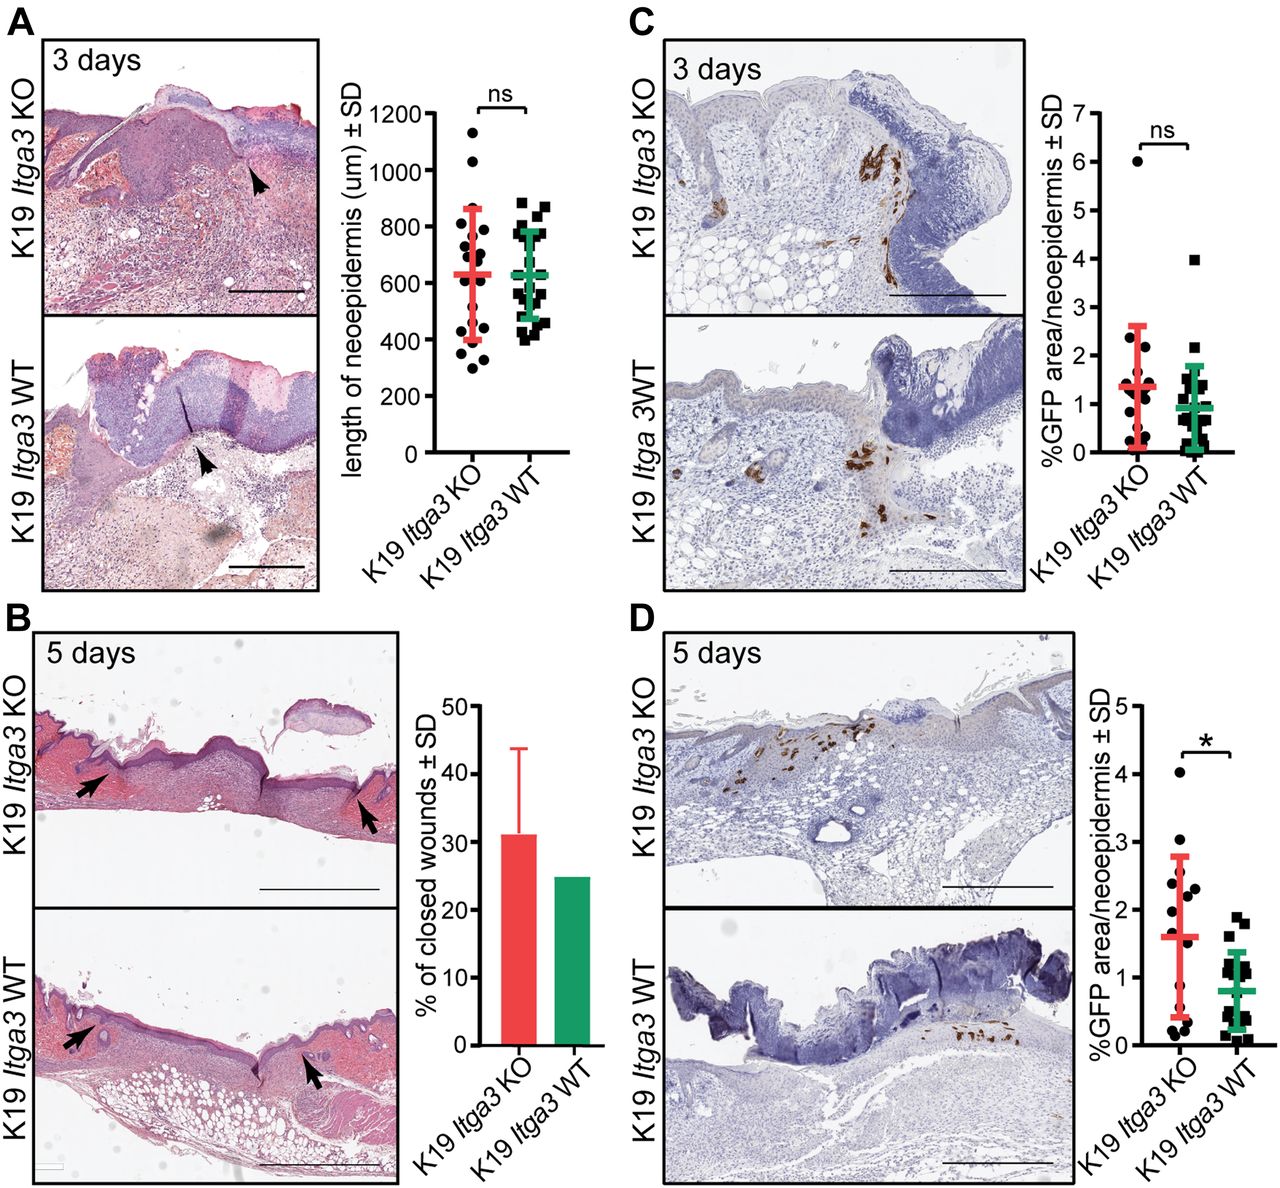
- Figure 3. The contribution of HB keratinocytes to newly formed IFE is increased in the absence of α3β1.
(A, B) H&E staining (left) and quantification (right) of wound healing. (A, B) Wound closure is comparable between K19 Itga3 KO and WT mice, 3 (A) and 5 d (B) after wounding. (A) Each dot represents the average length of the neo-epidermis (black arrows) per wound (mean ± SD, unpaired t test). Wounds of six K19 Itga3 WT and five K19 Itga3 KO mice were analyzed (scale bar: 300 μm). (B) Bars represent the percentage of closed wounds per mouse (mean ± SD). Wounds of four K19 Itga3 WT and four K19 Itga3 KO mice were analyzed (scale bar: 1 mm). (C, D) Immunohistochemistry (IHC) staining for GFP (left) and quantification (right) of GFP-positive area per neo-epidermis of K19 Itga3 KO and WT mice. (C) HB-originating GFP-positive keratinocytes comparably contribute to neo-epidermis in K19 Itga3 KO and WT mice 3 d after wounding (scale bar: 300 μm). Each dot represents the percentage of GFP-positive area per wound (mean ± SD, unpaired t test). Wounds of six K19 Itga3 WT and five K19 Itga3 KO mice were analyzed. (D) 5 d after the wounding, the contribution of the α3β1-deficient HB SCs to the newly formed epidermis is more extensive than that of the α3β1-proficient HB SCs. Each dot represents the percentage of GFP-positive area per wound (mean ± SD, unpaired t test, *P < 0.05). Wounds of five K19 Itga3 WT and four K19 Itga3 KO mice were analyzed.
Source data are available for this figure.
Source Data for Figure 3[LSA-2020-00645_SdataF3.xlsx]
- Figure 4. The absence of α3β1 in HBs reduces susceptibility of mice to DMBA/TPA–mediated tumorigenesis.
(A) The number of tumors (left) and tumor burden (right) is decreased in K19 Itga3 KO compared with WT mice submitted to the DMBA/TPA carcinogenesis protocol (mean ± SEM, unpaired t test, *P < 0.05, **P < 0.005, ***P < 0.0005). (B) Representative macro images of K19 Itga3 KO and WT mice at the end of the treatment. (C) Histology of benign papillomas and keratoacanthomas, representing the majority of tumors isolated from K19 Itga3 KO and WT mice.
Source data are available for this figure.
Source Data for Figure 4[LSA-2020-00645_SdataF4.xlsx]
- Figure S3. The deletion of α3β1 in HBs causes reduced tumor size and may promote tumor progression.
(A) The average tumor size is slightly, but significantly decreased in K19 Itga3 KO compared with WT mice submitted to DMBA/TPA carcinogenesis protocol (mean ± SEM, unpaired t test, *P < 0.05, **P < 0.005, ***P < 0.0005). (B) Histology of progressed tumors at the end of DMBA/TPA treatment: squamous cell carcinoma (SCC), isolated from K19 Itga3 KO and WT mice and keratoacanthomas with carcinomatous changes, isolated from K19 Itga3 WT mouse. Progressed tumors were observed in only one K19 Itga3 KO and three WT mice at the end of the treatment. (C) Histology (left) and quantification (right) of the progressed tumors of seven K19 Itga3 KO and seven WT mice, kept on prolonged TPA treatment for up to additional 10 wk. Five K19 Itga3 KO (one tumor/mouse) and three K19 Itga3 WT (one or two tumors/mouse) mice showed tumor progression. In addition to the SCCs and keratoacanthomas with carcinomatous changes, K19 Itga3 KO mice also developed spindle cell sarcomas and mixed basal SCC.
- Figure 5. HB-derived keratinocytes are largely absent from skin tumors.
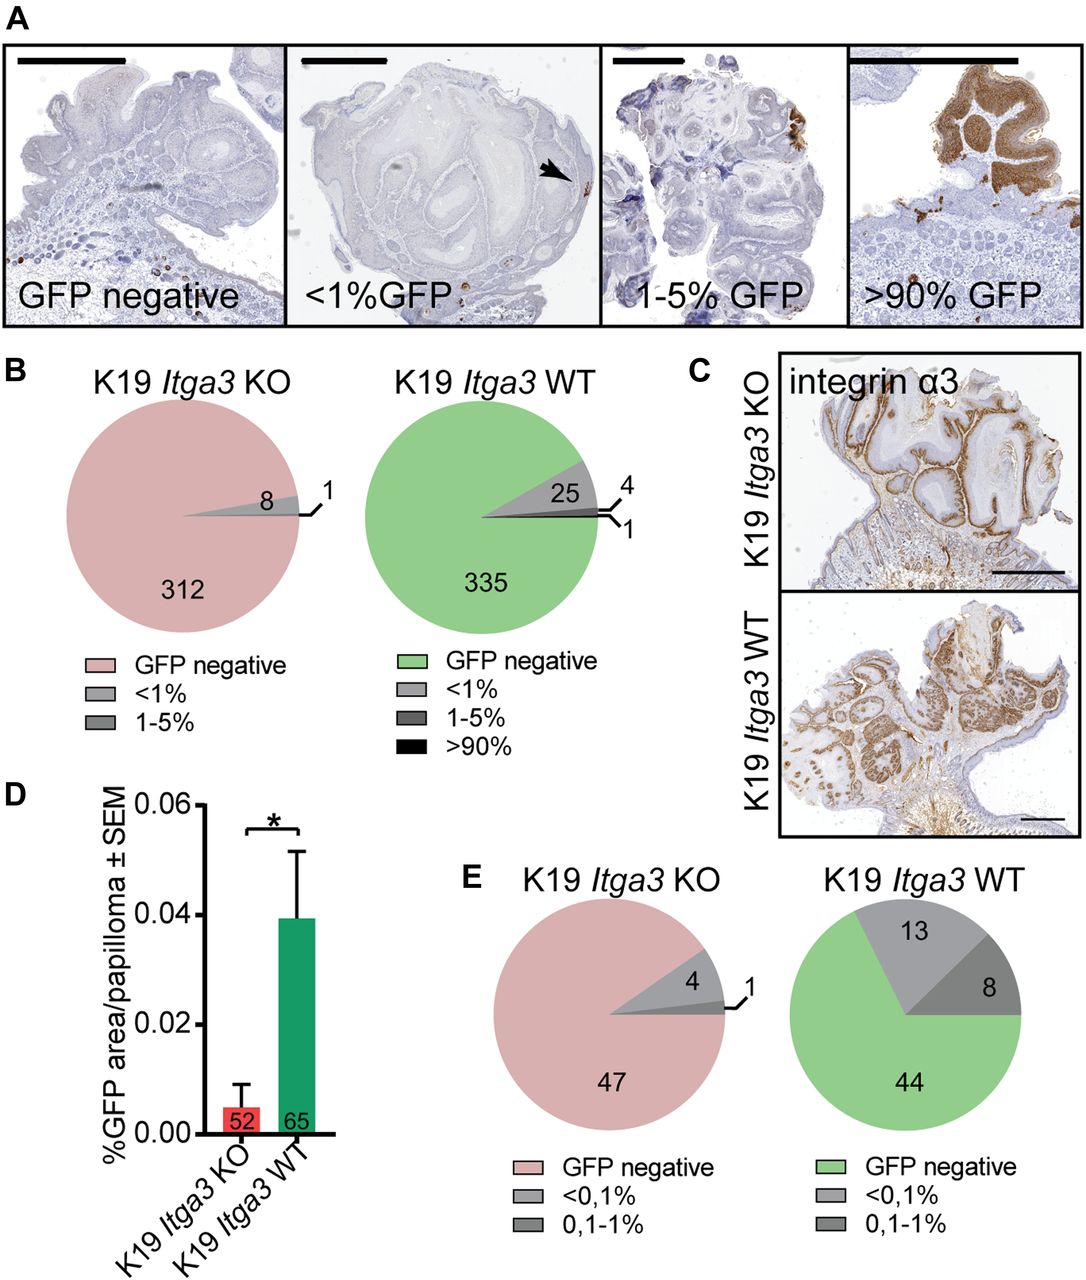
(A, B) With rare exceptions, Cre-induced GFP-positive cells represent less than 1% of total tumor mass. (A, B) Representative IHC images stained for GFP and (B) quantification of GFP-positive area in cross sections of tumors, isolated from nine K19 Itga3 KO and eight WT mice. The vast majority of tumors is GFP negative (scale bar: 1 mm). (C) Integrin α3β1 is strongly expressed in all tumors analyzed (scale bar: 1 mm). (D, E) Analysis of GFP-positive area over 10 cross sections, cut every 200 μm of randomly selected tumors from four K19 Itga3 KO and four WT mice. (D) The contribution of GFP-positive HB-originating keratinocytes to tumors, isolated from K19 Itga3 KO is significantly reduced compared with WT mice (mean ± SEM, unpaired t test, *P < 0.05). (E) Most tumors are GFP negative in both, K19 Itga3 KO and WT mice. GFP was detected in 9.6% of K19 Itga3 KO and in 32.3% of K19 Itga3 WT tumors and did not exceed 1% of total tumor mass.
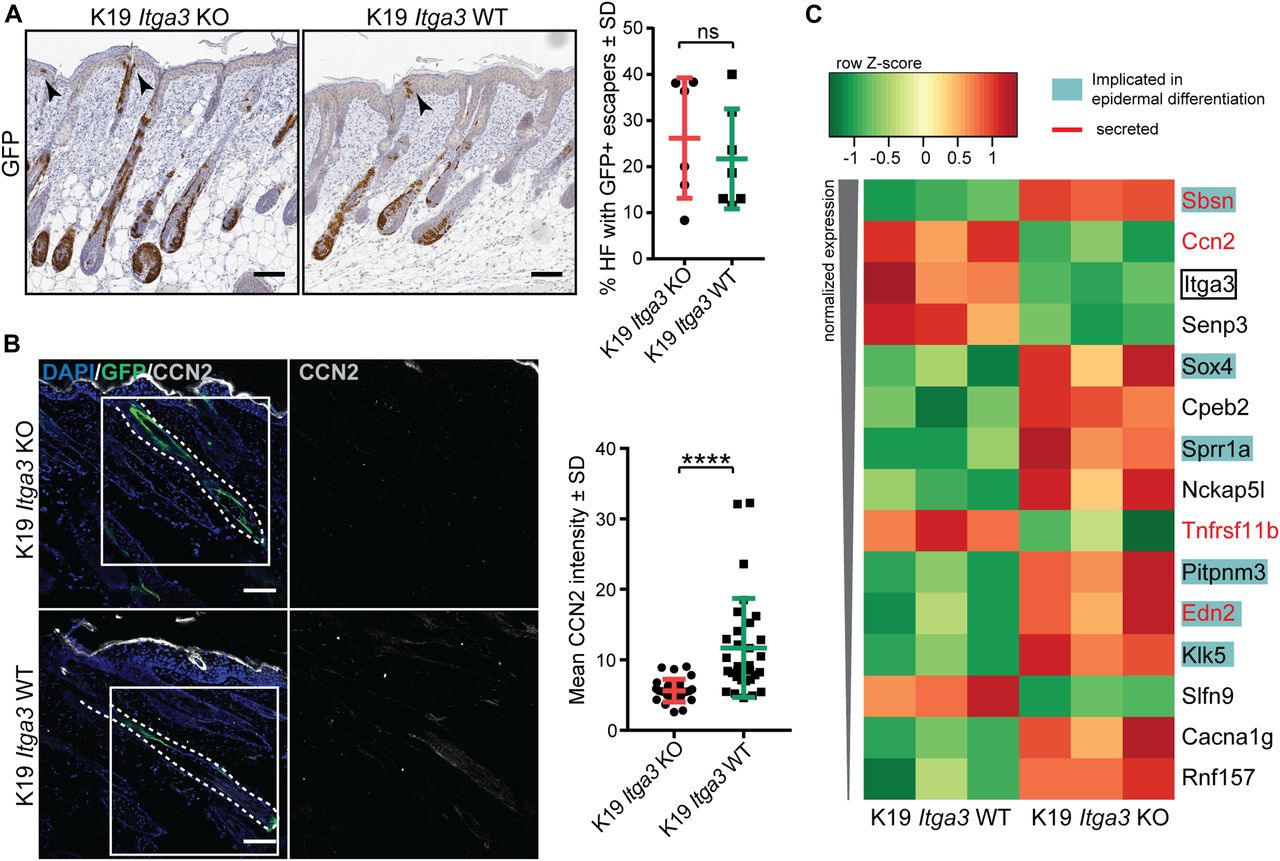
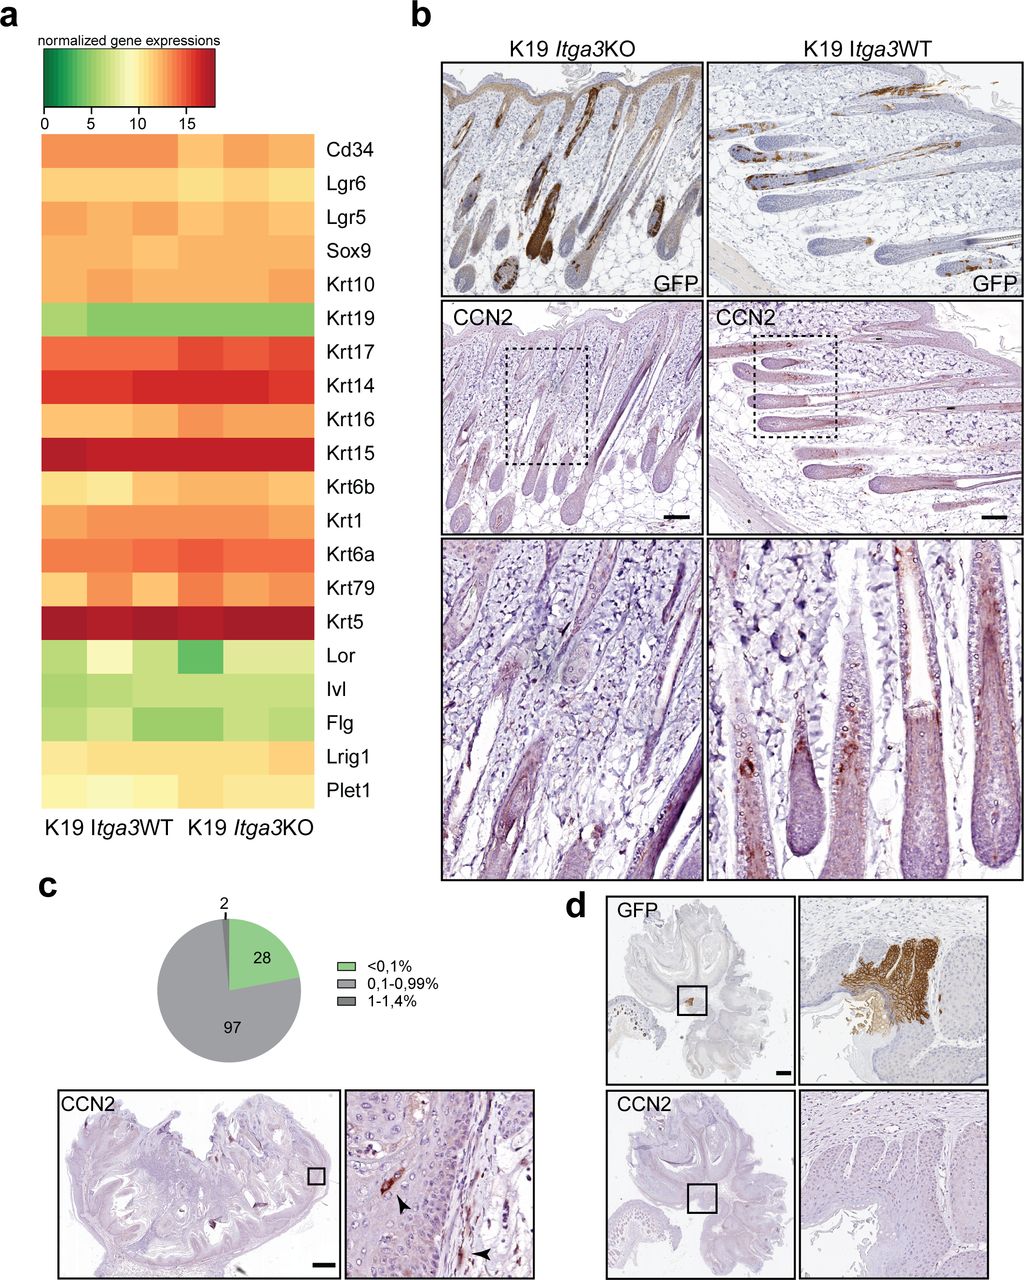
- Figure 6. α3β1-depleted keratinocytes show an increased differentiation signature and decreased expression of CCN2 during the initiation stage of tumorigenesis.
(A) GFP-positive Cre-induced HB SCs localize to growing hair follicles (HFs) and, in some cases, to isthmus, infundibulum, and IFE (black arrows) after short-term DMBA/TPA treatment in K19 Itga3 KO and WT mice. Left: IHC staining for GFP (scale bar: 100 μm). Right: quantification of the number of HFs, where GFP-positive cells were observed in the upper parts of HFs and in adjacent IFE. Each dot represents a mouse (mean ± SD, unpaired t test). (B) Heat map of row-scaled significantly differentially expressed protein-coding genes of GFP-positive keratinocytes, isolated from three K19 Itga3 KO and three K10 Itga3 WT mice after short-term DMBA/TPA treatment. Protein-coding genes have an adjusted P < 0.05 and an average normalized expression across all samples >4 (as calculated with Voom) and a logFC > 0.6 between K19 Itga3 WT an KO mice. (C) IF staining (left) and quantification of mean intensity of the signal (right) for CCN2 in GFP-positive HFs after short-term DMBA/TPA treatment. Each dot represents a GFP-positive HF. HFs of five K19 Itga3 KO and six K19 Itga3 WT mice were quantified (mean ± SD, unpaired t test, P < 0.0001).
- Figure S4. HB-originating α3β1-depleted keratinocytes show decreased expression of CCN2 during the initiation stage of tumorigenesis.
(A) A heat map showing expression of selected epidermal markers, selected from gene list, in GFP-positive HB-originating keratinocytes, isolated from the skin of short-term DMBA/TPA–treated K19 Itga3 KO and WT mice. (B) IHC staining for GFP and CCN2 in the skin of short-term DMBA/TPA–treated K19 Itga3 KO and WT mice (scale bar: 100 μm). (C) Sparse CCN2-positive cells can be observed in epithelia and stroma of all tumors of K19 Itga3 WT mice (arrow heads). Top: quantification of the CCN2-positive area in cross-section of 127 tumors, isolated from six K19 Itga3 WT mice. CCN2 represents less than 1% of total tumor surface in most tumors. Bottom: representative IHC staining for CCN2 (scale bar: 500 μm). (D) Consecutive section of papilloma, isolated from K19 Itga3 WT mouse, stained for GFP and CCN2. No overlap of the two markers can be observed (scale bar: 500 μm).
- Figure 7. CCN2 expression in transformed keratinocytes is α3β1-dependent.
(A) GAPDH-normalized relative mRNA expression of CCN2 is significantly decreased in non-stimulated as well as IL-6 and TPA-treated α3β1-depleted keratinocytes. The average of up to four independent measurements of technical duplicates of four RNA samples per group (dots) is presented (mean ± SD, Fisher’s LSD test, *P < 0.05, **P < 0.005, ***P < 0.0005, ****P < 0.0001). (B) IF (left) and quantification of the mean intensity (right) of CCN2 in non-stimulated, IL-6, and TPA-treated MSCC Itga3 KO and WT keratinocytes. Expression of CCN2 is α3β1 dependent and increases upon IL-6 and TPA treatment (scale bar: 50 μm). 90 cells imaged over three independent experiments were quantified (mean ± SD, Fisher’s LSD test, P < 0.0001). (C) Representative WB confirming α3β1-dependent and IL-6– and TPA-mediated CCN2 expression. Quantification can be found in Fig S5A.
Source data are available for this figure.
Source Data for Figure 7[LSA-2020-00645_SdataF7.pdf]
- Figure S5. CCN2 expression in transformed keratinocytes is α3β1-dependent.
(A) Quantification of WB from Fig 7C. Bars represent the mean of five independent experiments (mean ± SD, Fisher’s LSD test, *P < 0.05, **P < 0.005, ***P < 0.0005, ****P < 0.0001). (B) IF images showing co-localization of excreted CCN2 and laminin-332 in the culture of non-treated MSCC Itga3 KO and WT keratinocytes.
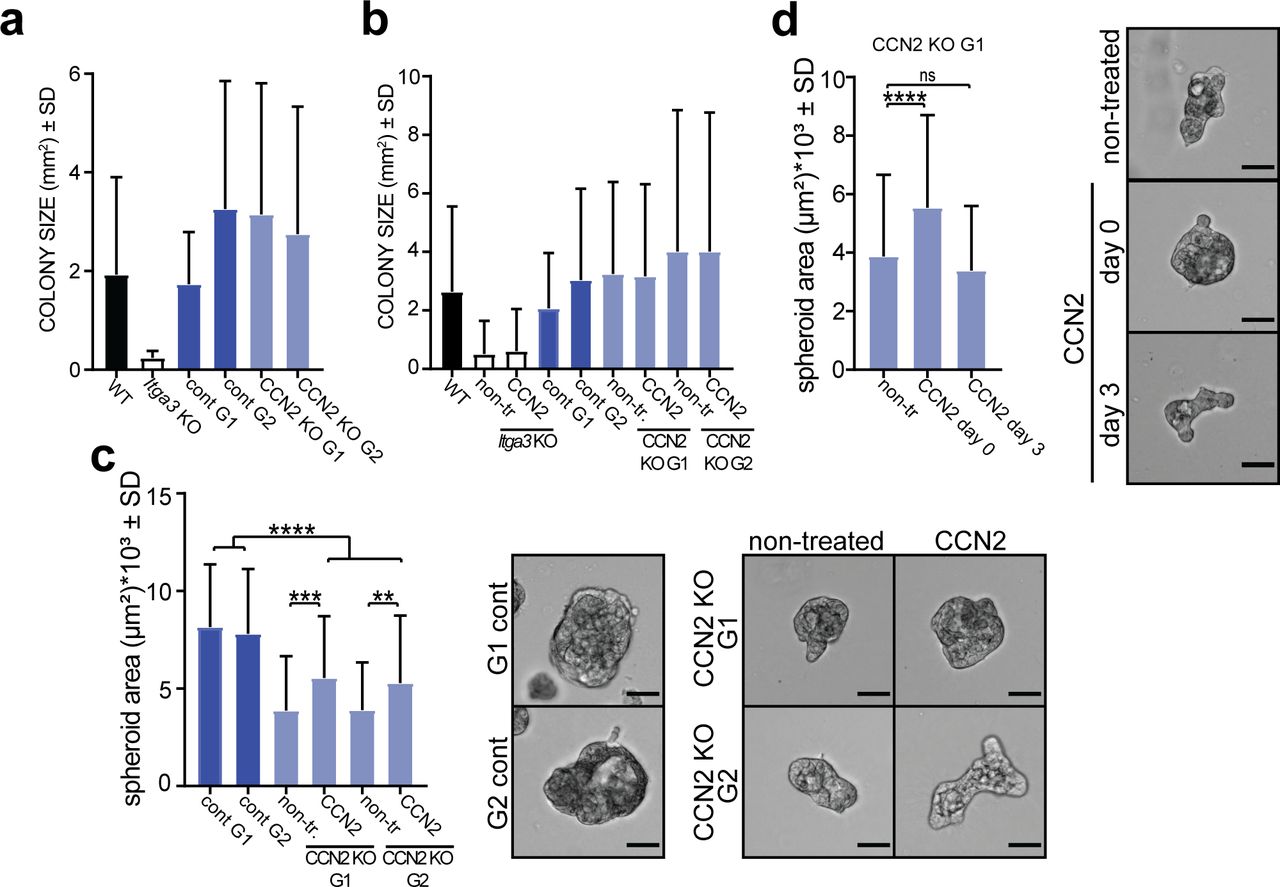
- Figure 8. CCN2 promotes colony formation and 3D growth of transformed keratinocytes expressing α3β1.
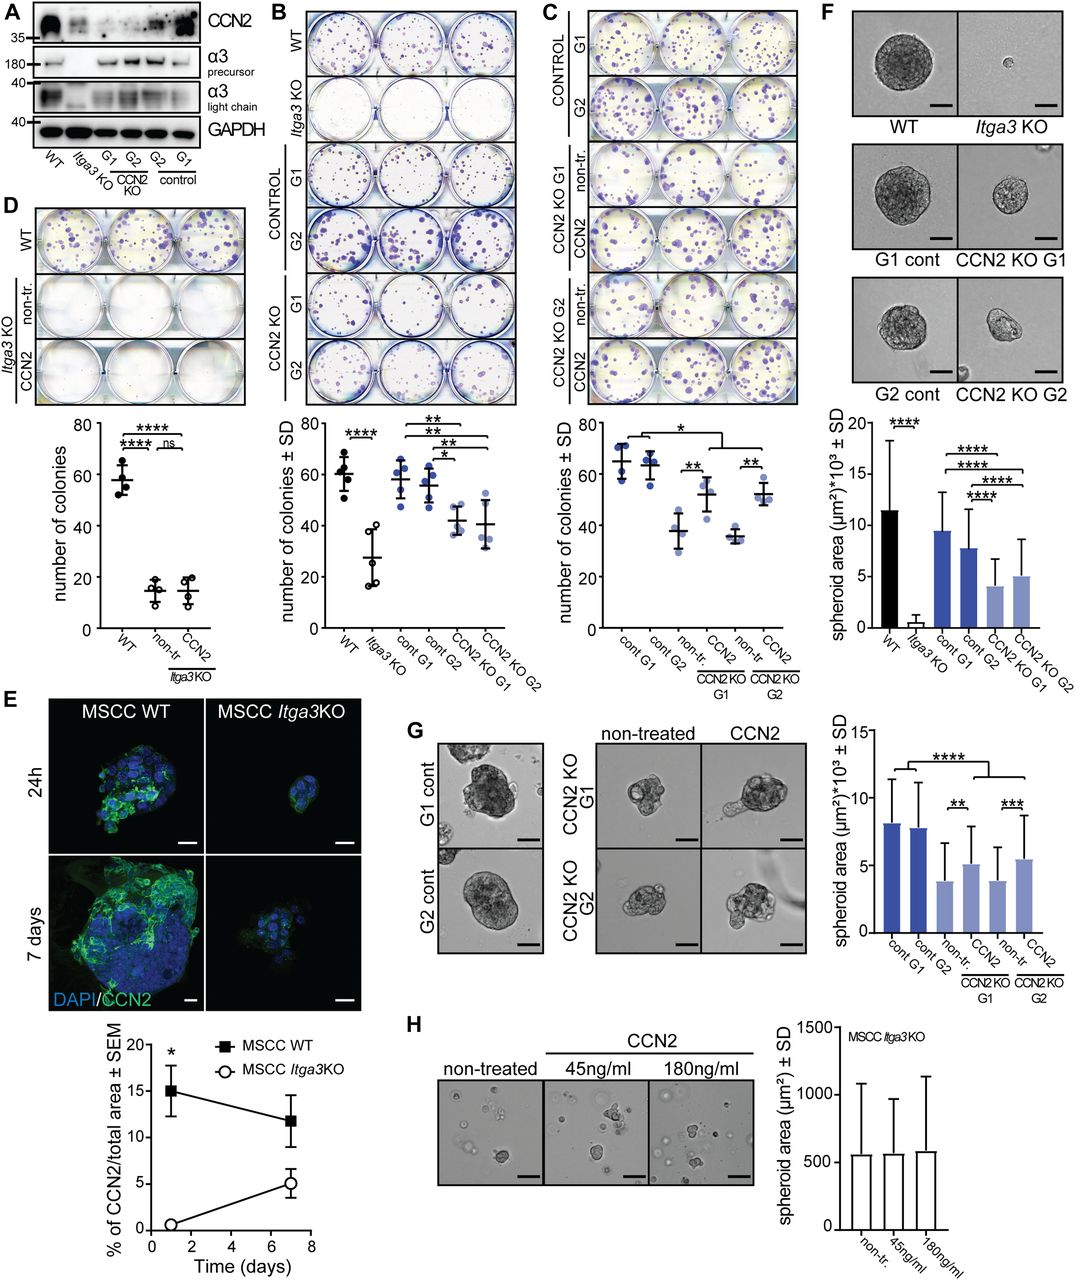
(A) WB of CCN2 and integrin α3-expression of selected CCN2 KO and control clones. (B) Representative image (top) and quantification (bottom) of colony-formation assay of MSCC Itga3 WT and Itga3 KO cells and MSCC CCN2 KO G1, KO G2, control G1, and control G2 clones. Deletion of α3β1 results in a strong reduction of colony formation and colony size. Moderate reduction of colony formation can be seen upon CCN2 deletion. Quantification of colony size can be found in Fig S6A. Average values of technical triplicates of five independent experiments are presented (mean ± SD, Fisher’s LSD test, *P < 0.05, **P < 0.005, ****P < 0.0001). (C) Representative image (top) and quantification (bottom) of colony-formation assay of MSCC CCN2 KO G1 and KO G2 clones, grown in control conditions or in the presence of 45 ng/ml CCN2, as well as CCN2 WT control G1 and control G2 clones. Treatment with exogenous CCN2 significantly increases colony formation of CCN2 KO clones. Quantification of colony size can be found in Fig S6B. Average values of technical triplicates of four independent experiments are presented (mean ± SD, Fisher’s LSD test, *P < 0.05, **P < 0.005). (D) No differences in the number of colonies can be observed upon CCN2 treatment of Itga3 KO–transformed keratinocytes. Quantification of colony size can be found in Fig S6B. Average values of technical triplicates of four independent experiments are presented (mean ± SD, Fisher’s LSD test, ****P < 0.0001). (E) Quantification (left) and IF as maximum intensity projection (right) of CCN2 expression of MSCC Itga3 WT and KO spheroids, grown in 3D Matrigel matrix for 1 or 7 d (scale bar: 20 μm). The expression of CCN2 is α3β1 dependent, which is particularly prominent at the beginning of spheroid growth. The percentage of CCN2-positive area was quantified from 17 MSCC Itga3 KO and 30 MSCC Itga3 WT spheroids 1 d after seeding and from 15 MSCC Itga3 KO and 27 MSSC WT spheroids 7 d after seeding (mean ± SEM, unpaired t test, *P < 0.05). (F) Spheroid growth in 3D Matrigel is α3β1 dependent and moderately reduced upon CCN2 deletion. Top: bright-filed images of representative spheroids (scale bar: 50 μm). Bottom: size quantification of 60–80 spheroids measured over three to four independent experiments (mean ± SD, Fisher’s LSD test, ****P < 0.0001). (G) 3D growth of CCN2 KO MSCC spheroids shows small but significant increase when cells are seeded with 45 ng/ml of CCN2. Left: bright-filed images of representative spheroids (scale bar: 50 μm). Right: size quantification of 85–90 spheroids measured over three independent experiments (mean ± SD, Fisher’s LSD test, **P < 0.005, ***P < 0.0005 ****P < 0.0001). (H) Seeding Itga3 KO MSCCs with 45 or 180 ng/ml of CCN2 does not impact the 3D growth pf spheroids. Left: bright-filed images of representative spheroids (scale bar: 50 μm). Right: size quantification of 70 spheroids measured over two independent experiments (mean ± SD, one-way ANOVA, P = 0.9491).
Source data are available for this figure.
Source Data for Figure 8[LSA-2020-00645_SdataF8.pdf]
- Figure S6. CCN2 promotes colony formation and 3D growth of transformed keratinocytes expressing α3β1.
(A) Quantification of the colony size from colony formation from Fig 8B. Total colonies from three independent experiments were quantified (n = 246–563, mean ± SD). (B) Quantification of the colony size from colony formation from Fig 8C and D. Total colonies from three independent experiments were quantified (n = 166–779, mean ± SD). (C) 3D growth of CCN2 KO MSCC spheroids shows small but significant increase when cells are seeded with 180 ng/ml of CCN2. Left: bright-filed images of representative spheroids (scale bar: 50 μm). Right: size quantification of 90 spheroids measured over three independent experiments (mean ± SD, Fisher’s LSD test, **P < 0.005, ***P < 0.0005, ****P < 0.0001). (D) Whereas seeding MSCC CCN2 G1 clone with CCN2 increases its 3D growth, such effect is not observed when exogenous CCN2 (180 ng/ml) is added when spheroids have already formed 3 d after seeding. Left: size quantification of 90 spheroids measured over two to three independent experiments (mean ± SD, Fisher’s LSD test, ****P < 0.0001). Right: bright-filed images of representative spheroids (scale bar: 50 μm).


Tables
Antigen Name Type Application Dilution Source Integrin α3 Rabbit pAb WB 1:2,000 Homemade Integrin α3 AF2787 Goat pAb IF 1:100 R&D Systems Integrin α3 AF2787 Goat pAb FACS 1:100 R&D Systems Integrin α3 sc-374242 Mouse mAb IHC 1:500 Santa Cruz Integrin α6-PE eBioGoH3 Rat mAb FACS 1:200 eBioscience CCN2 E-5 Mouse mAb WB 1:800 Santa Cruz CCN2 L-20 Goat pAb IF, IHC 1:100 Santa Cruz CD34-FITC RAM34 Rat mAb FACS 1:100 eBioscience GAPDH CB1001 Mouse mAb WB 1:1,000 Calbiochem GFP ab6556 Rabbit pAb IHC 1:2,000 Abcam Keratin 15 MA1-90929 Mouse mAb IF, IHC 1:200 Thermo Fisher Scientific Ki67 PSX1028 Rabbit pAb IHC 1:750 Monosan Laminin-332 R14 Rabbit pAb IF 1:400 Kind gift of M Aumailey


In this Issue
Subjects
Related Articles
Cited By...
- No citing articles found.