


Article Figures & Data
Figures
- Figure 1. Generation of hCOs from H9 ESCs.
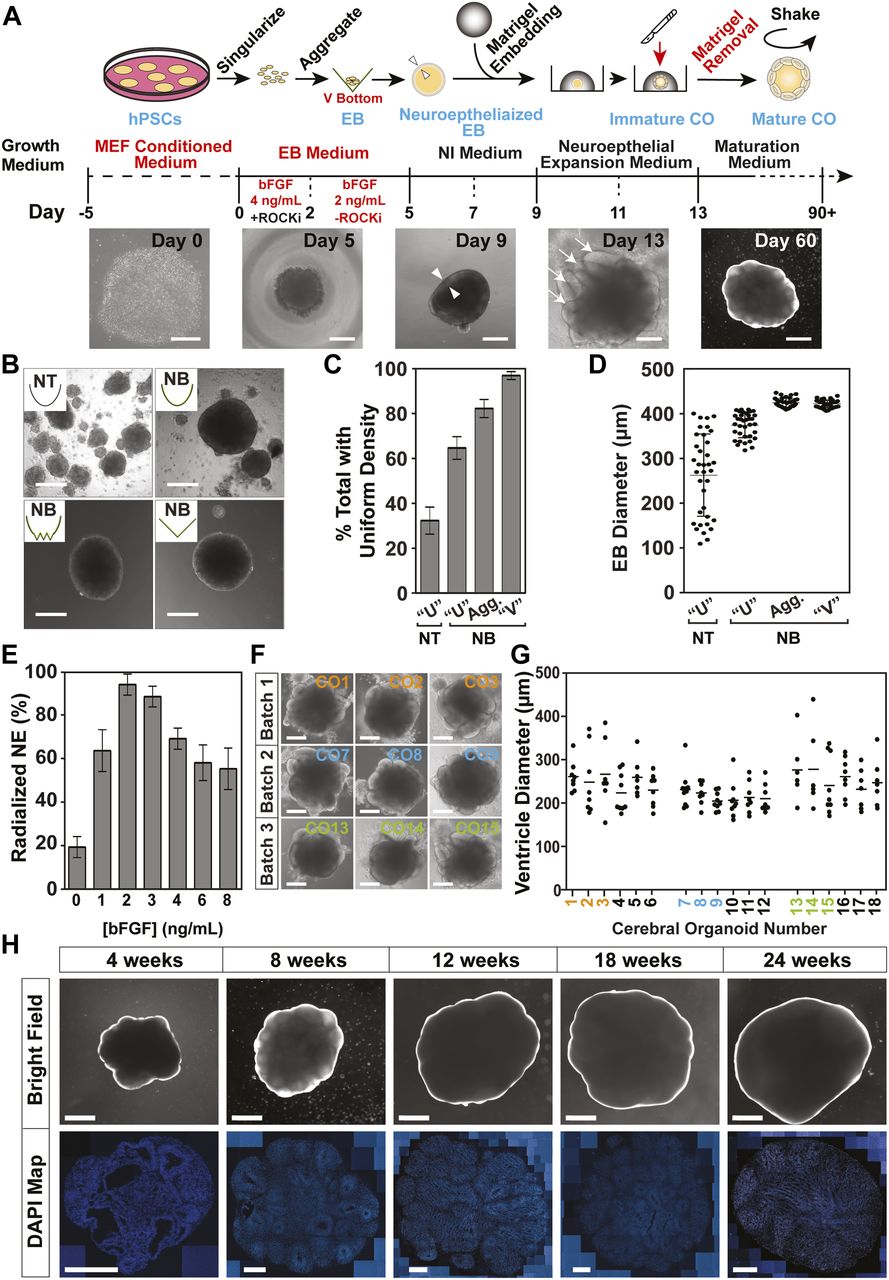
(A) A schematic depicting the main steps for human cerebral organoid (hCO) production. Representative bright-field images of morphological changes are shown below. Triangles (Day 9) mark the inner and outer edge of the neuroepithelial ring, and arrows (Day 13) indicate early ventricle structures. Scale bars: 250 μm for days 0, 5, 9, and 13 and 1 mm for Day 60. (B, C, D) The effect of well shape and surface coating on embryoid body (EB) formation was assessed on Day 5. (B) Representative bright-field images of EBs generated using the indicated plate format. Scale bar = 250 μm. Non-treated (NT), nonbinding (NB). (C) Percent of cell aggregates displaying uniform density as assessed using phase-contrast microscopy is plotted as the mean ± SD (n = 3). (D) Individual EB diameters (black circles) and the mean (horizontal dash) ± SD (n ≥ 30/condition) is plotted. (E) Percent of total EBs displaying radialization neuroepithelium on Day 5 at the indicated bFGF concentrations are plotted as mean ± SD (n = 3). (F, G) Analysis of ventricle formation on Day 13. (F) Representative bright-field images of COs before Matrigel extraction from three independent batches are shown. Scale bar = 500 μm. (G) Quantification of the diameter of individual ventricle-like structures (black circles) from three independent batches is plotted with the mean diameter marked (horizontal dash). (F) Colored numbering corresponds to images in panel (F). (H) Macroscopic organization in H9-derived hCOs. Representative bright-field (Scale bar = 1 mm) images of hCOs in suspension culture at 4, 8, 12, 18, and 24 wk of culture (top) with corresponding sections stained with DAPI to mark nuclei (bottom). Scale bar = 500 μm.
- Figure S1. Morphological characterization of H9- and H1-derived human cerebral organoids (hCOs).
(A) Representative bright-field images of failed (top panels) or successful (bottom panels) neuroepithelialization on Day 4 of neural induction from H9 ESCs. White triangles denote the neuroepithelial ring. Scale bar = 250 μm. (B) Percent of total EBs displaying radialization neuroepithelium on Day 5 at the indicated cell seeding concentrations is plotted as mean ± SD (n = 3). (C) Representative images of hCOs generated using the optimized and traditional CO differentiation pipelines. Arrows show ventricle structures and the arrowhead highlights a fluid-filled cyst structure on the organoid exterior. Scale bar = 1 mm. (D) Efficiency of H9-derived COs displaying ventricle ring structures on Day 13, before Matrigel extraction, from three independent batches of COs. (E, F, G) Generation of H1-derived hCOs. (E) Representative bright-field images of morphological changes at the indicated ages are shown. (F, G) Representative bright-field images of COs before Matrigel extraction on Day 12 (F) and at 12 wk (G) from three independent batches are shown. Scale bars: 200 μm for days 4–12 and 1 mm for 8 and 12 wk.
- Figure S2. Human cerebral organoids (hCOs) mimic early human cortical development.
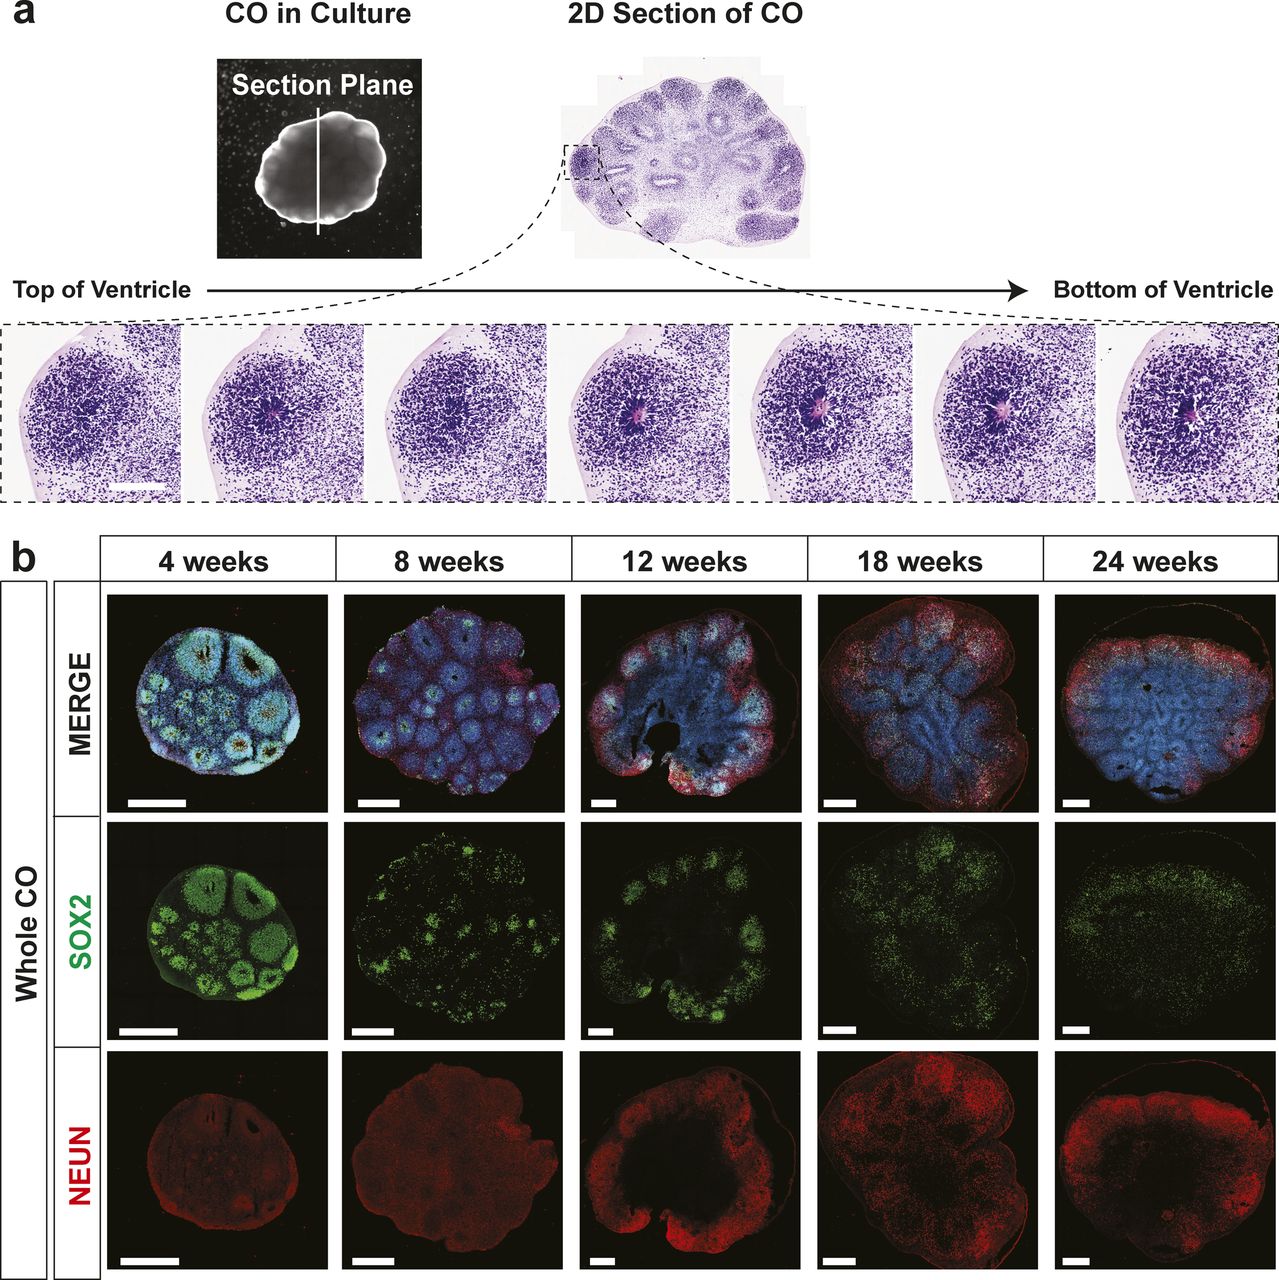
(A) Orientation of ventricle unit in hCOs in 3D space. Visualization of serial sections of an hCO and a top view of a sectioned ventricle when mounted on a glass coverslip (top). H&E staining of seven serial sections of a ventricle to reconstruct the 3D structure (bottom). Scale bar = 250 μm. (B) Images of individual channels of the merged whole CO images shown in Fig 2. Localization of SOX2 (radial glia) and NeuN (neurons) in hCOs at 4, 8, 12, 18, and 24 wk of age, co-stained with DAPI, was visualized by immunofluorescence microscopy. Scale bar = 500 μm for whole COs.
- Figure 2. Human cerebral organoids (hCOs) mimic early human cortical development.
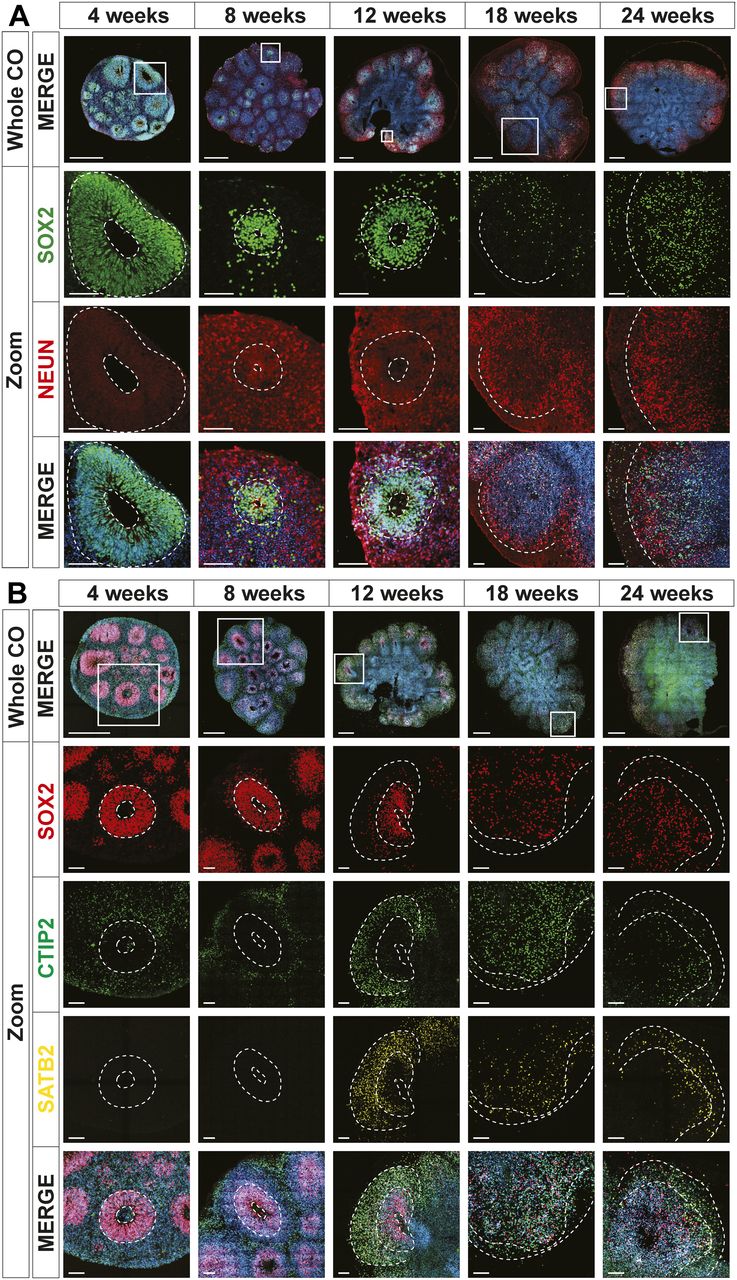
The localization of SOX2 (radial glia), NeuN (neurons), CTIP2, and SATB2 (cortical layer markers) in hCOs at 4, 8, 12, 18, and 24 wk of age, co-stained with DAPI, was visualized by immunofluorescence microscopy. Images of whole hCOs (top) and magnified images (Zoom) of selected ventricles or regions (white box) at each time point are shown. White dashed lines mark ventricles (center ring) and the outer perimeter SOX+ radial glial cells (outer ring). White dashed lines mark the ventricle-like cavities (inner ring) and the outer perimeter of the SOX2+ layer in 4–12-wk COs or the SOX+ and outer edge of the cortical plate in 18- and 24-wk COs. (A) Ventricle-like structures are lost in older (18 and 24 wk) COs. (B) Expression of CTIP2 (gene name, BCL11B; deep layer cortical neuron marker) precedes that of SATB2 (upper layer cortical neuron marker), both of which are superficial to the SOX2+ ventricular zone in 4–12-wk COs, recapitulating in vivo cortical development, whereas in older COs (18 and 24 wk), this distinct separation is less evident. Scale bar = 500 μm for whole COs and 100 μm for magnified ventricles.
- Figure S3. Characterization of ventricle-like structures in human cerebral organoids (hCOs).
(A) Localization of SOX2 (radial glia) and TUJ1 (neurons) in hCOs at 4, 8, and 12 wk of age, co-stained with DAPI, was visualized by immunofluorescence microscopy. SOX2+ radial glial cells line the apical space of the ventricular zone adjacent to the hollow ventricle structure. Triangles denote TUJ1+ radial glial processes oriented perpendicular in the ventricular zone (VZ) and arrows denote TUJ1+ neurons with parallel processes in the cortical plate (CPL). The dashed line denotes layering present in hCOs. Scale bar = 50 μm. (B) Localization of SOX2 (radial glia), CTIP2, and SATB2 (cortical layer markers) in hCOs at 4, 8, 12, 18, and 24 wk of age, co-stained with DAPI, was visualized by immunofluorescence microscopy. Scale bar = 500 μm for whole COs. CP, cortical plate; SVZ, sub-ventricular zone; VZ, ventricular zone.
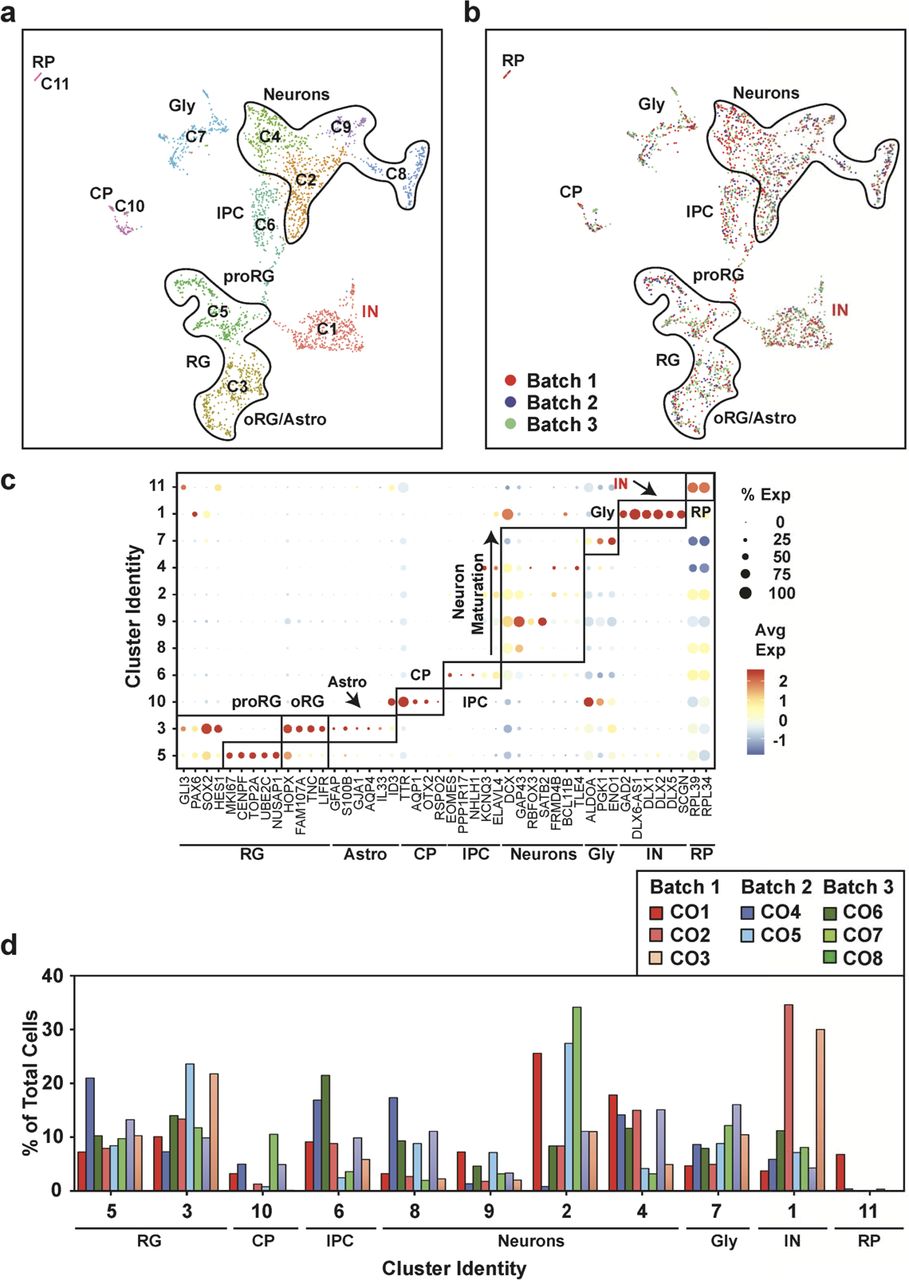
- Figure 3. Uniform cell type composition in 12 human cerebral organoids (hCOs) is revealed by single-cell RNA sequencing.
(A) A Uniform Manifold Approximation and Projection plot from unsupervised clustering of single-cell RNA sequencing data from six 12-wk-old hCOs obtained from three separate batches (CO1-CO6) (10,985 cells) is shown. Cluster identities are indicated. (B) Cluster frequency analysis depicting the percentage of cells in each individual organoid that contributed to each cluster. (A, C) Individual 12-wk-old hCOs (CO1-CO6) are plotted in the Uniform Manifold Approximation and Projection axis defined in panel (A). (A, D) A dot blot indicates the expression of cell type–specific marker genes for all clusters in panel (A).
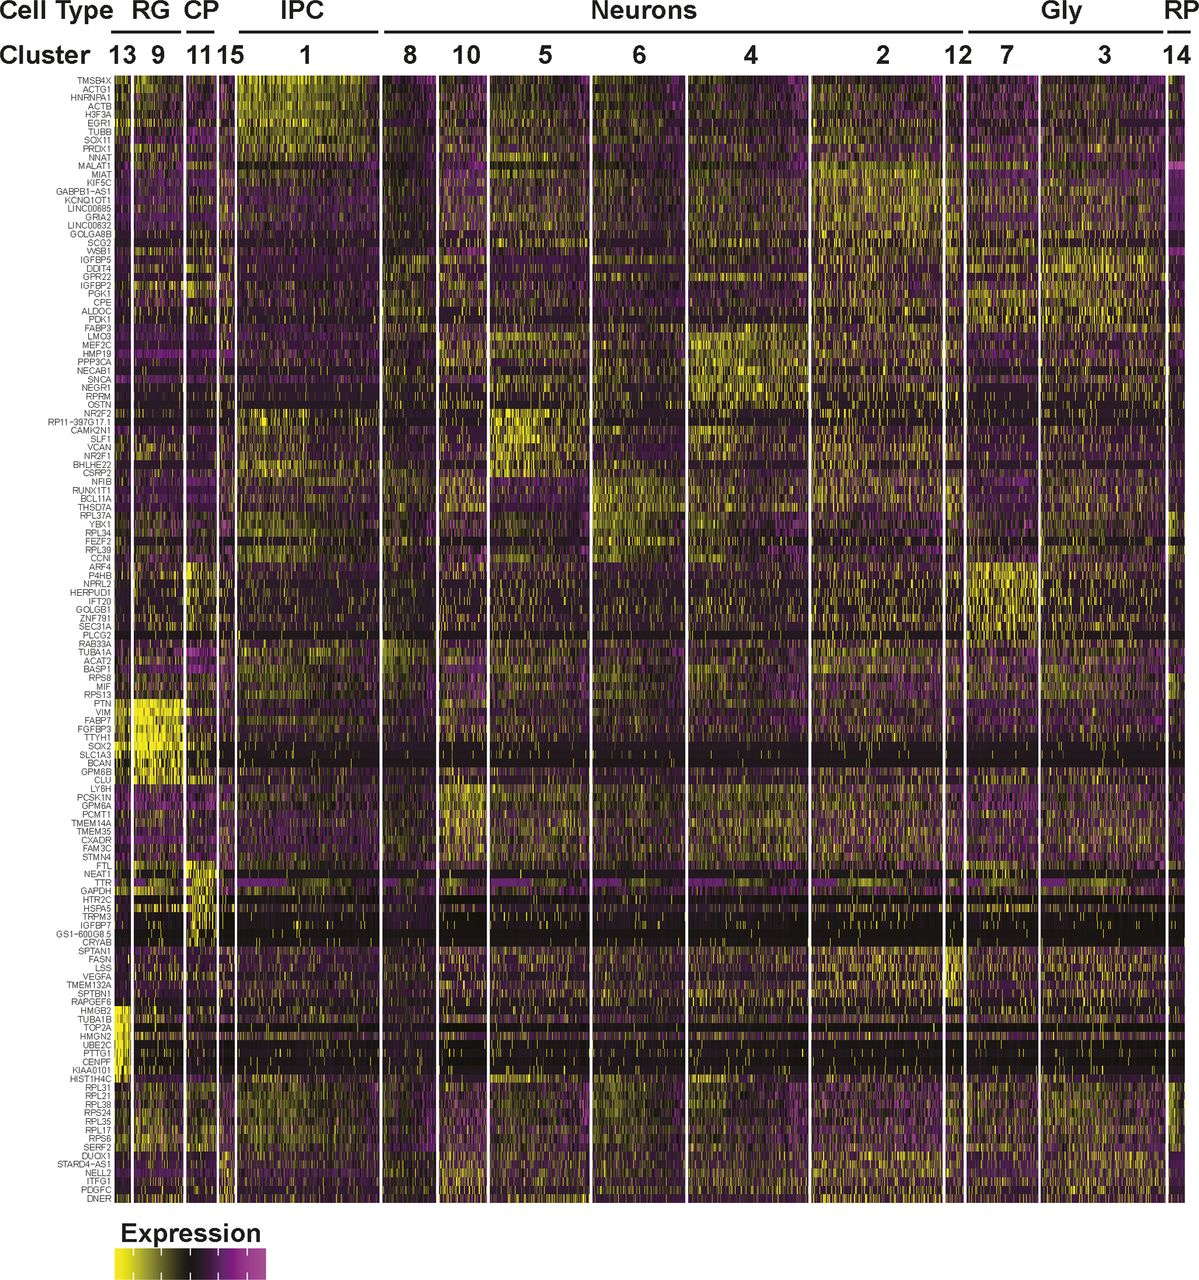
- Figure S4. Gene expression heat map from 12-wk-old COs.
The top 10 most differentially expressed genes per cluster are shown.
- Figure S5. Uniform cell type composition in 18-wk-old human cerebral organoids (hCOs) is revealed by single-cell RNA sequencing.
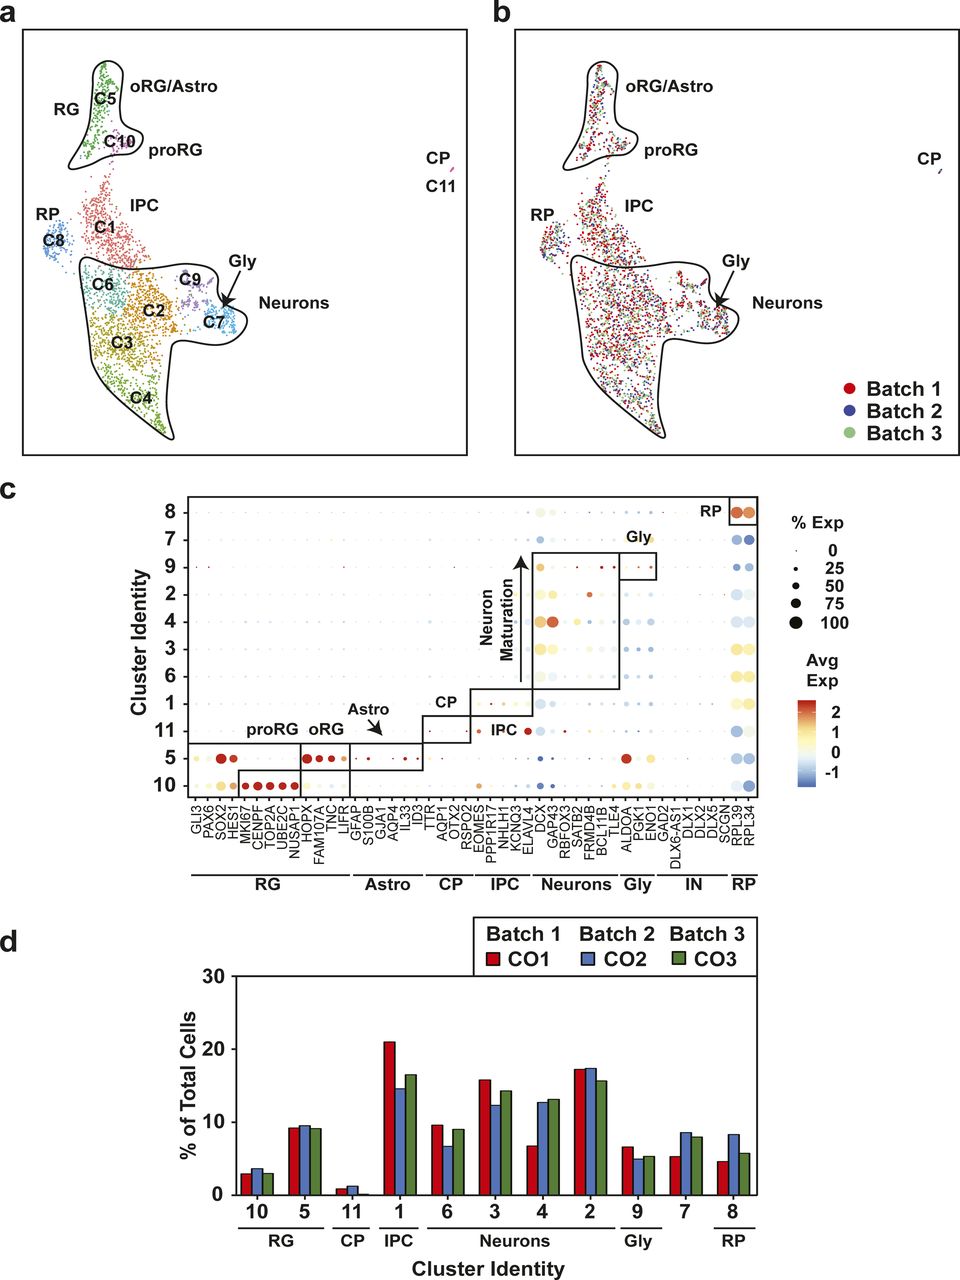
(A) Uniform Manifold Approximation and Projection plots from unsupervised clustering of single-cell RNA sequencing data from three hCOs from three separate batches (CO1-CO3) (12,000 cells) are shown. Cluster identities are indicated. Emergence of an astrocyte population is observed in the oRG/astro cluster 10. (B) A dot blot indicates the expression of cell type–specific marker genes for all clusters. The percent of cells expressing the gene (circle diameter) and the scaled average expression of the gene is indicated by the colour. (C) Cluster frequency analysis depicting the percentage of cells in each individual organoid that contributed to each cluster. (A, D) Individual hCOs (CO1-CO3) are plotted in the Uniform Manifold Approximation and Projection axis defined in panel (A). CP, choroid plexus; GLY, glycolytic signature; IPC, intermediate progenitor cells; oRG/astro, outer radial glial cells/astroglia; proRG, proliferative radial glial; RG, radial glial cells; RP, ribosomal protein.
- Figure S6. Gene expression heat map from 18-wk-old COs.
The top 10 most differentially expressed genes per cluster are shown.
- Figure S7. Uniform cell type composition in 24-wk-old human cerebral organoids is revealed by single-cell RNA sequencing.
(A) Uniform Manifold Approximation and Projection plots from unsupervised clustering of single-cell RNA sequencing data from eight human cerebral organoids from three separate batches (CO1-CO8) (3,140 cells) are shown. Cluster identities are indicated. The emergence of an interneuron (IN; red text) and mature astrocyte population is observed. (B) A dot blot indicates the expression of cell type–specific marker genes for all clusters. The percent of cells expressing the gene (circle diameter) and the scaled average expression of the gene are indicated by the colour. (C) Cluster frequency analysis depicting the percentage of cells in each individual organoid that contributed to each cluster. (A, D) COs derived from each independent batch are plotted in the Uniform Manifold Approximation and Projection axis defined in panel (A). CP, choroid plexus; GLY, glycolytic signature; IN, interneurons; IPC, intermediate progenitor cells; oRG/astro, outer radial glial cells/astroglia; proRG, proliferative radial glial; RG, radial glial cells; RP, ribosomal protein.
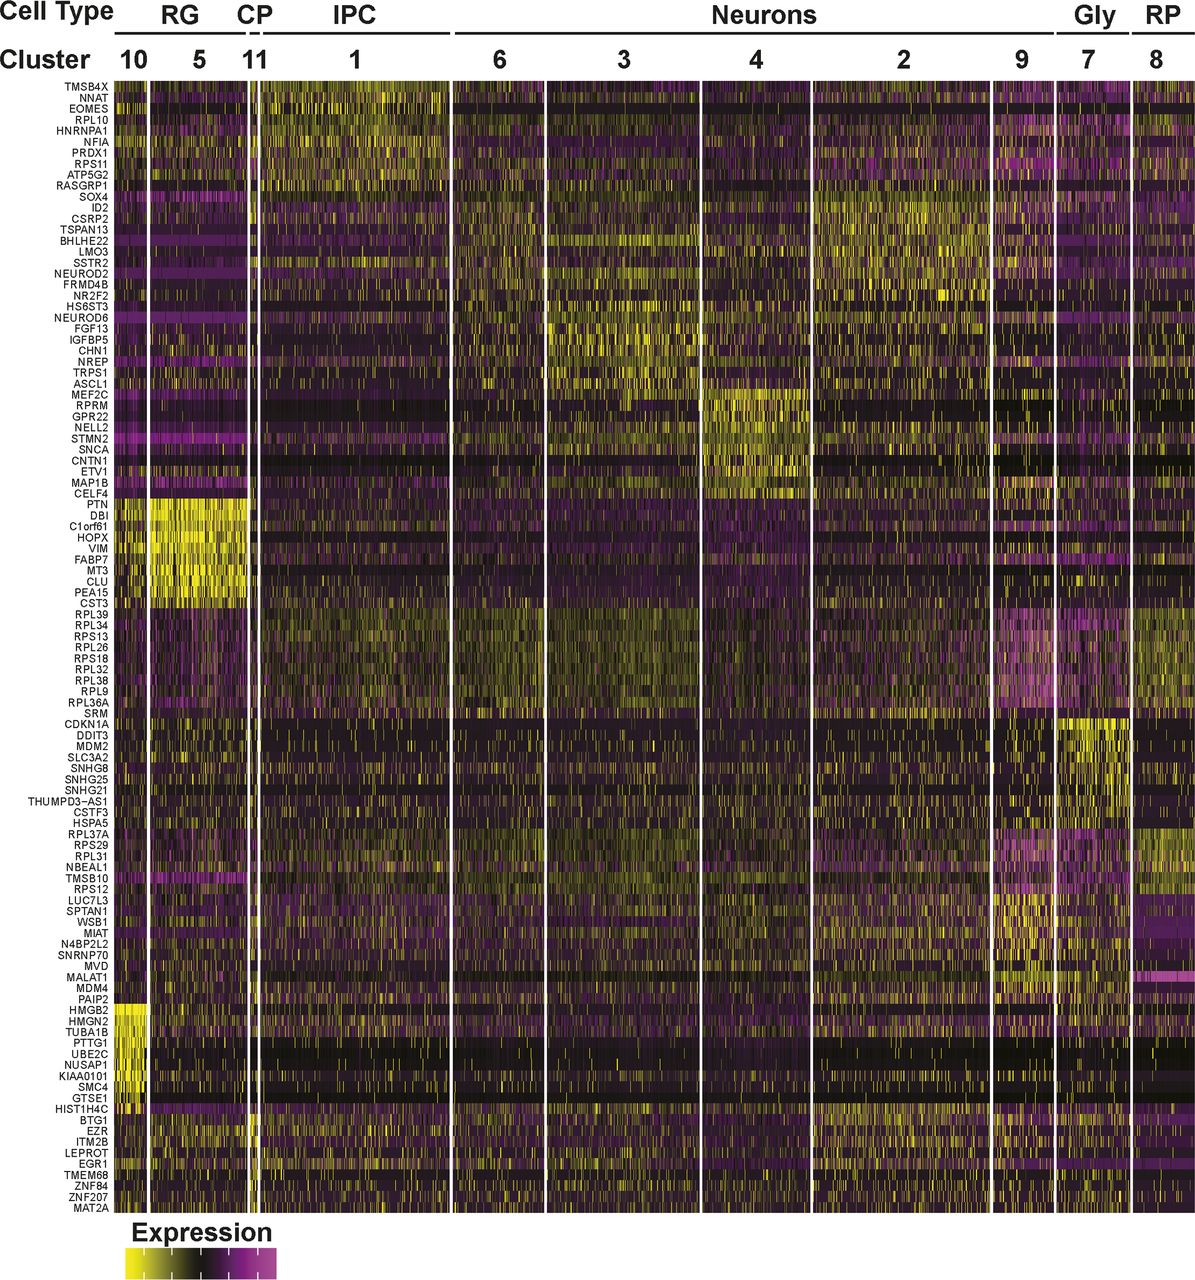
- Figure S8. Gene expression heat map from 24-wk-old COs.
The top 10 most differentially expressed genes per cluster are shown.
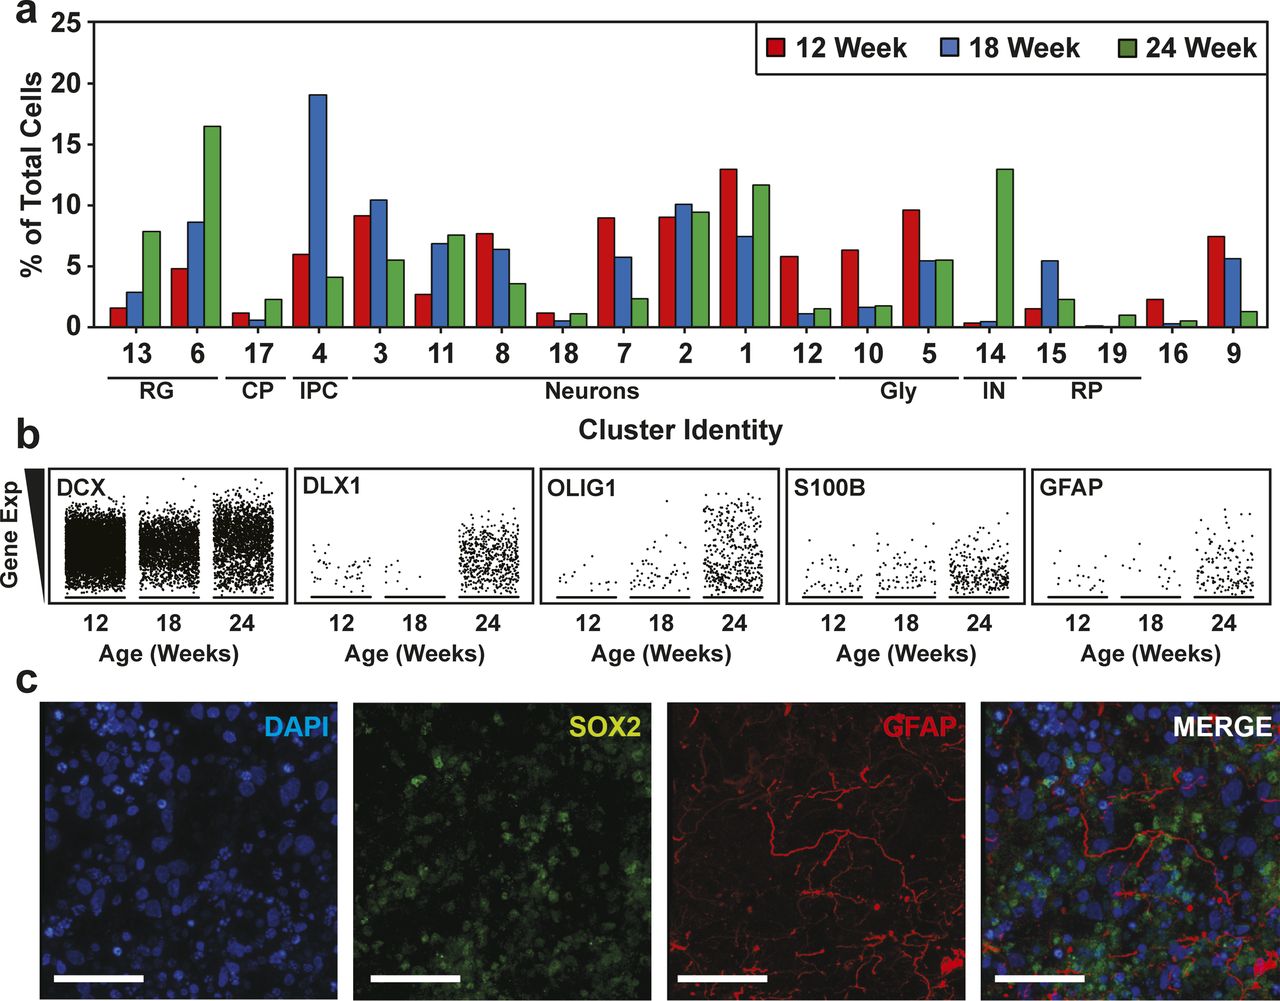
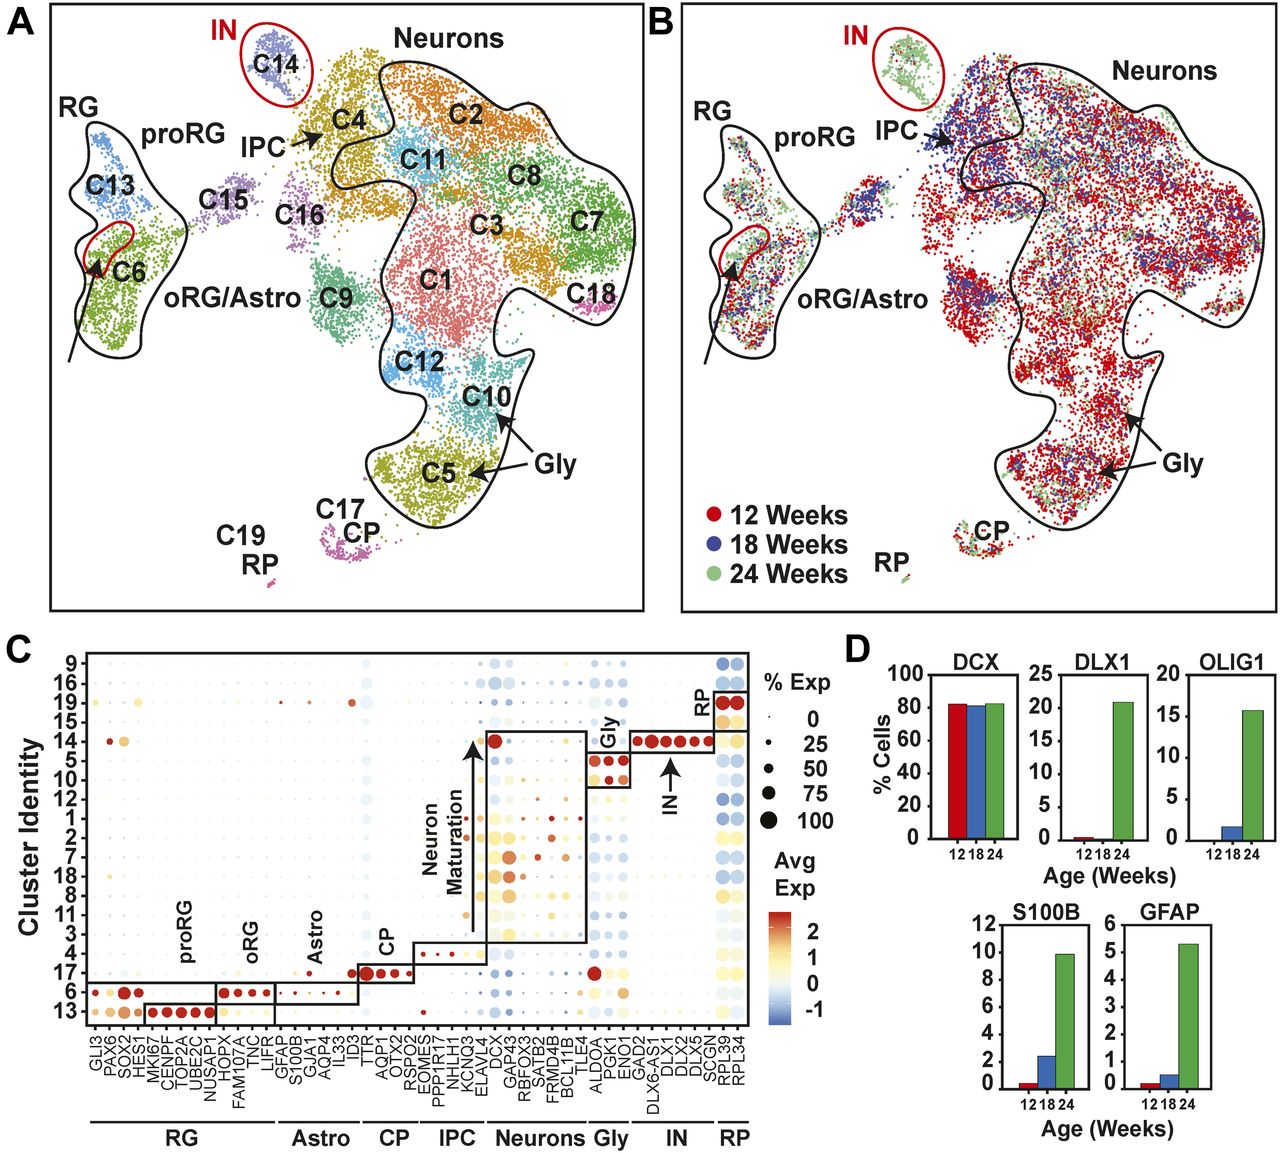
- Figure 4. Characterization of cell type maturation in human cerebral organoids using single-cell RNA sequencing.
(A) Unsupervised clustering of combined single-cell RNA sequencing data from 12-, 18-, and 24-wk-old COs was visualized in Uniform Manifold Approximation and Projection plots. Cell types appearing at 24 wk, including interneurons (IN) in cluster 14 (red circle) and oligodendrocyte progenitors in oRG/astroglial cluster 6, (arrow and red circle) are marked. Cluster identities are indicated. (A, B) Uniform Manifold Approximation and Projection present in (A) segregated by time point. Cells from 12 wk depicted in red, blue for 18 wk, and green for 24 wk. (A, C) A dot blot indicates the expression of cell type–specific marker genes for all clusters in panel (A). The percent of cells expressing the gene (circle diameter) and the scaled average expression of the gene is indicated by the colour. (D) The percent of cells with expression of the indicated cell lineage markers, including DCX (neurons), S100B (mature astrocytes), GFAP (astroglia/astrocytes), DLX1 (interneurons), and OLIG1 (oligodendrocyte precursors) and at 12, 18, and 24 wk time points is plotted. Note the general neuronal marker DCX, which is expressed similarly across the time points, was used as a reference. CP, choroid plexus; GLY, glycolytic signature; IN, interneurons; IPC, intermediate progenitor cells; oRG, outer radial glial cells; proRG, proliferative radial glial; RG, radial glial cells; RP, ribosomal protein.
- Figure S9. Cell type composition of human cerebral organoids (hCOs) changes with maturation.
(A) Cluster frequency analysis depicting the percentage of cells at each time point that contributed to each cluster. (B) Scatterplots showing the expression of cell lineage markers, including DCX (neurons), S100B (mature astrocytes), GFAP (astroglia/astrocytes), DLX1 (interneurons), and OLIG1 (oligodendrocyte precursors) at 12, 18, and 24 wk time points. Note the general neuronal marker DCX, which is expressed similarly across the time points, was used as a reference. (C) Astrocyte in 24-wk-old hCOs. Localization of GFAP (radial glia and astrocytes) and SOX2 (radial glia) in hCOs at 24 wk of age, co-stained with DAPI, was visualized by immunofluorescence microscopy. Scale Bar = 50 μm. CP, choroid plexus; GLY, glycolytic signature; IN, interneurons; IPC, intermediate progenitor cells; oRG/astro, outer radial glial cells/astroglia; proRG, proliferative radial glial; RG, radial glial cells; RP, ribosomal protein.
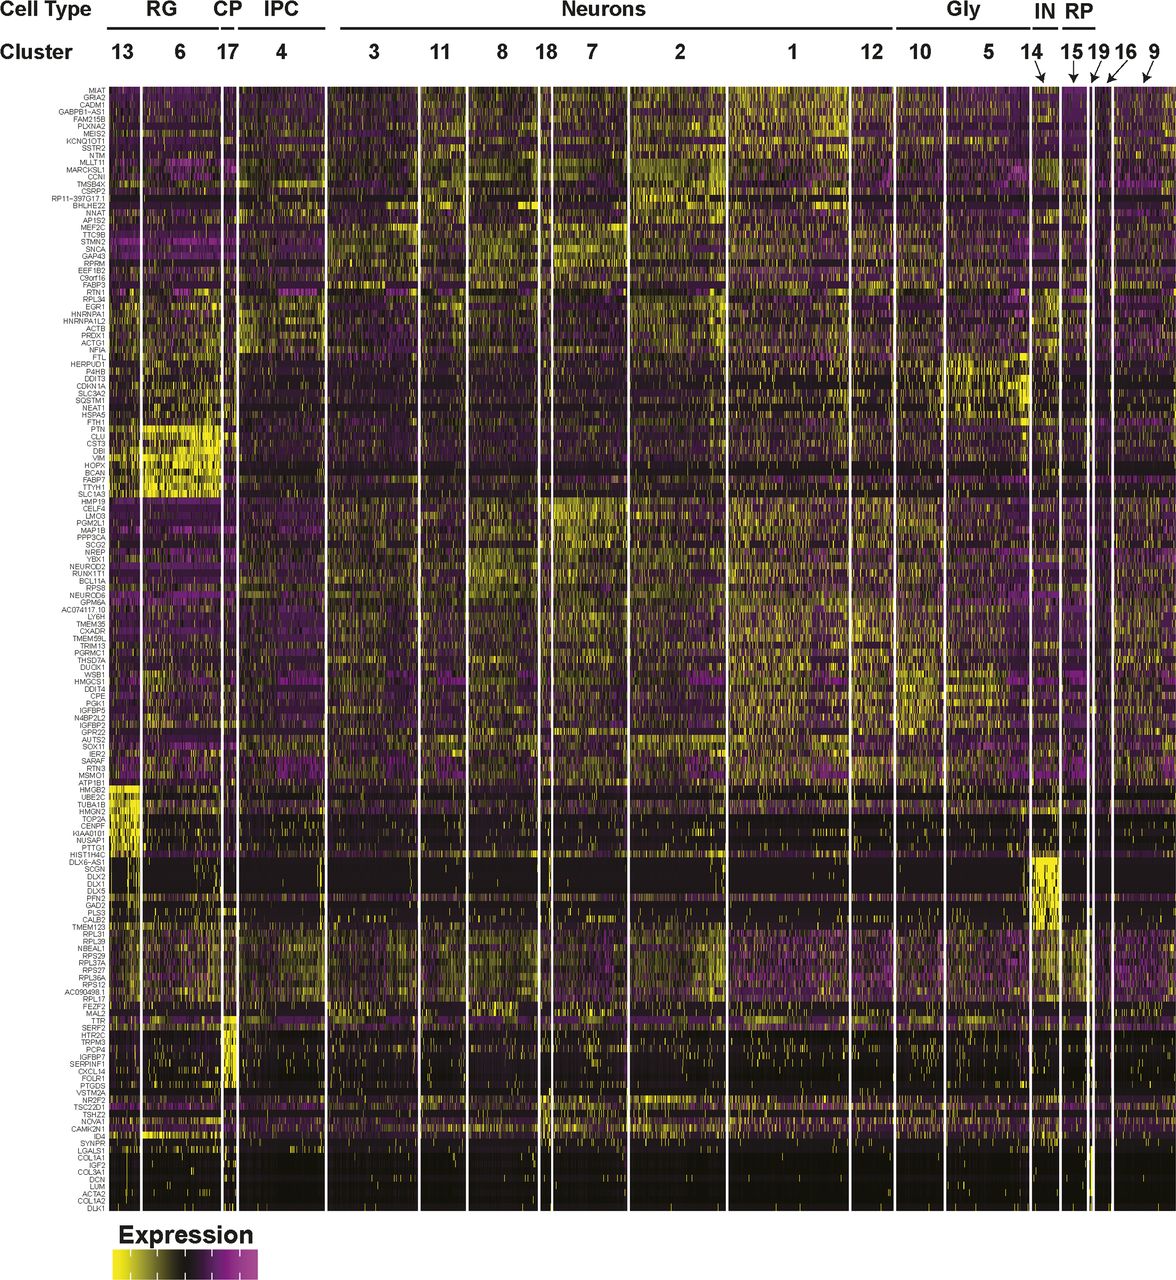
- Figure S10. Gene expression heat map from combined 12-, 18-, and 24-wk-old COs.
The top 10 most differentially expressed genes per cluster are shown.
- Figure 5. Electrophysiological analysis of 12- and 24-wk-old human cerebral organoids using whole cell patch clamping.
(A) Images of recorded developing or mature neurons marked with biocytin taken using 40× water immersion objective are shown. Scale bar = 20 μm. (B) Representative traces from whole cell patch clamping of developing and mature neurons are shown. (C) Peak action potential amplitude ± SD, mean time to peak action potential amplitude ± SEM, and mean action potential decay time ± SEM, for individual recordings are plotted for 8–10 neurons per condition. (D, E) Characterization of spontaneous currents. (D, E) A representative trace of spontaneous AP firing in a mature neuron (D) and of mean frequency ± SEM of spontaneous excitatory postsynaptic currents in developing and mature neurons (E) are shown. (F) Frequency and amplitude of spontaneous IPSCs in developing and mature neurons are plotted as the mean ± SEM for 2–6 neurons per condition.
- Figure S11. Electrophysiological analysis of 12- and 24-wk-old human cerebral organoids using whole cell patch clamping.
(A, B) Na+ (A) and K+ (B) currents in developing and mature neurons analyzed in Fig 4 are plotted ± SEM.


Supplementary Materials
Table S2 Antibody list.


In this Issue
Subjects
Related Articles
Cited By...
- Uniform cerebral organoid culture on a pillar plate by simple and reproducible spheroid transfer from an ultralow attachment well plate
- Uniform cerebral organoid culture on a pillar plate by simple and reproducible spheroid transfer from an ultralow attachment well plate
- Cerebral Organoids Containing an AUTS2 Missense Variant Model Microcephaly
- Organotypic and Microphysiological Human Tissue Models for Drug Discovery and Development--Current State-of-the-Art and Future Perspectives