


Article Figures & Data
Figures
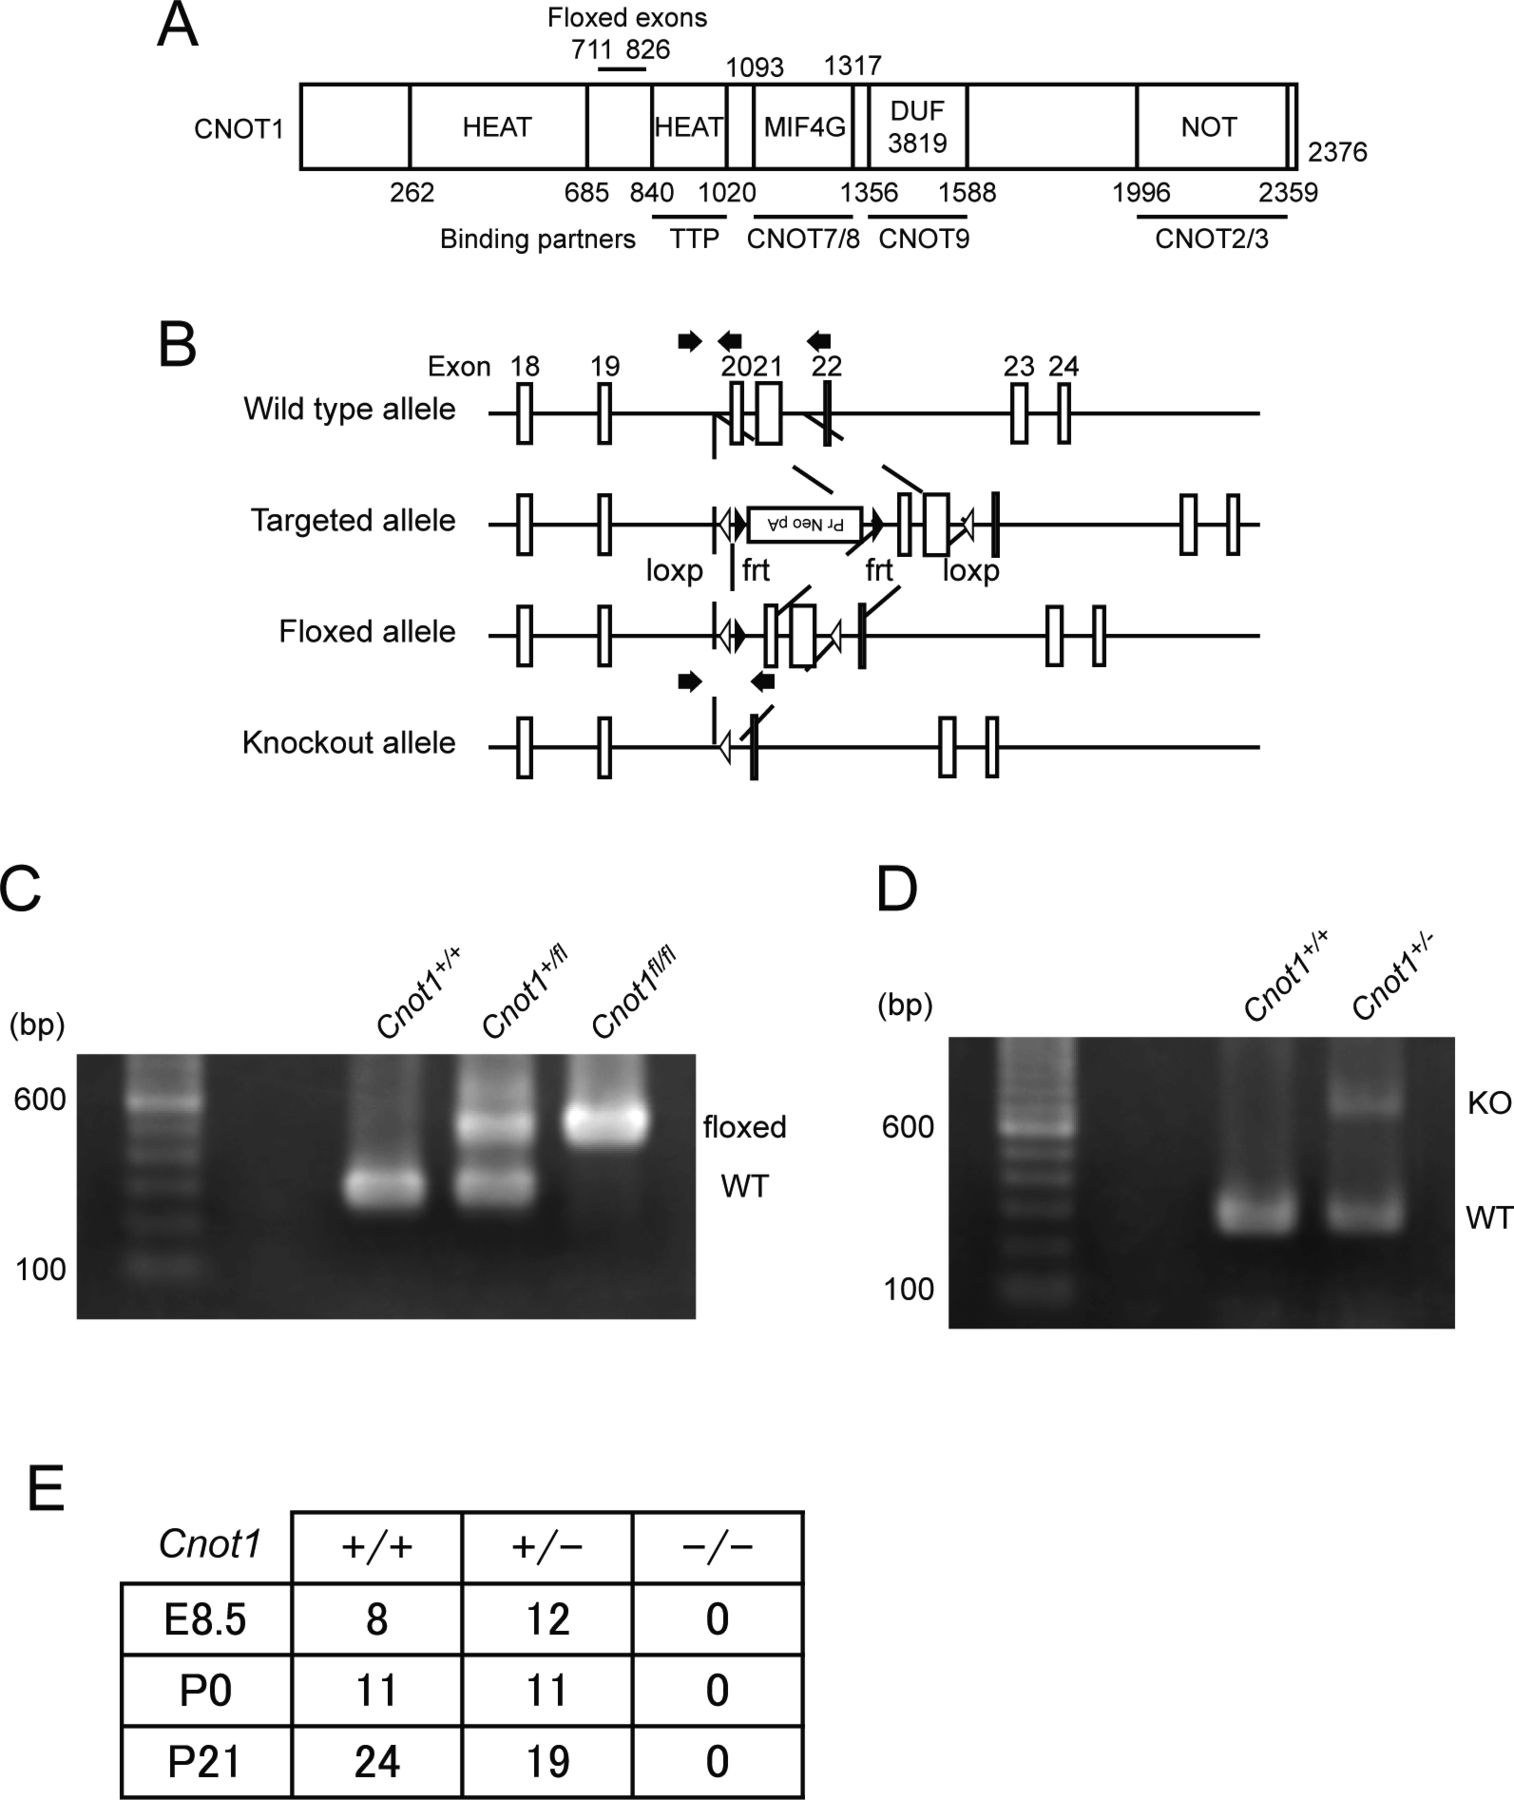
- Figure S1. Generation of Cnot1 conditional and KO mice and embryonic lethality of Cnot1-null mice.
(A) Schematic representation of CNOT1 structure. HEAT and NOT represent HEAT repeat and NOT superfamily homology domain. MIF4G and DUF indicate the middle domain of eukaryotic initiation factor 4G and a domain of unknown function, respectively. Binding regions of known interacting molecules are shown at the bottom. (B) Schematic representation of wild-type, targeted, floxed, and KO alleles. Exons 18–24 (white boxes), loxp sequences (white triangles), frt sequences (black triangles), and the neomycin resistance cassette are shown. Arrows indicate positions of PCR primers for genotyping. (C, D) Genotyping PCR analysis using genomic DNA from mouse tails. The leftmost lane contains molecular weight standards. (B, C, D) Wild-type (WT) and floxed (C), and WT and KO alleles (D) were amplified using specific PCR primer sets indicated in (B). Sizes of amplified products for wild-type, floxed, and KO alleles are 279, 732, and 492 bp, respectively. (E) Cnot1-null mice die in early embryonic development. The table shows the number of embryos and pups with the indicated genotypes obtained from mating of Cnot1-heterozygous pairs.
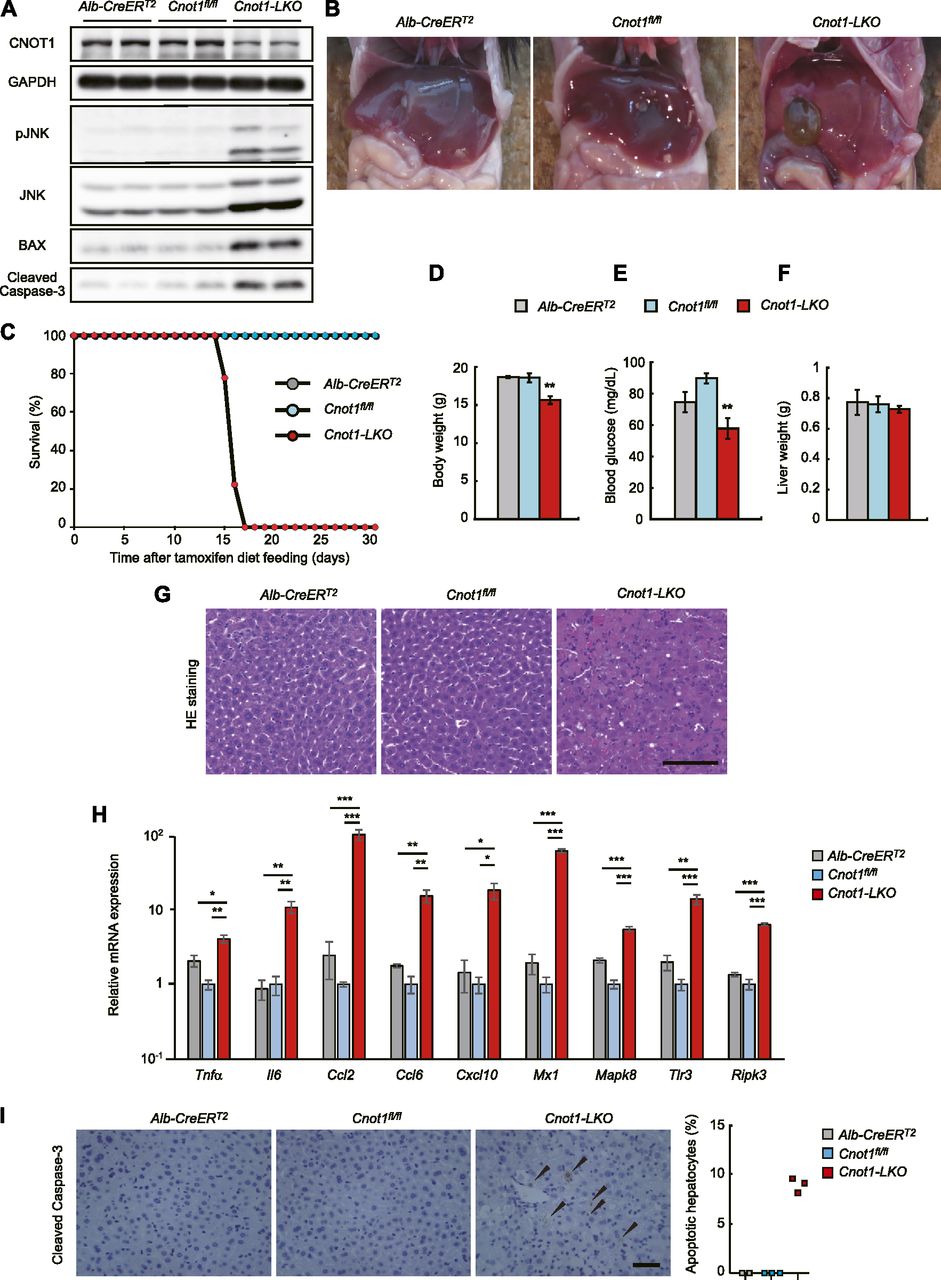
- Figure 1. Liver-specific disruption of Cnot1 causes lethal hepatitis.
(A) Immunoblotting of the indicated molecules in liver lysates from Alb-CreERT2, Cnot1fl/fl, and Cnot1-LKO mice. (B) Gross appearance of livers from Alb-CreERT2, Cnot1fl/fl, and Cnot1-LKO mice. (C) Survival curves of Alb-CreERT2 (n = 4), Cnot1fl/fl (n = 9), and Cnot1-LKO (n = 9) mice after a tamoxifen-containing diet. (D, E, F) Body weights (D), circulating blood glucose levels (E), and liver weights (F) of Alb-CreERT2 (n = 4), Cnot1fl/fl (n = 7), and Cnot1-LKO (n = 9) mice. (G) H&E staining of livers from Alb-CreERT2, Cnot1fl/fl, and Cnot1-LKO mice. Scale bar, 100 μm. (H) Quantitative real-time PCR (qRT-PCR) analysis of the indicated mRNAs in livers from Alb-CreERT2, Cnot1fl/fl, and Cnot1-LKO mice (n = 4). The Rplp0 mRNA level was used for normalization. (I) Immunohistochemistry for Cleaved Caspase-3 in livers from Alb-CreERT2, Cnot1fl/fl, and Cnot1-LKO mice. Scale bar, 100 μm. Right graph shows percentages of Cleaved Caspase-3–positive hepatocytes. Three different fields (total of ∼500 cells) in each section were counted (Alb-CreERT2; n = 2, Cnot1fl/fl and Cnot1-LKO mice; n = 3). Values in graphs represent means ± SEM. Unpaired t test, *P < 0.05, **P < 0.01, ***P < 0.001.
- Figure 2. Elongated poly(A) tails of RNAs in livers from Cnot1-LKO mice.
(A) Poly(A) tail lengths of bulk RNA in livers from Alb-CreERT2, Cnot1fl/fl, and Cnot1-LKO mice. The lower graph shows a densitogram of poly(A) tail lengths in each genotype. Signal intensity was normalized to total intensity (%). Values represent the mean of independent experiments (Alb-CreERT2; n = 2, Cnot1fl/fl and Cnot1-LKO mice; n = 3). (B) Poly(A) tail lengths of the indicated mRNAs in livers from Alb-CreERT2, Cnot1fl/fl, and Cnot1-LKO mice. PCR products of RNAs treated with RNase H in the presence of oligo (dT) primer, which indicates that fragments without poly(A) tails were also loaded.
- Figure 3. Increase of TF-, cell cycle-, and DNA damage-mRNAs and decrease in liver function–related mRNAs in livers from Cnot1-LKO mice.
(A) Scatterplot of mRNA FPKMs in livers from Cnot1fl/fl and Cnot1-LKO mice. Each dot represents the mean of four independent samples. mRNAs that increased or decreased >2-fold in livers from Cnot1-LKO mice compared with those from Cnot1fl/fl mice are shown in red or blue, respectively (Mann–Whitney U-test, false discovery rate < 0.05). (B) Enriched GO categories in which mRNAs increased or decreased >2-fold in livers from Cnot1-LKO mice compared with those from Cnot1fl/fl mice. (C) qRT-PCR analysis of the indicated mRNAs in livers from Alb-CreERT2, Cnot1fl/fl, and Cnot1-LKO mice (n = 4). The Rplp0 mRNA level was used for normalization. Values in graphs represent means ± SEM. Unpaired t test, *P < 0.05, **P < 0.01, ***P < 0.001. (D) Poly(A) tail lengths of the indicated mRNAs in livers from Alb-CreERT2, Cnot1fl/fl, and Cnot1-LKO mice. PCR products of RNAs treated with RNase H in the presence of oligo (dT) primer, which indicates that fragments without poly(A) tails were also loaded.
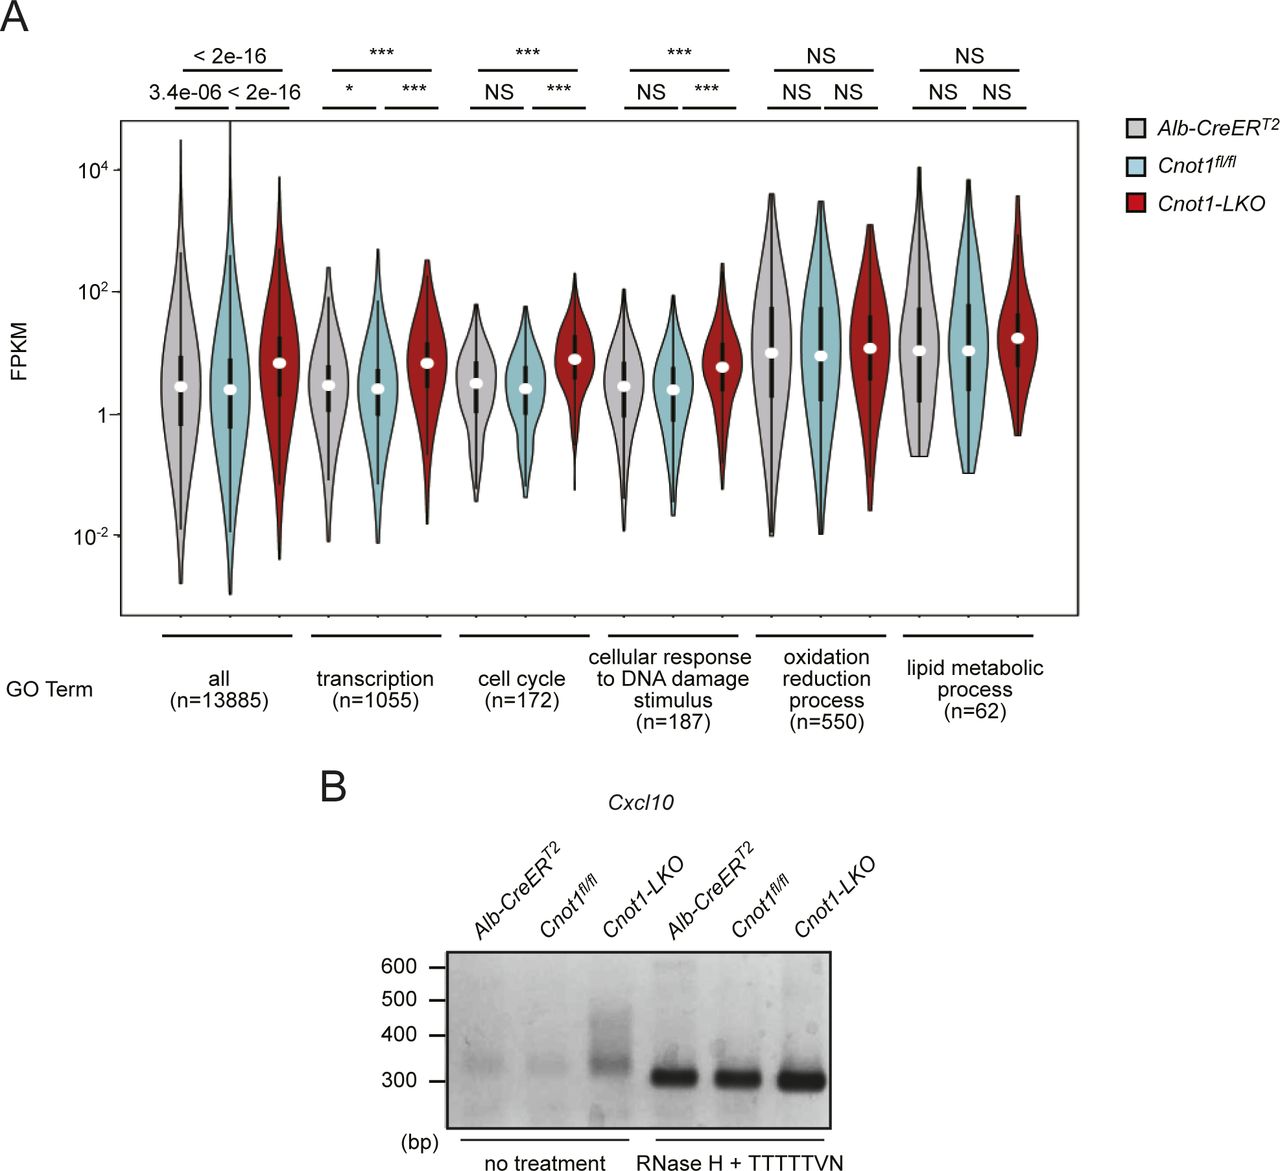
- Figure S2. Global increase in TF-, cell cycle-, and DNA damage-mRNAs in livers from Cnot1-LKO mice and elongated poly(A) tails.
(A) Violin plot of mRNA FPKMs in livers from Alb-CreERT2, Cnot1fl/fl, and Cnot1-LKO mice. Means of four independent samples were used. mRNAs were grouped into the indicated GO terms. Wilcoxon signed-rank test, *P < 0.05, ***P < 0.001. (B) Poly(A) tail lengths of Cxcl10 mRNA in livers from Alb-CreERT2, Cnot1fl/fl, and Cnot1-LKO mice. PCR products of RNAs treated with RNase H in the presence of oligo (dT) primer, which indicates that fragments without poly(A) tails, were also loaded.
- Figure S3. Immunoprecipitation with anti-CNOT3 antibody isolated intact CCR4–NOT complexes and bound mRNAs in liver.
(A) Anti-CNOT3 immunoprecipitates were prepared from mouse liver lysates and analyzed by immunoblotting with the indicated antibodies. (B) Liver lysates were fractionated by gel filtration chromatography and analyzed by immunoblotting with the indicated antibodies. (C, D) RNAs were prepared from anti-CNOT3 immunoprecipitates using total liver lysates (C) or isolated hepatocyte lysates (D). Immunoprecipitated RNAs were analyzed by qPCR for the indicated genes (n = 3). mRNAs in control IgG immunoprecipitates were set to one. Values in the graph represent means ± SEM. Unpaired t test, *P < 0.05, ***P < 0.001. ns, not significant.
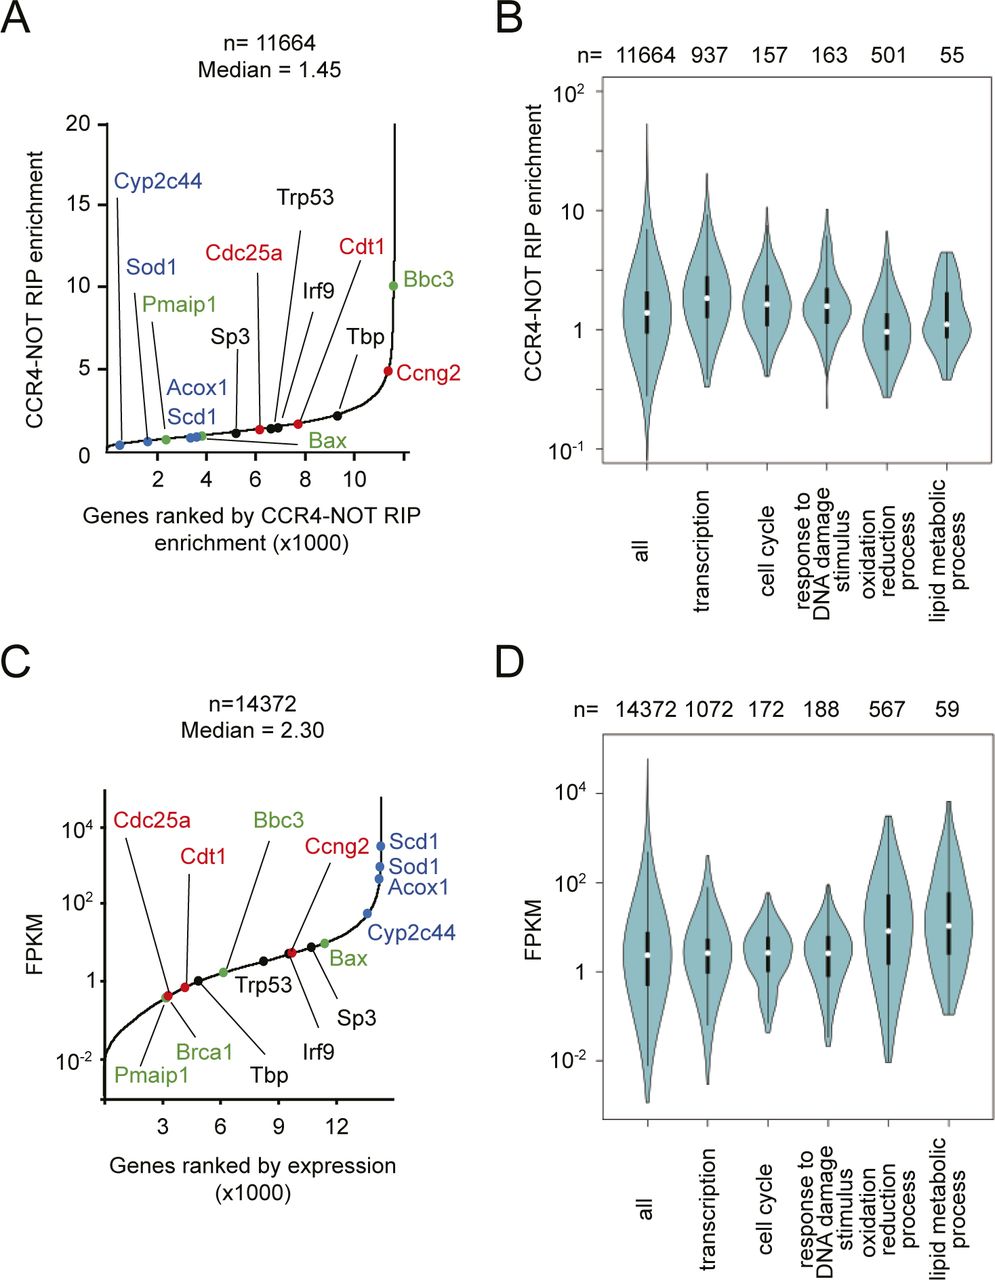
- Figure 4. The CCR4–NOT complex preferentially binds to TF-, cell cycle-, and DNA damage-mRNAs and maintains their expression at low levels.
(A) mRNAs were ordered according to their CCR4–NOT–RIP enrichment values. The x-axis represents ranking in ascending order. The CCR4–NOT–RIP enrichment value represents gene FPKMs in RNA included in the anti-CNOT3 immunoprecipitates normalized against gene FPKMs in the liver total RNA (Input). Means of the values in three independent experiments were used. Representative mRNAs possessing specific functions are shown in red (cell cycle), black (transcription), green (DNA damage response), and blue (metabolism). (A, B) Violin plot of CCR4–NOT–RIP enrichment values calculated in (A) for all mRNAs, and those categorized in the indicated GO terms. (C) mRNAs were ordered according to their FPKMs in livers from control mice (means of the values in four mice). (A) The x-axis represents ranking in ascending order. Representative mRNAs are shown as in (A). (B, D) Violin plot of FPKMs for all mRNAs and grouped mRNAs as in (B). (E) Scatterplot of CCR4–NOT–RIP enrichment values and mRNA FPKMs in livers from control mice. (F) Calculation of mRNA half-lives using RNA-seq results of liver total RNAs, which were prepared from Act. D–injected control (Cnot1fl/fl) mice, are described in the Materials and Methods section. mRNAs were ordered according to lengths of their half-lives. The x-axis represents ranking in ascending order. (A) Representative mRNAs are shown as in (A). (B, F, G) Violin plot of mRNA half-lives calculated in (F) for all mRNAs and grouped mRNAs as in (B). (H) Scatterplot of CCR4–NOT–RIP enrichment values and mRNA half-lives in livers from control mice. (I) Scatterplot of mRNA half-lives and FPKMs in livers from control mice. (E, H, I) Spearman’s rank correlation coefficients (rho) and P-values were calculated (E, H, I). (A, F) Note that representative mRNAs missing in (A) and (F) did not satisfy criteria for the analyses (see the Materials and Methods section).
- Figure S4. Comparisons of CCR4–NOT–RIP enrichment values and FPKMs in mRNAs expressed in liver.
(A) mRNAs were ordered according to their CCR4–NOT–RIP enrichment values. The x-axis represents ranking in ascending order, as in Fig 4A. Medians of the values in three independent experiments were used. Representative mRNAs with specific functions are shown in red (cell cycle), black (transcription), green (DNA damage response), and blue (metabolism). (A, B) Violin plot of CCR4–NOT–RIP enrichment values calculated in (A) for all mRNAs, and those categorized in the indicated GO terms. (C) mRNAs were ordered according to their FPKMs in livers from control mice. The x-axis represents ranking in ascending order, as in Fig 4C. Medians of the values in four mice were used. (A) Representative mRNAs are shown as in (A). (B, D) Violin plot of FPKMs for all mRNAs and the grouped mRNAs as in (B).
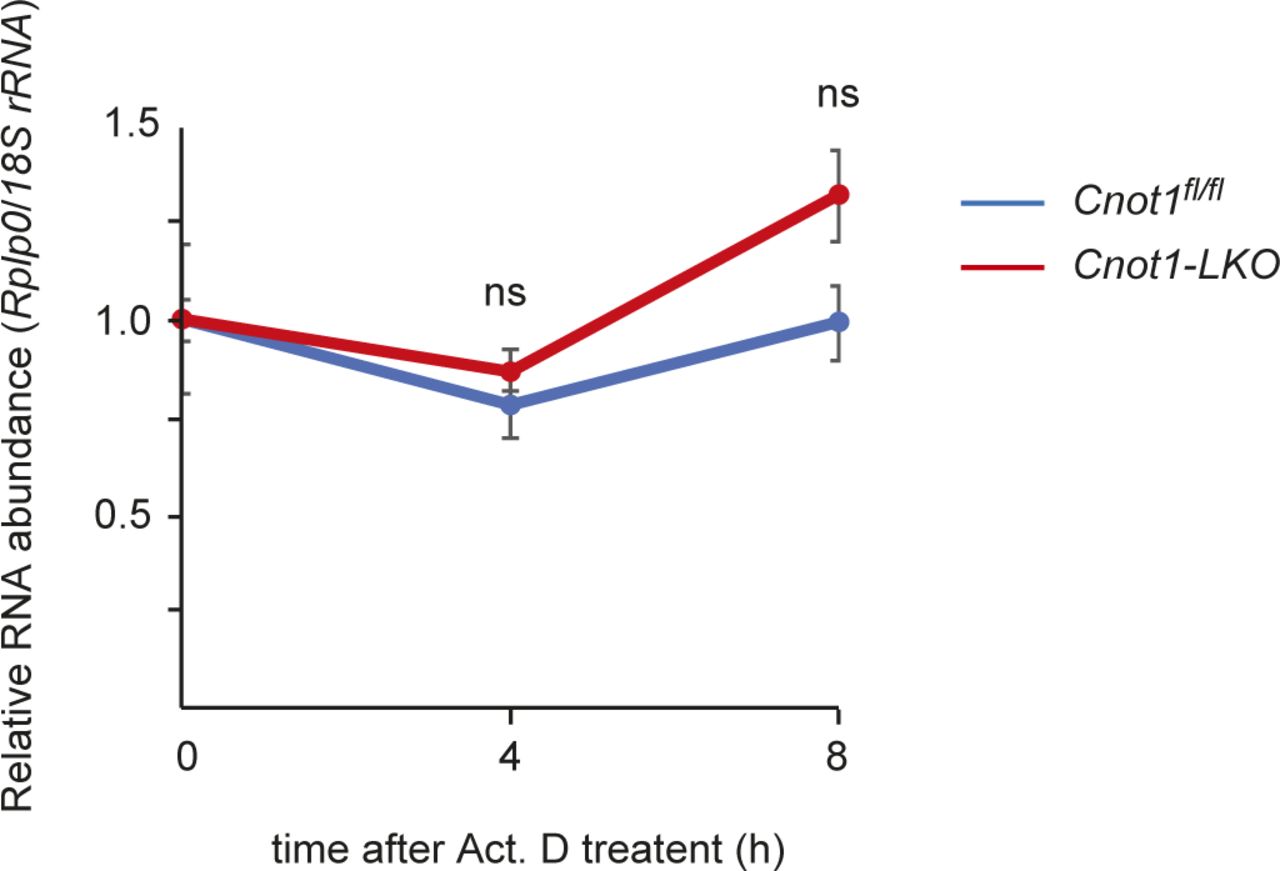
- Figure S5. Rplp0 mRNA is stable during Act. D treatment.
qPCR analysis of Rplp0 mRNA in the livers from Act. D–injected Cnot1fl/fl and Cnot1-LKO mice (n = 3). 18S rRNA level was used for normalization. Values in graph represent means ± SEM. Level of Rplp0 mRNA at 0 h is set to one. ns, not significant compared with 0 h.
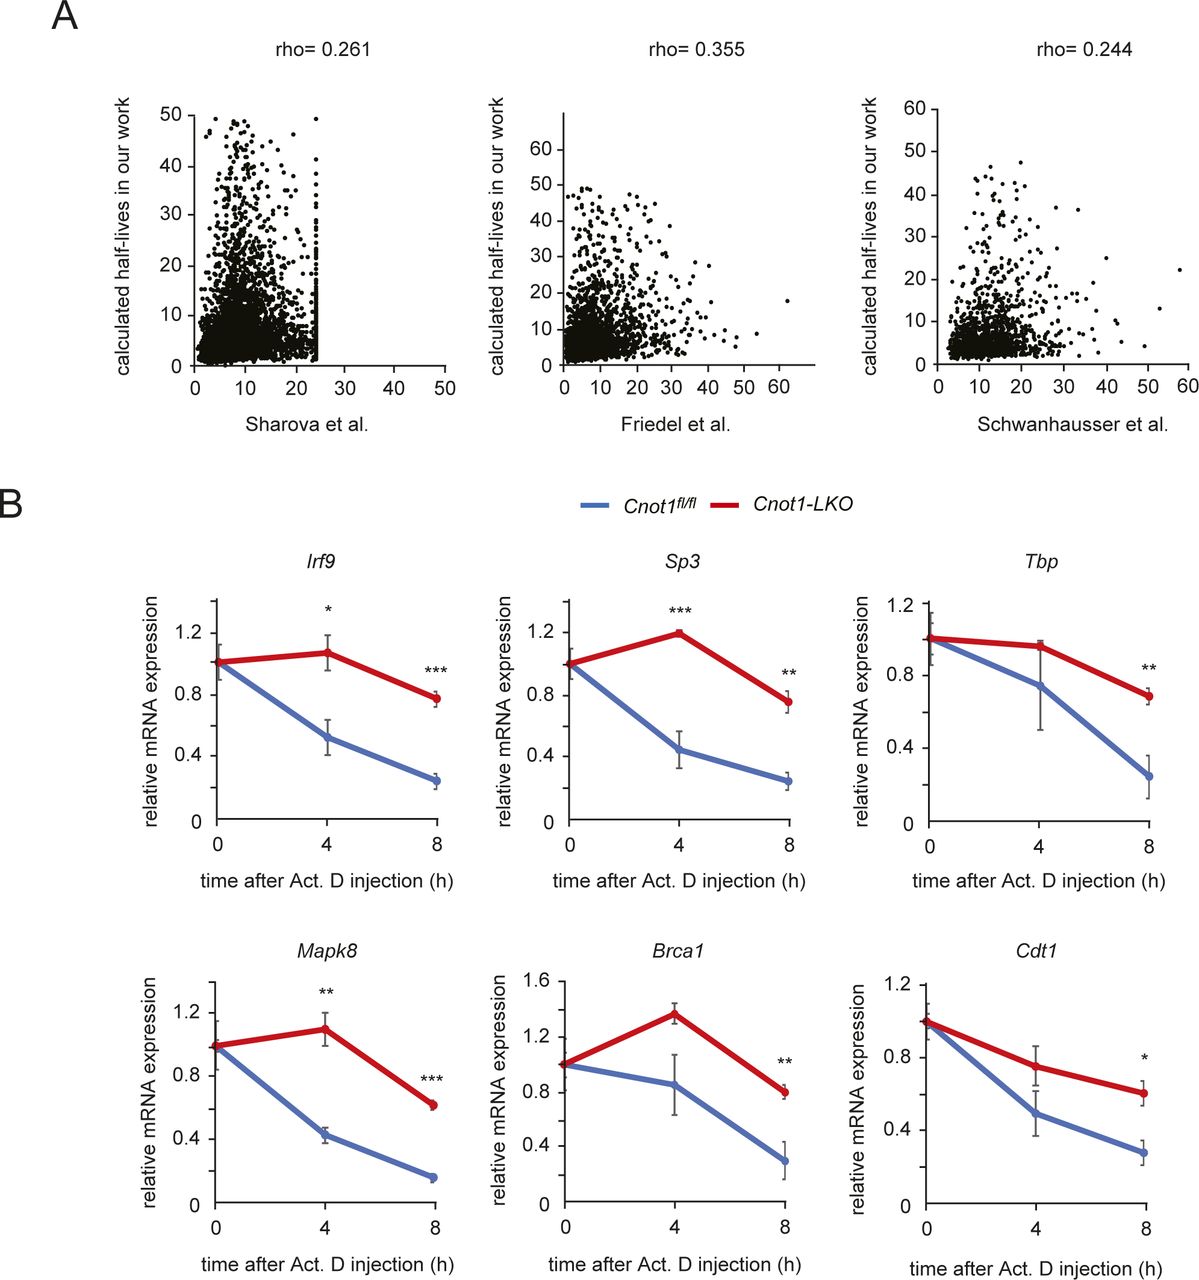
- Figure S6. Characterization of Act. D chase experiments in mice.
(A) Comparison of mRNA half-lives with other data. Scatterplot of half-lives (h) measured in mouse cells and those measured in mouse livers. Pearson’s correlation coefficient was used to quantify the strength of association between data and to evaluate statistical significance. (P < 0.001). Rho values in “Sharova et al (2009) versus Friedel et al (2009),” “Sharova et al (2009) versus Schwanhausser et al (2011)” and “Friedel et al (2009) versus Schwanhausser et al (2011)” are 0.376, 0.360, and 0.363, respectively (Friedel et al, 2009; Sharova et al, 2009; Schwanhausser et al, 2011). See the Materials and Methods section for calculating half-lives using RNA-seq. (B) Decay curves of selected mRNAs obtained from RNA-seq results. Gene FPKMs determined by RNA-seq were normalized to the Rplp0 FPKM. mRNA level without Act. D treatment (0 h) was set to one. Values in graphs represent means ± SEM. 0 h (no injection, n = 4), 4 h (n = 3 in control, n = 4 in Cnot1-LKO), and 8 h (n = 3 in control, n = 5 in Cnot1-LKO). Unpaired t test, *P < 0.05, **P < 0.01, ***P < 0.001.
- Figure 5. Elongated half-lives of mRNAs in livers from Cnot1-LKO mice, and correlation between mRNA stabilization and RIP enrichment.
(A) Scatterplot of mRNA half-lives in livers from control (Cnot1fl/fl) and Cnot1-LKO mice. Calculation of mRNA half-lives in livers from Cnot1-LKO mice was performed as in Fig 4F (see the Materials and Methods section). mRNAs with half-lives elongated or shortened in livers from Cnot1-LKO mice by more than twofold compared with those from Cnot1fl/fl mice, are shown in red or blue, respectively. (B) Violin plot of half-lives for all mRNAs and those categorized in the indicated GO terms in the livers from control (Cnot1fl/fl) and Cnot1-LKO mice. (C) Violin plot of CCR4–NOT–RIP enrichment values in livers from control (Cnot1fl/fl) mice (means of three independent experiments) for all mRNAs, stabilized, destabilized, and unchanged mRNAs (changes in half-lives: Cnot1-LKO/control >2.0, <0.5, and the others, respectively). (D) Scatterplot of CCR4–NOT–RIP enrichment values and changes in FPKMs in livers (Cnot1-LKO/control). (E) Scatterplot of CCR4–NOT–RIP enrichment values and changes of mRNA half-lives in livers (Cnot1-LKO/control). (D, E) Spearman’s rank correlation coefficient (rho) and P-value were calculated (D, E). (B, C) Wilcoxon signed-rank test (B) and Wilcoxon rank sum test (C) were used. *P < 0.05, **P < 0.01, ***P < 0.001.
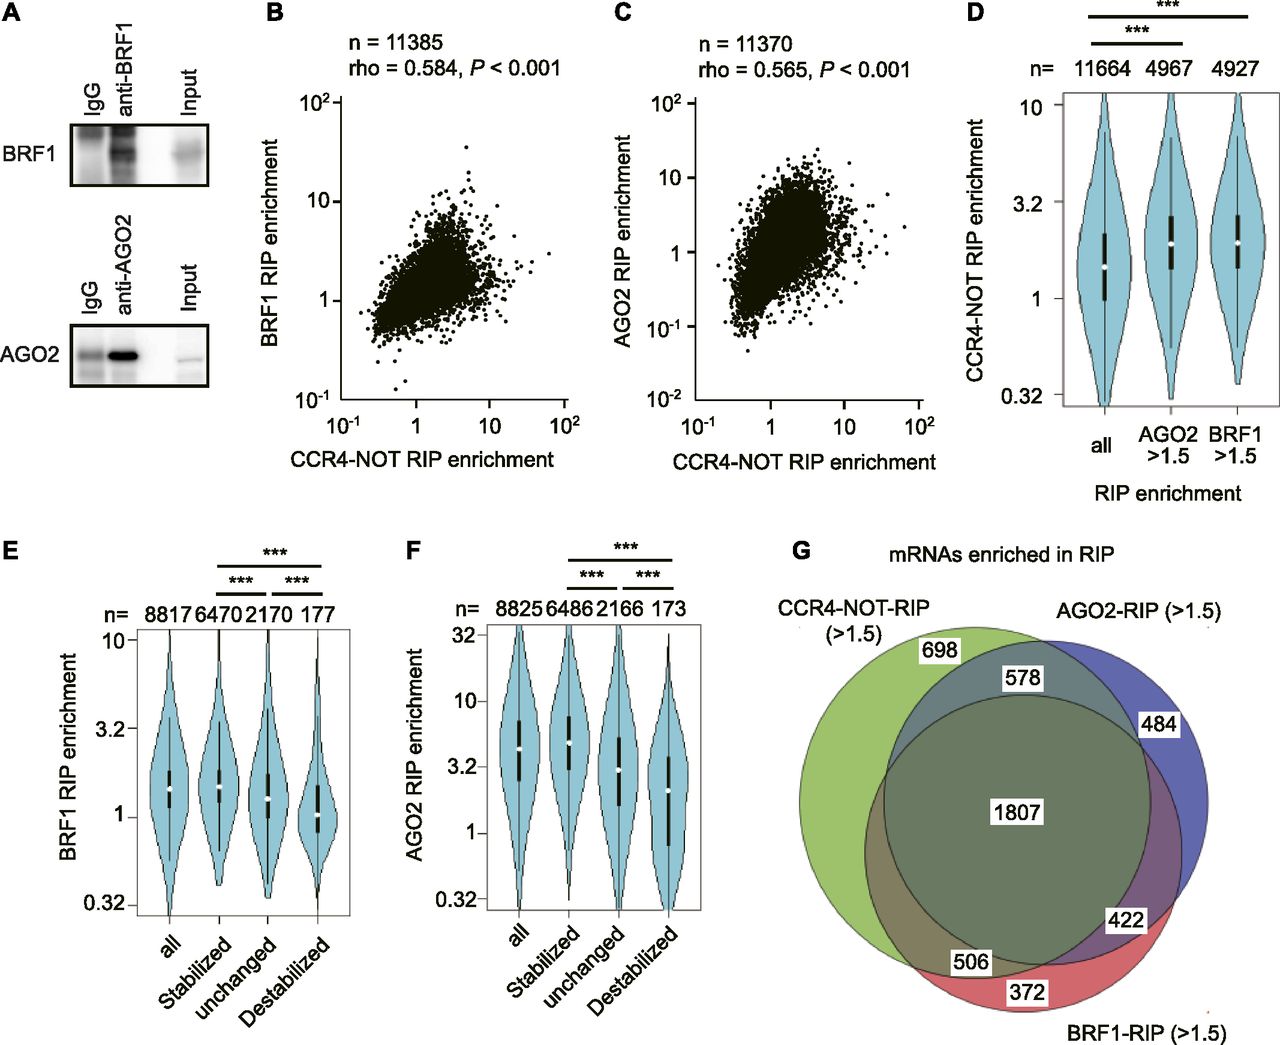
- Figure 6. The CCR4–NOT complex destabilizes mRNAs mainly through BRF1 and AGO2 in liver.
(A) Immunoblot analysis of anti-BRF1 (upper) or anti-AGO2 (lower) immunoprecipitates that were used for RIP-seq. (B, C) Scatterplots of CCR4–NOT–RIP enrichment values versus BRF1–RIP enrichment values (BRF1–RIP FPKM/Input FPKM) (B), or versus AGO2–RIP enrichment values (AGO2–RIP FPKM/Input FPKM) (C) in livers from control mice. (D) Violin plot of CCR4–NOT–RIP enrichment values in all mRNAs, BRF1-bound mRNAs (BRF1–RIP enrichment values > 1.5), and AGO2-bound mRNAs (AGO2–RIP enrichment values > 1.5) in livers from control mice. (E, F) Violin plots of BRF1–RIP (E) or AGO2–RIP (F) enrichment values for all mRNAs and grouped mRNAs, as in Fig 5C. (G) Venn diagram of mRNAs showing elongated half-lives in livers from Cnot1-LKO mice (changes in half-lives: Cnot1-LKO/control >2.0). mRNAs with RIP enrichment values more than 1.5 in CCR4–NOT–RIP (green), BRF1–RIP (red), and AGO2–RIP (blue) were compared. (B, C, D, E, F) Means of values in three independent experiments were used (B, C, D, E, F). (B, C) Spearman’s rank correlation coefficient (rho) and the P-value were calculated (B, C). (D, E, F) Wilcoxon rank sum test (D, E, F), *P < 0.05, **P < 0.01, ***P < 0.001.
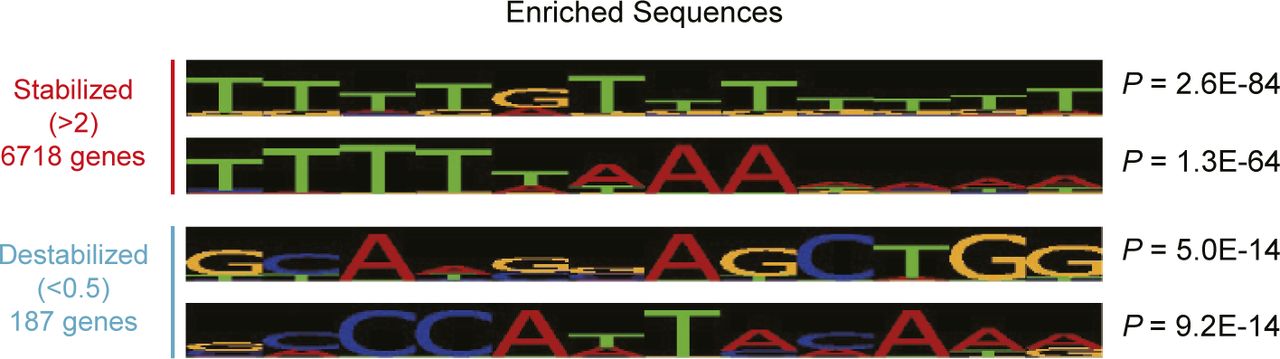
- Figure S7. Characteristics of stabilized and destabilized mRNAs in livers from Cnot1-LKO mice.
Enriched sequences in 3′UTRs of stabilized (half-lives, Cnot1-LKO/control >2.0) and destabilized mRNAs (half-lives, Cnot1-LKO/control <0.5) were analyzed using Amadeus.
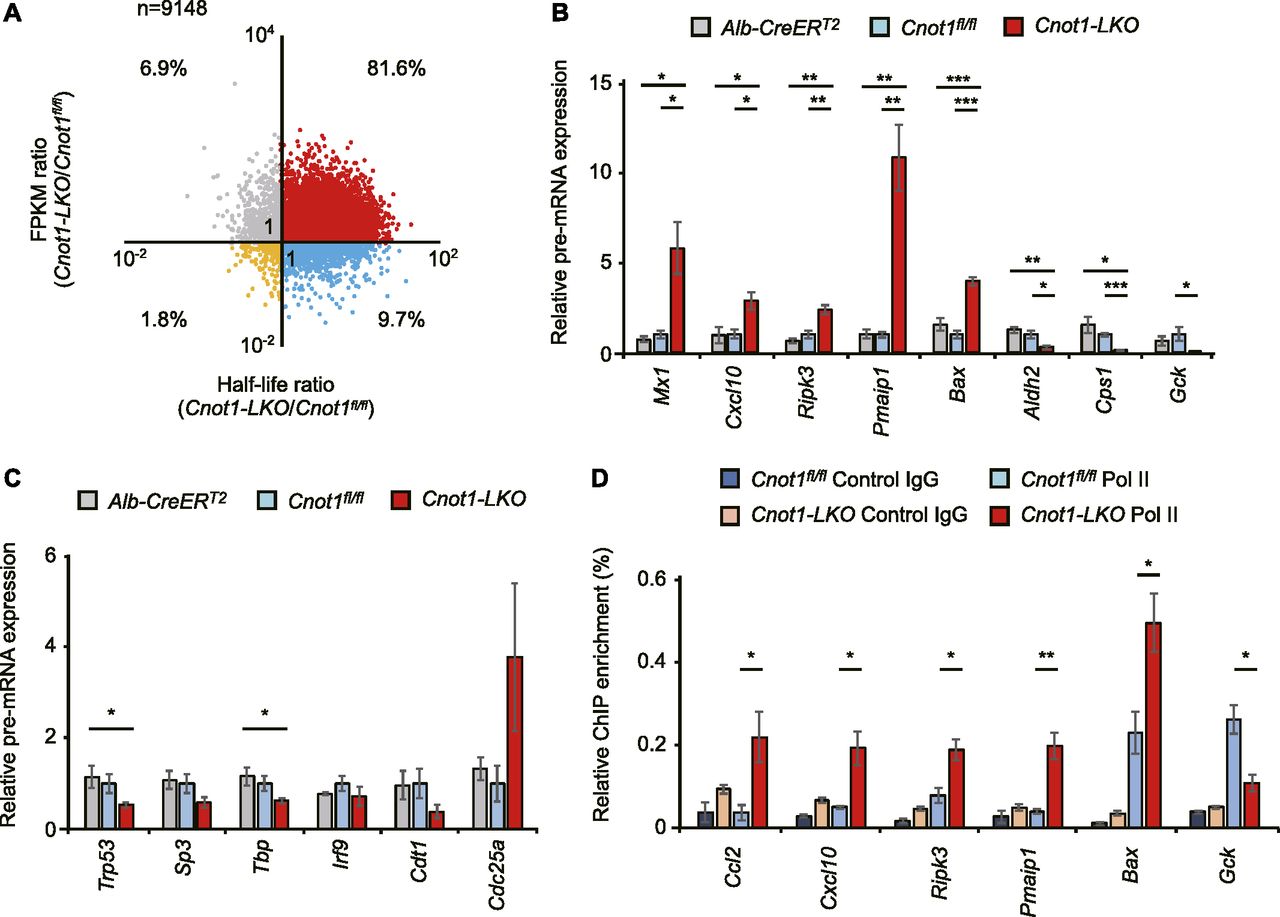
- Figure 7. Increase in immune system process- and apoptosis-genes and decrease in liver-related genes at pre-RNA levels in livers from Cnot1-LKO mice partly reflect changes in transcription.
(A) Scatterplot of changes in mRNA half-lives and FPKMs (Cnot1-LKO/control). (B, C) qRT-PCR analysis of the indicated pre-mRNAs in livers from control (Alb-CreERT2 and Cnot1fl/fl) and Cnot1-LKO mice (n = 4). Pre-mRNA levels were normalized with the Rplp0 pre-mRNA level. (D) ChIP-assay using the antibody against RNA polymerase II (Pol II) or control IgG. qRT-PCR analysis of co-immunoprecipitated genome DNA fragments in livers from control (Cnot1fl/fl) and Cnot1-LKO mice was performed using primers in genomic regions of the indicated genes. Percentages against input genome DNA were calculated (n = 3). Values in graphs represent means ± SEM. Unpaired t test, *P < 0.05, **P < 0.01, ***P < 0.001.
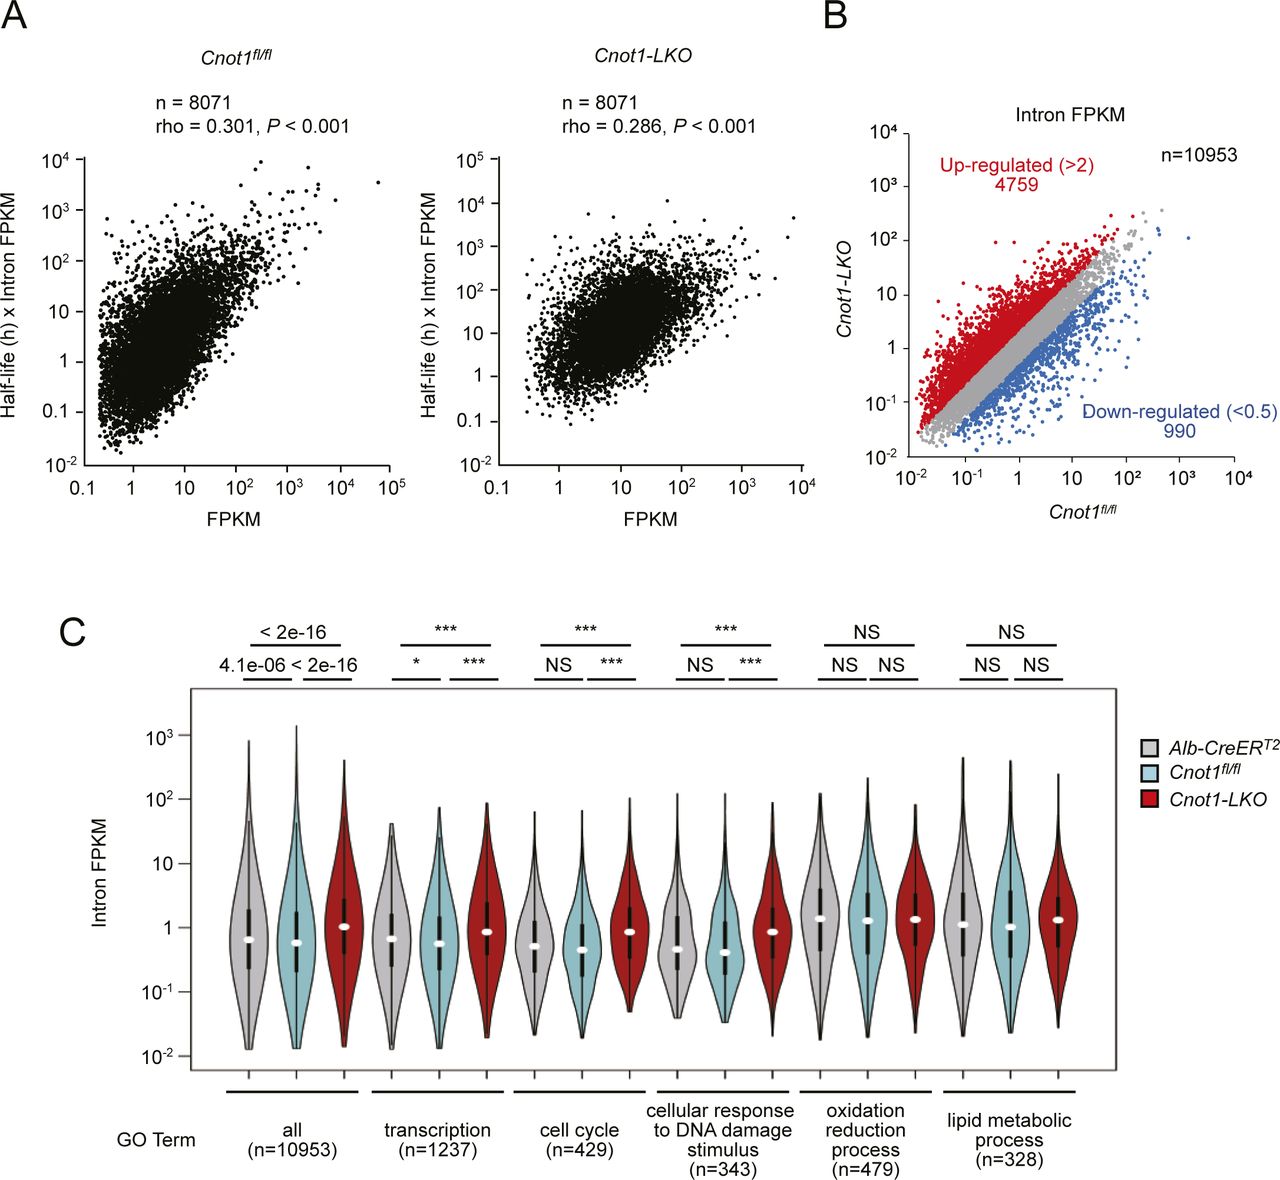
- Figure S8. Differential expression of pre-mRNAs in livers between control and Cnot1-LKO mice.
(A) Correlation between measured mRNA levels (FPKM) and calculated levels (mRNA half-life × intron FPKM). Scatterplots of FPKMs obtained from RNA-seq (X axes) and multiplication of mRNA half-lives and intron FPKMs (Y axes) in livers from control (left) and Cnot1-LKO mice (right). The Pearson’s correlation coefficient (rho) and P-value were calculated. (B) Scatterplot of intron FPKMs in livers from control (Cnot1fl/fl) and Cnot1-LKO mice. Each dot represents the mean of four independent samples. Genes that increased or decreased in livers from Cnot1-LKO mice more than twofold compared with those from Cnot1fl/fl mice, are shown in red or blue, respectively. No statistical significance was detected (Mann–Whitney U-test). (C) Violin plot of intron FPKMs for genes categorized in the indicated GO terms in livers from control (Alb-CreERT2 and Cnot1fl/fl) and Cnot1-LKO mice. Means of intron FPKMs in four independent experiments were used. Wilcoxon signed-rank test, *P < 0.05, ***P < 0.001.
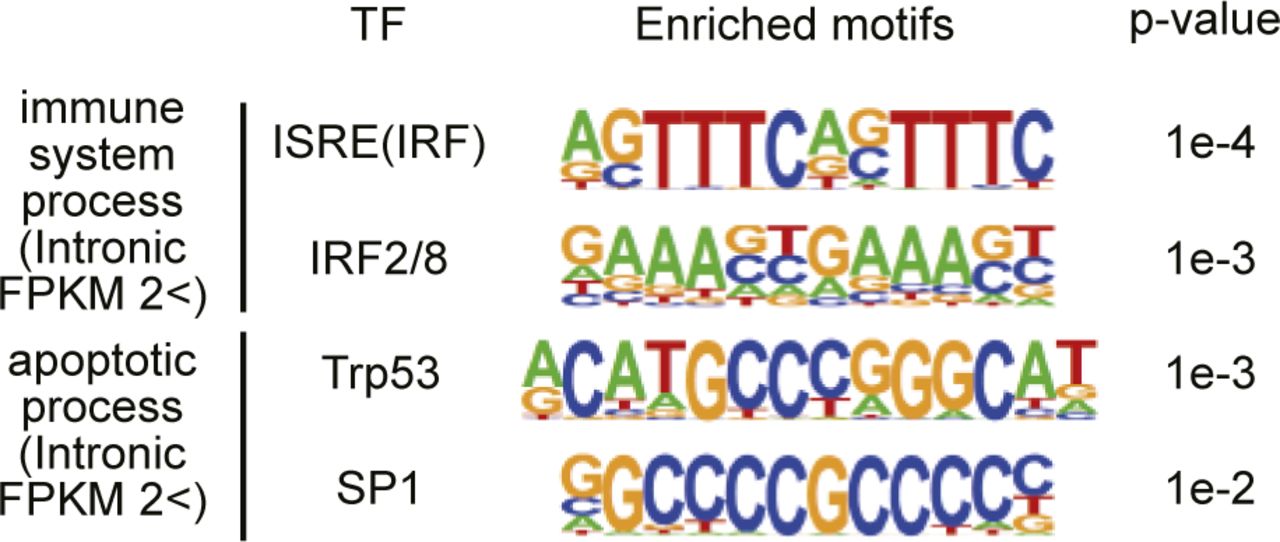
- Figure S9. Enrichment of IRF or Trp53 binding motifs in promoter regions of apoptosis- or immune system process-genes that increased in livers from Cnot1-LKO mice.
Enriched sequences in immune system process- (n = 122) or apoptosis genes (n = 194), which increased in the livers from Cnot1-LKO mice compared with those from control mice >2.0-fold at pre-mRNA levels were analyzed using HOMER software. Promoter regions (from 200 bp upstream to the transcription start site) were used. Consensus motifs for transcription factors are shown.
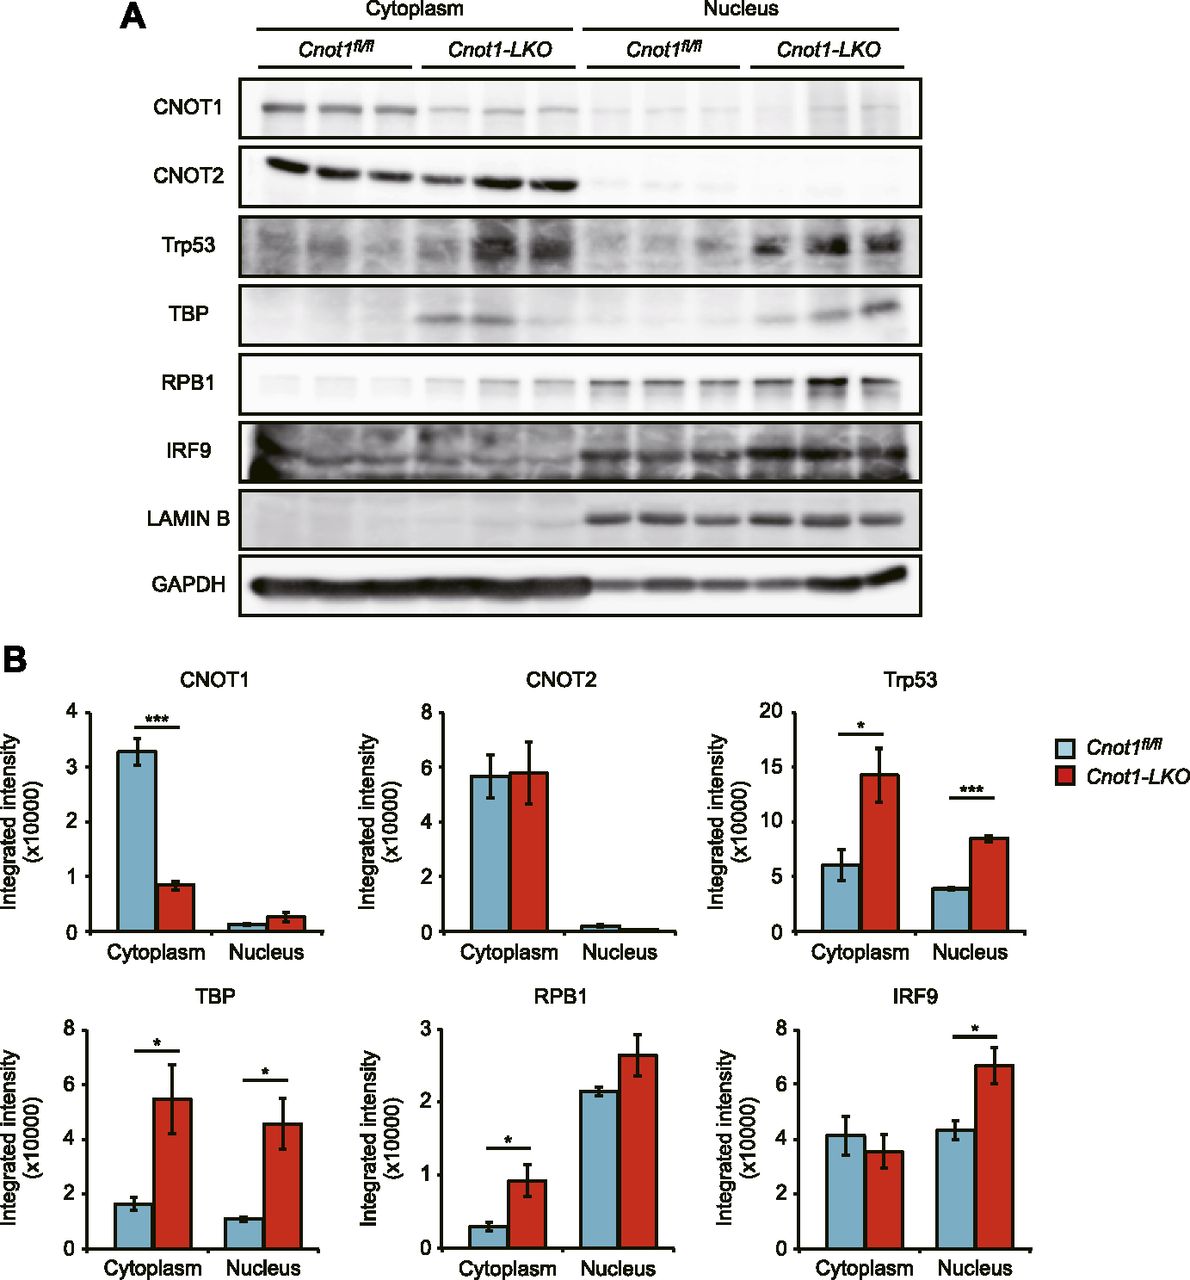
- Figure 8. Cytoplasmic localization of CCR4–NOT complex subunits.
(A) Immunoblot analysis of cytoplasmic and nuclear fractions isolated from livers of control (Cnot1fl/fl) and Cnot1-LKO mice using the indicated antibodies (n = 3). (A, B) Quantification of the immunoblot results in (A). Proteins in the cytoplasmic and nuclear fractions were normalized with GAPDH and LAMIN B, respectively. Values in graphs represent means ± SEM. Unpaired t test, *P < 0.05, ***P < 0.001.


Tables
Sample name Inflammationa Steatosisb Hepatocellular necrosisc Histological score (0–9) Cnot1-LKO 1 3 0 3 6 Cnot1-LKO 2 3 0 3 6 Cnot1 (fl/fl) 1 0 0 0 0 Cnot1 (fl/fl) 2 0 0 0 0 Alb-CreERT2 1 0 1 0 1 Alb-CreERT2 2 0 0 0 0 ↵a 0, no inflammation; 1, mild lymphocytic infiltration in the portal triad; 2, severe lymphocytic infiltration in portal triad; 3, extended infiltration of lymphocytes throughout the liver.
↵b 0, no steatosis; 1, microsteatosis; 2, microsteatosis and mild macrosteatosis; 3, severe macrosteatosis.
↵c 0, no necrosis; 1, mild necrosis; 2, moderate necrosis; 3, severe necrosis.
Cnot1 (fl/fl) (n = 3) Cnot1-LKO (n = 3) P-value AST (IU/L) 3.17E+02 ± 44.6 5.26E+03 ± 1.5E+03 9.36E−03 ALT (IU/L) 3.60E+01 ± 1.15 9.48E+03 ± 2.64E+03 2.33E−02 ALP (IU/L) 1.16E+03 ± 88.8 1.06E+04 ± 1.04E+03 8.16E−04 LDH (IU/L) 1.01E+03 ± 73.6 6.94E+03 ± 8.32E+02 2.08E−03 Values represent means ± SEM.
Statistical significance was determined by t test.
Table S3 CCR4–NOT–RIP enrichment values.
Table S5 FPKMs in livers from control mice.
Table S7 BRF1–RIP enrichment values.
Table S8 AGO2–RIP enrichment values.


In this Issue
Subjects
Related Articles
Cited By...
- No citing articles found.