


Article Figures & Data
Figures
- Figure 1. Morphological changes in the ER and mitochondria during brown adipocyte (BA) differentiation.
(A) Schematic representation of the BA preparation method used in this study. Primary brown preadipocytes were grown to confluence (day 2) and cultured with differentiation induction medium beginning on day 0. After initiation of differentiation, the cell culture medium was changed to differentiation enhancement medium on day 2 and replaced with fresh medium on day 4. Cells on day 6 were used as differentiated BAs. siRNA transfection and retroviral transduction were performed on the indicated days. (B) Electron micrographs (EMs) of brown preadipocytes and BAs on day 0, 2, 4, and 6. Mitochondria and the ER have been false-coloured in green and red, respectively. The yellow lines denote ER–mitochondria contact sites (sites with <30 nm of distance between two membranes). (C, D) Quantification of the ER (C) and mitochondrial (D) perimeters in EMs. Total length of the ER or mitochondrial perimeters in one EM was calculated with ImageJ software. Data are shown as the average from over 20 EMs (n = 3 independent experiments). (E, F) Quantification of intracellular ATP content in BAs during differentiation. The cells were treated with or without 1 μg/ml oligomycin A for 45 min. (E, F) OXPHOS-dependent ATP production (F) was calculated from the total intracellular ATP content (E) and the oligomycin A–insensitive intracellular (glycolysis-dependent) ATP content. The data are shown as the percentage relative to total intracellular ATP content at each day (n = 3 independent experiments). (G, H, I) Measurement of basal oxygen consumption rate (OCR) (G) and extracellular acidification rate (ECAR) (H). (I) On day 0, 2, 4, and 6, the OCR and ECAR of brown preadipocytes and BAs were measured using a Seahorse analyser and XF Cell Mito stress test kit, and the basal OCR and basal OCR/ECAR (I) were calculated as described in the Materials and Methods section. Data were normalized by total protein content (n = 3 independent experiments). (J, K) Expression levels of OXPHOS complexes (J) and mitochondrial and ER proteins (K) during BA differentiation. The cells were lysed on the indicated days and analysed by immunoblotting using the indicated antibodies. GPR94 and GRP78 protein was detected by a KDEL antibody. Actin was used as a loading control. (L, M, N) Quantification of ER–mitochondria contact site in EMs. (L) Total length of contact site in one EM was calculated with ImageJ software (L). The data are shown as the average from 20 EMs (n = 3 independent experiments). (M, N) ER–mitochondria contact length was normalized to the ER (M) or mitochondrial (N) perimeter and shown as percentage. Data information: data are presented as mean ± SEM. *P < 0.05, **P < 0.01, ***P < 0.001, ****P < 0.0001 (t test). LD, lipid droplet.
- Figure S1. Electron micrographs of brown adipocytes at each stage of differentiation.
Primary brown preadipocytes were cultured on sterile glass coverslips, differentiation was induced, and the cells were harvested on days 0, 2, 4, and 6. The cells were washed with PBS, fixed, and imaged by electron microscopy (arrows, mitochondrion; LD, lipid droplet; N, nucleus).
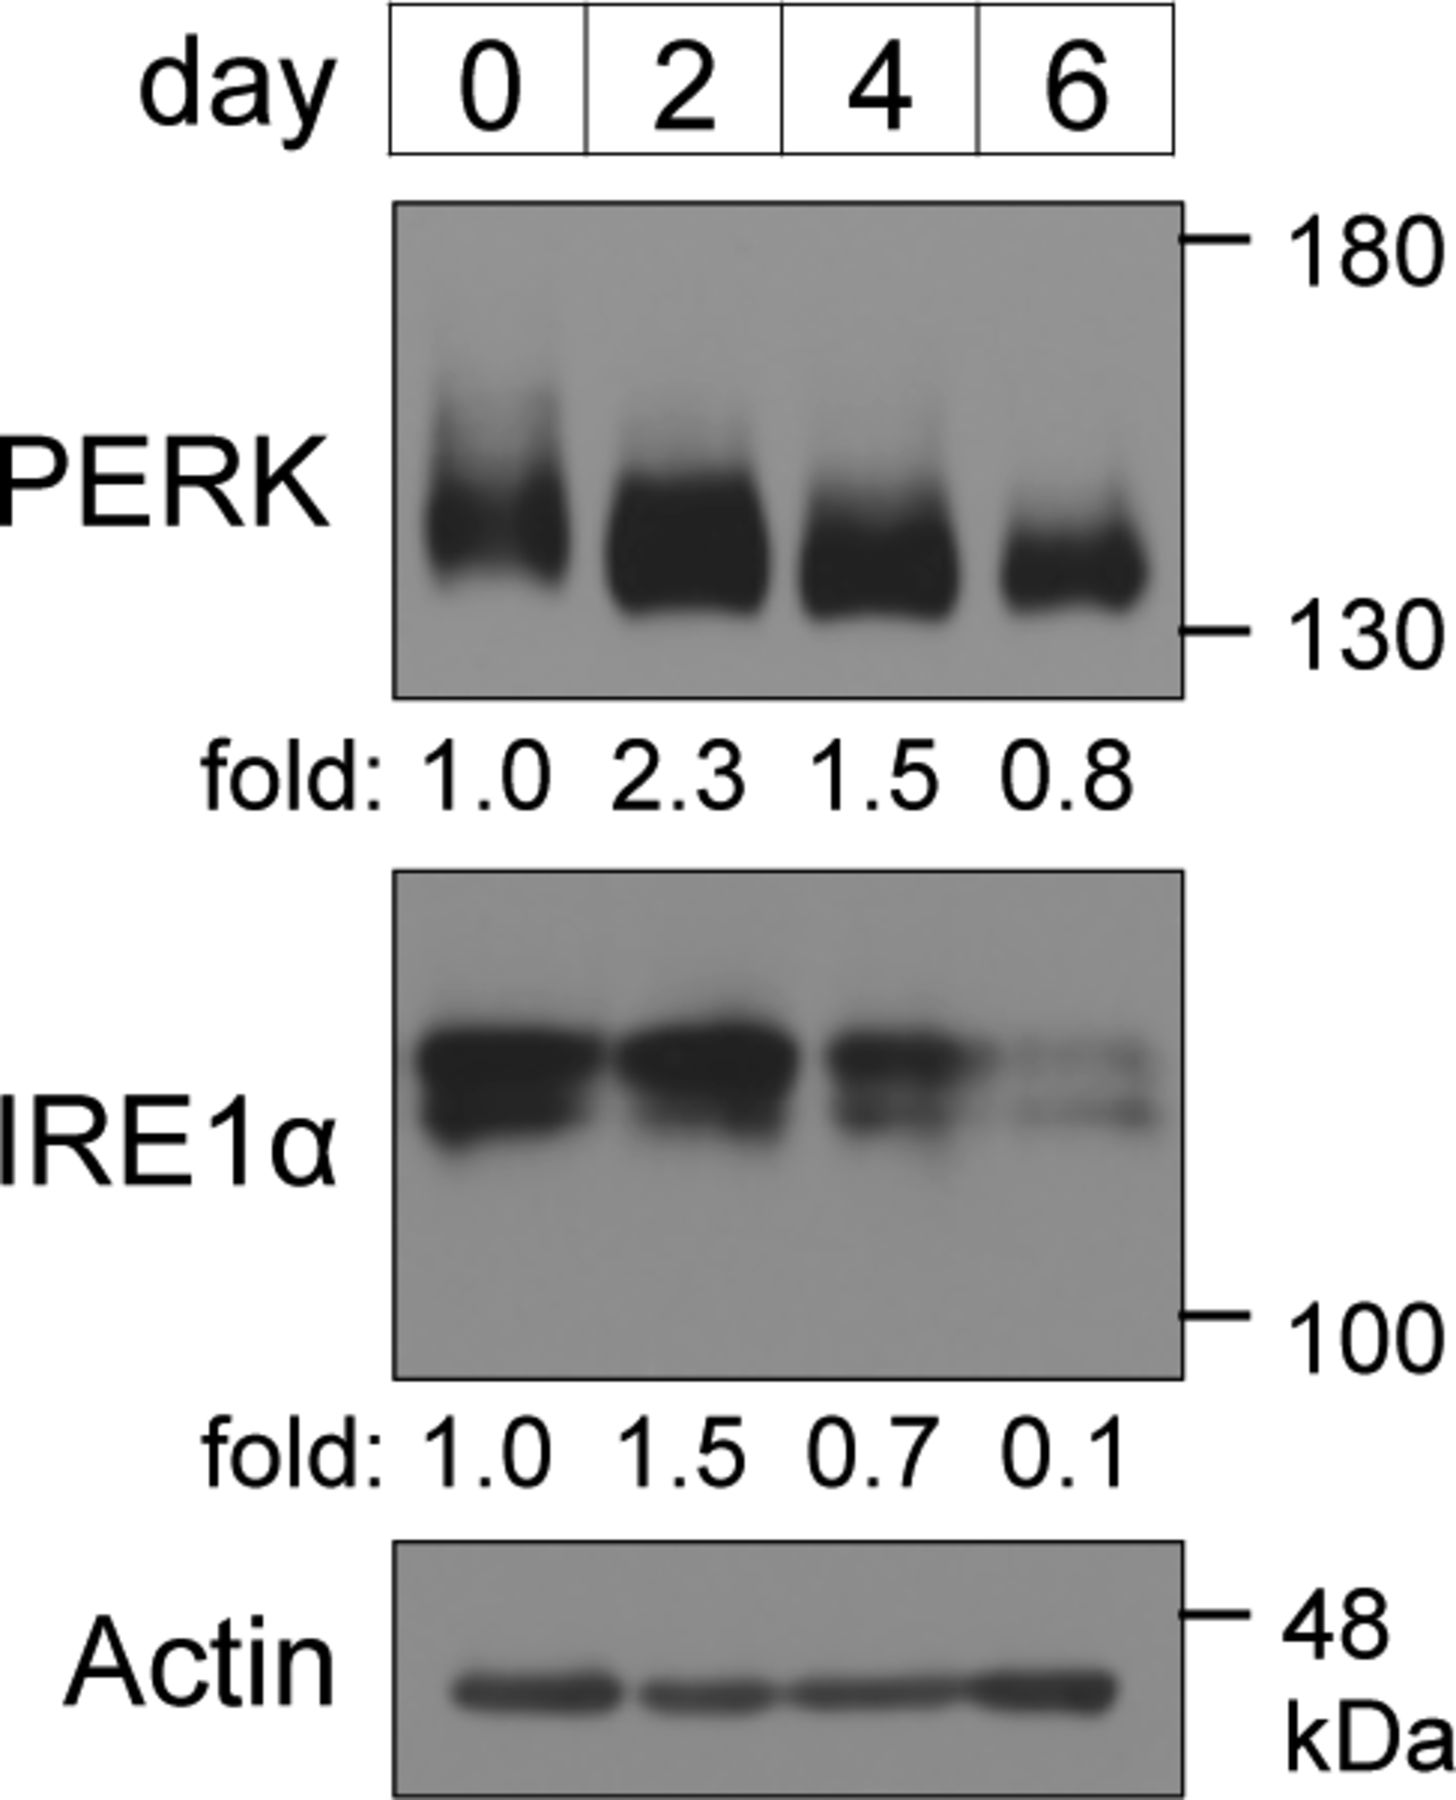
- Figure S2. Expression levels of ER-resident stress sensors during brown adipocyte differentiation.
Cells were lysed on the indicated days and analysed by immunoblotting with the indicated antibodies. The amount of PERK and inositol-requiring enzyme 1α were calculated, and the ratio of PERK or inositol-requiring enzyme 1α to actin on each day is shown as the fold change relative to that on day 0. Actin was used as a loading control.
- Figure 2. Phosphorylation of PERK during brown adipocyte differentiation.
(A, B, C) Phosphorylation of PERK in differentiating cells. (A, B) Cells were cultured with differentiation medium (A, − [control]) or differentiation enhancement medium (A, + and B) for the indicated number of hours on day 2. (A) Cells treated with (+) or without (−) 40 nM thapsigargin (Tg) for 1 or 6 h on day 2 were included as positive controls (A). (A, B) The cell lysates were analysed by immunoblotting (IB) with the indicated antibodies (A, B). (C) Lysates from cells cultured with differentiation enhancement medium for 12 h on day 2 were incubated with or without 2 units of λ phosphatase (PPase) at 30°C for 30 min and analysed by IB with the indicated antibodies (C). (B) The expression of GRP78 was calculated and is shown as the ratio relative to actin expression (B). (D) Newly synthesized proteins in differentiating cells. Cells were incubated with 10 μg/ml puromycin for 10 min and lysed at the indicated time points on day 2. Newly synthesized proteins were detected by IB with an anti-puromycin antibody. (E) IB analysis of ATF4 in differentiating cells. Cells were harvested after the indicated number of hours on day 2 and analysed by IB using the indicated antibodies. Cells treated with 40 nM Tg for 6 h on day 2 were included as positive controls. (F, G) Expression of CHOP (F) or Gadd34 (G) mRNA in differentiating cells. Cells were harvested after the indicated number of hours on day 2, and total RNA was isolated. The data are shown as the fold change relative to the value at 0 h (n = 3 independent experiments). Cells treated with 40 nM Tg for 12 h on day 2 were included as positive controls brown adipocytes.
- Figure 3. Requirement of PERK for mitochondrial development in brown adipocytes (BAs).
(A) Knockdown efficiency of PERK in BAs. siRNA-transfected cells were lysed on day 6 and analysed by immunoblotting with an anti-PERK antibody. (B) PERK-independent adipogenesis. siRNA-transfected BAs were stained with oil red O (images), and the isolated oil red O from cells was measured by quantification of light absorbance at 492 nm (graph). Data are shown as the fold change relative to the value on day 2 (graph) (n = 3 independent experiments). (C, D, E) Requirement of PERK for dense parallel cristae formation in mitochondria. (C, D, E) Brown preadipocytes were transfected with sictrl or siPERK, fixed on day 6, and analysed by electron microscopy (arrows, mitochondrion; LD, lipid droplet; N, nucleus) (C, D, E). Mitochondria were divided into mitochondria possessing dense parallel cristae and mitochondria possessing sparse cristae and were counted (in a total of 50 individual cells) (E). The white square denotes the magnified region (n = 3 independent experiments). (F) Requirement of PERK for mitochondrial (inner membrane and crista) and ER proteins. Brown preadipocytes were transfected with siRNAs. The lysates were analysed by immunoblotting with the indicated antibodies. GPR94 and GRP78 protein was detected by a KDEL antibody. (B, E) Data information: data are presented as mean ± SEM. NS; ****P < 0.0001 (repeated measures ANOVA in (B), t test in (E)).
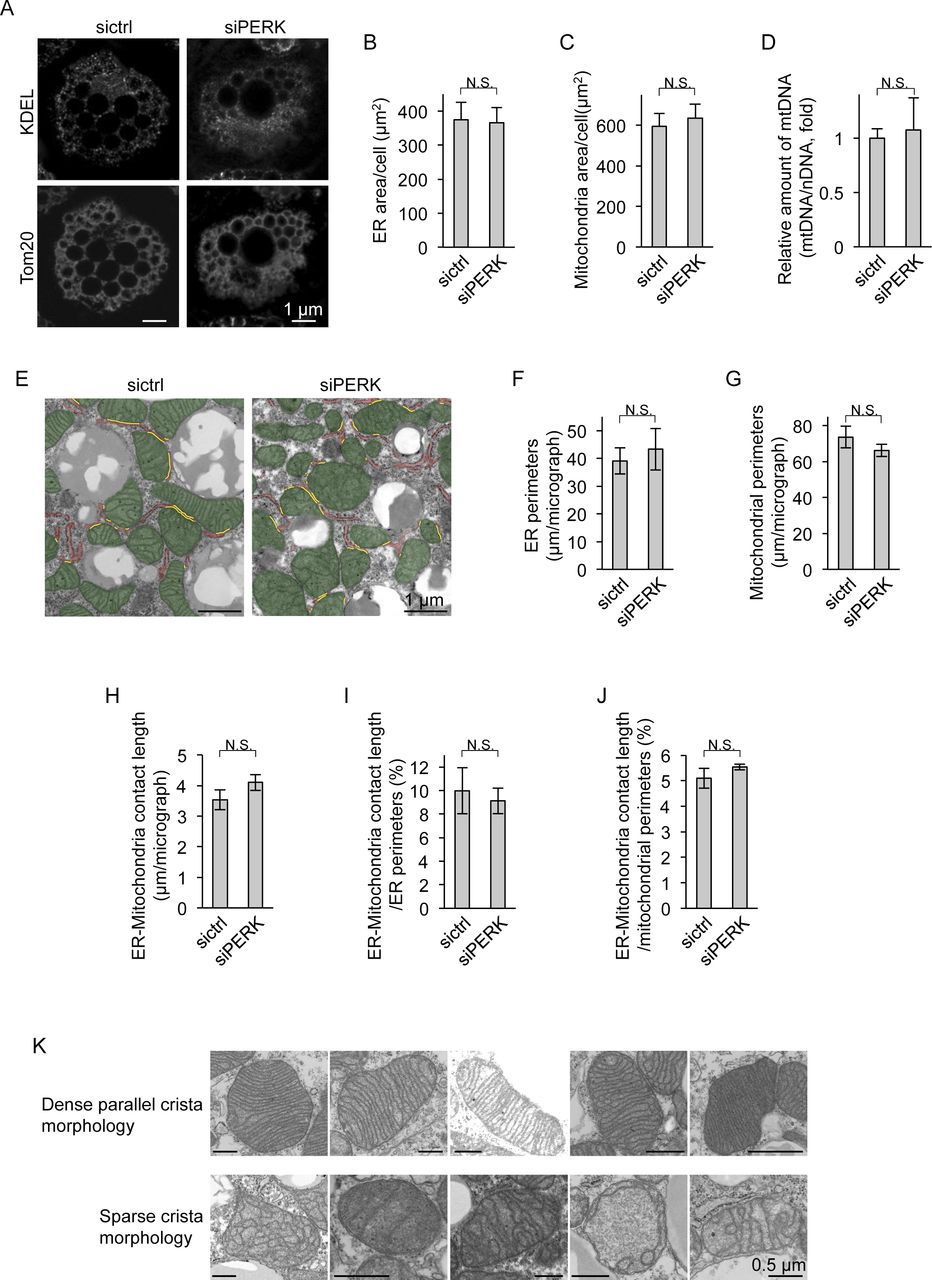
- Figure S3. Morphological analysis of the ER and mitochondria in PERK-deficient brown adipocytes (BAs).
(A) Immunocytochemical images of mitochondria and the ER in BAs. siRNA-transfected cells were immunostained with anti-Tom20 and anti-KDEL antibodies. (B, C) Areas of the ER and mitochondria in BAs. (B, C) The ER area (B) and mitochondrial area (C) per cell were measured from immunocytochemical images (A) using ImageJ software (sictrl, total of 11 individual cells; siPERK, total of 18 individual cells from three independent experiments). (D) Amount of mitochondrial DNA (mtDNA) in BAs. Total DNA was isolated from siRNA-transfected cells on day 6. The nuclear DNA and mtDNA levels were measured by qPCR, and the ratio of mtDNA to nuclear DNA is shown as the fold change relative to the value in sictrl-transfected BAs (n = 3 independent experiments). (E, F, G, H, I, J) Quantification of ER–mitochondria contact length. sictrl- or siPERK-transfected BAs were fixed on day 6 and analysed by electron microscopy (E), and total length of ER perimeter, mitochondrial perimeter, or contact site in one electron micrograph (EM) were calculated with ImageJ software (F, G, H). Mitochondria and the ER are false-coloured in green and red, respectively. The yellow lines denote ER–mitochondria contact site. (F, G, H) Data are shown as the average from 25 (sictrl) or 24 (siPERK) EMs (F, G, H, n = 3 independent experiments). (I, J) ER–mitochondria contact length was normalized to the ER (I) or mitochondrial (J) perimeter and shown as percentage (n = 3 independent experiments). (K) Representative EMs of dense parallel cristae or sparse cristae of mitochondria in differentiated BAs. Data information: data are presented as mean ± SEM. NS (t test).
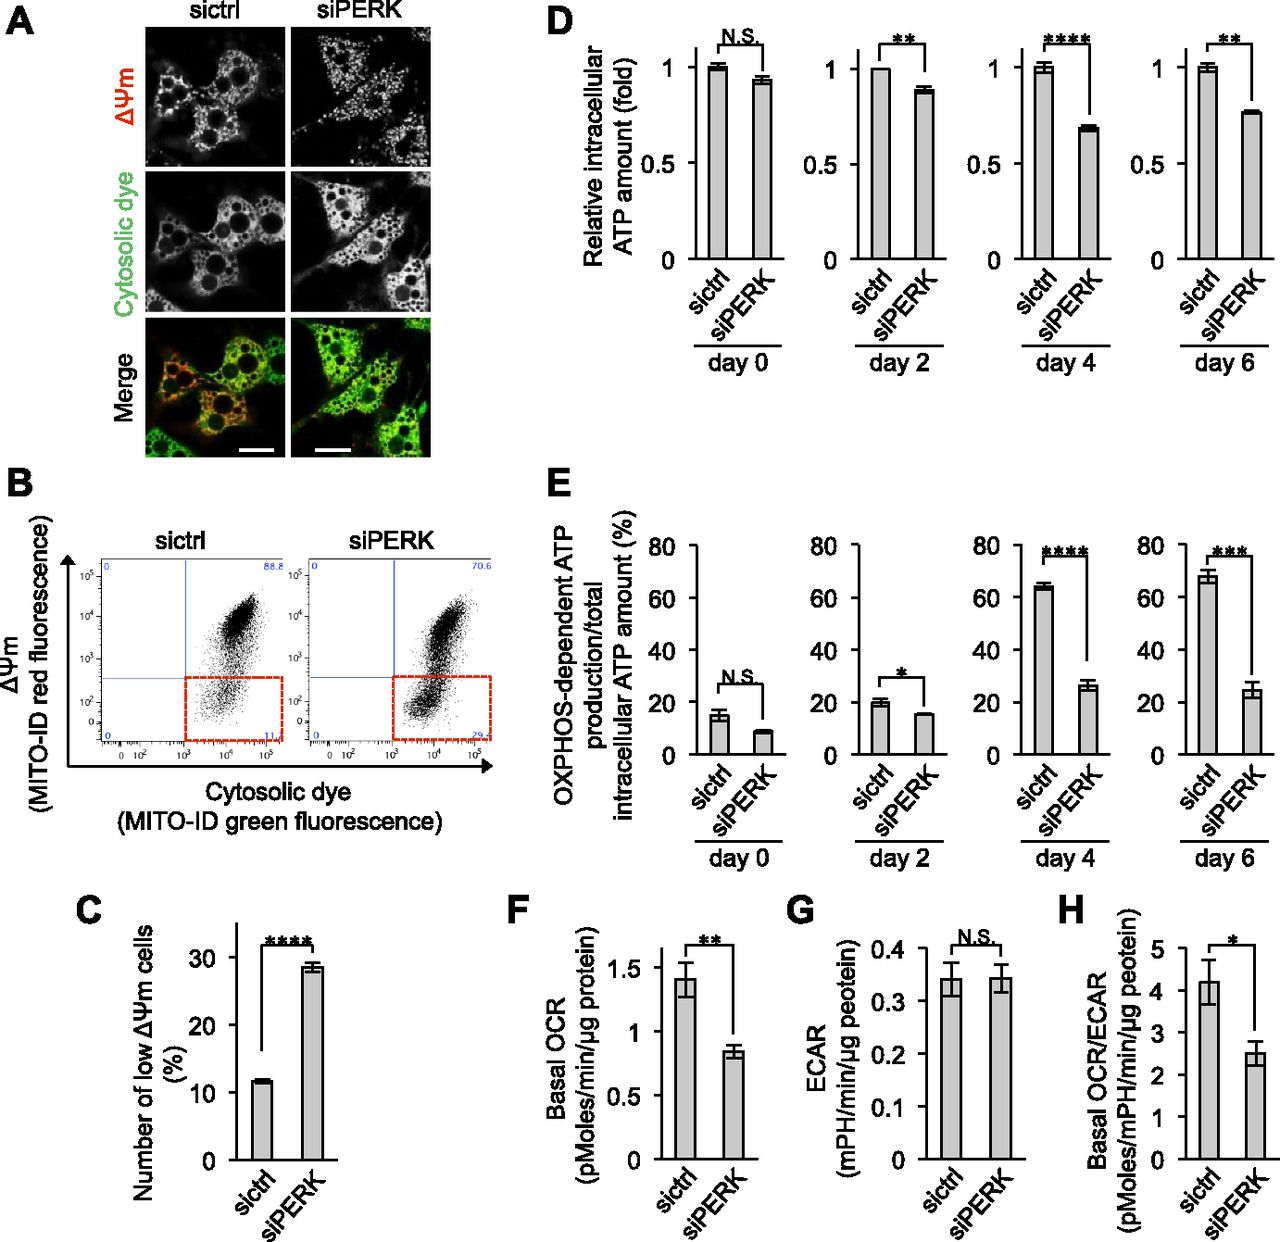
- Figure 4. Requirement of PERK for ΔΨm and OXPHOS-dependent ATP production in brown adipocytes (BAs).
(A) Fluorescence images of ΔΨm in BAs. siRNA-transfected BAs were treated with MITO-ID for 15 min at room temperature on day 6. The ΔΨm was visualized by confocal fluorescence microscopy. The intensity of red fluorescence denotes the ΔΨm. Green fluorescence denotes cytosolic dye, which was used as the loading control. Scale bar, 5 μm. (B, C) Requirement of PERK for maintenance of ΔΨm. siRNA-transfected BAs were stained with MITO-ID and necrosis detection reagents for 15 min at room temperature on day 6. (B) Necrotic cells were removed, and the population of cells showing low ΔΨm was analysed by flow cytometry (B, more than 10,000 cells for each sample). (C) The cell population with low ΔΨm was surrounded with the dotted red square and counted (C). Data are shown as the percentages relative to the total number of cells (n = 3 independent experiments). (D, E) Requirement of PERK for OXPHOS-dependent ATP production. (D, E) sictrl- or siPERK-transfected cells were harvested on the indicated days, and the total intracellular ATP content (D) and OXPHOS-dependent ATP production (E) were measured as described in Fig 1E and F (n = 3 independent experiments). (F, G, H) Requirement of PERK for basal oxygen consumption rate (OCR) in BAs. The OCR and extracellular acidification rate of sictrl- or siPERK-transfected cells were measured using a Seahorse analyser and XF Cell Mito stress test kit. (F, G, H) Data were normalized by total protein content and show the basal OCR (F), extracellular acidification rate (G), and basal OCR/ECRA (H) (n = 3 independent experiments). Data information: data are presented as mean ± SEM. NS; *P < 0.05; **P < 0.01; ***P < 0.001; ****P < 0.0001 (t test).
- Figure 5. Requirement of PERK-3S phosphorylation for mitochondrial functions, but not for the unfolded protein response, in brown adipocytes (BAs).
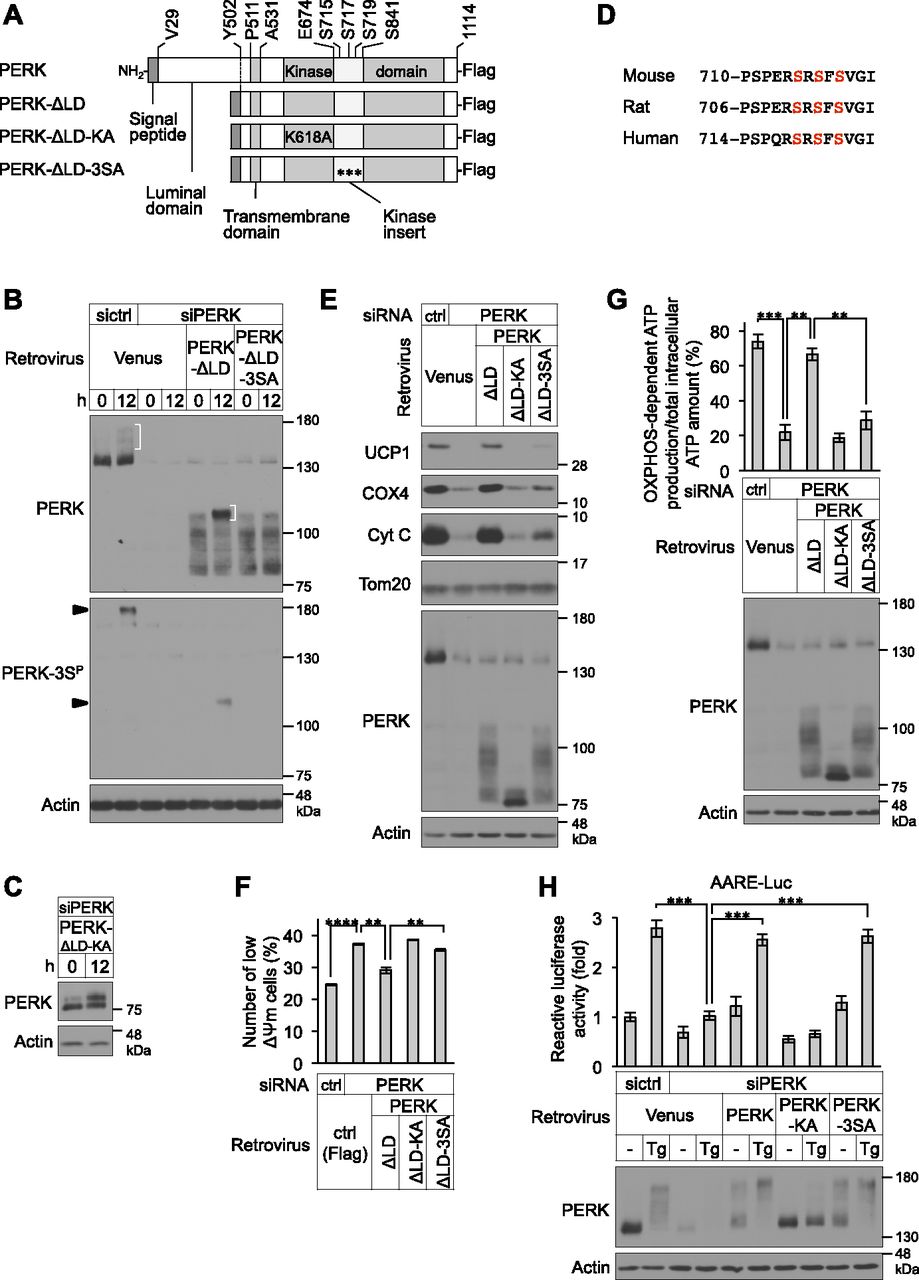
(A) Schematic representation of the C-terminal Flag-tagged full-length PERK, luminal domain-deleted (ΔLD; ΔVal29-Tyr502) mutant PERK, kinase-negative ΔLD (ΔLD-KA; substitution of lysine to alanine at Lys618) mutant PERK, and 3SA ΔLD (ΔLD-3SA; substitution of serine to alanine at Ser715, Ser717, and Ser719) mutant PERK. (B) Immunoblotting (IB) analysis of the phosphorylation of endogenous or exogenously expressed PERK in differentiating cells. siRNA-transfected cells were infected with retroviruses expressing Venus, PERK-ΔLD, or PERK-ΔLD-3SA and cultured with differentiation enhancement medium for the indicated number of hours on day 2. The cell lysates were analysed by IB with anti-PERK and anti-PERK-3SP antibodies. Actin was used as a loading control. Arrowheads indicate the phosphorylated PERK at Ser715, Ser717, and/or Ser719. White parentheses indicate the phosphorylated PERK during BA differentiation. (C) IB analysis of exogenously expressed PERK-ΔLD-KA in differentiating cells. siPERK-transfected cells were infected with retroviruses expressing PERK-ΔLD-KA. The cells were lysed after the indicated number of hours on day 2 and analysed by IB with the indicated antibodies. (D) Alignment of the backbone peptide of PERK for the generation of phospho-Ser715, phospho-Ser717, and phospho-Ser719 antibodies from the indicated various species. Amino acids conserved with Ser715, Ser717, and Ser719 in mouse PERK are highlighted in red. (E) Requirement of PERK kinase activity and phosphorylation at Ser715, Ser717, and/or Ser719 for the expression of mitochondrial inner membrane and crista proteins. siRNA-transfected cells were infected with retroviruses expressing Venus, PERK-ΔLD, PERK-ΔLD-KA, or PERK-ΔLD-3SA, lysed on day 6 and analysed by IB with the indicated antibodies. (F) Requirement of PERK kinase activity and phosphorylation at Ser715, Ser717, and/or Ser719 for maintenance of ΔΨm in BAs. siRNA-transfected primary brown preadipocytes were infected with the indicated retroviruses. The ΔΨm values were analysed by flow cytometry (more than 10,000 cells for each sample) and are shown as described in Fig 4C (n = 3 independent experiments). (G) Requirement of PERK kinase activity and phosphorylation at Ser715, Ser717, and/or Ser719 for OXPHOS-dependent ATP production. siRNA-transfected primary brown preadipocytes were infected with the indicated retroviruses. The ATP levels were measured (top) and are shown as described in Fig 1F. The cell lysates were analysed by IB with the indicated antibodies (bottom) (n = 3 independent experiments). (H) Role of PERK phosphorylation at Ser715, Ser717, and/or Ser719 on the eIF2α-ATF4 pathway in differentiating cells. siRNA-transfected brown preadipocytes were co-transfected with 10 μg of AARE-luc and 1 μg of Renilla-luc and infected with the indicated retroviruses expressing Venus, PERK, PERK-KA, or PERK-3SA. The cells were stimulated with 40 nM Tg for 12 h on day 2, and the relative luc activity was measured (top). AARE-luc activity was normalized to Renilla-luc activity. Data are shown as the fold change relative to the value in non-stimulated sictrl-transfected BAs. The cell lysates were analysed by IB with the indicated antibodies (bottom) (n = 3 independent experiments). Data information: data are presented as mean ± SEM. **P < 0.01, ***P < 0.001, ****P < 0.0001 (t test).
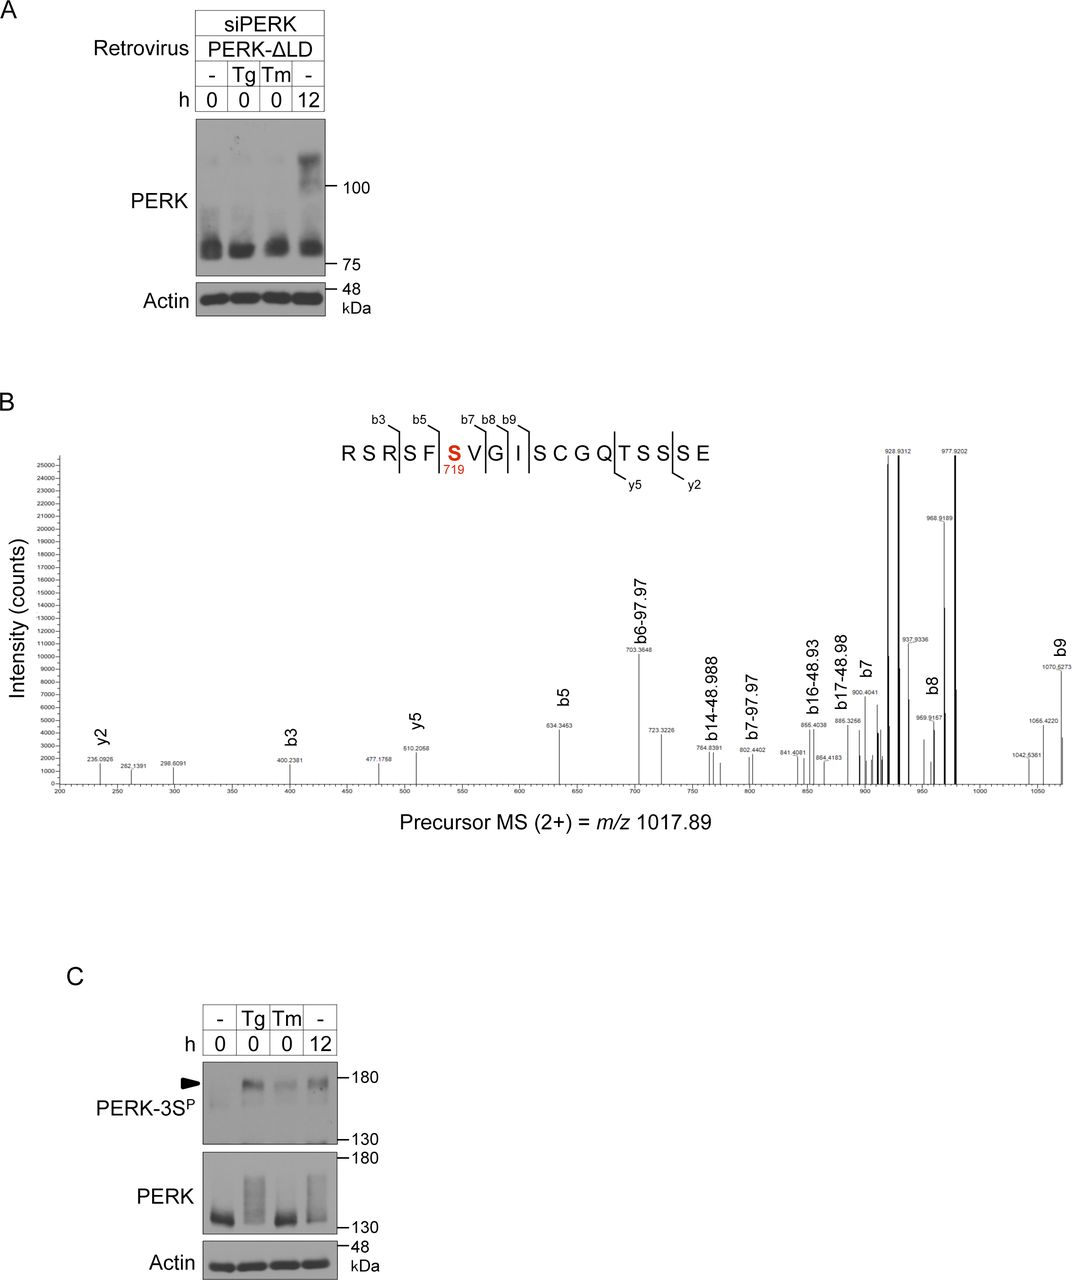
- Figure S4. Phosphorylation sites of PERK during brown adipocyte differentiation.
(A) Immunoblotting (IB) analysis of exogenously expressed PERK-ΔLD in differentiating cells. siPERK-transfected cells were infected with retroviruses expressing PERK-ΔLD. The cells were lysed after the stimulation with 40 nM Tg or 2.5 μg/ml tunicamycin (Tm) for 1 h on day 2 and analysed by IB with the indicated antibodies. Cells treated with differentiation enhancement medium for 12 h on day 2 were included as positive controls. (B) LC-MS/MS–based phosphoproteomic analysis of phosphorylation sites of PERK-ΔLD-KA during brown adipocyte differentiation. The LC-MS/MS data revealed a peptide (714RSRSFSVGISCGQTSSSE731) that included phospho-Ser719. Ser719 is highlighted in red. (C) IB analysis of the phosphorylation of endogenous PERK during ER stress in differentiating cells. Cells were stimulated with or without 40 nM Tg or 2.5 μg/ml Tm for 1 h on day 2. The cell lysates were analysed by IB with the indicated antibodies. Cells treated with differentiation enhancement medium for 12 h on day 2 were included as positive controls. An arrowhead indicates the phosphorylated PERK at Ser715, Ser717, and/or Ser719.
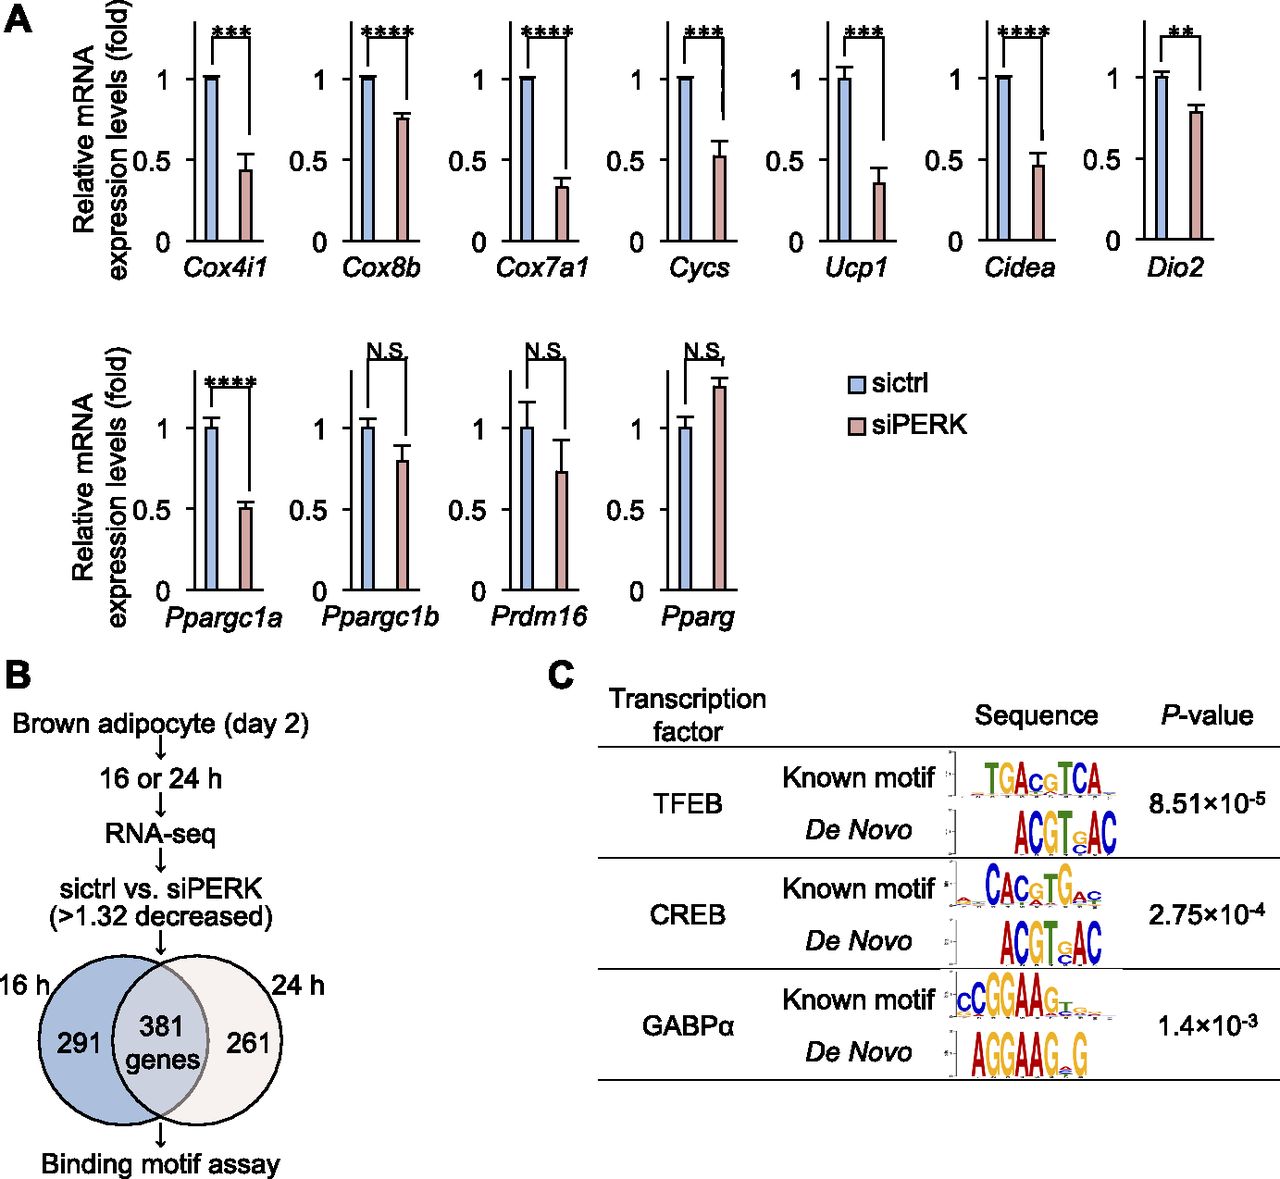
- Figure 6. Mitochondrial gene expression in PERK-deficient brown adipocytes.
(A) qPCR analysis of brown adipocyte-related genes in differentiating cells. Total RNA from siRNA-transfected cells was isolated on day 4. The gene expression levels were analysed by qPCR. The mRNA expression of the indicated genes was normalized to that of S18. Data are shown as the fold change relative to the value in sictrl-transfected cells (n = 3 independent experiments). (B) Venn diagram of common genes between two time points (sictrl versus siPERK, >1.32-fold decrease). sictrl- or siPERK-transfected differentiating cells were cultured with differentiation enhancement medium for 16 or 24 h, and mRNA was isolated. RNA sequencing data were analysed with a Venn diagram. (C) Motif enrichment analysis of PERK-related genes in differentiating cells. Data information: data are presented as mean ± SEM. NS; **P < 0.01; ***P < 0.001; ****P < 0.0001 (t test).
- Figure S5. Involvement of the PERK–GABPα axis in mitochondrial inner membrane protein biogenesis and function.
(A) Habituation of HEK293 cells to OXPHOS-dependent ATP production. HEK293 cells were cultured with glucose-containing (glycolysis conditions) or glucose-free (OXPHOS conditions) medium for 24 h and treated with or without 1 μg/ml oligomycin A for 45 min. ATP levels were measured and are shown as described in Fig 1F. Data are shown as the percentage relative to the total intracellular ATP content in cells cultured with glucose-containing medium (n = 3 independent experiments). (B) Immunoblotting (IB) analysis of phosphorylation at Ser715, Ser717, and/or Ser719 of endogenous PERK in OXPHOS condition-habituated cells. PERK-Flag-knock-in HEK293 cells were cultured with OXPHOS medium for the indicated number of hours. The cell lysates were immunoprecipitated with anti-Flag antibody and analysed by IB with the indicated antibodies. (C) Gene annotation enrichment analysis of down-regulated genes (>1.49-fold decrease) in PERK-KO cells. HEK293 cells were cultured under OXPHOS conditions for 12 h. mRNA was isolated and analysed by RNA sequencing. Gene Ontology analysis for cellular component terms was performed in PANTHER. See also Table S2. (D) Motif enrichment analysis of PERK-related mitochondrial genes. (E) Expression levels of GABPα protein in differentiating cells. siRNA-transfected cells were cultured with differentiation enhancement medium for 24 h on day 2. The cell lysates were analysed by IB with the indicated antibodies. (F) Involvement of GABPα in PERK-mediated expression of mitochondrial proteins and OXPHOS-dependent ATP production. Primary brown preadipocytes were transfected with the indicated combination of siRNAs. The ATP levels were measured on day 6 (top) and are shown as described in Fig 1B. The cell lysates were analysed by IB with the indicated antibodies (bottom). Data information: data are presented as mean ± SEM. ***P < 0.001, ****P < 0.0001 (t test, n = 3 independent experiments).
- Figure 7. Involvement of GABPα in PERK-mediated mitochondrial inner membrane protein biogenesis.
(A) Role of inositol-requiring enzyme 1α or ATF6 in the transcriptional activity of GABPα in differentiating cells. siRNA-transfected brown preadipocytes were co-transfected with GABPα-luc and Renilla-luc. Relative luc activity was measured on day 3 (top). GABPα-luc activity was normalized to Renilla-luc activity. Data are shown as the fold change relative to the value in sictrl-transfected brown adipocytes (BAs) (n = 3 independent experiments). The knockdown efficiency of siPERK and siRNAs against inositol-requiring enzyme 1α (siIRE1α #1 and siIRE1α #2) was analysed by immunoblotting (IB) (bottom). (B) Knockdown efficiency of ATF6 siRNA (siATF6) transfection. Primary brown preadipocytes were transfected with sictrl or with ATF6 #1 or ATF6 #2 siRNA. The amount of ATF6 mRNA on day 3 was analysed by qPCR and normalized to that of S18 mRNA. The data are shown as the fold change relative to the value in sictrl-transfected BAs (n = 3 independent experiments). (C) Requirement of PERK for the transcriptional activity of GABPα in differentiating cells. siRNA-transfected brown preadipocytes were co-transfected with 10 μg of GABPα-luc and 1 μg of Renilla-luc and infected with retroviruses expressing Venus, PERK-ΔLD, PERK-ΔLD-KA, or PERK-ΔLD-3SA. The relative luc activity was measured on day 3 (top). GABPα-luc activity was normalized to Renilla-luc activity. Data are shown as the fold change relative to the value in sictrl-transfected BAs (n = 3 independent experiments). The cell lysates were analysed by IB with the indicated antibodies (bottom). (D) Requirement of the PERK–GABPα pathway for the expression of mitochondrial proteins and OXPHOS-dependent ATP production. ATP levels were measured (top) and are shown as described in Fig 1F. Data are shown as the percentage relative to total intracellular ATP content in each transfected BA (n = 4 independent experiments). siRNA-transfected cells were infected with the indicated retroviruses, lysed on day 6, and analysed by IB with the indicated antibodies (bottom). Data information: data are presented as mean ± SEM. *P < 0.05, **P < 0.01, ***P < 0.001 (t test). N.D., not detectable.
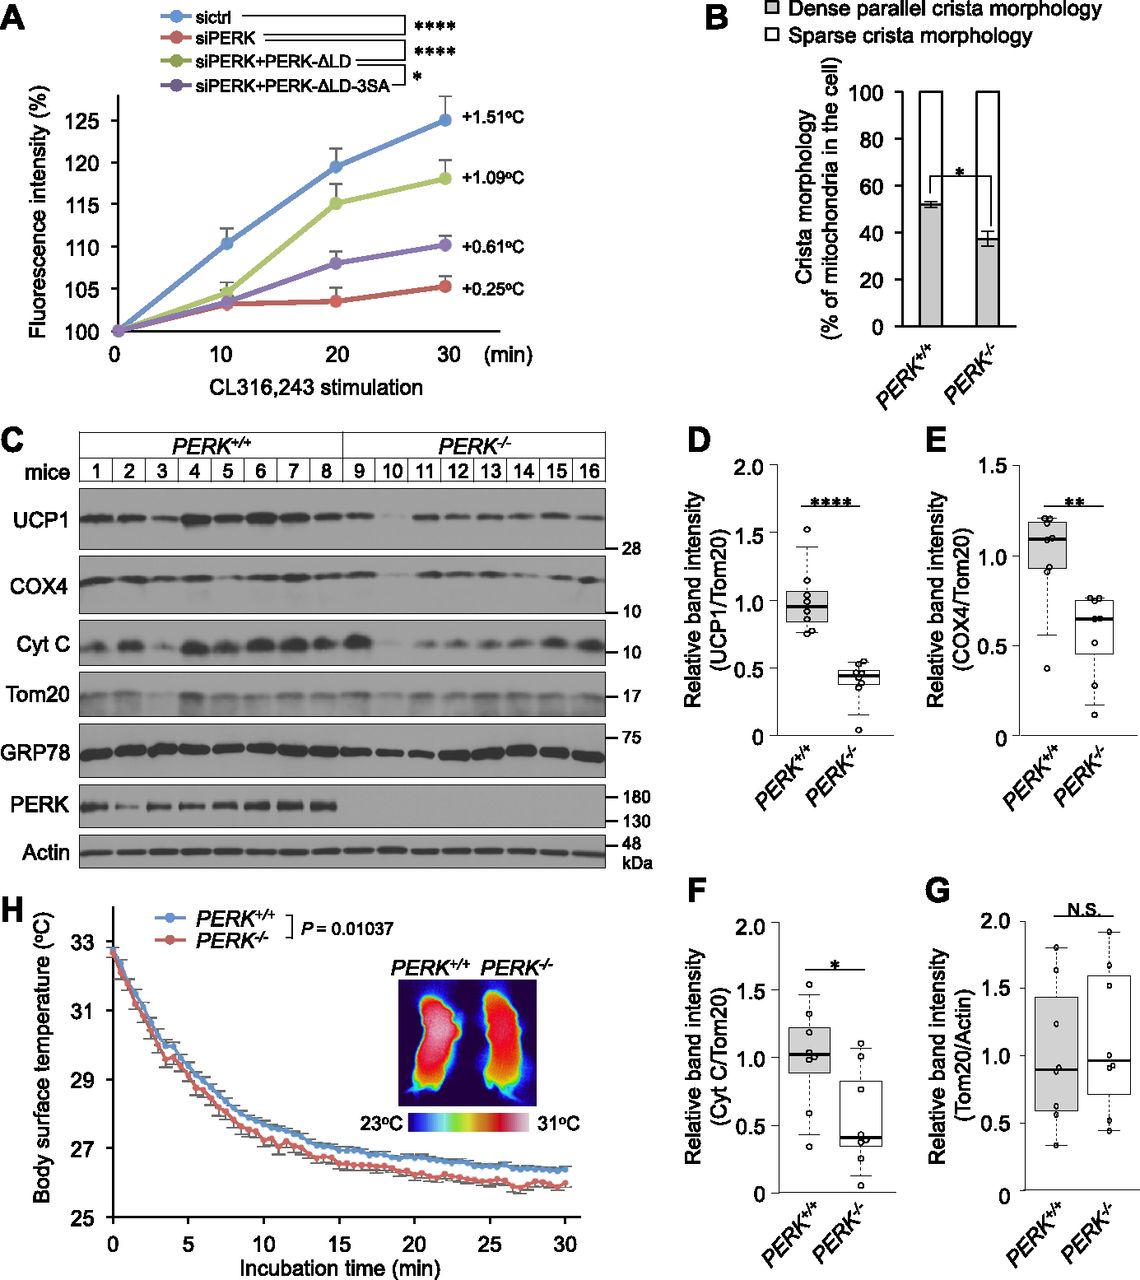
- Figure 8. Requirement of PERK for thermogenesis.
(A) Requirement of PERK for β3AR stimulation-induced intracellular thermogenesis. siRNA-transfected brown preadipocytes were infected with retroviruses expressing PERK-ΔLD or PERK-ΔLD-3SA, incubated with cellular thermoprobes on day 6, stimulated with 0.5 μM CL316,243 and observed by confocal fluorescence microscopy. The intracellular temperature was analysed by ImageJ software. Data are shown as the fold change relative to the value at 0 min (sictrl, 20 individual cells; siPERK, 19 individual cells; siPERK+PERK-ΔLD, 21 individual cells; and siPERK+PERK-ΔLD-3SA, 18 individual cells). (B) Requirement of PERK for dense parallel cristae formation mitochondria in interscapular BAT (iBAT). iBAT was fixed and analysed by electron microscopy. The mitochondria were divided into mitochondria possessing dense parallel cristae and mitochondria possessing sparse cristae and were counted in electron micrographs. The results are shown as described in Fig 2E. Data are shown as the average from 20–30 (PERK+/+ mice) or 22–33 (PERK−/− mice) electron micrographs (n = 3 independent experiments). (C) Expression of mitochondrial and ER proteins in iBAT from newborn PERK+/+ or PERK−/− mice. Lysates from iBAT were analysed by immunoblotting with the indicated antibodies (n = 8 mice). (D, E, F, G) Quantification of uncoupling protein 1 (D), COX4 (E), Cyt C (F), and Tom20 (G) band intensity (see Fig 5C). Uncoupling protein 1, COX4, and Cyt C were normalized to Tom20. Tom20 was normalized to actin. Data are shown as the fold change relative to the average band intensity of PERK+/+ mice (n = 8 independent individuals). (H) Representative thermographic images and dorsal interscapular skin temperature of PERK+/+ or PERK−/− newborn mice during exposure to 16°C. The newborn mice, which were incubated at 32°C, were placed on a 16°C plate (0 min). The back skin temperature was measured by an infrared thermographic camera. P = 0.01037 (PERK+/+, n = 13; PERK−/−, n = 8). (A, D, E, F, G, H) Data information: data are presented as mean ± SEM. NS; *P < 0.05; **P < 0.01; ****P < 0.0001 (repeated measures ANOVA (A, H), t test (D, E, F, G)).
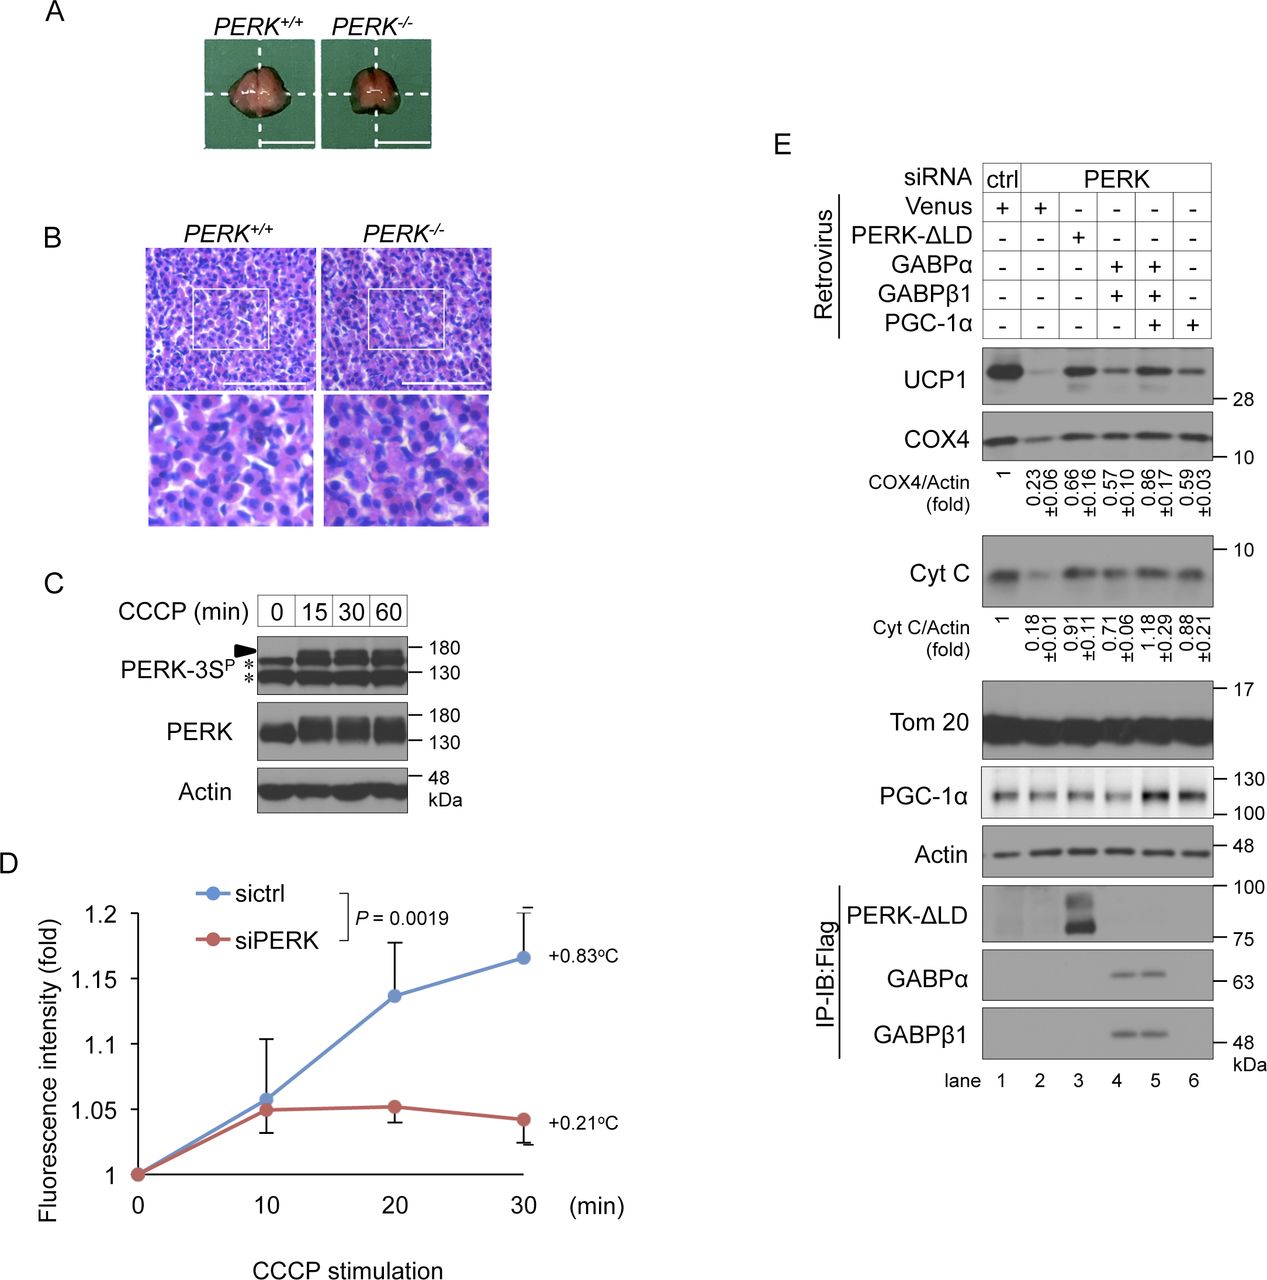
- Figure S6. Role of PERK in thermogenesis.
(A, B) Gross appearance (A) and haematoxylin and eosin staining (B) of interscapular BAT (iBAT) derived from PERK+/+ to PERK−/− newborn mice within 12 h after birth. (A) Freshly harvested iBAT were rinsed with PBS and macroscopic images were taken (A). (B) Isolated iBATs were fixed with 4% paraformaldehyde and embedded in paraffin, and the tissue sections were stained with haematoxylin and eosin (B). Representative images were shown in this Figure. (A, B) Scale bar, 5 mm (A) and 40 μm (B). White squares denote magnified regions. (C) Mitochondrial stress-induced phosphorylation of PERK at Ser715, Ser717, and/or Ser719 in differentiating cells. Brown preadipocytes were stimulated with 10 μM CCCP for the indicated time points on day 2. The cell lysates were analysed by immunoblotting (IB) with the indicated antibodies. An arrowhead indicates the phosphorylated PERK at Ser715, Ser717, and/or Ser719. The asterisk indicate a nonspecific band. (D) Requirement of PERK for CCCP stimulation-induced intracellular thermogenesis. siRNA-transfected brown adipocytes were injected with a nanogel thermometer, stimulated with 10 μM CCCP and observed by inverted microscopy. The intracellular temperature was analysed using ImageJ software. Data are shown as the fold change relative to the value at 0 min. P = 0.0019 (repeated measures ANOVA, sictrl, five individual cells; siPERK, five individual cells). (E) Involvement of PGC-1α in PERK-mediated mitochondrial inner membrane and cristae protein biogenesis in brown adipocytes. siRNA-transfected cells were infected with the indicated retroviruses, lysed on day 6, and analysed by IB or immunoprecipitation-IB with the indicated antibodies. The expression of Cyt C and PGC-1α were calculated and is shown as the ratio relative to the expression of actin (average band intensity, n = 3).


Supplementary Materials


