


Article Figures & Data
Figures
- Figure 1. Differentiation pathway to CD4+ T cells after E8I activation in ThpokDTE/DTE mice.
(A) Histograms showing GFP expression from the E8I-Cre transgene and YFP expression from the Rosa26-STOP-YFP allele of splenic CD4+CD8− and CD4−CD8+ T cells of mice with indicated genotypes. One representative of at least three experiments. (B) Graph showing summary of the percentage of YFP+ CD4+CD8− splenic T cells of Zbtb7+/+, Zbtb7b+/ΔTE, and Zbtb7bΔTE/ΔTE mice that are hemizygous for E8I-Cre and Rosa26-STOP-YFP transgene. Mean ± SD. ***P < 0.001 (Kruskal–Wallis test with Dunn’s multiple comparisons test).
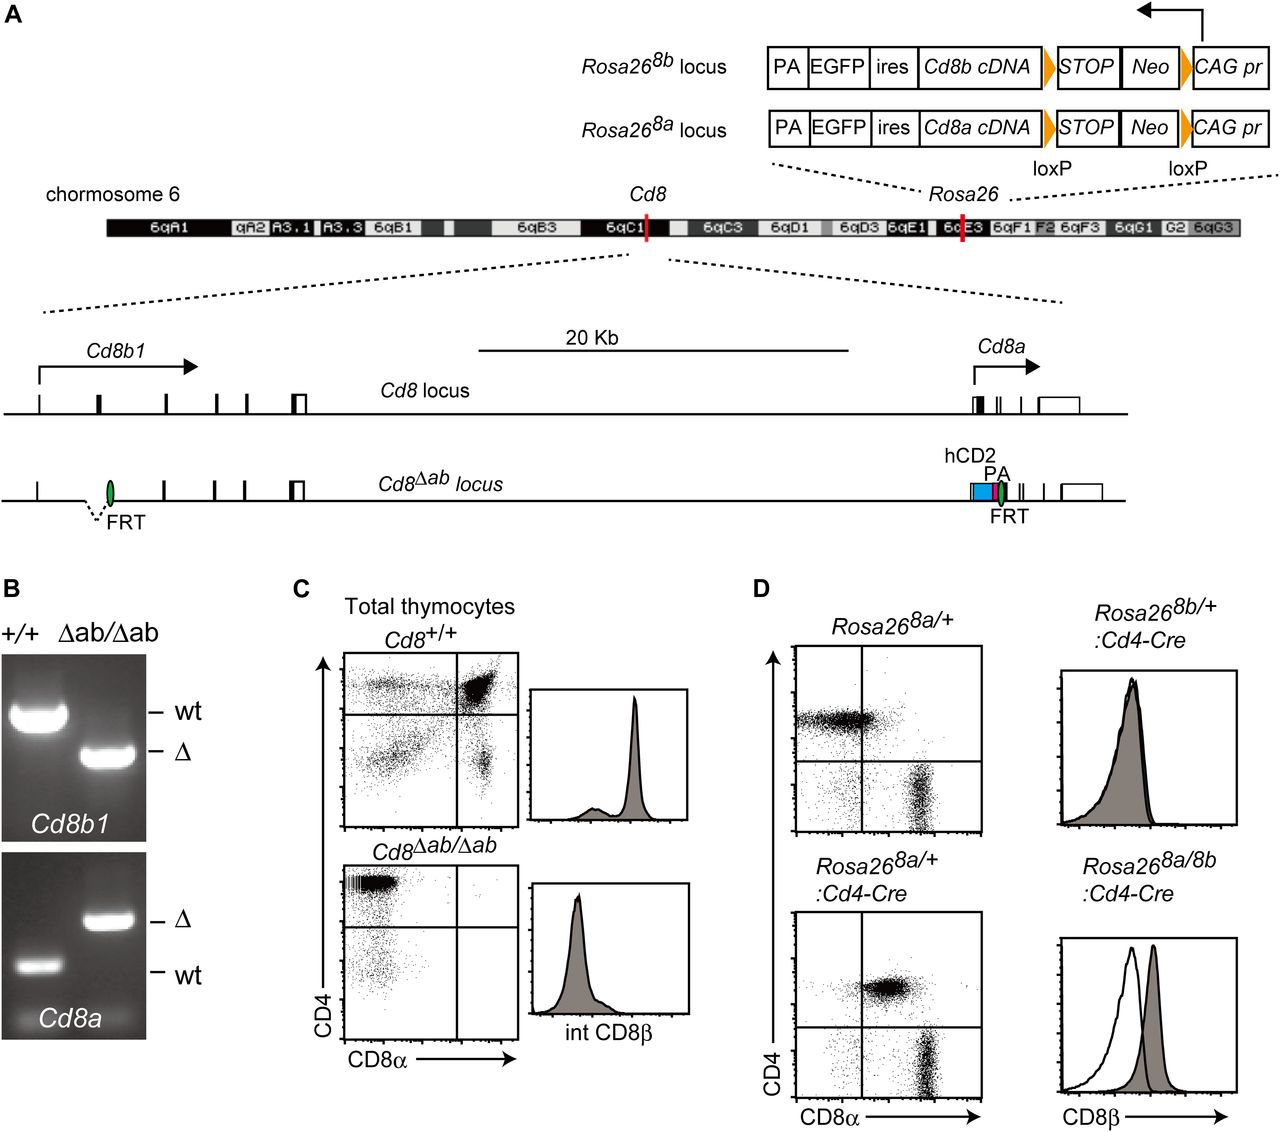
- Figure 2. Transgenic mouse line expressing CD8α and CD8β chain in the absence of endogenous CD8α and CD8β chains.
(A) A scheme showing structures of Rosa268a, Rosa268b, Cd8, and Cd8Δab loci on the mouse chromosome 6. Orange triangles and green ovals represent loxP and FRT sequences, respectively. hCD2 was inserted to replace the Cd8a locus. Arrows indicate direction of transcription at the Cd8 and Rosa26 loci. PA, polyA adenylation signals; Neo, neomycin-resistance gene; ires, internal ribosomal entry sites. (B) Gel images of genotyping PCR showing deletion of the second exon at the Cd8b1 locus and insertion of the hCD2 cDNA at the Cd8a locus. (C, D) Flow cytometry analyses for CD4 and CD8a expression of total thymocytes of Cd8+/+ and Cd8Δab/Δab mice (C) and TCRβ+ spleen T cells of Rosa268a/+ and Rosa268a/+: CD4-Cre mice (D). (C, D) Histogram showing intracellular staining of CD8β chain in total thymocytes of Cd8+/+ and Cd8Δab/Δab mice (C) and surface CD8β expression of spleen CD4+ T cells of Rosa268b/+:CD4-Cre and Rosa268a/8b: CD4-Cre mice (D). CD8β expression by wild-type CD4+ T cells is shown as an open histogram as a negative control. One representative of two independent experiments.
- Figure S1. Schematic structure of the Cd8a and Cd8b loci.
Strategy for sequential targeting to generate a Cd8Δab allele with targeting vectors for Cd8bNeo and Cd8aCD2N mutation. Black and white boxes represent coding and UTR sequences within the exons of the Cd8 loci, respectively. The grey box, red box, and green oval represent hCD2 cDNA, bovine growth hormone polyadenylation (PA) signals, and FRT sequences, respectively. Neo, neomycin-resistance gene; DT, diphtheria toxin A gene. Gel images show results of PCR screens to identify desired ES clones that underwent homologous recombination with the targeting vector or site-specific recombination between the Cd8Δb and Cd8aCD2N genes.
- Figure S2. Kinetics of CD8 expression in the Cd8-Tg mouse.
Dot plot showing gating strategy to define thymocytes developmental stages by CD69 and CCR7 expression. Numbers indicate developmental stage. The stage 1 represents pre-selection stage, and the developmental process of post-selection thymocytes into mature thymocytes proceeds from the stage 2 to the stage 6. Histogram plots showing CD8α expression level of each stage. Number in the histograms indicate mean fluorescence intensity of CD8α expression.
- Figure 3. Differentiation of innate-like CD8+ T cell with under constitutive CD8αβ expression.
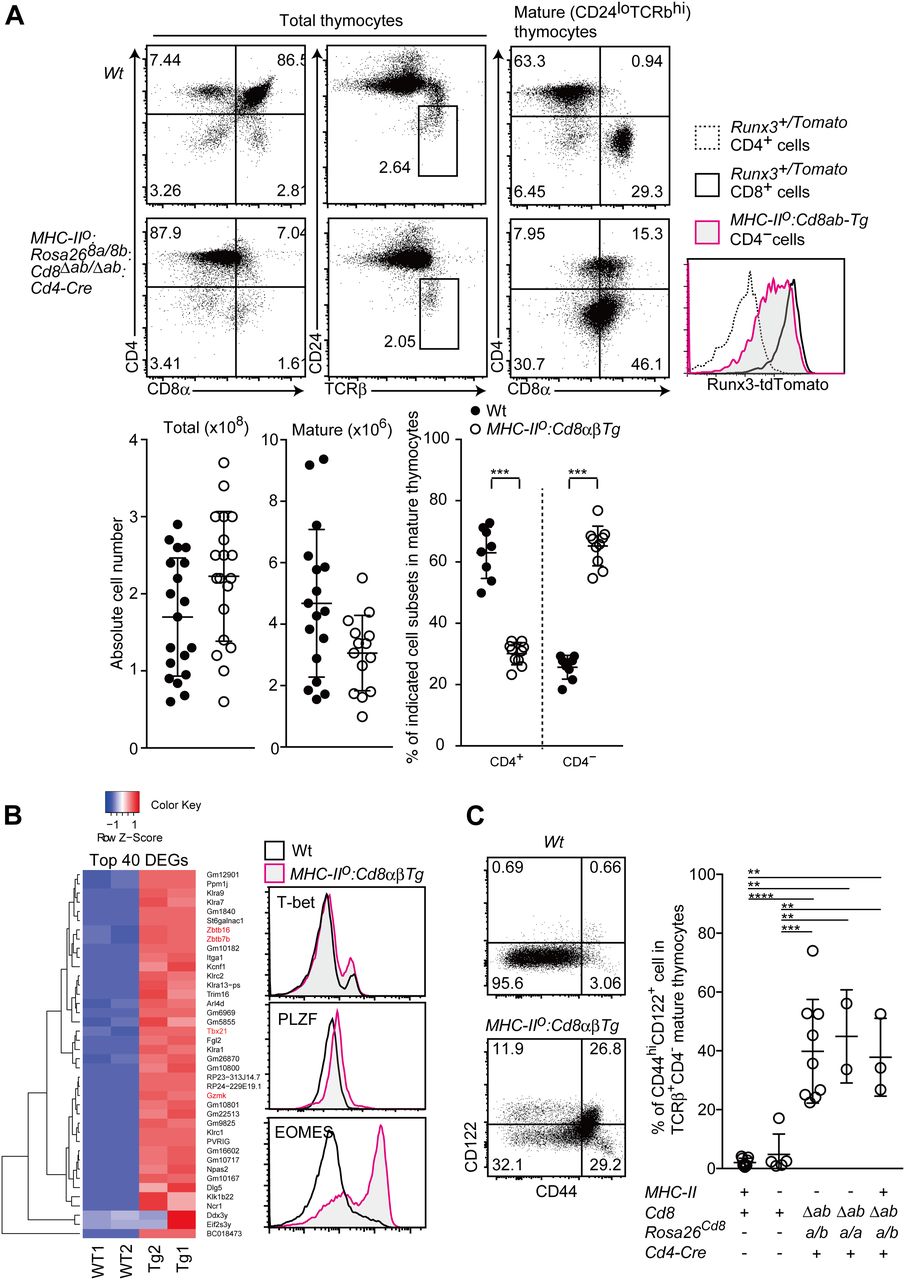
(A) Flow cytometry analyses for CD4, CD8, TCRβ, CD24, and Runx3-tdTomato expression by various thymocyte subsets of mice with the indicated genotypes. Representative results of more than three independent analyses. Numbers in the plot indicate the percentage of cells in each quadrant. Graphs showing summary of cell numbers of total and mature thymocytes and the percentage of CD4+ and CD4− subset in mature thymocytes. Mean ± SD. ***P < 0.001 (unpaired t test, two-sided). (B) RNA-seq analyses of CD8 SP cells from indicated genotypes (left). The top 40 differentially expressed genes observed between Wt and Tg are shown. Histograms showing protein expression level of selected genes in indicated genotypes (right). (C) Dot plots showing CD44 and CD122 expression in mature CD8 SP thymocyte of the indicated genotypes (left). Representative results of more than three independent analyses. Graph showing summary of percentage of CD44hiCD122+ population in mature thymocytes of indicated genotypes (right). Mean ± SD. **P < 0.01, ***P < 0.001, ****P < 0.0001 (one-way ANOVA with Tukey’s multiple comparison).
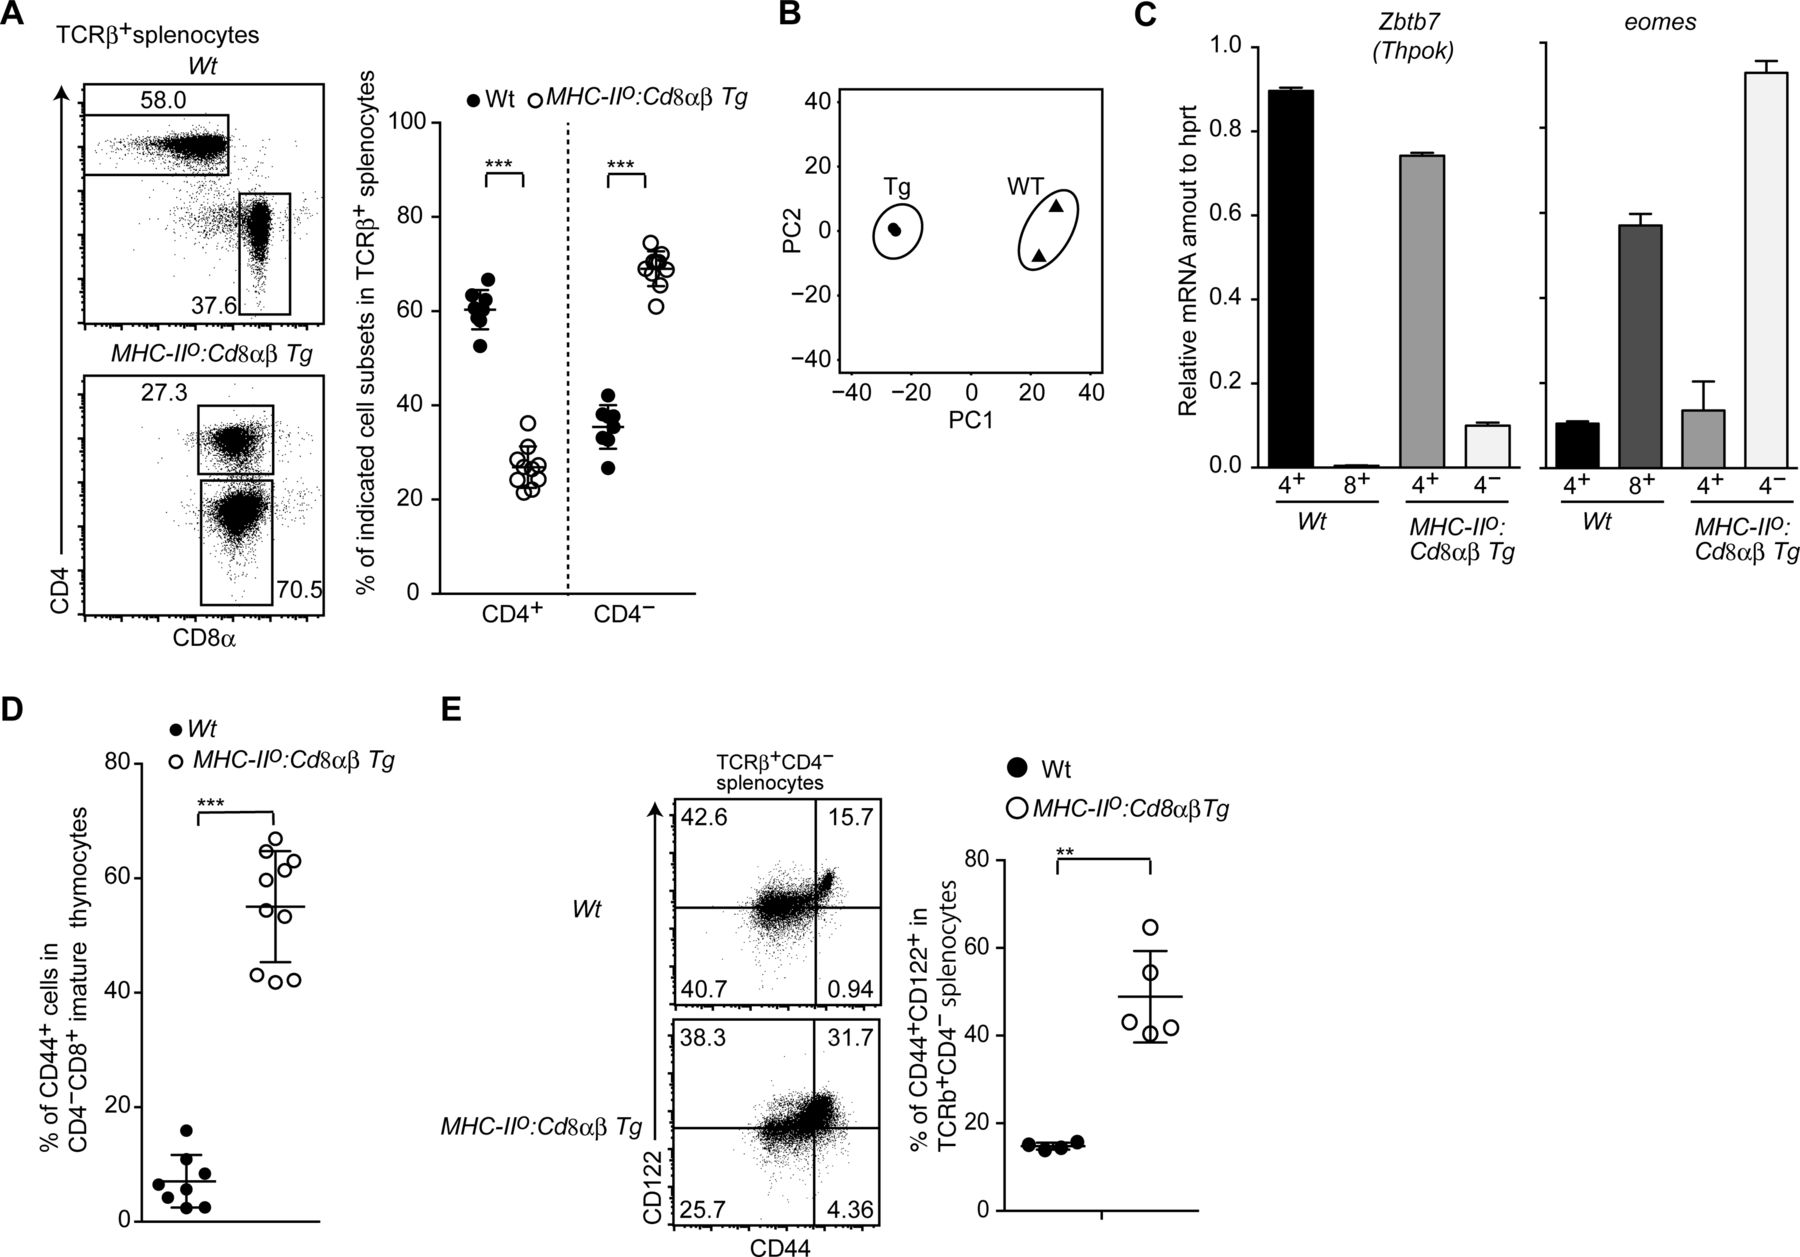
- Figure S3. Development of innate memory-like CD8 T cells by constitutive CD8 expression.
(A) Dot plots showing CD8α and CD4 expression in spleen T cells of mice of the indicated genotype (left). Numbers in the plots indicate the percentage of cells in each region. The graph on the right shows a summary of the data. Mean ± SD. ***P < 0.001 (unpaired t test, two-sided). (B) Principle component analyses of RNA-seq data. (C) Relative amounts of Zbtb7b and Eomes mRNA assessed by quantitative RT-PCR in CD4+ and CD4− mature thymocytes of mice of the indicated genotype. Mean ± SD. (D) Frequency of CD44+ cells among CD4− mature thymocytes from mice of the indicated genotype. Mean ± SD. ***P < 0.001 (unpaired t test, two-sided). (E) Dot plots showing CD44 and CD122 expression by CD4− spleen T cells from mice of the indicated genotype (left). Numbers in the plots indicate the percentage of cells in each quadrant. The graph at the right shows a summary of the data. Mean ± SD. **P < 0.01 (unpaired t test with Welch’s correction, two-sided).
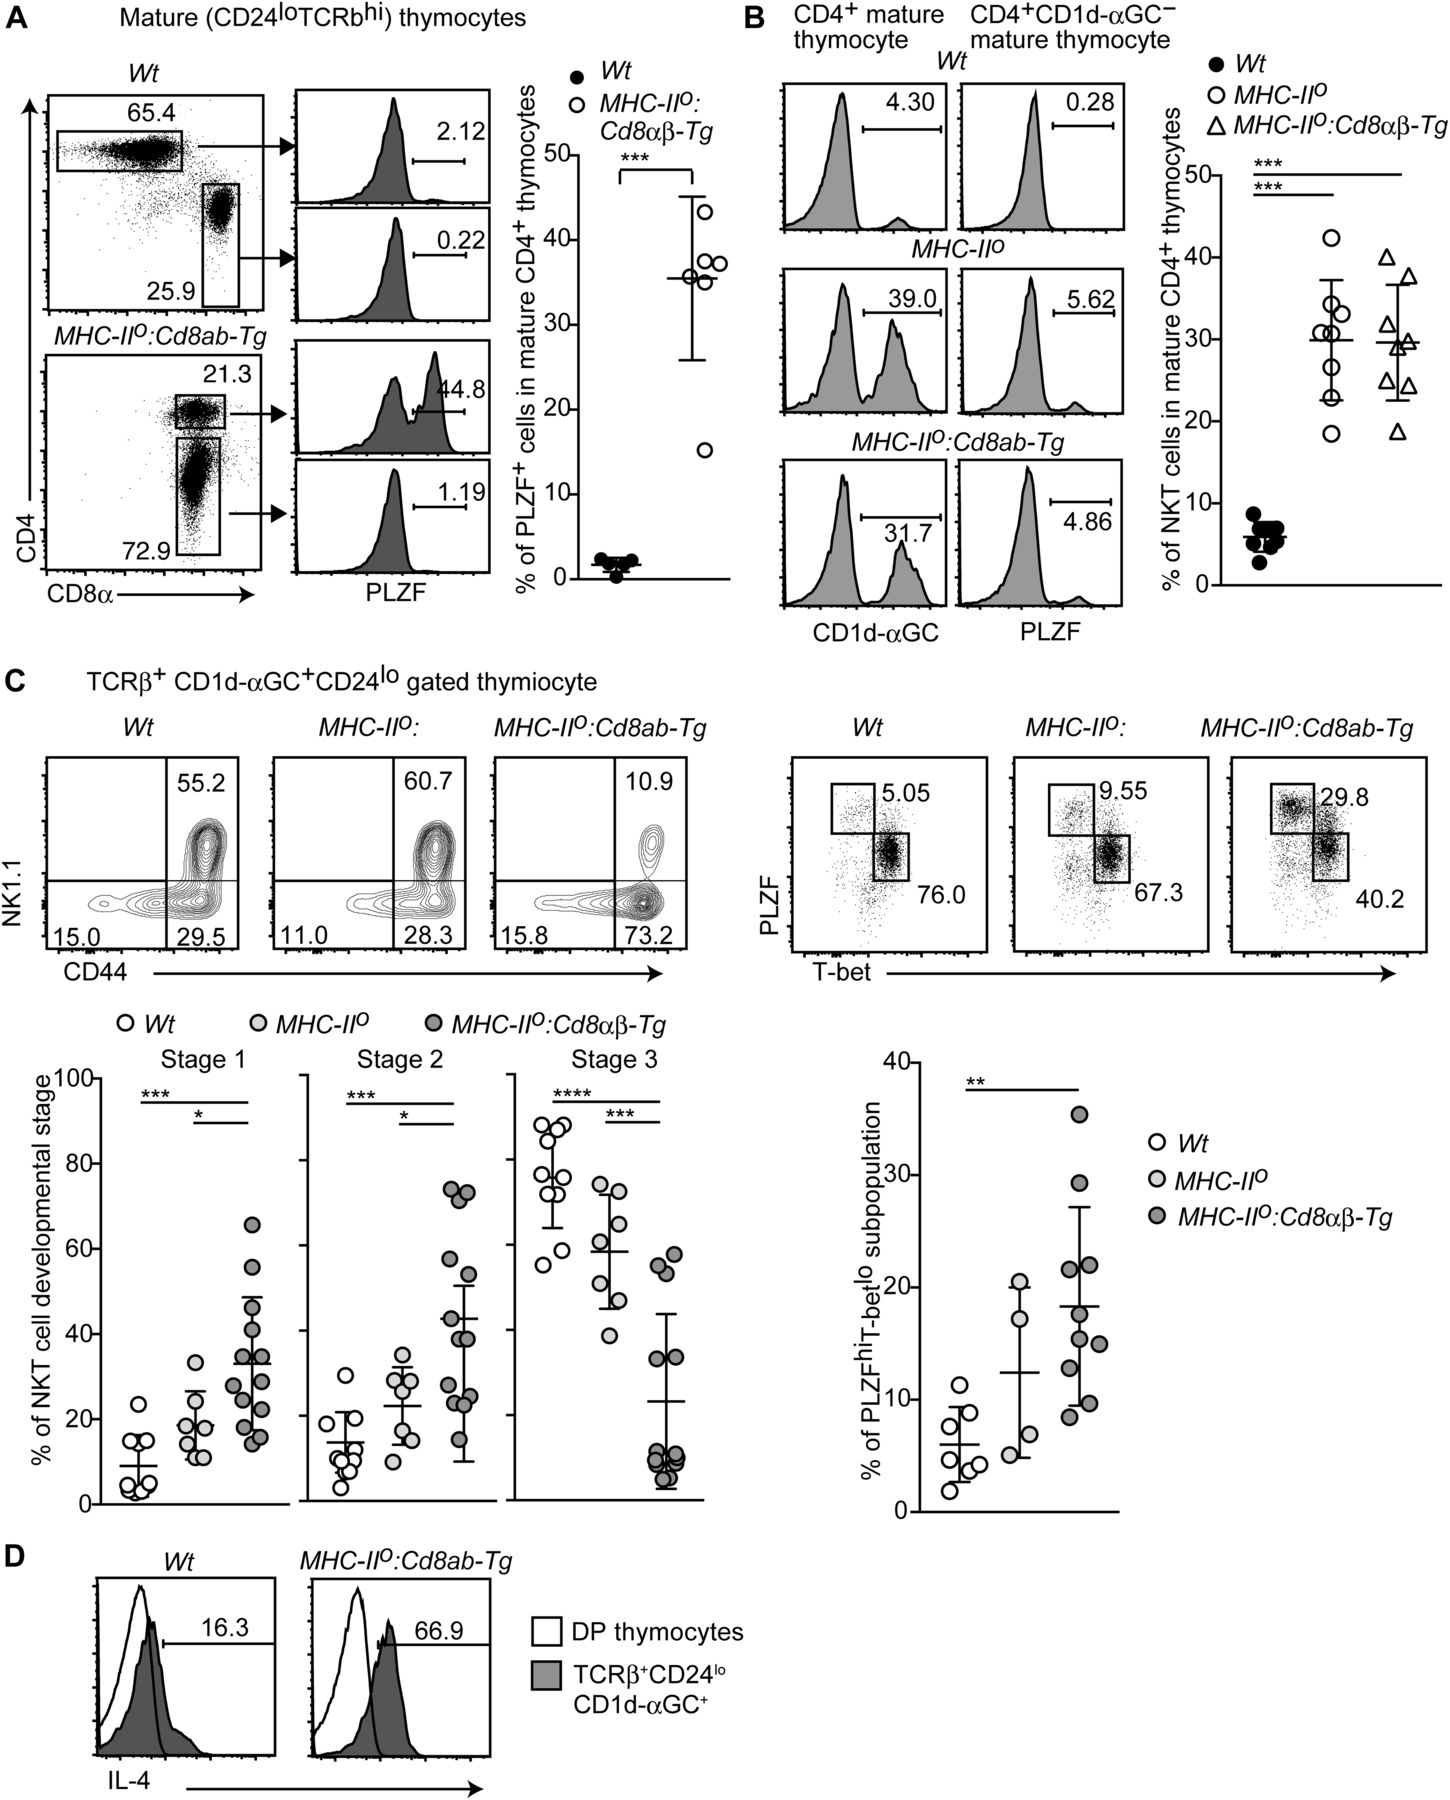
- Figure 4. Skewed differentiation of the iNKT2 subset by constitutive CD8αβ expression.
(A) Dot plots and histograms showing CD4, CD8, and PLZF expression in mature thymocytes of the indicated genotypes (left two panels). Representative results of at least three experiments. Graph showing a summary of five independent experiments (right). Mean ± SD. ***P < 0.001 (unpaired t test with Welch’s correction, two-sided). (B) Histograms showing CD1d-αGC anti-PLZF staining of the indicated thymocyte subsets and genotypes (left). Graph showing summary of four independent experiments (right). Mean ± SD. ***P < 0.001 (one-way ANOVA with Tukey’s multiple comparison). (C) Contour and dot plots showing frequencies in various stages and subsets of thymic iNKT cells from the indicated genotypes (upper). CD44−NK1.1−CD24− stage 1 cells, CD44+NK1.1− stage 2 cells, and CD44+NK1.1+ stage 3 cells. T-betloPLZFhi is the iNKT2 subpopulation. One representative result of at least four experiments. Graphs showing summary of at least four experiments (lower). Mean ± SD. *P < 0.05, **P < 0.01, ***P < 0.001 (one-way ANOVA with Tukey’s multiple comparison). (D) Histogram showing intracellular IL-4 staining in the thymic iNKT population after stimulation with PMA and ionomycin for 4 h. One representative of two experiments.
- Figure S4. iNKT-cell differentiation in MHC-II–deficient background in the presence or absence of constitutive CD8 expression.
(A) Left pseudocolor plots showing the frequency of iNKT cells in total thymocytes, which were defined as expression of TCRβ recognizing αGC on CD1d molecule. The graphs at the right shows a summary of the frequency and numbers of iNKT cells in the thymus of mice with indicated genotype. Mean ± SD. *P < 0.05 (one-way ANOVA with Tukey’s multiple comparison). Right contour plots show transgenic CD8 expression on iNKT cells. (B) The graph shows a summary of the numbers of iNKT2-cell subset in the thymus of mice with indicated genotype. Mean ± SD. **P < 0.01 (Kruskal–Wallis test with Dunn’s multiple comparisons test because significant difference of variance among these groups is observed by Bartlett’s test). (C) Dot plots showing Plzf and RORγt expression in iNKT cells in the thymus of mice with indicated genotype. PlzfhiRORγt− and Plzfint RORγt+ populations represent iNKT2 and iNKT17 subsets, respectively. The graph shows a summary of the % of iNKT2 and iNKT17. Mean ± SD. **P < 0.01, ***P < 0.001 (unpaired t test, two-sided). (D) Histogram showing CD5 expression on iNKT cells. The graph shows summary of mean fluorescence intensity of CD5 expression level. Mean ± SD. *P < 0.05 (unpaired t test, two-sided). (E) Histograms showing CD1d expression on double positive thymocytes of mice with indicated genotypes. The graph shows summary of mean fluorescence intensity of CD1d expression level. Mean ± SD.
- Figure 5. Cell-intrinsic and cell-extrinsic mechanisms for differentiation of innate-like CD8+ T cells.
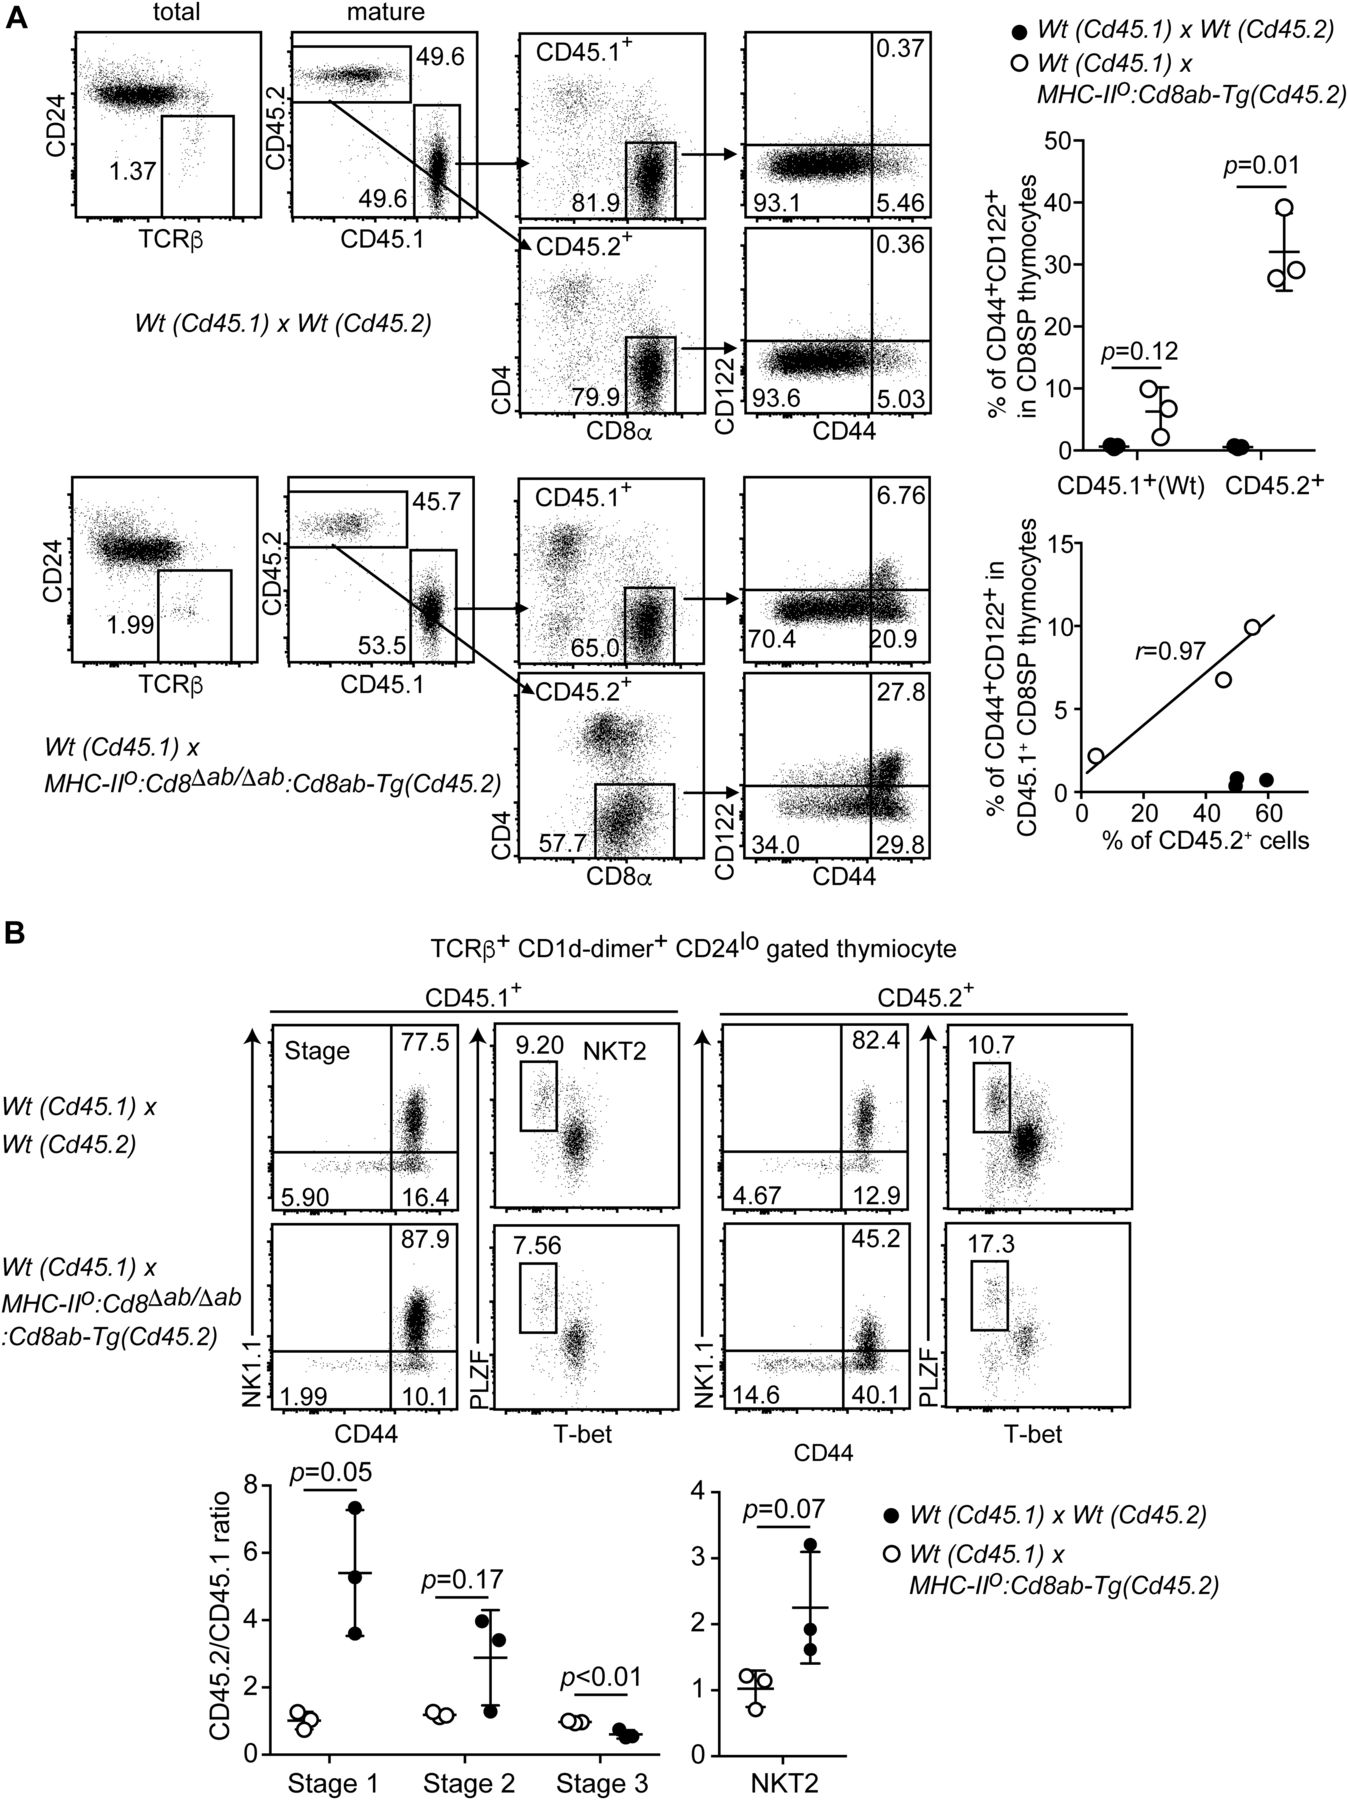
(A) Gating strategy of the flow cytometry analyses for the frequency of the innate memory-like CD8+ T-cell population in mixed bone marrow chimera experiments. One representative result from three independent mice (left). Graphs showing summary of innate CD8+ T-cell frequency in the indicated genotypes (right). Mean ± SD. Probability is calculated using two-tailed unpaired t test with Welch’s correction (right upper panel). The scatter plot indicates the relationships between CD45.2 chimerism and frequency of innate CD8+ T cells. r indicates Pearson’s correlation coefficient. (B) Dot plots showing iNKT-cell stages and iNKT2 subpopulations in mixed bone marrow chimera experiments (top). One representative result from three independent mice. Graph showing summary of frequencies of iNKT-cell developmental stages and iNKT2 subpopulation (bottom). Mean ± SD. Indicated probabilities are calculated using two-tailed unpaired t test with or without Welch’s correction (right upper panel).
- Figure 6. Signals from CD8α chain are essential for iNKT2 skewing.
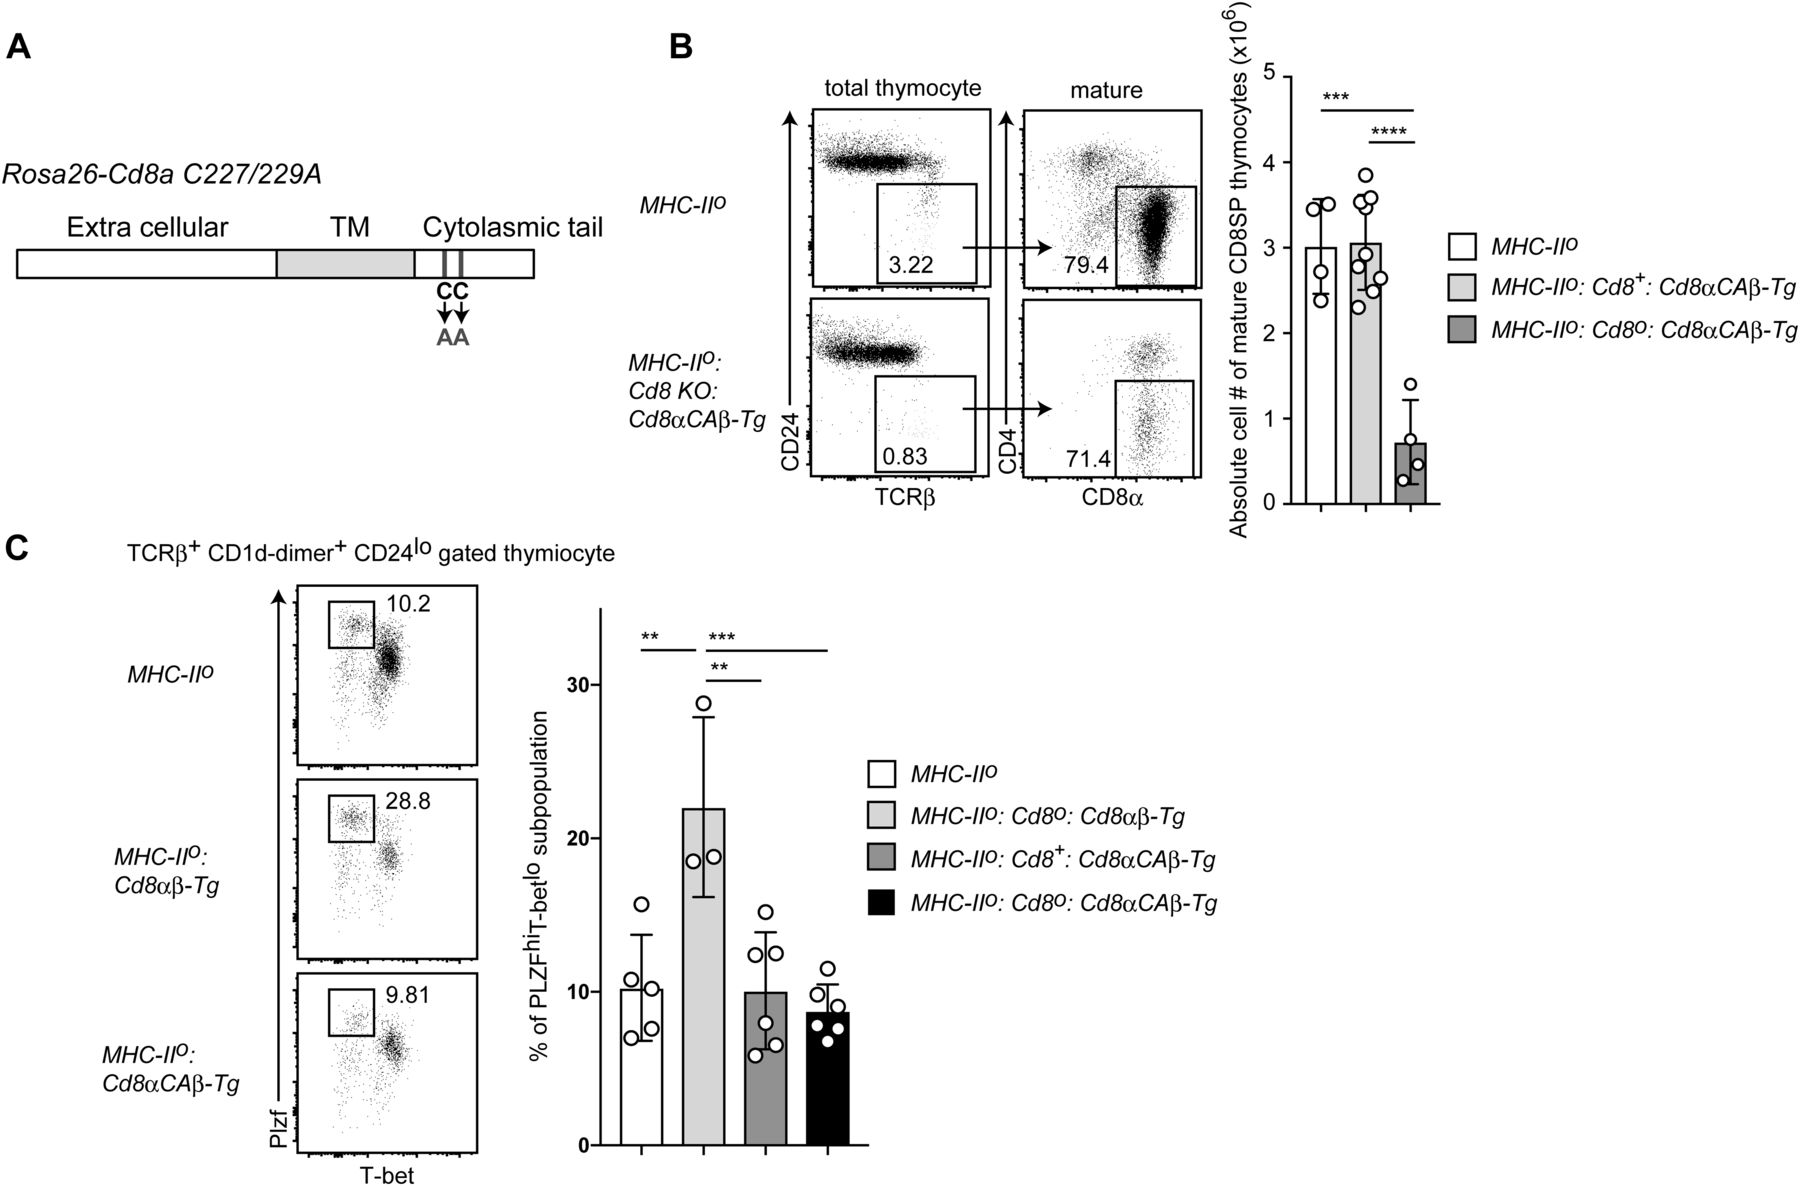
(A) Schematic structure of the C227/229A mutant CD8a chain inserted in the Rosa26 locus. Two cysteine residues at positions 227 and 229 in the CD8α chain cytoplasmic tail were changed to alanine. (B) Dot plots showing CD24 and TCRβ expression to define mature thymocytes and CD4 and CD8 expression in mature thymocytes. Numbers in the dot plots indicate percentage of cells in the indicated gates (left). Graph showing summary of absolute number of mature CD8 SP thymocytes of mice with indicated genotype (right). Mean ± SD. ***P < 0.001, ****P < 0.0001 (one-way ANOVA with Tukey’s multiple comparison). (C) Dot plot showing T-bet and PLZF expression in thymic iNKT cells of mice of the indicated genotype (top). Numbers indicate percentage of cells in the indicated gate that defines iNKT2 subset. Graph showing a summary of iNKT2 frequency among iNKT cells of mice with the indicated genotype (bottom). Mean ± SD. **P < 0.01, ***P < 0.0001 (one-way ANOVA with Tukey’s multiple comparison). TM, transmembrane domain.
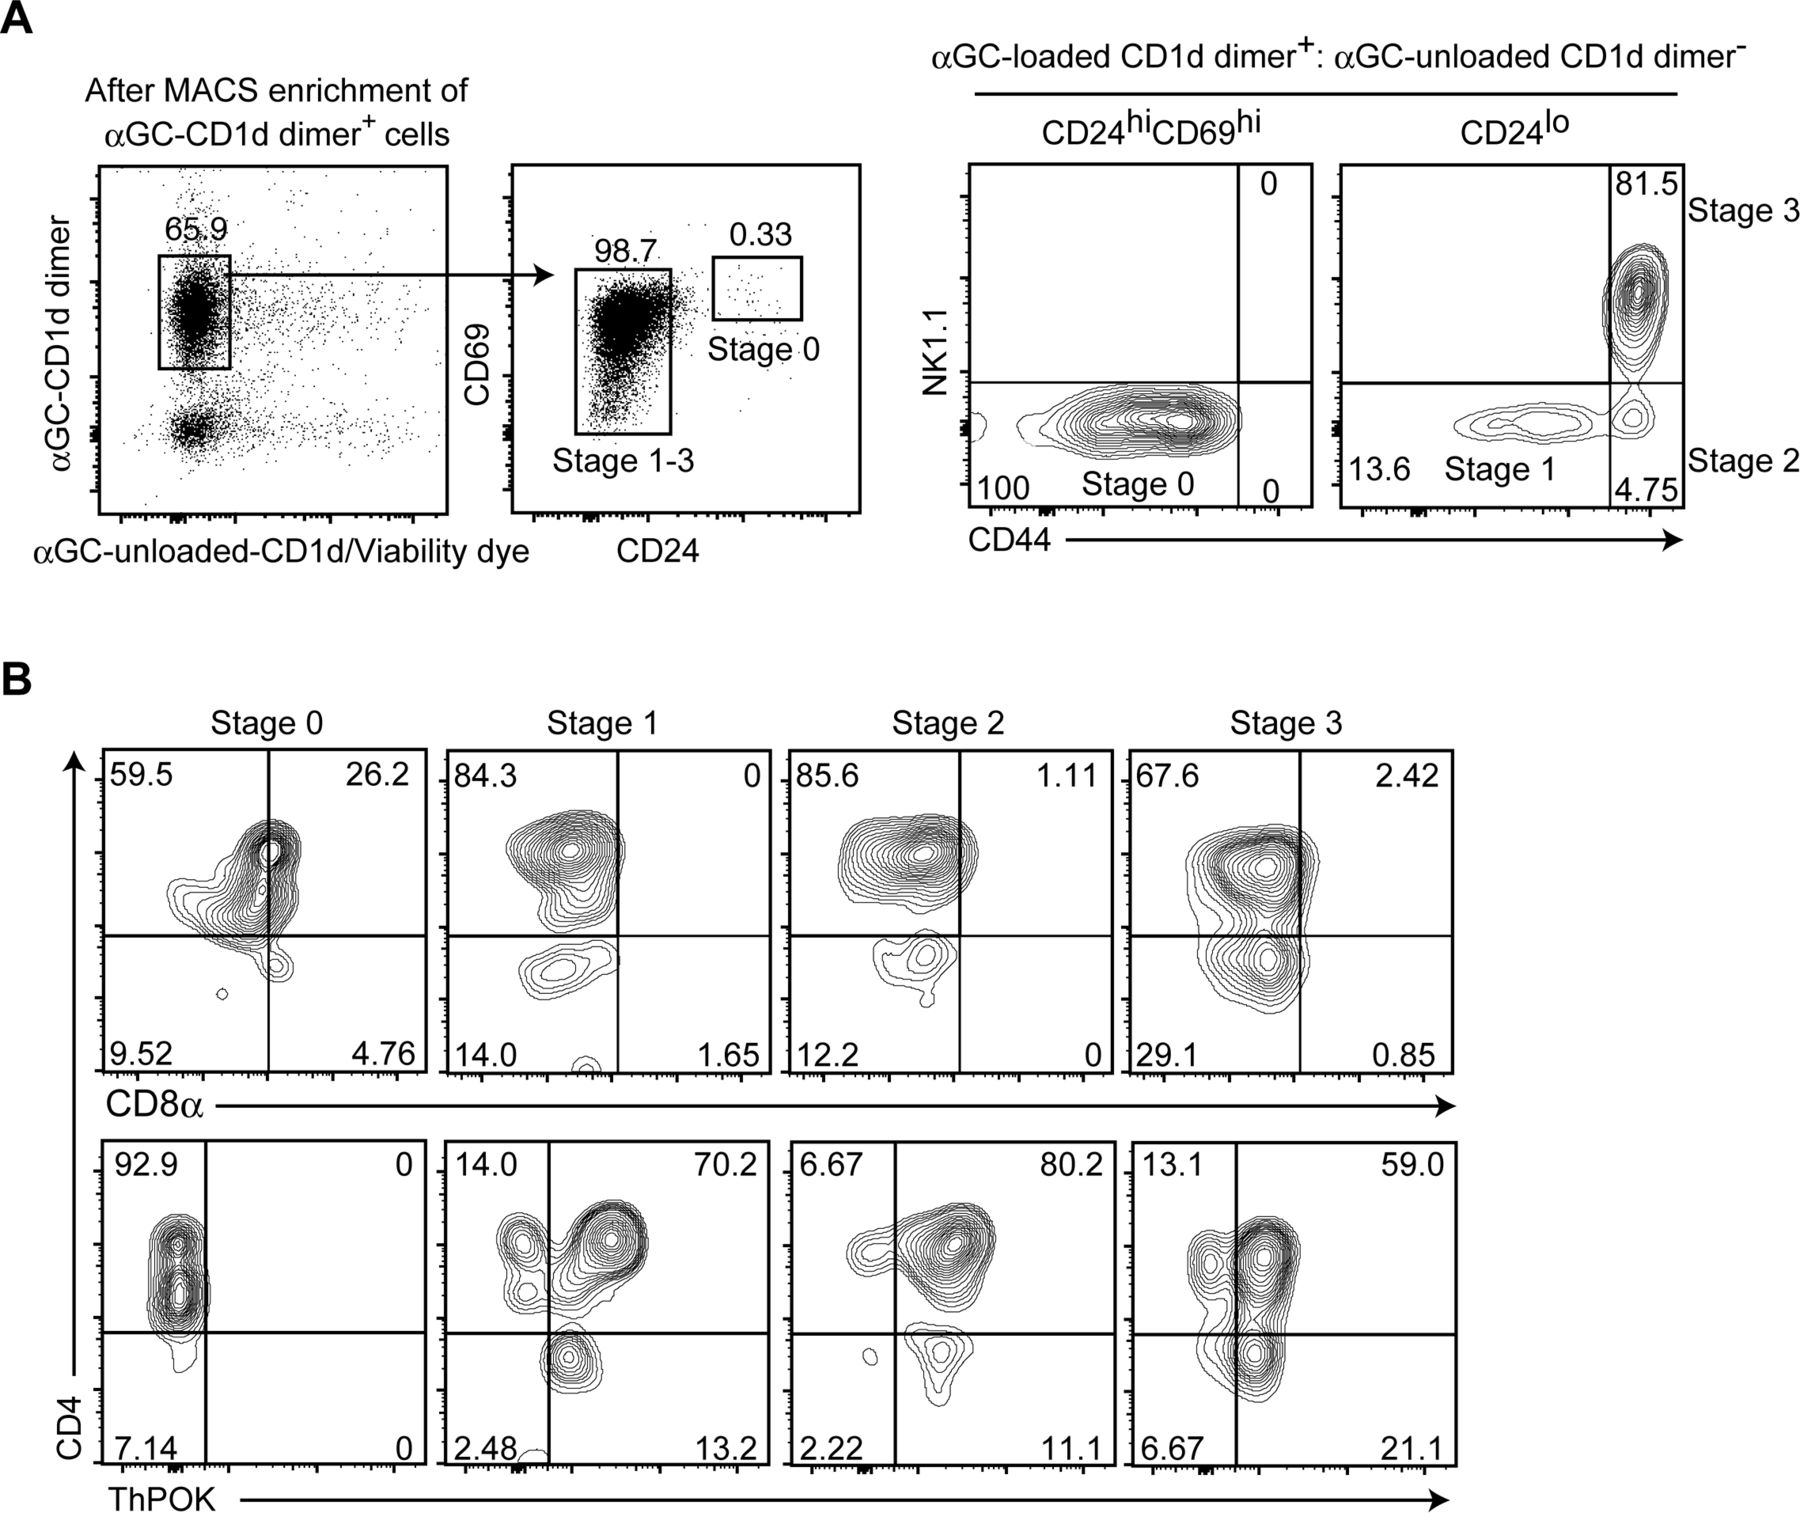
- Figure S5. CD8 down-regulation precedes ThPOK induction during iNKT-cell development in the thymus.
(A, B) CD1d-αGC+ cells were enriched from total thymocytes of 6 wk old C57BL/6 mice using magnetic beads, followed by staining of cell surface molecules and intracellular ThPOK. (A) Dot and contour plots showing the gating strategy to define iNKT cells at stage 0, stage 1, stage 2, and stage 3 based on aGC-loaded/unloaded CD1d dimer, CD24, CD69, CD44, and NK1.1 expression (A). (B) Contour plots showing CD4, CD8α, and ThPOK expression at the four stages during iNKT-cell development in the thymus (B). One representative of two experiments. Numbers in the plots indicate the percentage of cells in each quadrant.


