


Article Figures & Data
Figures
- Figure 1. The dynamic localization pattern of CLIC4 during cell division is dependent on RhoA activation and requires Cys35 and Phe37 residues.
(A) Live-cell imaging of CLIC4 translocation to the cleavage furrow. Imaging of stable CLIC4-GFP expressing cells was performed. Frames from a time-lapse movie at the indicated stages are shown. Scale bar, 10 μm. (B) Representative images of CLIC4 localization at the cleavage furrow/midbody after RhoA inhibition. 0, 25, and 50 μM concentrations of Rhosin (RhoA inhibitor) were used to decrease the activity of intracellular RhoA during cytokinesis. Maximum intensity projections of Z-stacks show endogenous CLIC4 (green), microtubules (β-tubulin, red), and DNA staining (DAPI, blue). Scale bar, 5 μm. (C) Quantification of CLIC4 localization at the cleavage furrow after RhoA inhibition in 0 μM (red trace, n = 15 cells), 25 μM (blue trace, n = 15 cells), and 50 μM Rhosin-treated cells (green trace, n = 18 cells). One-way ANOVA with Dunnett’s post hoc test was performed to compare endogenous CLIC4 intensities at the cleavage furrow (right) (***P < 0.001). Mean ± SEM are shown. (D) Representative images of CLIC4 localization at the cleavage furrow/midbody in stable wild-type (WT) and mutant (C35A and F37D) CLIC4-GFP expressing cells. Maximum intensity projections of Z-stacks show GFP-tagged WT and mutant CLIC4 proteins (green), microtubules (α-tubulin, red), and DNA staining (DAPI, blue). Scale bar, 5 μm. (E) Quantification of wild-type and mutant CLIC4-GFP localizations at the cleavage furrow. GFP intensities at the cleavage furrow were measured for CLIC4-GFP WT (red trace, n = 7 cells), C35A mutant (blue trace, n = 7 cells), and F37D mutant (green trace, n = 7 cells) and compared by using one-way ANOVA with Dunnett’s post hoc test (right) (***P < 0.001). Mean ± SEM are shown. (F) Live-cell imaging of stable mutant CLIC4-GFP–expressing cells during cell division, C35A mutant (top) and F37D mutant (bottom). Representative frames of time-lapse movies at the indicated stages are shown. Scale bar, 10 μm.
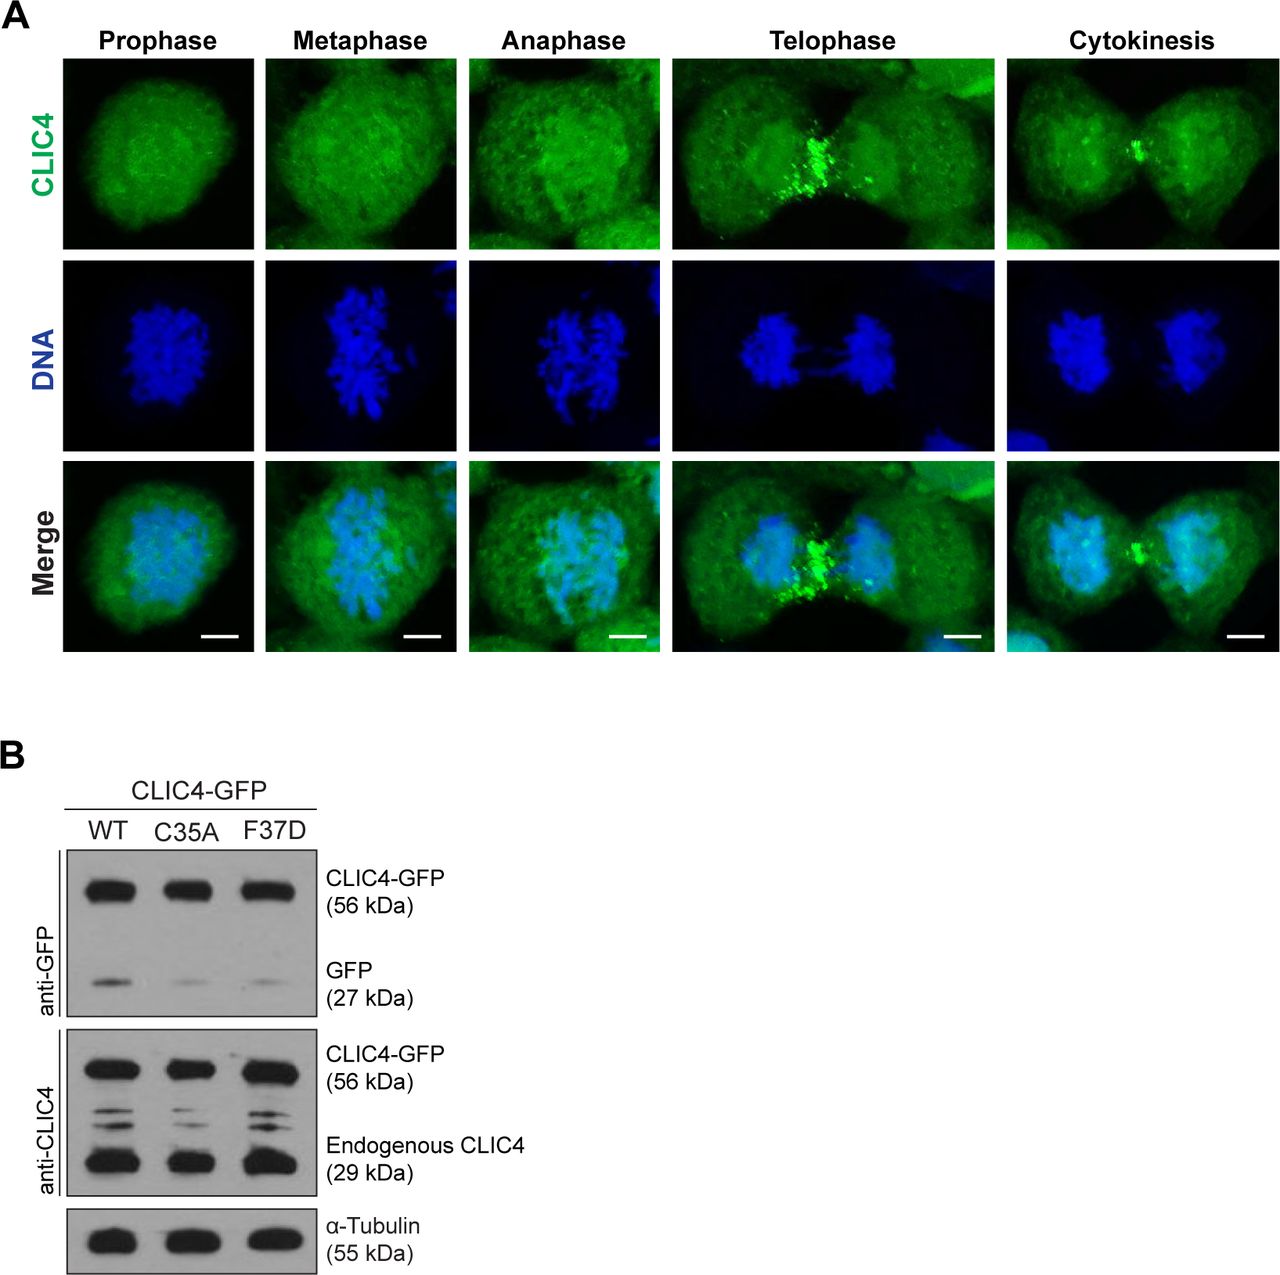
- Figure S1. CLIC4 accumulates at the cleavage furrow and midbody during cytokinesis.
(A) Localization of endogenous CLIC4 throughout the cell cycle. Maximum intensity projections of Z-stacks show endogenous CLIC4 (green) and DNA staining (DAPI, blue). Scale bars, 5 μm. (B) Analysis of transfection efficiencies of wild-type and mutant CLIC4-GFP plasmids by Western blotting. Total lysates of transfected cells were immunoblotted with anti-GFP antibody to examine the wild-type and mutant CLIC4-GFP (C35A and F37D) levels and with anti-CLIC4 antibody to observe both endogenous CLIC4 and CLIC4-GFP levels. α-Tubulin was used as a loading control.
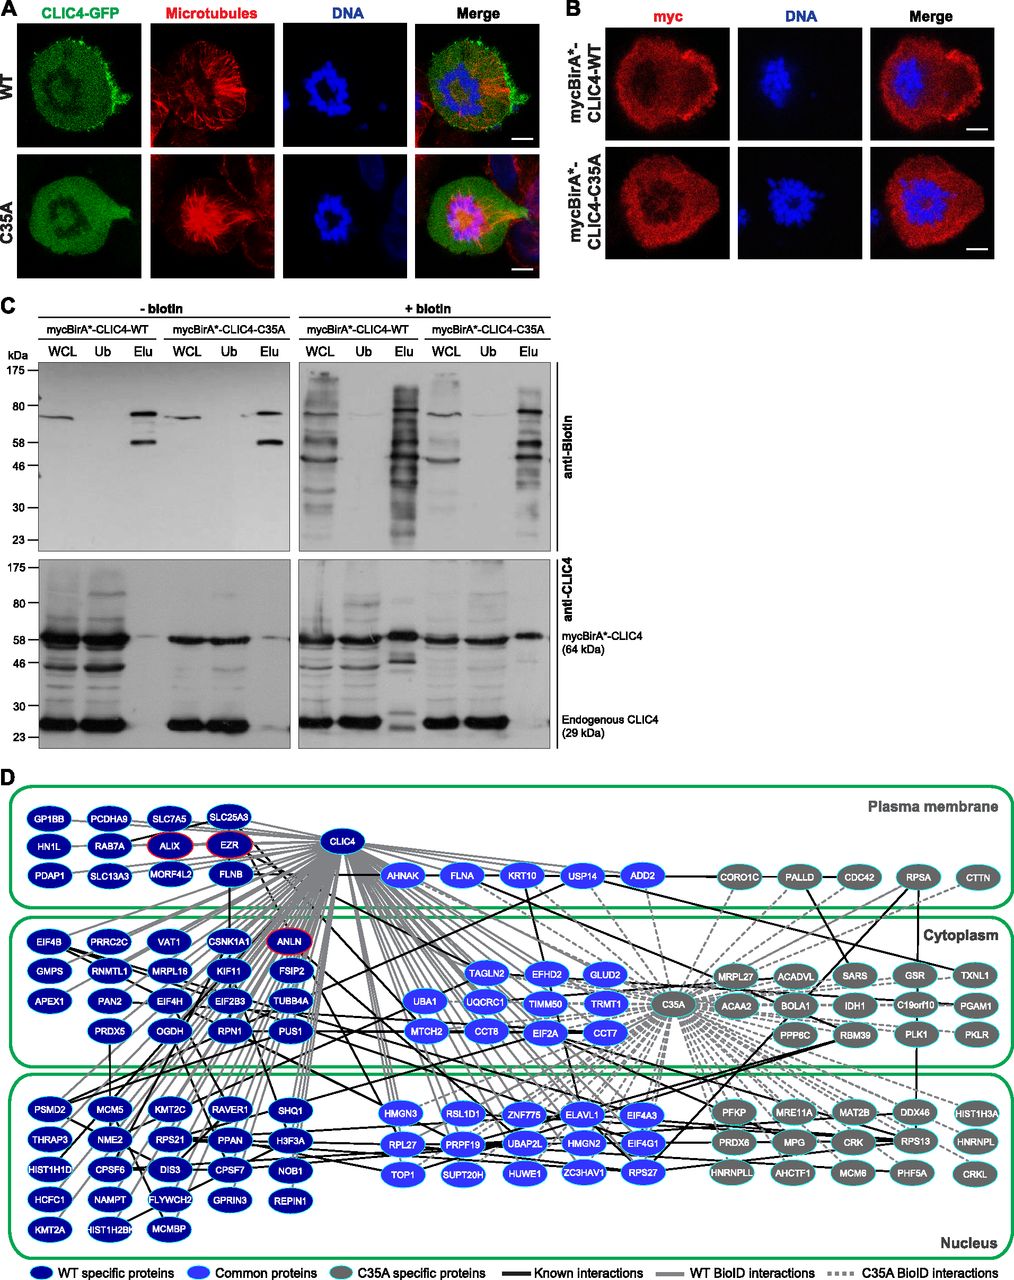
- Figure 2. Comparison of proximity interactomes reveals wild-type CLIC4–specific protein interactions in cytokinesis.
(A) Subcellular localization of WT (top) and C35A-mutant (bottom) CLIC4-GFP proteins in cells arrested at monopolar cytokinesis. Images show GFP-tagged WT and C35-mutant CLIC4 proteins (green), microtubules (α-tubulin, red), and DNA staining (DAPI, blue). Scale bars, 5 μm. (B) Subcellular localization of mycBirA*-tagged WT and C35A-mutant CLIC4 proteins in monopolar cytokinesis cells. The cells were seeded on glass coverslips, transfected with mycBirA*-CLIC4-WT (top) and mycBirA*-CLIC4-C35A (bottom), and arrested at monopolar cytokinesis. Images show myc-tag (red) and DNA staining (DAPI, blue). Scale bars, 5 μm. (C) Affinity capture of biotinylated proteins using lysates of mycBirA*-CLIC4-WT and mycBirA*-CLIC4-C35A transfected monopolar cytokinesis cells either with (right) or without supplemental biotin (50 μM) (left). Whole cell lysate (WCL) and streptavidin pull-down samples (unbound [Ub] and elute [Elu] fractions) were immunoblotted with anti-biotin (top) and anti-CLIC4 antibodies (bottom). mycBirA*-CLIC4-WT and mycBirA*-CLIC4-C35A were able to biotinylate proteins and the biotinylated proteins were purified by streptavidin pull-down. (D) Comparison of WT and C35A-mutant CLIC4 proximity interactomes in monopolar cytokinesis. Nodes represent unique proteins identified and categorized according to their presence in only one network (WT-specific proteins, dark blue nodes; C35A specific proteins, grey nodes) or in both networks (common proteins, light blue nodes). Gene Ontology cellular component analysis was performed to group proteins based on their subcellular localization (nucleus, cytoplasm, and plasma membrane). Black edges represent already known protein–protein interactions within the interactomes determined by the STRING v10.5 database. Solid grey and dashed grey edges represent WT and C35A-mutant specific BioID interactions of CLIC4, respectively. Nodes highlighted with red lines (ezrin [EZR], anillin [ANLN], and ALIX) represent WT-specific interaction partners of CLIC4 selected for further analysis.
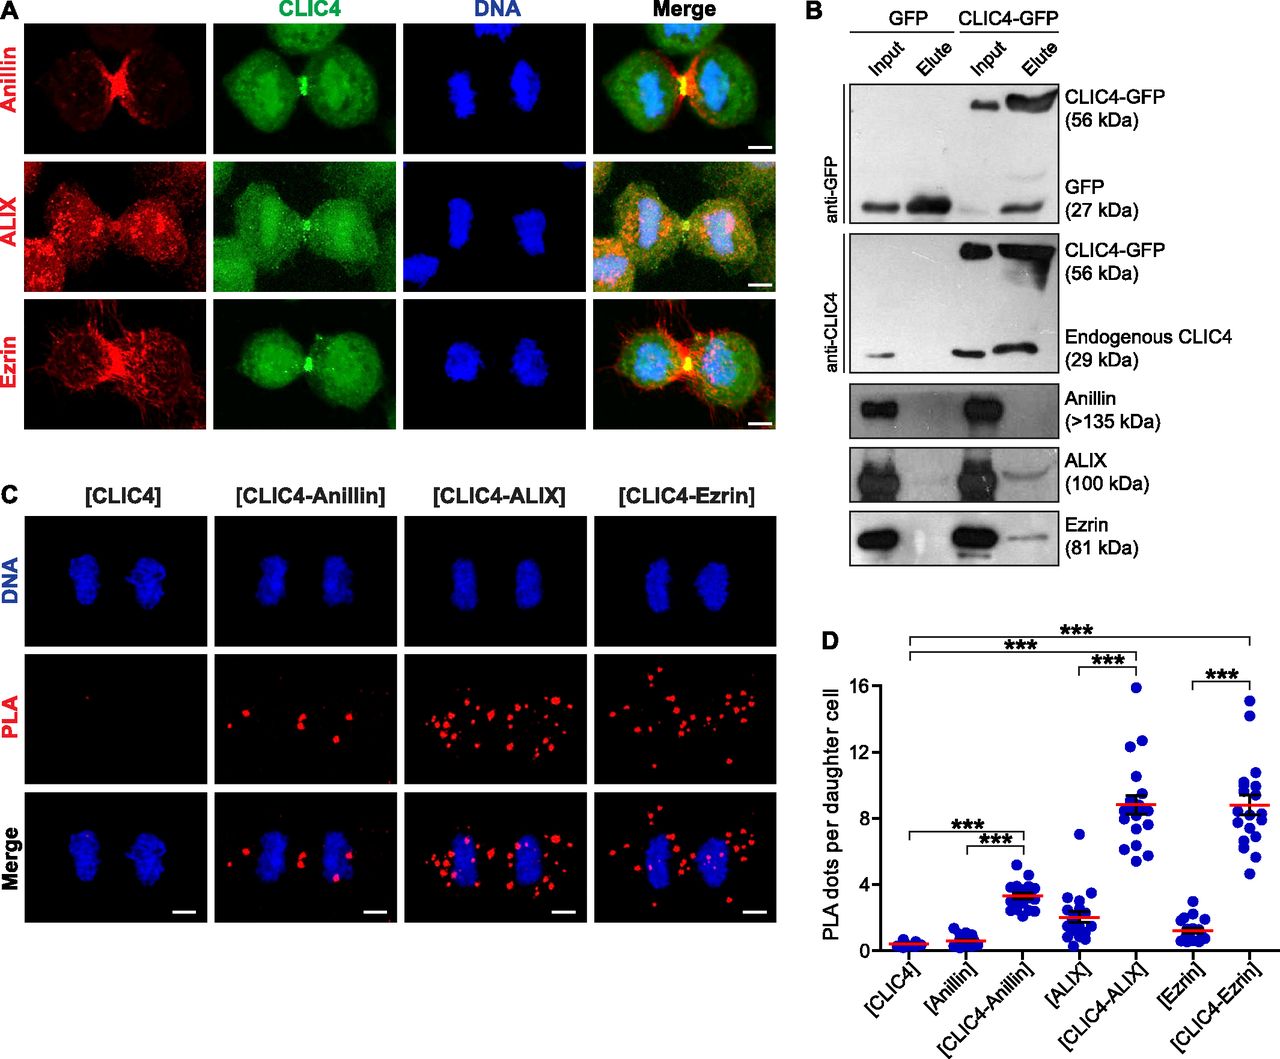
- Figure 3. CLIC4 interacts with anillin, ALIX, and ezrin in cytokinesis.
(A) Co-localization of endogenous CLIC4 with anillin, ALIX, and ezrin in cytokinesis. Maximum intensity projections of Z-stacks show endogenous anillin, ALIX, and ezrin (red), endogenous CLIC4 (green), and DNA staining (DAPI, blue). Scale bars, 5 μm. (B) Co-immunoprecipitation analysis of interaction partners of CLIC4 in cytokinesis arrested cells using the sensitive GFP-trap approach. Western blot analyses of whole cell lysates (input) and elute fractions obtained from stable GFP (as control) and CLIC4-GFP expressing cells were performed against anti-GFP (top), anti-CLIC4 (middle), anti-anillin, anti-ALIX, and anti-ezrin antibodies (bottom). Co-immunoprecipitation of ALIX and ezrin with only CLIC4-GFP indicates that CLIC4 resides in the same complex with ezrin and ALIX during cytokinesis. (C) Spatial analysis of the interactions of CLIC4 with anillin, ALIX, and ezrin in intact cytokinesis cells by in situ proximity ligation assay (PLA). The representative images show the interactions between the examined antibody pairs as red fluorescent PLA puncta. Cells were also stained with DAPI for DNA (blue). Control was treated with only anti-CLIC4 antibody. Each image is the maximum intensity projection of a Z-stack and represent a typical cell staining observed in 20 fields chosen randomly. Scale bars, 5 μm. (D) Quantification of the interactions of CLIC4 in cytokinesis by in situ PLA. In addition to only anti-CLIC4 antibody–treated cells (n = 533), cells subjected to only anti-anillin (n = 639), anti-ALIX (n = 538), and anti-ezrin (n = 499) antibodies (Fig S2) were also quantified as controls. The cells treated with antibody pairs of CLIC4-anillin (n = 757), CLIC4-ALIX (n = 456), and CLIC4-ezrin (n = 499) were used for the interaction analysis. Red lines indicate the mean number of PLA dots per daughter cell nucleus. Comparison of multiple groups was performed by one-way ANOVA with Bonferroni post hoc test (***P < 0.001). Mean ± SEM are shown.
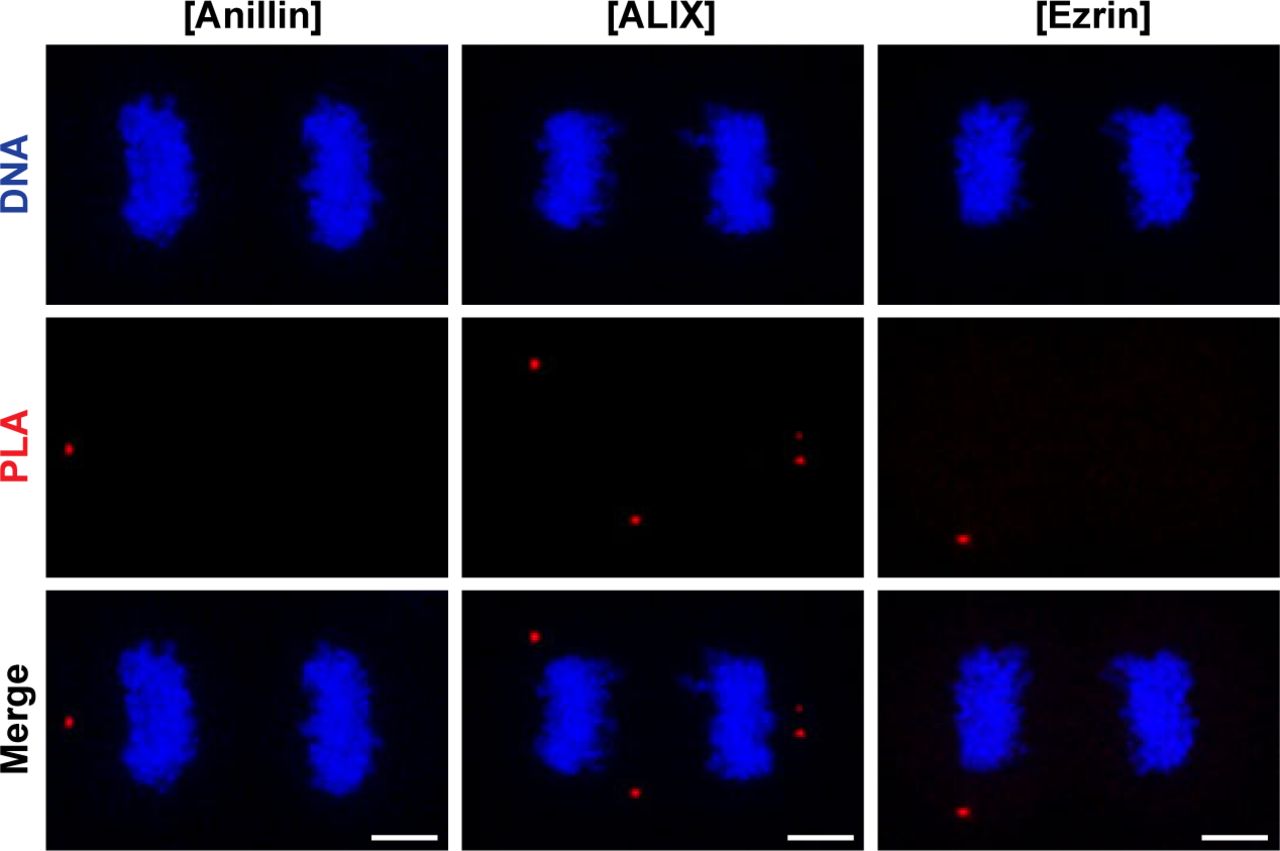
- Figure S2. Negative, technical controls of PLA omitting anti-CLIC4 primary antibody.
Representative images show controls of PLA where single primary antibody was used as anti-anillin (left), anti-ALIX (middle), and anti-ezrin (right). Nonspecific signals were indicated by red fluorescent PLA puncta. Cells were also stained with DAPI for DNA (blue). Each image is the maximum intensity projection of a Z-stack and represents a typical cell staining observed in 20 fields chosen randomly. Scale bars, 5 μm. Quantification of nonspecific signals by in situ PLA were shown in Fig 3D.
- Figure 4. Single and double knockouts of CLIC4 and CLIC1 lead to multinucleated cells.
(A) CLIC4 knockout (KO) validation was achieved by Western blot analysis of the whole cell lysates using anti-CLIC4 antibody. α-Tubulin was used as a loading control. (B) Western blot analysis of CLIC4-GFP expression in the CLIC4 KO rescue cell lines. Whole cell lysates were immunoblotted with anti-GFP antibody to detect the expression of CLIC4-GFP. α-Tubulin was used as a loading control. (C) Quantification of multinucleation percentage of CLIC4 KO and CLIC4-GFP expressing CLIC4 KO rescue cell lines. Cells were stained with anti-α-tubulin antibody (red) and DAPI for DNA (blue). Asterisks in the representative images denote multinucleated cells. Scale bars, 20 μm. Multinucleation percentage was statistically higher in CLIC4 KO cells, and CLIC4-GFP expression in CLIC4 KO cells significantly decreased multinucleation percentage. n ≥ 300 cells per experiment were quantified and mean ± SEM of three independent experiments are shown. One-way ANOVA with Bonferroni post hoc test was used for statistical analysis (*P < 0.05; **P < 0.01; ***P < 0.001). (D) CLIC1 KO validation was achieved by Western blot analysis of the whole cell lysates using anti-CLIC1 antibody. CLIC4 expression was not altered in CLIC1 KO cells as revealed by immunoblotting with anti-CLIC4 antibody. α-Tubulin was used as a loading control. (E) Western blot analysis of CLIC1-GFP expression in the CLIC1 KO cell lines. Whole cell lysates were immunoblotted with anti-GFP antibody to detect expression of CLIC1-GFP. α-Tubulin was used as a loading control. (F) Quantification of multinucleation percentage of CLIC1 KO and CLIC1-GFP expressing CLIC1 KO rescue cell lines. Cells were stained with anti-α-tubulin antibody (red) and DAPI for DNA (blue). Asterisks in the representative images denote multinucleated cells. Scale bars, 20 μm. Multinucleation percentage was statistically higher in CLIC1 KO cells and CLIC1-GFP re-expression in CLIC1 KO cells significantly decreased multinucleation percentage. n ≥ 300 cells per experiment were quantified and mean ± SEM of three independent experiments are shown. One-way ANOVA with Bonferroni post hoc test was used for statistical analysis (*P < 0.05; **P < 0.01; ***P < 0.001). (G) CLIC1/4 double KO (DKO) validation was achieved by Western blot analysis of the whole cell lysates using anti-CLIC4 and anti-CLIC1 antibodies. α-Tubulin was used as a loading control. (H) Quantification of multinucleation percentage of CLIC1/4 DKO cell lines. Cells were stained with anti-α-tubulin antibody (red) and DAPI for DNA (blue). Asterisks in the representative images denote multinucleated cells. Scale bars, 20 μm. Multinucleation percentage was statistically higher in CLIC1/4 DKO cells. n ≥ 200 cells per experiment were quantified and mean ± SEM of three independent experiments are shown. One-way ANOVA with Dunnett’s post hoc test was used for statistical analysis (***P < 0.001). (I) Quantification of successful and defective cell divisions of control and CLIC1/4 DKO cells by live-cell imaging. Cells were imaged for 24 h. n = 371 cell divisions from six experiments for control cells and n = 526 cell divisions from eight experiments for CLIC1/4 DKO cells were quantified and mean ± SEM are shown. Unpaired two-tailed t test was used for significance analysis (**P < 0.01). (J) Representative still images of time-lapse movies showing a successful cell division in control cell line and cytokinesis defect in CLIC1/4 DKO c9 cell line. Dividing cells were marked with yellow dashed lines before and after cell division. Red arrows indicate the presence of midbody. Scale bars, 10 μm.
- Figure S3. CLIC1 accumulates at the cleavage furrow and midbody during cytokinesis.
(A) Live-cell imaging of stable CLIC1-GFP expressing cells during cell division. Representative frames of a time-lapse movie at the indicated stages are shown. Scale bar, 10 μm. (B) Representative image of endogenous CLIC1 localization at the cleavage furrow. Maximum intensity projections of Z-stack show endogenous CLIC1 (green), microtubules (β-tubulin, red), and DNA staining (DAPI, blue). Scale bar, 5 μm. (C) Representative image of CLIC1-GFP localization at the cleavage furrow. Maximum intensity projections of Z-stack show CLIC1-GFP (green), microtubules (β-tubulin, red), and DNA staining (DAPI, blue). Scale bar, 5 μm. (D) Analysis of CLIC1 localization at the cleavage furrow. Mean ± SEM of endogenous CLIC1 intensities at the cleavage furrow are shown (n = 14 cells).
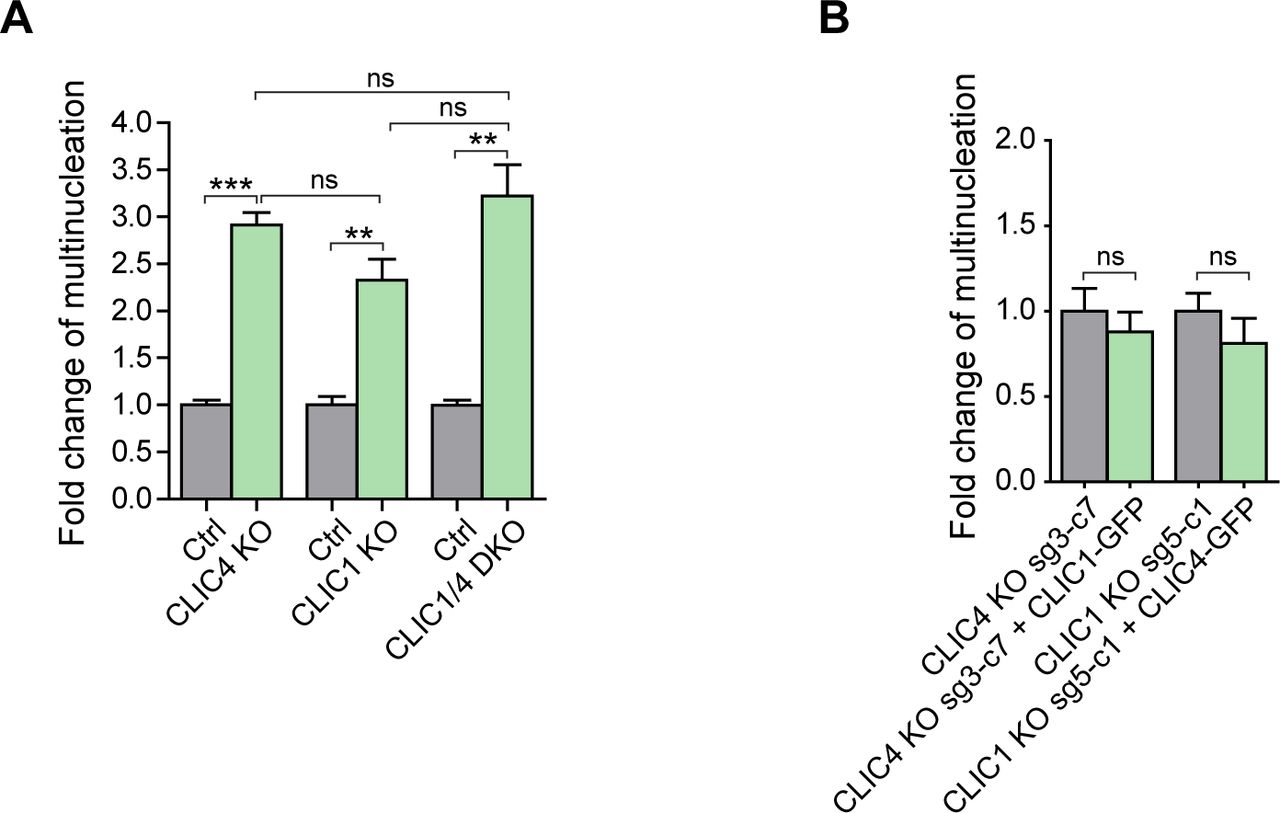
- Figure S4. Comparison of multinucleation rate in CLIC1/4 knockout cell lines and functional complementation analysis.
(A) Fold change analysis revealed a mild increase in the multinucleation rate of CLIC1/4 DKO cells when compared with single CLIC4 or CLIC1 knockout cells. Control conditions were normalized to one. Comparison of multiple groups was performed by one-way ANOVA with Bonferroni post hoc test (***P < 0.001; ns, nonsignificant). (B) Fold change analysis of multinucleation rate revealed that CLIC1 overexpression in CLIC4 KO cells (sg3-c7) and CLIC4 overexpression in CLIC1 KO cells (sg5-c1) cannot functionally complement each other. Control conditions were normalized to one. Unpaired two-tailed t test was used for significance analysis (ns, nonsignificant).
- Figure 5. CLIC4 and CLIC1 regulate membrane blebbing during cytokinesis.
(A) Live-cell imaging of stable Lifeact-RFP expressing control (top) and CLIC1/4 DKO c2 (bottom) cells. Representative frames of time-lapse movies at the indicated time points are presented. CLIC1/4 DKO cells show abnormal bleb formation at the polar cortex during cell division. Arrowheads denote the furrow regression in CLIC1/4 DKO cells and so the multinucleated cell formation. Scale bar, 10 μm. (B) Quantification of maximal bleb extension during cytokinesis in control and CLIC1/4 DKO cells. n = 129 cells for control and n = 95 cells for CLIC1/4 DKO c2 were quantified and individual blebs were plotted based on their maximal length. Red lines indicate the median of bleb maximal length for each condition. Unpaired two-tailed t test was used for significance analysis (***P < 0.001). (C) Spatiotemporal regulation of CLIC4-GFP (top) and CLIC1-GFP (bottom) during bleb retraction. Representative frames of time-lapse movies at the indicated time points are presented. Arrowheads denote membrane blebs at different phases, from expansion to retraction during cytokinesis. Both CLIC4-GFP and CLIC1-GFP localize to the bleb rim during retraction phase of the membrane blebs. Scale bar, 10 μm.
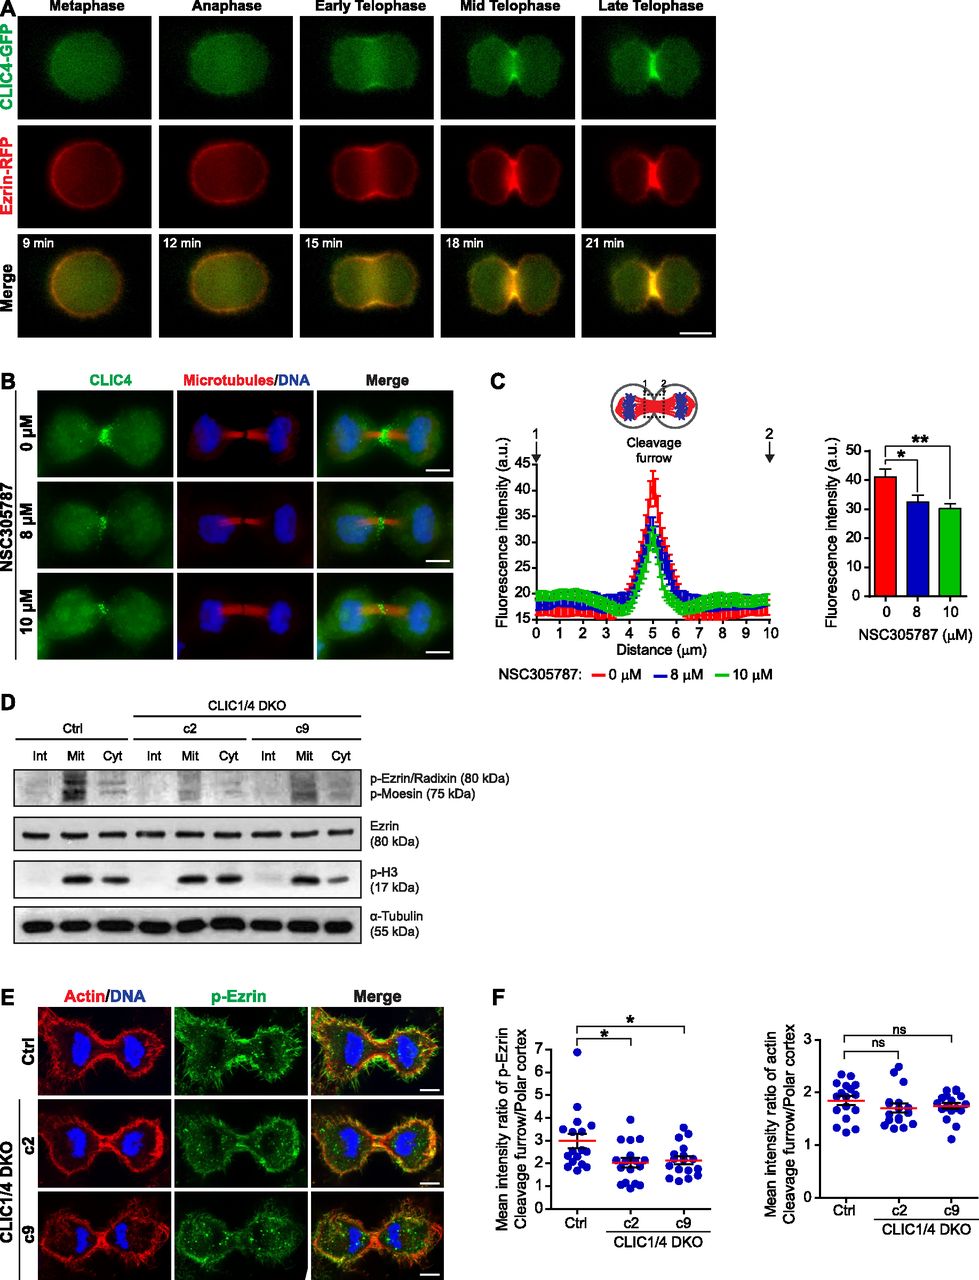
- Figure 6. CLIC4 enhances ezrin phosphorylation to be translocated to the cleavage furrow.
(A) Live-cell imaging of CLIC4-GFP and ezrin-RFP translocation to the cleavage furrow. Imaging of stable CLIC4-GFP and ezrin-RFP expressing cells were performed and representative frames of a time-lapse movie at the indicated stages are shown. Scale bar, 10 μm. (B) Representative images displaying the effect of ezrin inhibition on CLIC4 localization at the cleavage furrow. 0, 8, and 10 μM concentrations of NSC305787 (ezrin inhibitor) were used to decrease the activity of intracellular ezrin during cytokinesis. Maximum intensity projections of Z-stacks show endogenous CLIC4 (green), microtubules (β-tubulin, red), and DNA staining (DAPI, blue). Scale bar, 10 μm. (C) Quantification of CLIC4 localization at the cleavage furrow in 0 μM (red trace, n = 26 cells), 8 μM (blue trace, n = 21 cells), and 10 μM NSC305787-treated cells (green trace, n = 26 cells). One-way ANOVA with Dunnett’s post hoc test was performed to compare endogenous CLIC4 intensities at the cleavage furrow (right). (*P < 0.05; **P < 0.01). Mean ± SEM are shown. (D) Western blot analysis of ezrin and phospho–ezrin–radixin–moesin (pERM) in CLIC1/4 DKO cells at different phases of the cell cycle. Whole cell lysates were immunoblotted with anti-phospho-ERM antibody to detect phosphorylated ERM and with anti-ezrin antibody to observe endogenous ezrin expression levels. Although expression of endogenous ezrin was not altered in CLIC1/4 DKO cells, its phosphorylation was significantly decreased because of the absence of CLIC4 and CLIC1. Anti-phospho-H3 (p-H3) and anti-α-tubulin antibodies were used as mitosis marker and loading control, respectively. (E) Representative images of phospho-ezrin (p-ezrin) at the cleavage furrow in control and CLIC1/4 DKO cells. Maximum intensity projections of Z-stacks show phospho-ezrin (green), actin filaments (Phalloidin, red), and DNA staining (DAPI, blue). Scale bars, 5 μm. (F) Quantification of the mean intensity ratio of cleavage furrow to polar cortex for p-ezrin (left) and actin filaments (right) levels in control (n = 17 cells) and CLIC1/4 DKO cell lines (n = 17 cells for both c2 and c9). One-way ANOVA with Dunnett’s post hoc test was performed (*P < 0.05; ns, nonsignificant). Mean ± SEM are shown.
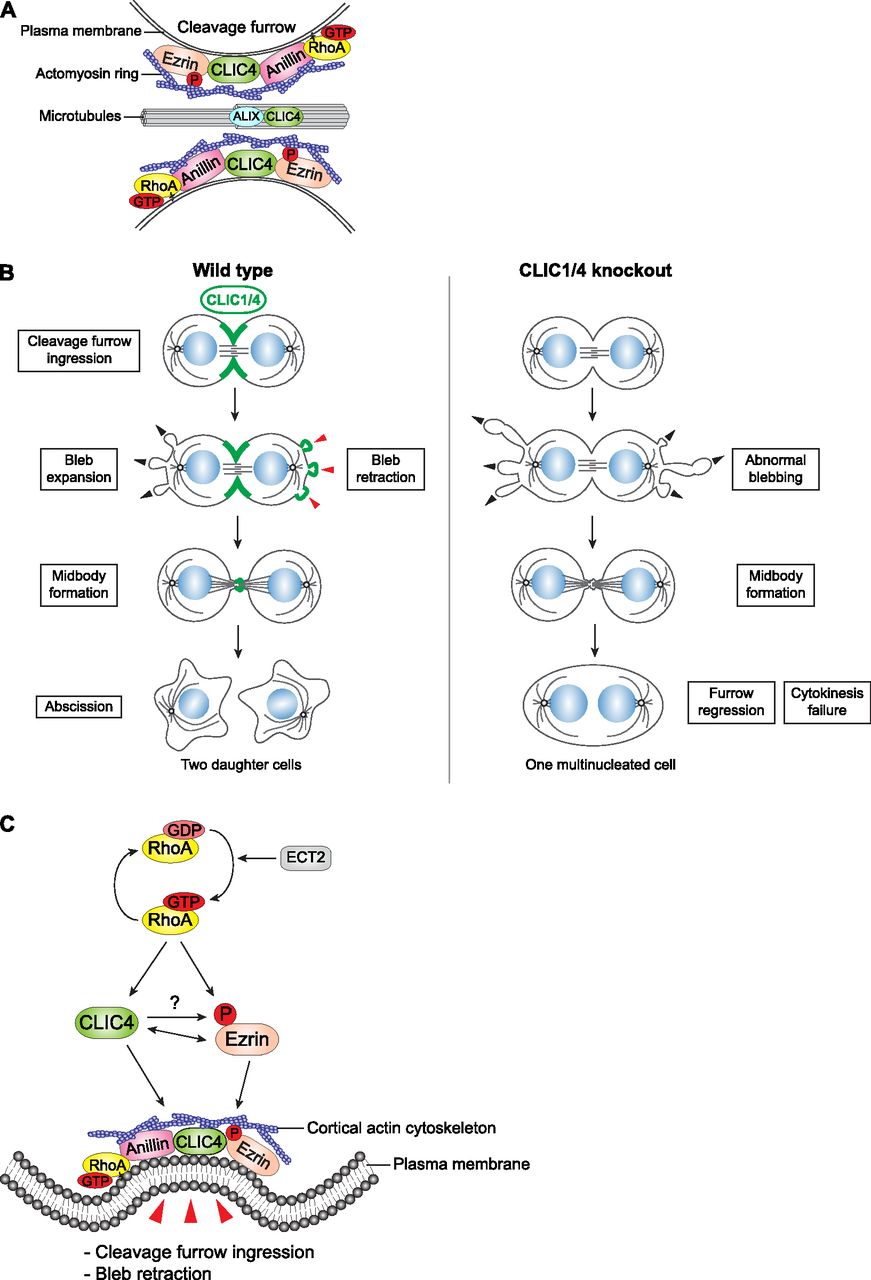
- Figure 7. A model describing new roles of CLIC4 and CLIC1 during cytokinesis.
(A) CLIC4 interacts with ezrin, anillin, and ALIX during cytokinesis and provides a link between RhoA signaling and actin cytoskeleton–plasma membrane anchorage at the cleavage furrow and midbody. (B) Both CLIC4 and CLIC1 localize to the cleavage furrow, polar blebs at the retraction phase, and midbody during cell division. The absence of CLIC4 and CLIC1 causes abnormal blebbing at the polar cortex and furrow regression at late cytokinesis which results in multinucleated cells. (C) The proposed signaling scheme of CLIC4 function in cleavage furrow ingression and bleb retraction. Activation of RhoA by its RhoGEF ECT2 leads to translocation of CLIC4 from cytosol to plasma membrane during cytokinesis, which promotes ezrin activation at the cleavage furrow through its phosphorylation. Reciprocally, ezrin activation facilitates CLIC4 accumulation at the cleavage furrow. This interaction regulates cortical stability by bridging actin cytoskeleton and plasma membrane during cleavage furrow ingression and bleb retraction.


Supplementary Materials
- Video 1
Live-cell imaging of a CLIC4-WT-GFP expressing cell during cell division. Download video
- Video 2
Live-cell imaging of a CLIC4-C35A-GFP expressing cell during cell division. Download video
- Video 3
Live-cell imaging of a CLIC1-GFP expressing cell during cell division. Download video
- Video 4
Live-cell imaging of a successful cell division observed in control cells. Download video
- Video 5
Live-cell imaging of a cytokinesis defect observed in a CLIC1/4 DKO c9 cell. Download video
- Video 6
Live-cell imaging of a Lifeact-RFP expressing control cell. Download video
- Video 7
Live-cell imaging of a Lifeact-RFP expressing CLIC1/4 DKO c2 cell. Download video
- Video 8
Live-cell imaging of CLIC4-GFP localization at the membrane blebs during cell division. Download video
- Video 9
Live-cell imaging of CLIC1-GFP localization at the membrane blebs during cell division. Download video
- Video 10
Live-cell imaging of CLIC4-GFP and ezrin-RFP co-localization during cell division. Download video


In this Issue
Subjects
Related Articles
Cited By...
- No citing articles found.