


Article Figures & Data
Figures
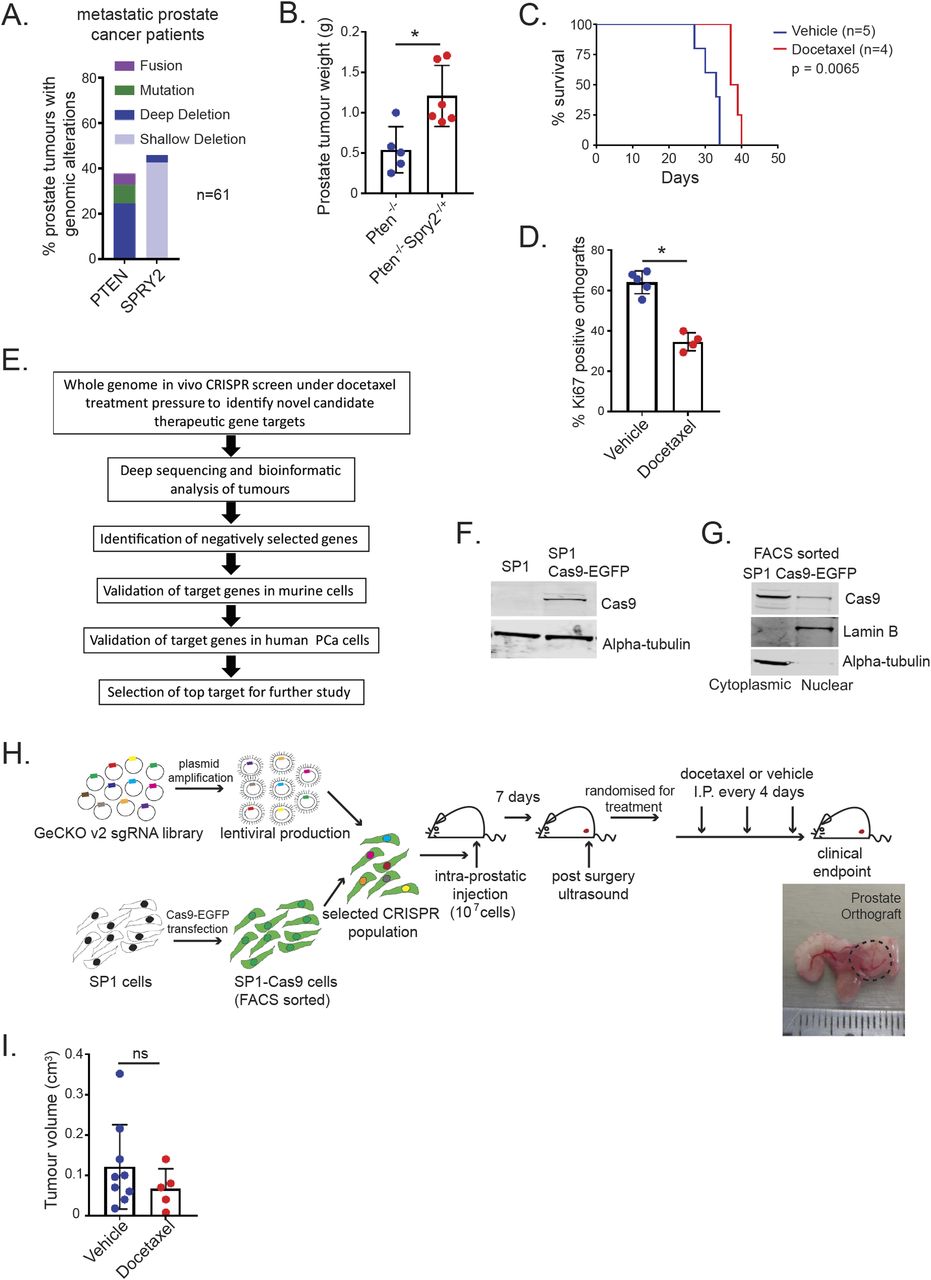
- Figure 1. In vivo whole genome CRISPR/Cas9 screen.
(A) PTEN and SPRY2 genomic alterations in metastatic prostate cancer patients with taxane treatment (SU2C/PCF Dream Team, 2015). (B) Non-cystic prostate tumour weights from indicated mice at clinical end point (Pten−/−, n = 5; Pten−/− Spry2−/+, n = 6; *P < 0.05; Mann–Whitney test; mean values ± SD are shown). (C) Kaplan–Meier plot for overall survival of SP1 prostate orthograft bearing mice treated as indicated (log-rank Mantel–Cox test). (D) IHC quantification of Ki67 staining in SP1 prostate tumour orthograft sections from CD-1 nude immunocompromised mice treated as indicated (vehicle, n = 5; docetaxel, n = 4; *P < 0.05; Mann–Whitney test; mean values ± SD are shown). (E) Schematic of the workflow of the CRISPR drop-out screen, bioinformatics analysis and target validation. (F) Western blot images to confirm expression of Cas9 in whole cell lysates from SP1 cells transfected with Cas9-EGFP. α-tubulin is used as a loading control. (G) Western blot images to confirm expression of Cas9 cytoplasmic and nuclear extracts from FACS-sorted SP1 cells with stable Cas9-EGFP expression. Lamin B and α-tubulin were used as nuclear and cytosolic markers, respectively. (H) Schematic illustration of in vivo CRISPR/Cas9 screen. SP1 cells were stably transfected with Cas9-EGFP. After double FACS sorting, SP1 cells with stable expression of Cas9 were selected and amplified for the screen. GeCKO2 V2 whole genome sgRNA library A was used for lentiviral production and transduction of SP1 Cas9-EGFP cells. After 7 d of puromycin selection, the infected SP1 cells were injected in the anterior prostates of CD1-immunocompromised mice. After 7 d of recovery, mice were randomised and treated with vehicle (n = 9) or docetaxel (n = 5). (I) sgRNA transfected SP1 prostate orthograft burden in CD-1 nude immunocompromised mice treated as indicated (Vehicle, n = 9; docetaxel, n = 5; ns, not significant; Mann–Whitney test; mean values ± SD are shown).
Source data are available for this figure.
Source Data for Figure 1[LSA-2020-00770_SdataF1.pdf]
- Figure S1.
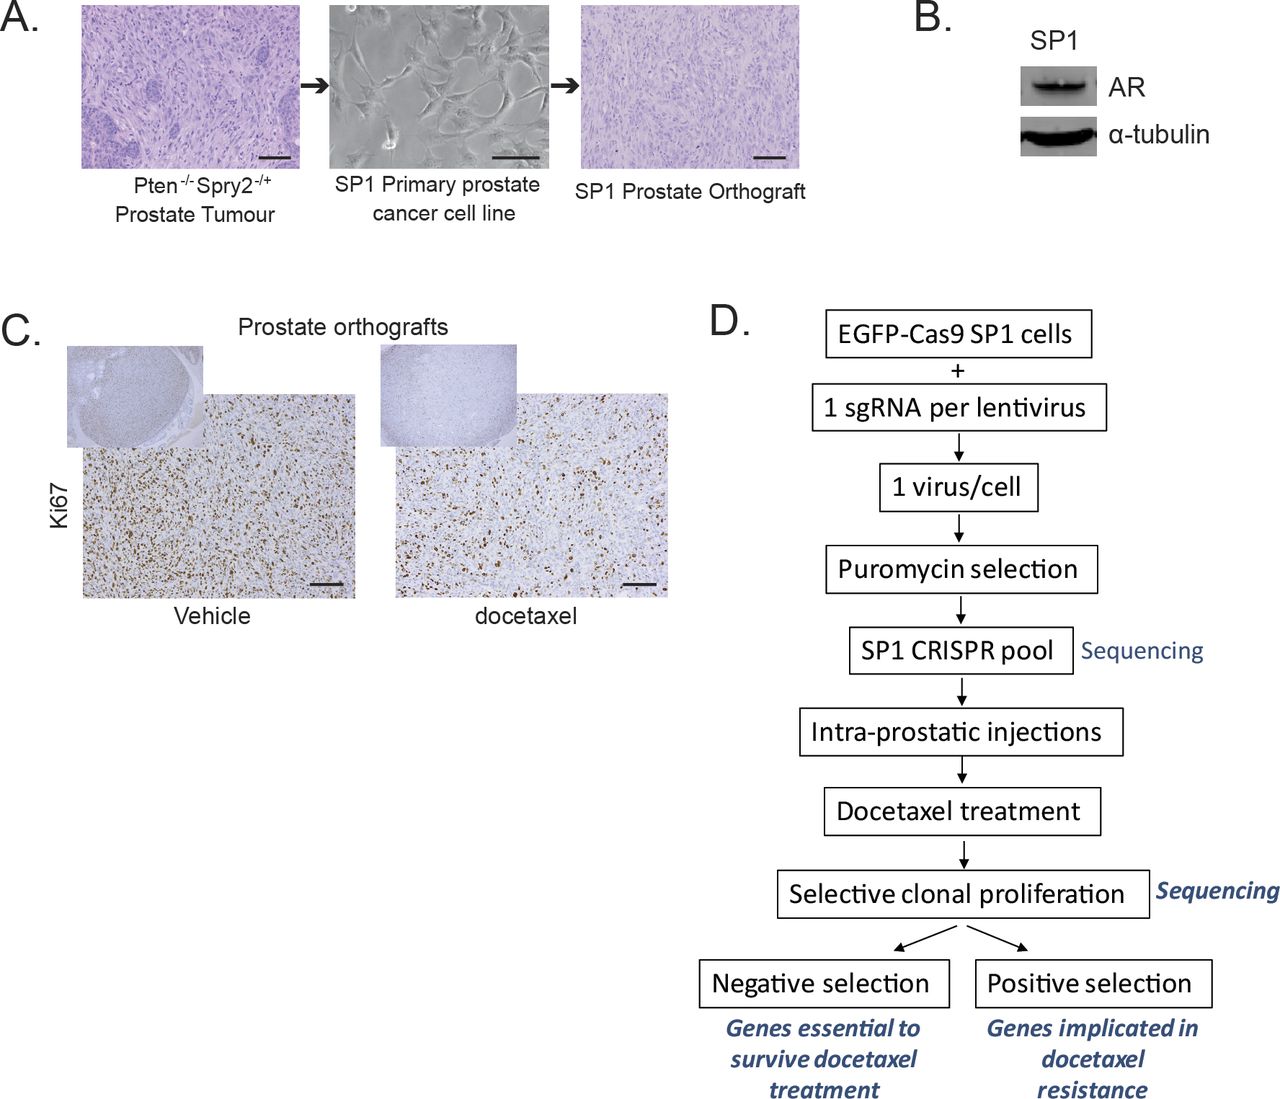
Development of an orthograft model for a CRISPR/Cas9 screen. (A) Representative images of a prostate tumour from a Probasin-Cre Ptenfl/fl Spry2fl/+ mouse, SP1 primary cell line established from a prostate tumour, and SP1 prostate orthograft generated by injecting SP1 cells in the anterior prostate of a CD-1 nude immunocompromised mouse. Scale bars = 100 μm. (B) Western blot image of androgen receptor expression in SP1 cells. α-tubulin is used as a housekeeping gene. (C) Representative immunostained images of SP1 prostate orthograft sections from CD-1 nude immunocompromised mice treated as indicated (vehicle, n = 5; docetaxel, n = 4). Scale bar = 100 μm. (D) Detailed workflow of in vivo CRISPR/Cas9 screen.
- Figure 2. Bioinformatics analysis identifies negatively selected genes.
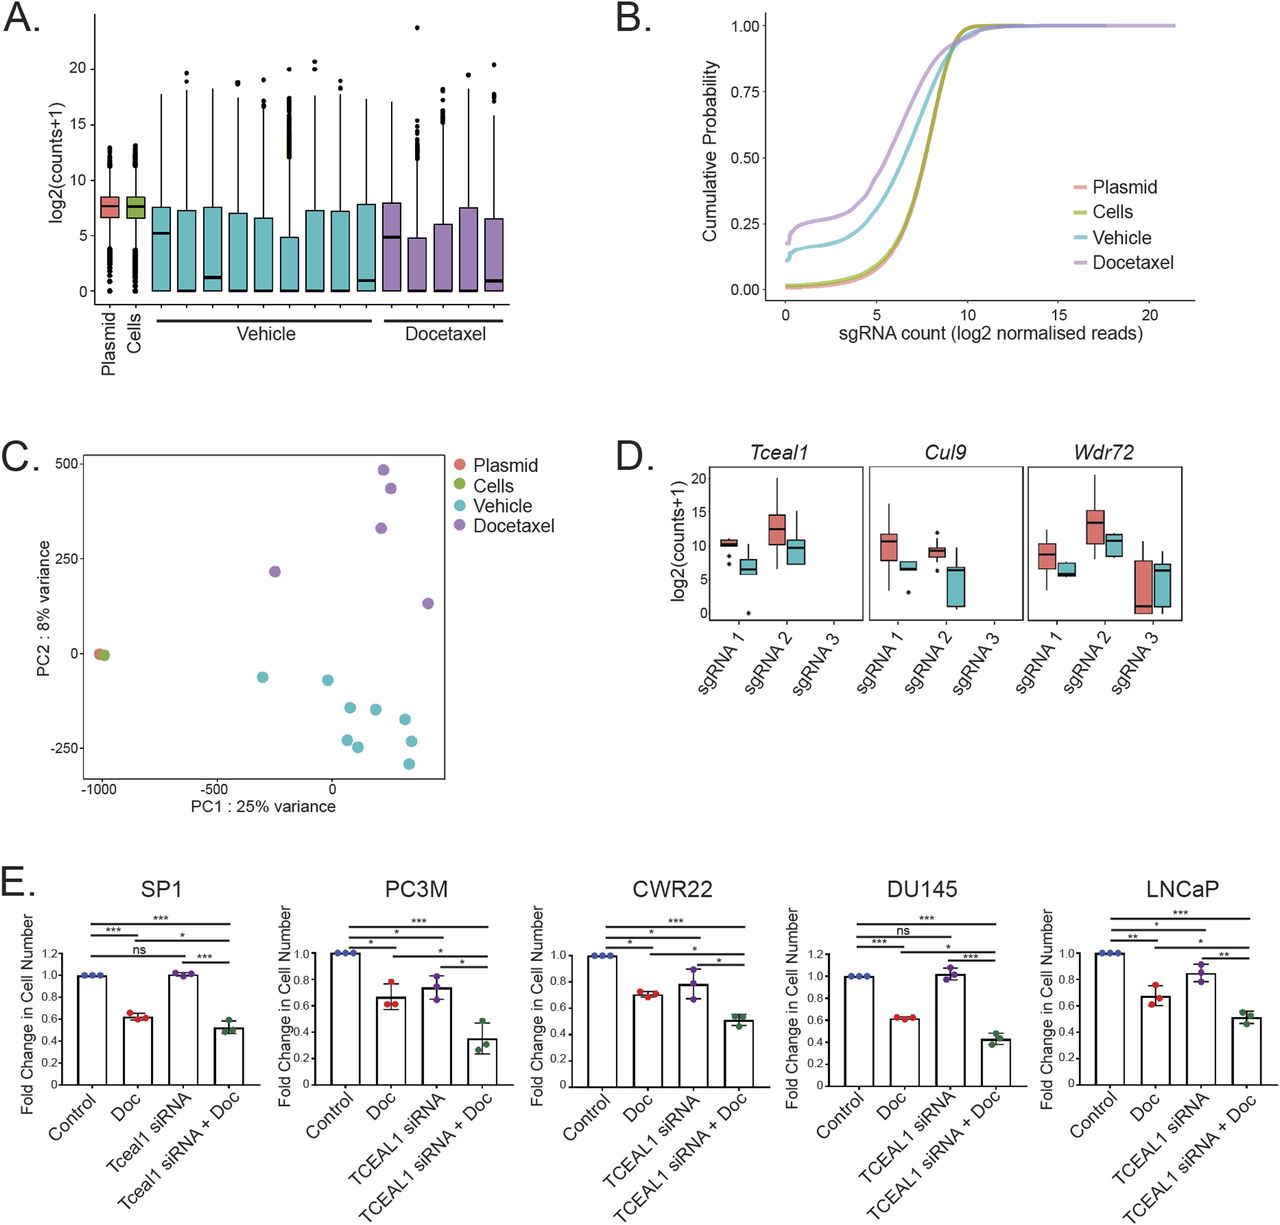
(A) Boxplot of the sgRNA-normalised read counts for the plasmid, pre-injection cells, and vehicle and docetaxel-treated tumour samples. Summary statistics shown are median, hinges for the 25th and 75th percentiles, whiskers extending from the hinges to the smallest/largest value no further than 1.5 × IQR from the hinge and “outlying” points. (B) Cumulative probability distribution of sgRNAs in the plasmid, pre-injection cells, and vehicle and docetaxel-treated tumour samples. Shift in the curves for vehicle and docetaxel-treated tumour samples represents the depletion in a subset of sgRNAs after injection and after injection and docetaxel treatment, respectively. Distributions for each condition are averaged across replicates. (C) Principle component analysis plot of plasmid (n = 1), cells (n = 1), and vehicle (n = 9) and docetaxel (n = 5)-treated tumour samples. Each dot represents one primary prostate tumour from the respective experimental groups. (D) Boxplot of sgRNA normalised read counts for each sgRNA detected for three selected significant (padj < 0.25) negatively selected genes in the mock and docetaxel treated samples. Summary statistics shown are median, hinges for the 25th and 75th percentiles, whiskers extending from the hinges to the smallest/largest value no further than 1.5 × IQR from the hinge and “outlying” points. (E) The indicated cell lines were transfected with non-targeting or targeting siRNA for 24 h before treatment with DMSO or docetaxel for a further 72 h. The number of cells was counted and the fold change compared with control is shown (n = 3 independent biological experiments, with three independent wells; *P < 0.05, **P < 0.001, ***P < 0.0001; one-way ANOVA with Tukey’s test; mean values ± SD are shown).
- Figure S2.
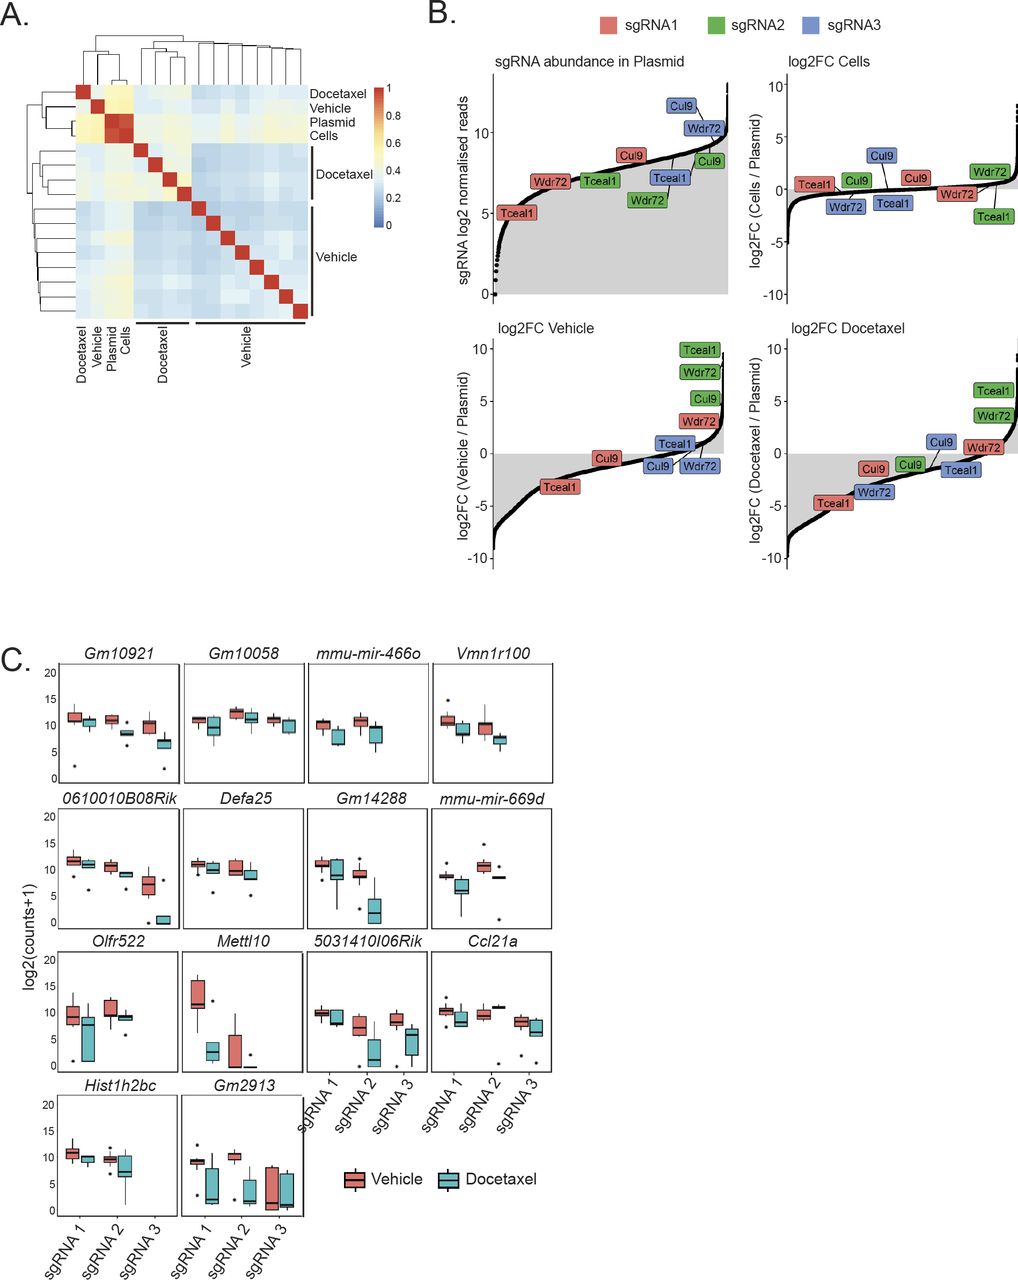
Negatively selected genes are identified by bioinformatics analysis. (A) Sample-to-sample Pearson correlation of normalised sgRNA reads counts for plasmid (n = 1), transduced SP1-Cas9 cells (n = 1), and vehicle (n = 9) and docetaxel (n = 5)-treated prostate tumour samples. (B) Representation of whole genome sgRNA library in different conditions. Top left plot represents ranked sgRNA abundance in plasmid. Remaining plots represent ranked log2FC relative to the plasmid for different conditions. Log2FC were calculated using values averaged across each condition. (C) Boxplot of sgRNA normalised read counts for each sgRNA detected for 14 of the significant (padj < 0.25) negatively selected genes in the vehicle and docetaxel treated prostate tumour samples. Summary statistics shown are median, hinges for the 25th and 75th percentiles, whiskers extending from the hinges to the smallest/largest value no further than 1.5 × IQR from the hinge and “outlying” points.
- Figure S3.
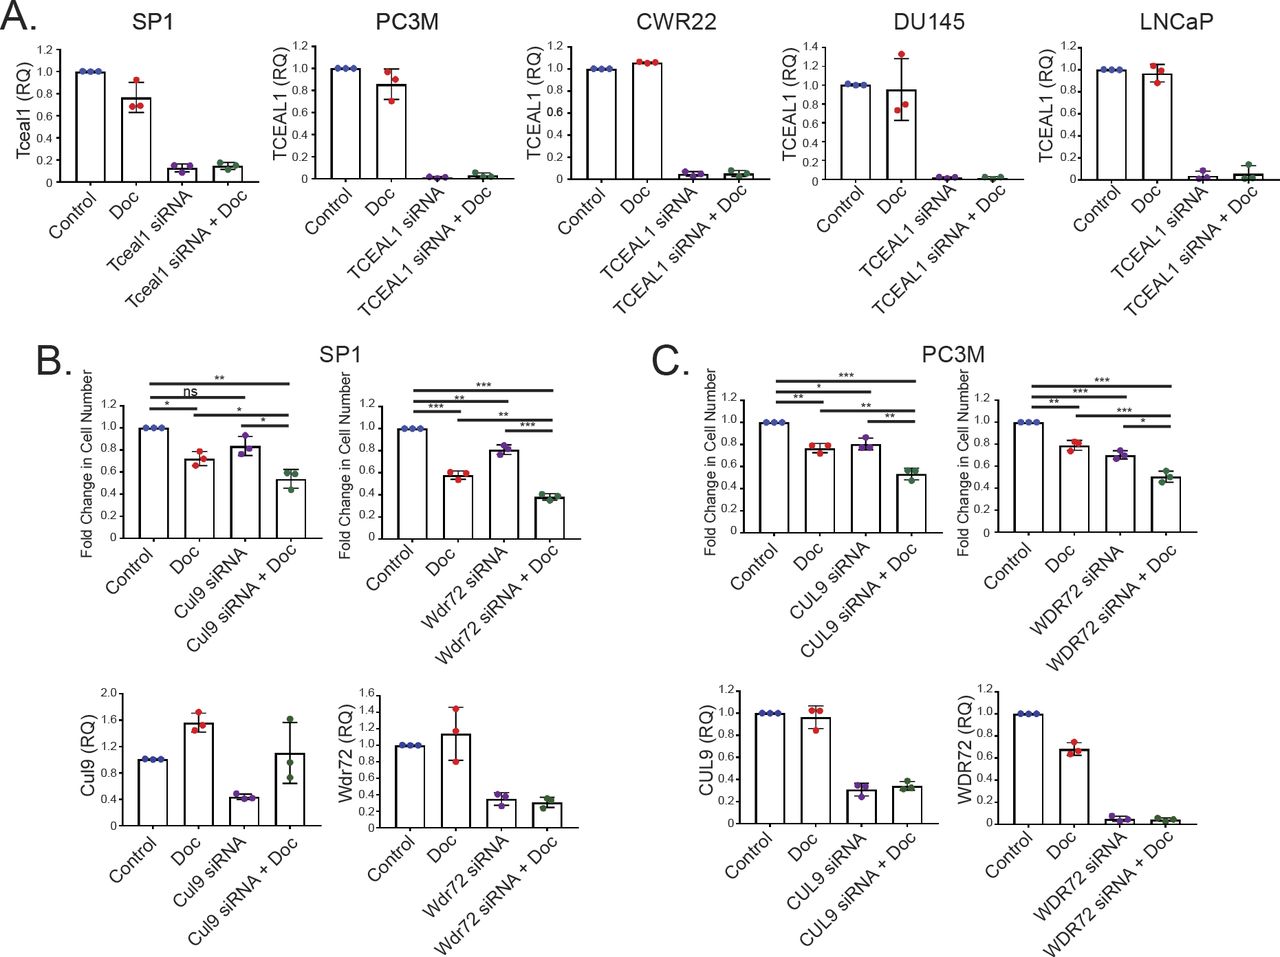
Validation of negatively selected genes in prostate cancer cells. (A) qRT-PCR analysis of gene expression. The indicated cell lines were transfected with non-targeting or targeting pooled siRNA for 24 h before treatment with DMSO or docetaxel for a further 72 h. Casc3 was used as a reference gene for normalisation, and the fold change compared with control is shown (n = 3 independent biological experiments, with three independent wells). (B) SP1 cells were transfected with non-targeting or targeting pooled siRNA as indicated for 24 h before treatment with DMSO or docetaxel for a further 72 h. The number of cells was counted and the fold change compared with control is shown (upper panels). qRT-PCR analysis of gene expression (lower panels). Casc3 was used as a reference gene for normalisation, and the fold change compared with control is shown (RQ, relative quantitation; n = 3 independent biological experiments, with three independent wells; **P < 0.05, **P < 0.001, ***P < 0.0001; one-way ANOVA with Tukey’s test; mean values ± SD are shown). (C) PC3M cells were transfected with non-targeting or targeting siRNA as indicated for 24 h before treatment with DMSO or docetaxel for a further 72 h. The number of cells was counted and the fold change compared with control is shown (top panels). qRT-PCR analysis of gene expression (lower panels). Casc3 was used as a reference gene for normalisation, and the fold change compared with control is shown (RQ, relative quantitation; n = 3 independent biological experiments, with three independent wells; **P < 0.05, **P < 0.001, ***P < 0.0001; one-way ANOVA with Tukey’s test; mean values ± SD are shown).
- Figure S4.
Analysis of the effects of TCEAL1 loss. (A) Western blot images of TCEAL1 expression in a panel of human prostate cell lines. HSC70 is used as a loading control (n = 3, a representative blot is shown). (B) PC3M cells were transfected with non-targeting (NT2, NT pool) or TCEAL1-targeting (individual [TCEAL1 2 and TCEAL1 3] or pooled [TCEAL1 pool]) siRNA as indicated for 24 h before treatment with DMSO for a further 72 h. The number of cells was counted and the fold change compared with NT2 control is shown (n = 3 independent biological experiments, with three independent wells; *P < 0.05, **P < 0.001, ns, not significant; one-way ANOVA with Dunnett’s test; mean values ± SD are shown). Data presented in this panel was performed at the same time as that from Fig 3A. (C) RWPE cells were treated with non-targeting or TCEAL1 pooled siRNA as indicated for 24 h before treatment with DMSO or docetaxel for a further 72 h. Casc3 was used as a reference gene for normalisation, and the fold change compared with control is shown (RQ, relative quantitation; n = 3 independent biological experiments, with three independent wells). (D) Quantification of percentage of PC3M cells, treated as indicated, in each stage of the cell cycle (n = 3 independent biological experiments; *P < 0.05, **P < 0.001, ***P < 0.0001; one-way ANOVA with Tukey’s test, mean values ± SD are shown). (E) PC3M cells were transfected with non-targeting or TCEAL1-targeting pooled siRNA for 24 h before treatment with DMSO or docetaxel for a further 48 h. RNA was extracted and sequenced. Principal Component Analysis plot of RNA sequencing data is shown (n = 4 independent biological experiments). (C, F) PC3M cells were treated as in (C). Heat map compares the fold change for each treatment condition with the control (non-targeting siRNA and DMSO) for each of the detected TCEAL gene family members (n = 4 independent biological experiments).
- Figure 3. Analysis of TCEAL1 knockdown–mediated effects.
(A) PC3M cells were transfected with non-targeting (NT2, NT pool) or TCEAL1-targeting (individual [TCEAL1 2 and TCEAL1 3] or pooled [TCEAL1 pool]) siRNA as indicated for 24 h before treatment with docetaxel for a further 72 h. The number of cells was counted and the fold change compared with NT2 control is shown (n = 3 independent biological experiments, with three independent wells; *P < 0.05, **P < 0.001; one-way ANOVA with Dunnett’s test; mean values ± SD are shown). (A, B) PC3M cells were treated as panel (A). Western blot image of TCEAL1 expression after siRNA transfection. HSC70 is used as a loading control (n = 3, a representative blot is shown). (C) RWPE cells were transfected with non-targeting or TCEAL1-targeting pooled siRNA as indicated for 24 h before treatment with DMSO or docetaxel for a further 72 h. The number of cells was counted and the fold change compared with control is shown (n = 3 independent biological experiments, with three independent wells; ***P < 0.0001, **P < 0.001, ns, not significant; one-way ANOVA with Tukey’s test; mean values ± SD are shown). (D) Cell cycle profiles of PC3M cells treated as indicated. Cells were transfected with either control (non-targeting) or TCEAL1-targeting pooled siRNA for 24 h before being synchronised by a double thymidine block. Cells were released into fresh media containing DMSO or docetaxel for 48 h. All cells were collected and fixed in ethanol. After fixation, cells were stained with propidium iodide and analysed using flow cytometry (n = 3 independent biological experiments, representative plots are shown). (E) Quantification of percentage of PC3M cells in all stages of the cell cycle as indicated (n = 3 independent biological experiments; *P < 0.01, **P < 0.001, ***P < 0.0001; one-way ANOVA with Tukey’s test; mean values ± SD are shown). (F) Plot showing the top 20 enriched Gene Ontology biological processes for genes up-regulated upon TCEAL1 suppression. The colour of the bar details the enrichment score, and the x-axis is the P-value. Processes involved in the cell cycle are highlighted in red. (G) Plot showing the top 20 enriched Gene Ontology biological processes for genes down-regulated on TCEAL1 suppression. The colour of the bar details the enrichment score, and the x-axis is the P-value.
Source data are available for this figure.
Source Data for Figure 3[LSA-2020-00770_SdataF3.pdf]
- Figure 4. Transcriptome informed pathway analysis upon suppressed TCEAL1 expression combined with docetaxel treatment.
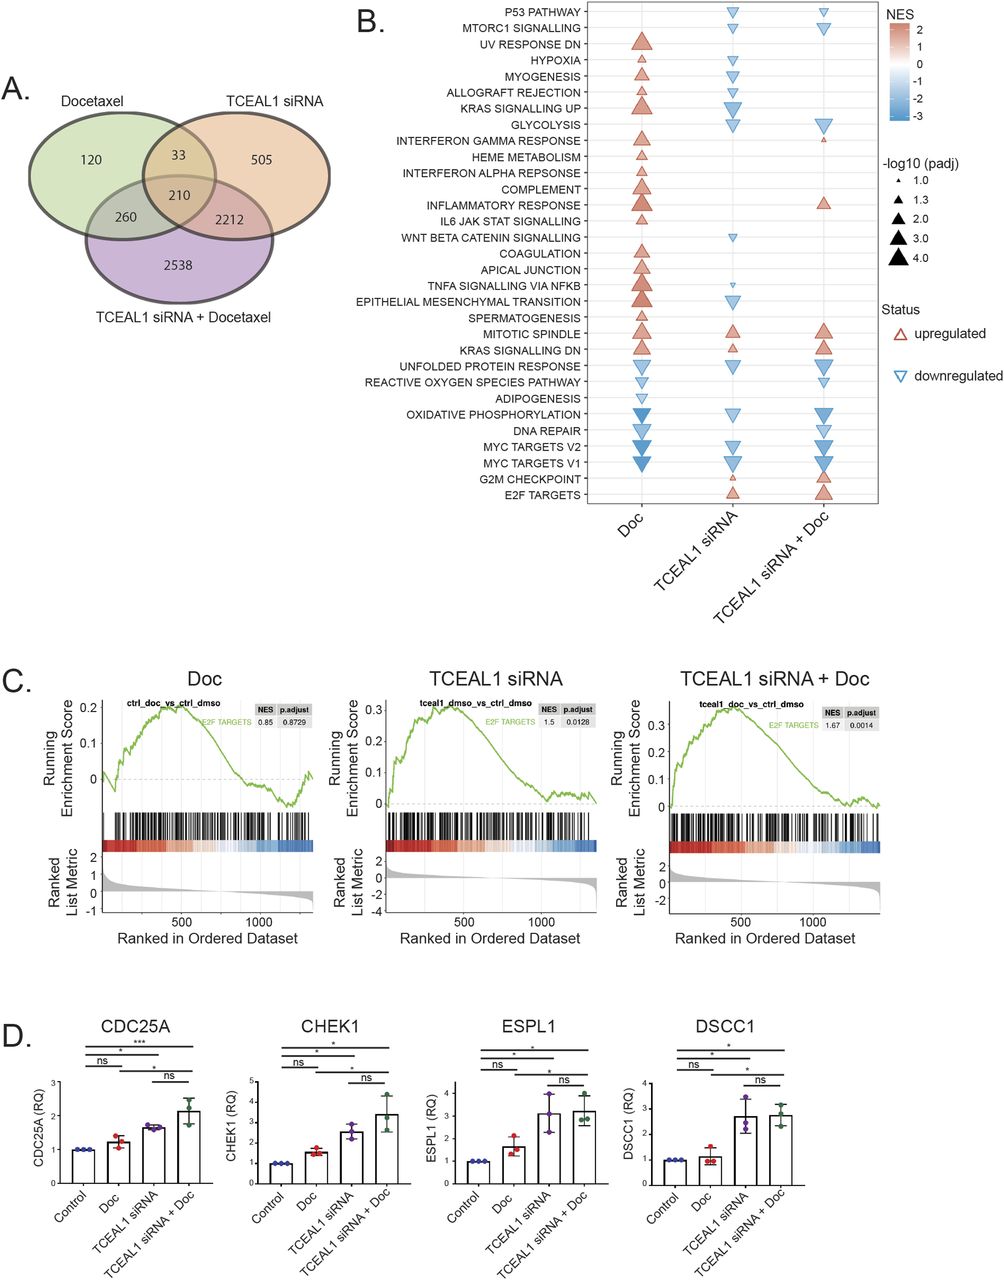
(A) PC3M cells were transfected with non-targeting or TCEAL1-targeting pooled siRNA for 24 h before treatment with DMSO or docetaxel for a further 48 h. RNA was extracted and sequenced. Venn diagram shows the number of genes that had altered expression in the three treatment conditions compared with control samples (n = 4 independent biological experiments). (B) Plot showing the enriched gene sets after Gene Set Enrichment Analysis from RNA sequencing using the Hallmark gene sets. X-axis shows the sample condition, with the enriched gene sets on the left of the plot. The legend details triangle size relative to −log10 of the adjusted P-value (1.3 = −log100.05). Colour shows the Normalised Enrichment Score (NES) compared with the control (non-targeting siRNA and DMSO) (Doc = docetaxel treatment). (C) Enrichment plots of Hallmark E2F target genes (gene set size = 200) for each of the indicated treatment conditions (n = 4 independent biological experiments; NES, Normalised Enrichment Score, P.adjust = a Benjamini–Hochberg adjusted P-value). (D) qRT-PCR validation of selected E2F target genes. PC3M cells were transfected with non-targeting or TCEAL1-targeting pooled siRNA as indicated for 24 h before treatment with DMSO or docetaxel for a further 72 h. Casc3 was used as a reference gene for normalisation, and the fold change compared with control is shown (RQ, relative quantitation; n = 3 independent biological experiments; *P < 0.05, ***P < 0.0001; one-way ANOVA with Tukey’s test; mean values ± SD are shown).
- Figure S5.
Transcriptome analysis of TCEAL1 loss identified E2F target genes. (A) Heat map compares log10 fold change for each treatment condition with the control (non-targeting siRNA and DMSO) (n = 4 independent biological experiments). (B) qRT-PCR validation of selected E2F target genes. PC3M cells were transfected with non-targeting or targeting siRNA as indicated for 24 h before treatment with DMSO or docetaxel for a further 48 h. Casc3 was used as a reference gene for normalisation, and the fold change compared with control is shown (RQ, relative quantitation; n = 3 independent biological experiments, with three independent wells; *P < 0.05, ***P < 0.0001, ns, not significant; one-way ANOVA with Tukey’s test; mean values ± SD are shown).


Tables
Gene symbol Detected sgRNAs Good sgRNAs log2 fold change Adjusted P-value Tceal1 2 2 −3.4 0.0267 Gm10921 3 2 −2.6 0.0324 Gm10058 3 3 −1.2 0.0324 mmu-mir-466o 2 2 −2.4 0.0324 Vmn1r100 2 2 −2.5 0.0324 Cul9 2 2 −4.3 0.0364 0610010B08Rik 3 3 −1.9 0.0526 Defa25 2 2 −1.5 0.0525 Gm14288 2 2 −4.4 0.0525 mmu-mir-669d 2 2 −3.5 0.0583 Olfr522 2 2 −2.4 0.0642 Mettl10 2 2 −4.9 0.0675 5031410I06Rik 3 3 −3.6 0.1235 Ccl21a 3 3 −1.3 0.1848 Wdr72 3 2 −2.2 0.1848 Hist1h2bc 2 2 −1.8 0.1848 Gm2913 3 2 −4.4 0.2331 Genes in bold have identifiable human orthologues. The number of detected sgRNAs (library A contained three sgRNAs for each gene and four sgRNAs per miRNA) is shown. “Good” sgRNAs is the number of detected sgRNAs that were negatively selected.
Table S1 Overview of sequencing data.
Table S5 Statistics.


In this Issue
Subjects
Related Articles
Cited By...
- No citing articles found.