Advertisement

Main menu

  • Home
  • Articles
    • Newest Articles
    • Current Issue
    • Methods & Resources
    • Author Interviews
    • Archive
    • Subjects
  • Collections
  • Submit
    • Submit a Manuscript
    • Author Guidelines
    • License, Copyright, Fee
    • FAQ
    • Why submit
  • About
    • About Us
    • Editors & Staff
    • Board Members
    • Licensing and Reuse
    • Reviewer Guidelines
    • Privacy Policy
    • Advertise
    • Contact Us
    • LSA LLC
  • Alerts
  • Other Publications
    • EMBO Press
    • The EMBO Journal
    • EMBO reports
    • EMBO Molecular Medicine
    • Molecular Systems Biology
    • Rockefeller University Press
    • Journal of Cell Biology
    • Journal of Experimental Medicine
    • Journal of General Physiology
    • Journal of Human Immunity
    • Cold Spring Harbor Laboratory Press
    • Genes & Development
    • Genome Research

User menu

  • My alerts

Search

  • Advanced search
Life Science Alliance
  • Other Publications
    • EMBO Press
    • The EMBO Journal
    • EMBO reports
    • EMBO Molecular Medicine
    • Molecular Systems Biology
    • Rockefeller University Press
    • Journal of Cell Biology
    • Journal of Experimental Medicine
    • Journal of General Physiology
    • Journal of Human Immunity
    • Cold Spring Harbor Laboratory Press
    • Genes & Development
    • Genome Research
  • My alerts
Life Science Alliance

Advanced Search

  • Home
  • Articles
    • Newest Articles
    • Current Issue
    • Methods & Resources
    • Author Interviews
    • Archive
    • Subjects
  • Collections
  • Submit
    • Submit a Manuscript
    • Author Guidelines
    • License, Copyright, Fee
    • FAQ
    • Why submit
  • About
    • About Us
    • Editors & Staff
    • Board Members
    • Licensing and Reuse
    • Reviewer Guidelines
    • Privacy Policy
    • Advertise
    • Contact Us
    • LSA LLC
  • Alerts
  • Follow LSA on Bluesky
  • Follow lsa Template on Twitter
Research Article
Transparent Process
Open Access

Stoichiometry of Rtt109 complexes with Vps75 and histones H3-H4

View ORCID ProfileNoushin Akhavantabib, Daniel D Krzizike, View ORCID ProfileVictoria Neumann, View ORCID ProfileSheena D’Arcy  Correspondence email
Noushin Akhavantabib
1Department of Chemistry and Biochemistry, The University of Texas at Dallas, Richardson, TX, USA
  • Find this author on Google Scholar
  • Find this author on PubMed
  • Search for this author on this site
  • ORCID record for Noushin Akhavantabib
Daniel D Krzizike
2Department of Biochemistry and Molecular Biology, Colorado State University, Fort Collins, CO, USA
  • Find this author on Google Scholar
  • Find this author on PubMed
  • Search for this author on this site
Victoria Neumann
1Department of Chemistry and Biochemistry, The University of Texas at Dallas, Richardson, TX, USA
  • Find this author on Google Scholar
  • Find this author on PubMed
  • Search for this author on this site
  • ORCID record for Victoria Neumann
Sheena D’Arcy
1Department of Chemistry and Biochemistry, The University of Texas at Dallas, Richardson, TX, USA
  • Find this author on Google Scholar
  • Find this author on PubMed
  • Search for this author on this site
  • ORCID record for Sheena D’Arcy
  • For correspondence: sheena.darcy@utdallas.edu
Published 10 September 2020. DOI: 10.26508/lsa.202000771
  • Article
  • Figures & Data
  • Info
  • Metrics
  • Reviewer Comments
  • PDF
Loading

Article Figures & Data

Figures

  • Supplementary Materials
  • Figure 1.
    • Download figure
    • Open in new tab
    • Download powerpoint
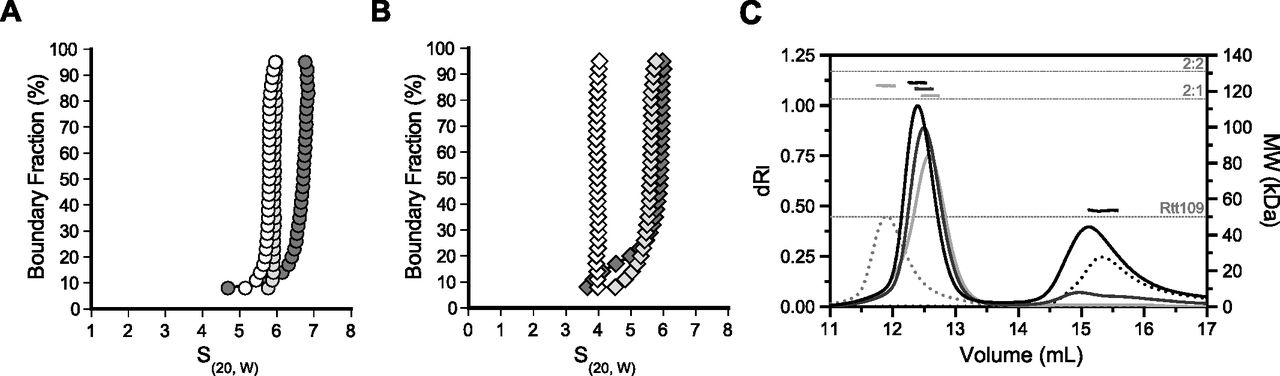
    Figure 1. Stoichiometry of Vps75–Rtt109 complexes.

    (A, B) van Holde–Weischet analysis of sedimentation velocity experiments of 7.5 μM Vps75 with 0, 0.5, and 1.0 equivalent (white, light grey, and dark grey, respectively) of Rtt109 at 150 mM NaCl (A, circles) or 300 mM NaCl (B, diamonds). Similar experiments for Rtt109 and H3-H4 are shown in Fig S1. (C) SEC-MALS of 10 μM Vps75 (dotted grey), 10 μM Rtt109 (dotted black), and 10 μM Vps75 with 5, 10, or 20 μM Rtt109 (light grey, dark grey, and black, respectively). Horizontal dashed lines indicate theoretical molecular weights of labeled complexes.

  • Figure S1.
    • Download figure
    • Open in new tab
    • Download powerpoint
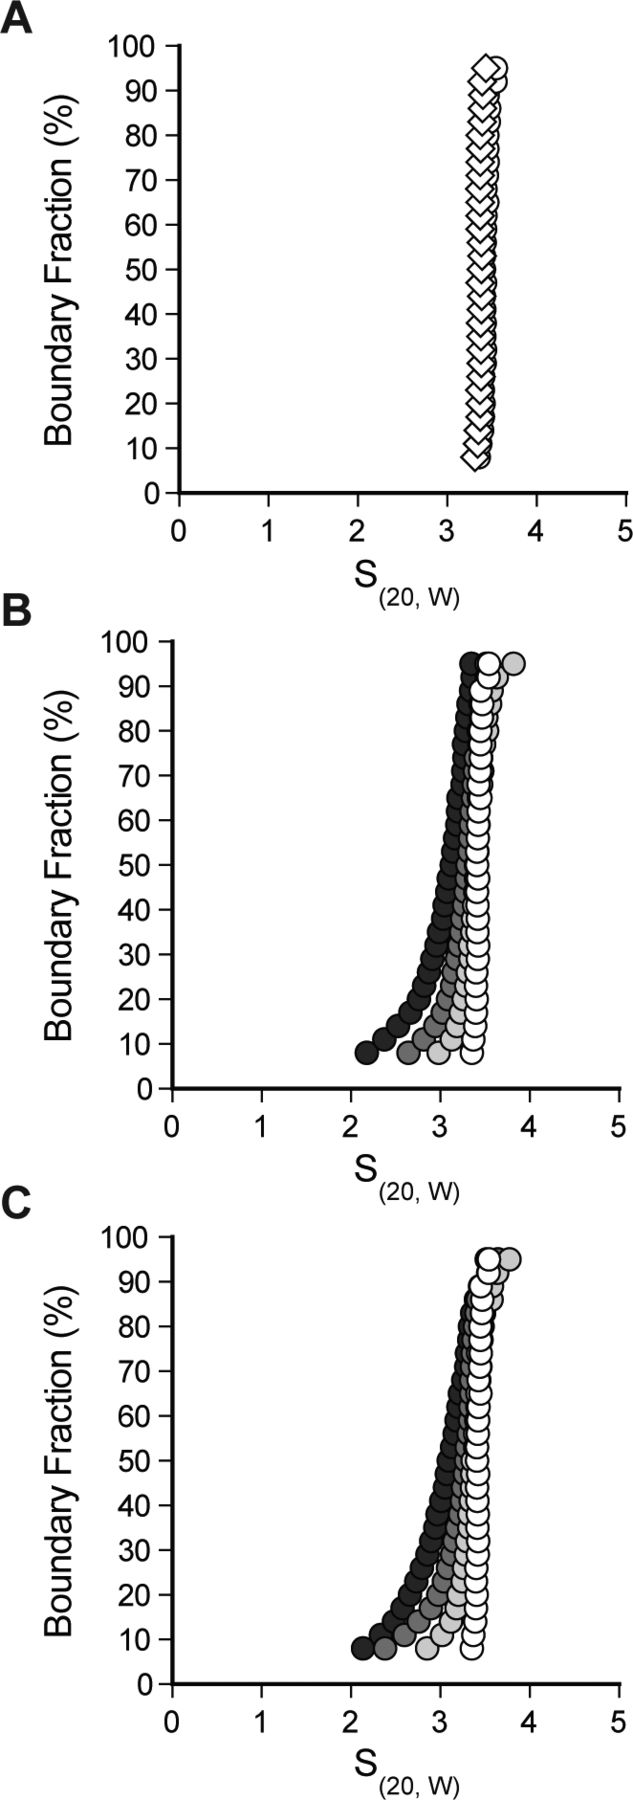
    Figure S1. Rtt109 does not stably interact with H3-H4 or H3DM-H4.

    (A, B, C) van Holde–Weischet analysis of sedimentation velocity experiments of Rtt109 alone (A) or with 0 to 2 equivalents of H3-H4 (B) or H3DM-H4 (C). Rtt109 alone is shown in white, and Rtt109 with 0.5, 1, or 2 equivalents of histones is shown in light grey, dark grey, and black, respectively.

  • Figure 2.
    • Download figure
    • Open in new tab
    • Download powerpoint
    Figure 2. Co-purification of Vps75–Rtt109.

    (A, B, C, D) Purification of co-expressed his–Rtt109 and Vps75 by Ni2+-affinity (A, B) and anion exchange (C, D) chromatography. FT is flow-through. (E) SEC-MALS of major peaks at 300 mM NaCl from anion exchange. P1, P2, and P3 are shown in black, dark grey, and light grey, respectively. Horizontal dashed lines indicate theoretical molecular weights of labeled complexes. Optimization of a MgATP wash is shown in Fig S2.

  • Figure S2.
    • Download figure
    • Open in new tab
    • Download powerpoint
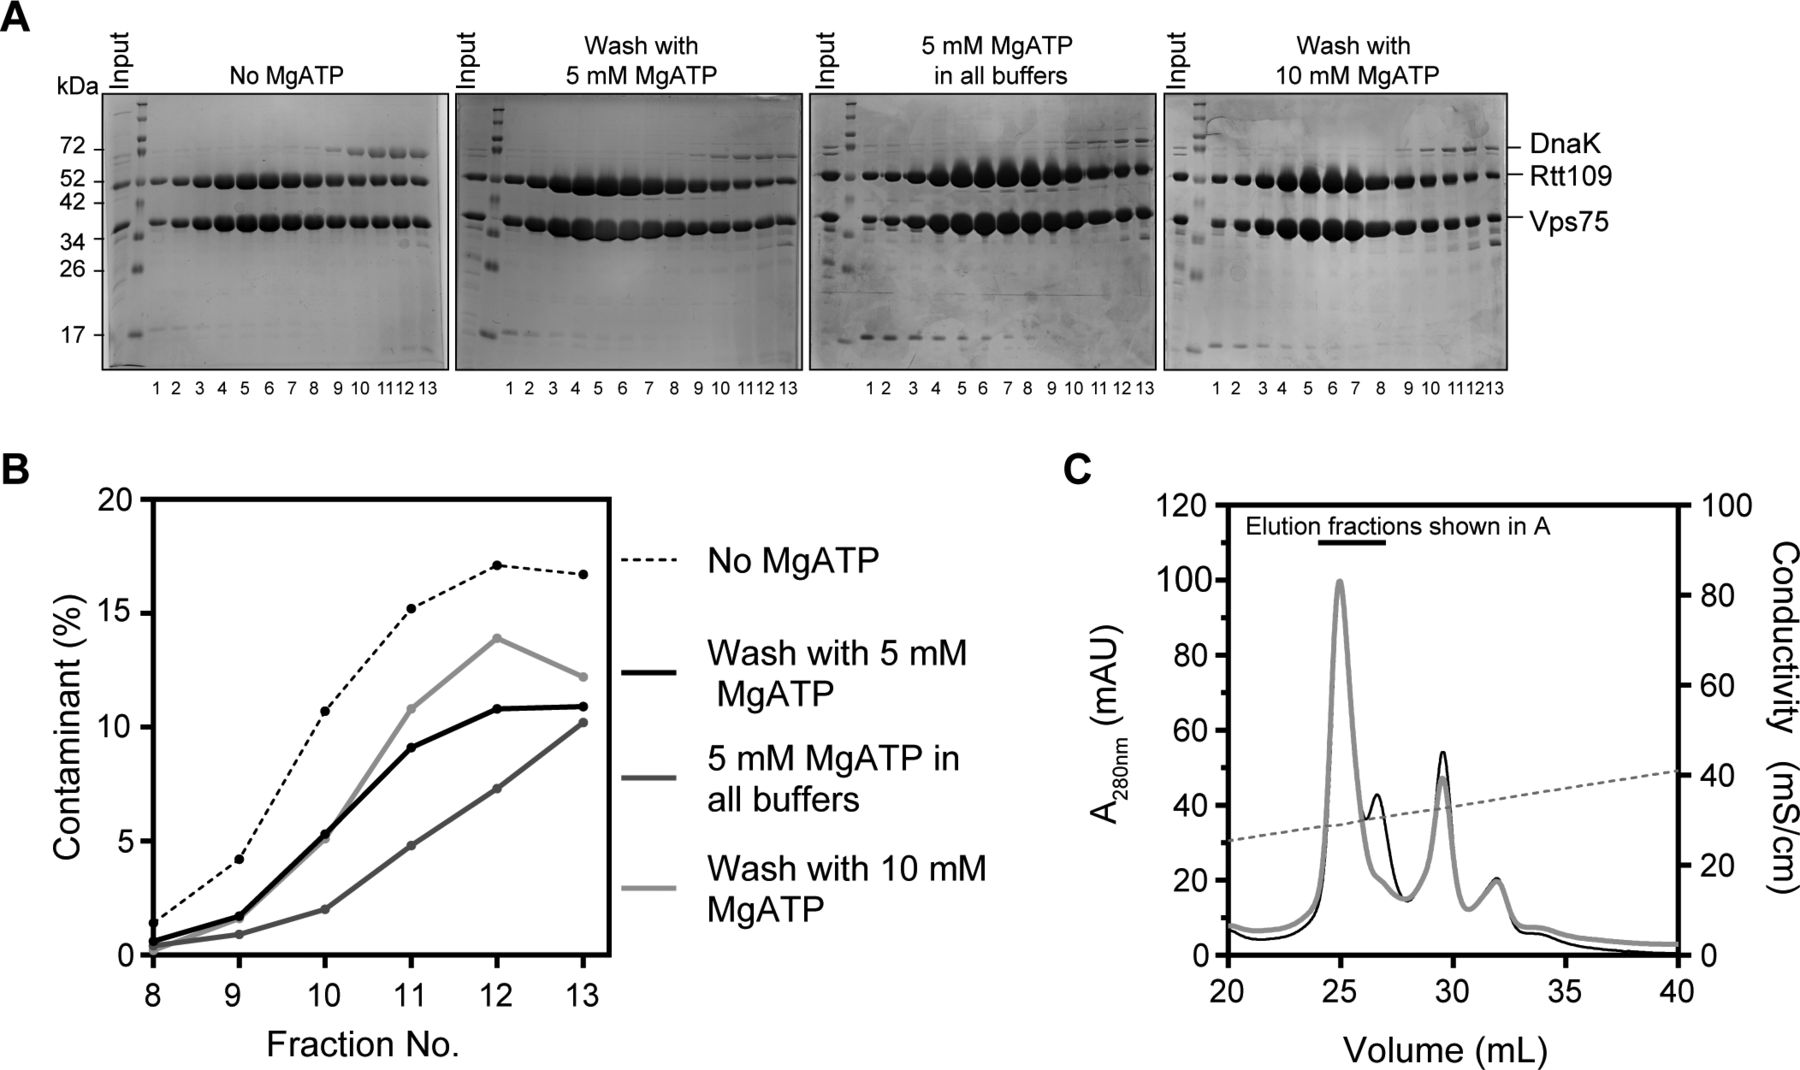
    Figure S2. Removing DnaK from co-expressed Vps75–Rtt109 using MgATP.

    (A) SDS–PAGE of anion exchange elution fractions under different conditions. From left to right, no MgATP, 5 mM MgATP wash during Ni2+-affinity chromatography, 5 mM MgATP in lysis and chromatography buffers, and 10 mM MgATP wash during Ni2+-affinity chromatography. The latter two conditions cause a dramatic increase in system pressure. (B) Quantification of the amount of DnaK contamination in each anion exchange fraction. (C) Anion exchange chromatogram of Vps75–Rtt109 without MgATP (black) and with a 5 mM MgATP wash (grey).

  • Figure 3.
    • Download figure
    • Open in new tab
    • Download powerpoint
    Figure 3. Sedimentation velocity of the Vps75–Rtt109-(H3-H4) complex.

    (A, B) van Holde–Weischet analysis of sedimentation velocity experiments of complexes with Vps75, Rtt109, and H3-H4 (A) or H3DM-H4 (B). Vps75 and Rtt109 were mixed 2:2 (top) or 2:1 (bottom). Vps75–Rtt109 is shown in white, and Vps75–Rtt109 and 0.5 or 1 equivalent of histones are shown in light grey and dark grey, respectively. For reference, sedimentation of H3-H4 or H3DM-H4 (faded circles), Rtt109 (faded triangles), and a 2:2 mix of Vps75–(H3-H4) or Vps75–(H3DM-H4) (faded squares) are also shown. Comparison of H3-H4 and H3DM-H4 sedimentation is shown in Fig S3. All experiments were carried out at 150 mM NaCl.

  • Figure S3.
    • Download figure
    • Open in new tab
    • Download powerpoint
    Figure S3. Sedimentation velocity of H3-H4 and H3DM-H4.

    van Holde–Weischet analysis of sedimentation velocity experiments of H3-H4 (white) or H3DM-H4 (black) at 150 mM (circles) or 300 mM (diamonds) NaCl.

  • Figure 4.
    • Download figure
    • Open in new tab
    • Download powerpoint
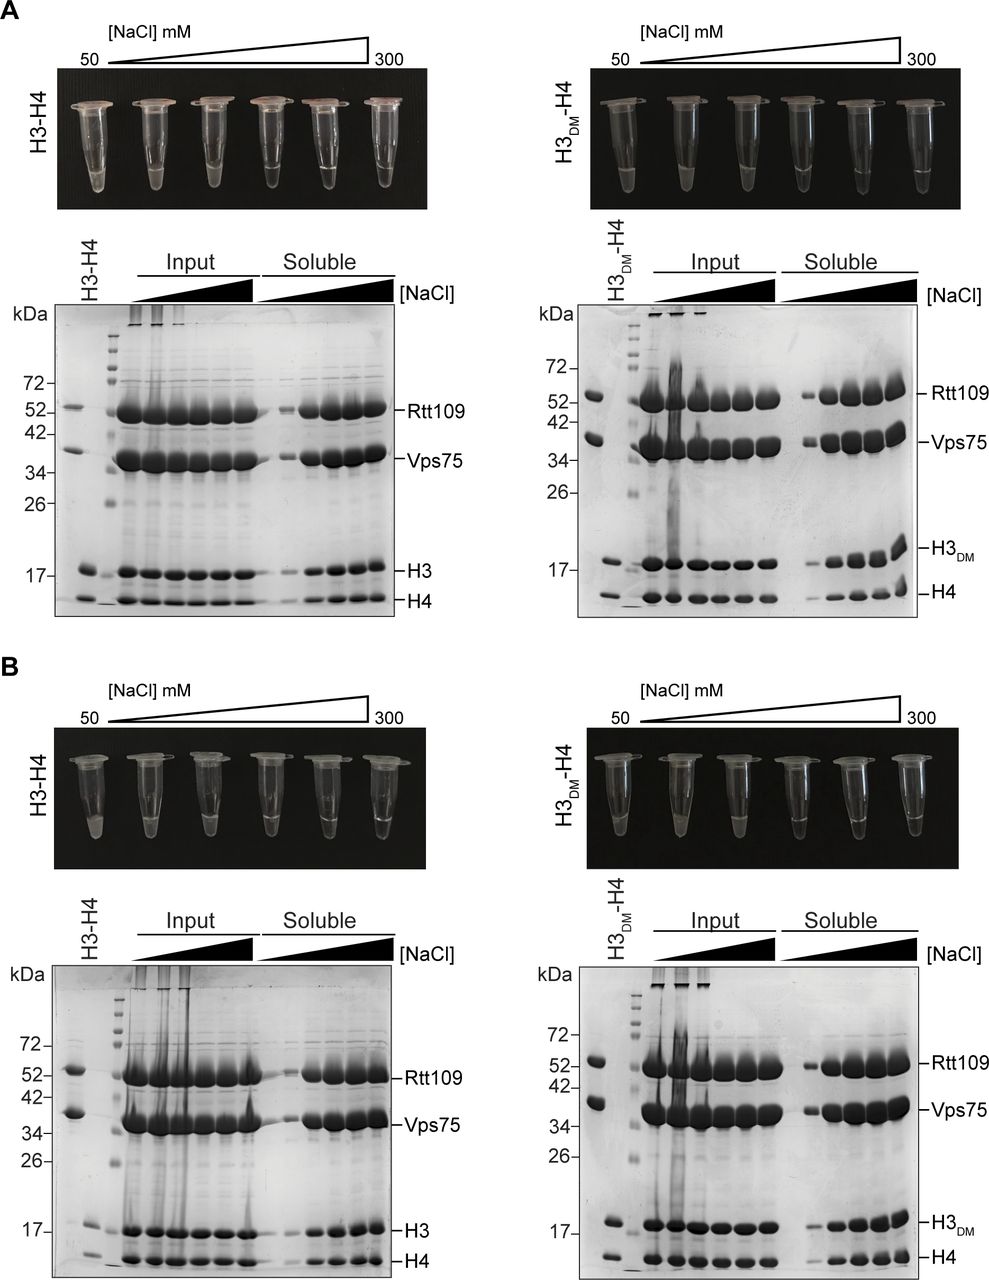
    Figure 4. Optimizing solubility of Vps75–Rtt109–(H3-H4) complexes.

    Solubility of complexes containing H3-H4 (left) or H3DM-H4 (right) at 6 mg/ml was assayed as a function of NaCl concentration. (A) Image showing visual turbidity. (B) SDS–PAGE of samples before (Input) and after (Soluble) centrifugation. (C) Percent solubility of complexes at 6, 8, and 10 mg/ml based on UV spectroscopy before and after centrifugation (black, grey, and light grey, respectively). Complete data for 8 and 10 mg/ml are shown in Fig S4.

  • Figure S4.
    • Download figure
    • Open in new tab
    • Download powerpoint
    Figure S4. Optimizing solubility of Vps75–Rtt109–(H3-H4) complexes at 8 and 10 mg/ml.

    (A, B) Solubility of complexes containing H3-H4 (left) or H3DM-H4 (right) at 8 mg/ml (A) and 10 mg/ml (B) was assayed as a function of NaCl concentration. The top panel shows visual turbidity. SDS–PAGE shows samples before (input) and after (soluble) centrifugation.

  • Figure 5.
    • Download figure
    • Open in new tab
    • Download powerpoint
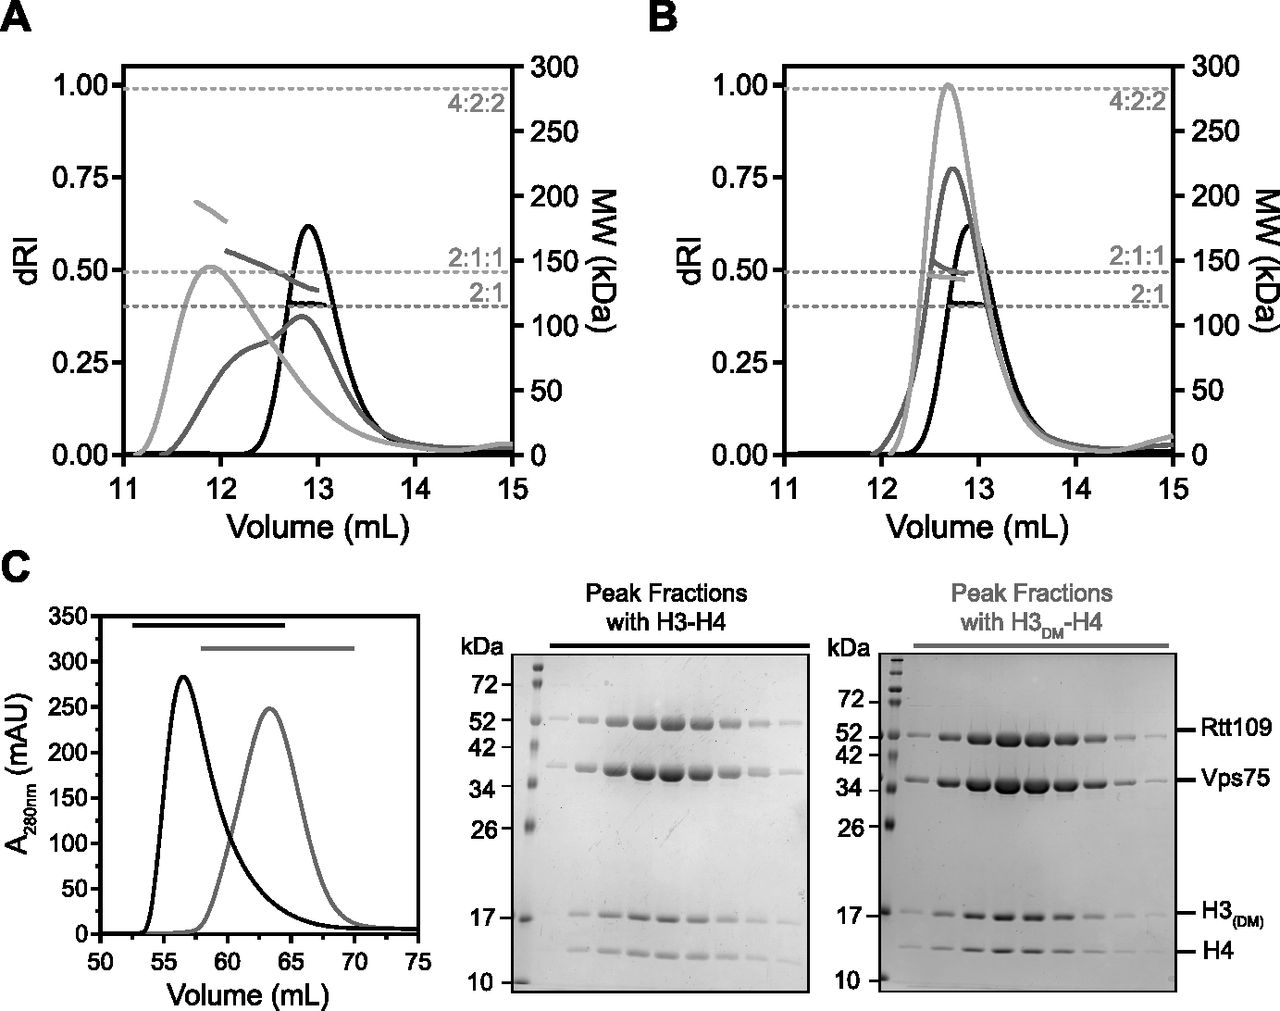
    Figure 5. Stoichiometry and large-scale preparation of Vps75–Rtt109–(H3-H4).

    (A, B) SEC-MALS of 20 μM 2:1 Vps75–Rtt109 (black) with 20 or 40 μM (dark grey and light grey, respectively) H3-H4 (A) or H3DM-H4 (B). Horizontal dashed lines indicate theoretical molecular weights of labeled complexes. Molecular weights are listed in Table S2. (C) Gel filtration of large-scale purifications of Vps75–Rtt109–(H3-H4) (black) and Vps75–Rtt109–(H3DM-H4) (grey). SDS–PAGE of peak fractions.

Supplementary Materials

  • Figures
  • Table S1 Summary of sedimentation velocity samples.

  • Table S2 Molecular weights of Vps75–Rtt109–(H3-H4) complexes measured using SEC-MALS at 300 mM NaCl.

PreviousNext
Back to top
Download PDF
Email Article

Thank you for your interest in spreading the word on Life Science Alliance.

NOTE: We only request your email address so that the person you are recommending the page to knows that you wanted them to see it, and that it is not junk mail. We do not capture any email address.

Enter multiple addresses on separate lines or separate them with commas.
Stoichiometry of Rtt109 complexes with Vps75 and histones H3-H4
(Your Name) has sent you a message from Life Science Alliance
(Your Name) thought you would like to see the Life Science Alliance web site.
CAPTCHA
This question is for testing whether or not you are a human visitor and to prevent automated spam submissions.
Citation Tools
Stoichiometry of Vps75–Rtt109 complexes
Noushin Akhavantabib, Daniel D Krzizike, Victoria Neumann, Sheena D’Arcy
Life Science Alliance Sep 2020, 3 (11) e202000771; DOI: 10.26508/lsa.202000771

Citation Manager Formats

  • BibTeX
  • Bookends
  • EasyBib
  • EndNote (tagged)
  • EndNote 8 (xml)
  • Medlars
  • Mendeley
  • Papers
  • RefWorks Tagged
  • Ref Manager
  • RIS
  • Zotero
Share
Stoichiometry of Vps75–Rtt109 complexes
Noushin Akhavantabib, Daniel D Krzizike, Victoria Neumann, Sheena D’Arcy
Life Science Alliance Sep 2020, 3 (11) e202000771; DOI: 10.26508/lsa.202000771
Twitter logo Facebook logo Mendeley logo
  • Tweet Widget
Issue Cover

In this Issue

Volume 3, No. 11
November 2020
  • Table of Contents
  • Cover (PDF)
  • About the Cover
  • Masthead (PDF)
Advertisement

Jump to section

  • Article
    • Abstract
    • Introduction
    • Results
    • Discussion
    • Materials and Methods
    • Acknowledgements
    • References
  • Figures & Data
  • Info
  • Metrics
  • Reviewer Comments
  • PDF

Subjects

  • Biophysics
  • Chromatin & Epigenetics
  • Structural Biology

Related Articles

  • No related articles found.

Cited By...

  • Digital nanoreactors for control over absolute stoichiometry and spatiotemporal behavior of receptors within lipid bilayers
  • Google Scholar

More in this TOC Section

  • Ocular blood flow reduction promote RGC loss
  • AURKA phosphorylation of HEC1 in oocytes
  • SLC38A9 in Tat-induced senescence
Show more Research Article

Similar Articles

EMBO Press LogoRockefeller University Press LogoCold Spring Harbor Logo

Content

  • Home
  • Newest Articles
  • Current Issue
  • Archive
  • Subject Collections

For Authors

  • Submit a Manuscript
  • Author Guidelines
  • License, copyright, Fee

Other Services

  • Alerts
  • Bluesky
  • X/Twitter
  • RSS Feeds

More Information

  • Editors & Staff
  • Reviewer Guidelines
  • Feedback
  • Licensing and Reuse
  • Privacy Policy

ISSN: 2575-1077
© 2025 Life Science Alliance LLC

Life Science Alliance is registered as a trademark in the U.S. Patent and Trade Mark Office and in the European Union Intellectual Property Office.