


Article Figures & Data
Figures
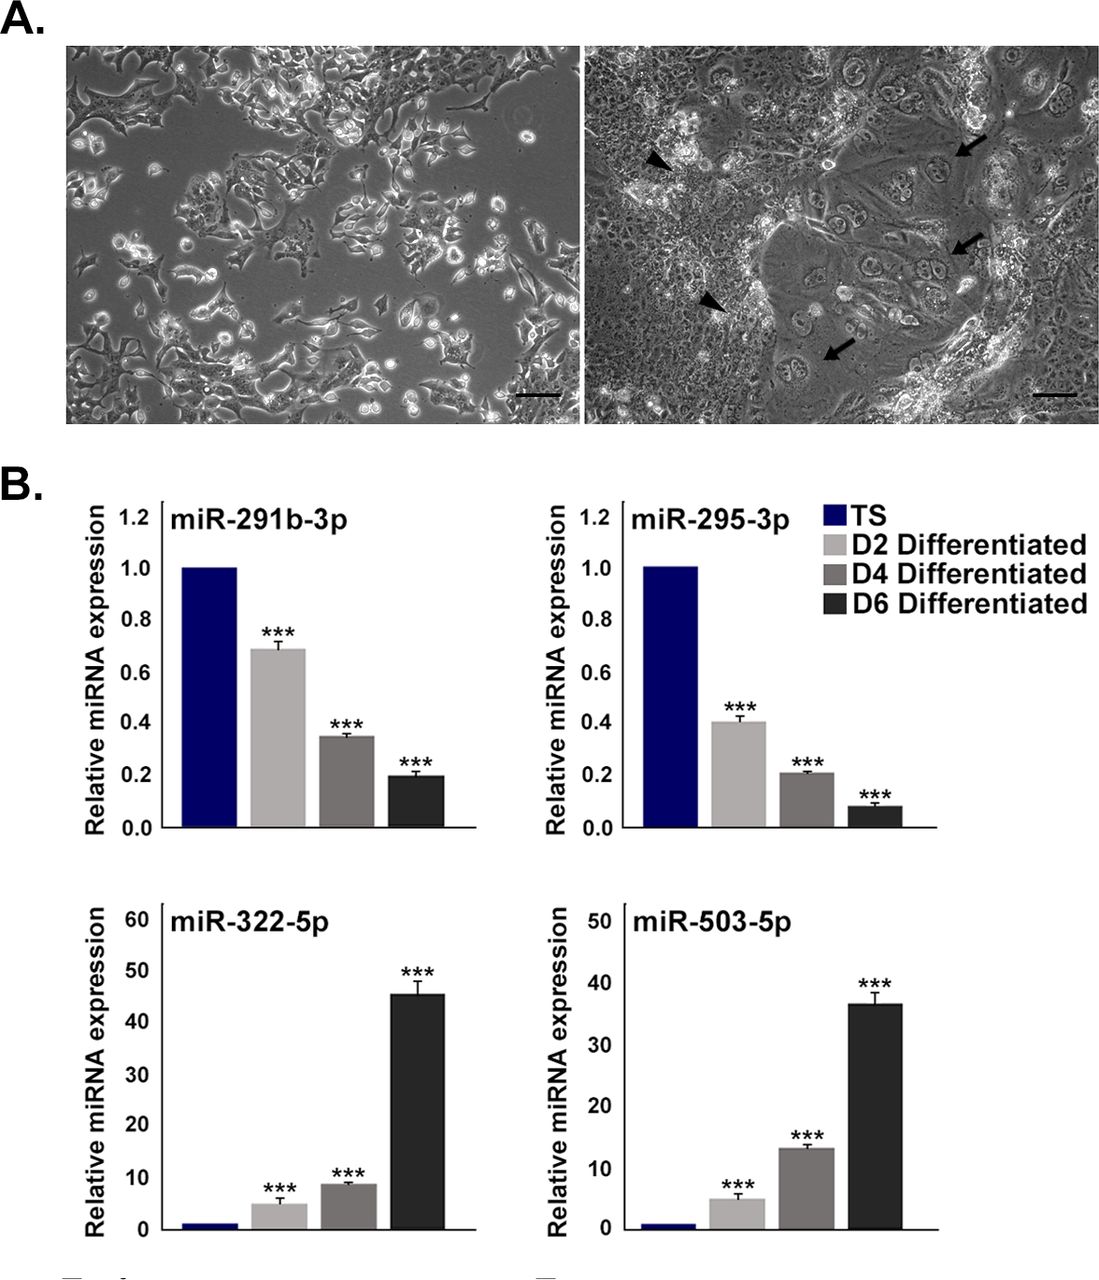
- Figure S1. Temporal expression of miR-290 cluster and miR-322 cluster members in trophoblast stem (TS) cells and differentiated trophoblast cells.
(A) Photomicrograph of TS cells (left panel) and differentiated trophoblast cells (right panel) on day 6 of differentiation. Spongiotrophoblast cells and trophoblast giant cells are shown by arrow heads and arrows, respectively. Images were taken at 100× magnification. Scale bar: 50 μm. (B) TaqMan assays for two representative members from each of miR-290 cluster (upper panel) and miR-322 cluster (lower panel) in TS cells and day 2, 4, and 6 differentiated cells. Expression of U6 snRNA was used for normalization. Data are presented in mean ± SEM of three independent experiments (n = 3). ***P < 0.0005.
- Figure 1. MiRNome PCR array profiling of miRNAs in trophoblast stem (TS) cells and differentiated trophoblast cells.
(A) Scatter plot representing differential expression of 169 miRNAs, of which 94 miRNAs were down-regulated (green) and 75 up-regulated (red) in differentiated trophoblast cells. (B) Clustergram for differential expression of miR-290 and miR-322 clusters in TS cells and differentiated cells. (C, D) TaqMan assays for the members of miR-290 and miR-322 clusters in TS cells and differentiated cells. Bars represent the mean ± standard error of the mean of three independent experiments (n = 3). **P < 0.005; ***P < 0.0005 when compared with TS cells.
Source data are available for this figure.
Source Data for Figure 1[LSA-2020-00674_SdataF1.pdf]
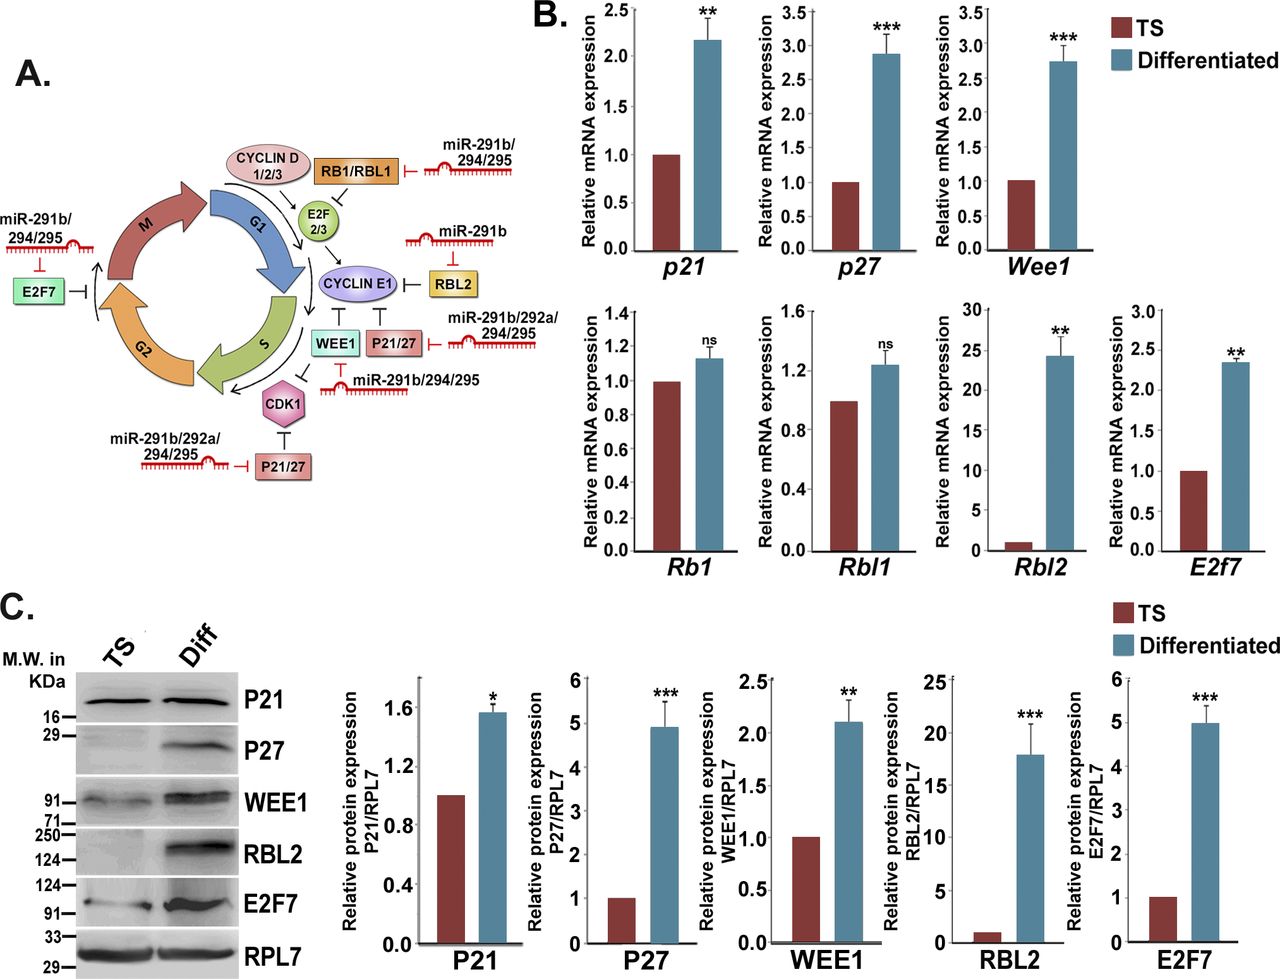
- Figure S2. Expression of predicted cell cycle targets of miR-290 cluster in trophoblast stem (TS) cells and differentiated trophoblast cells.
(A) Diagrammatic representation of cell cycle targets (repressors) of miR-290 cluster members. (B) Quantitative real-time PCR analyses of predicted targets of miR-290 cluster members in TS cells and differentiated trophoblast cells (n = 3). (C) Western blot analyses of relevant targets in TS cells and differentiated trophoblast cells (n = 3). Densitometric quantification of each protein sample relative to RPL7 is shown in the right. *P < 0.05; **P < 0.005; ***P < 0.0005; ns, nonsignificant.
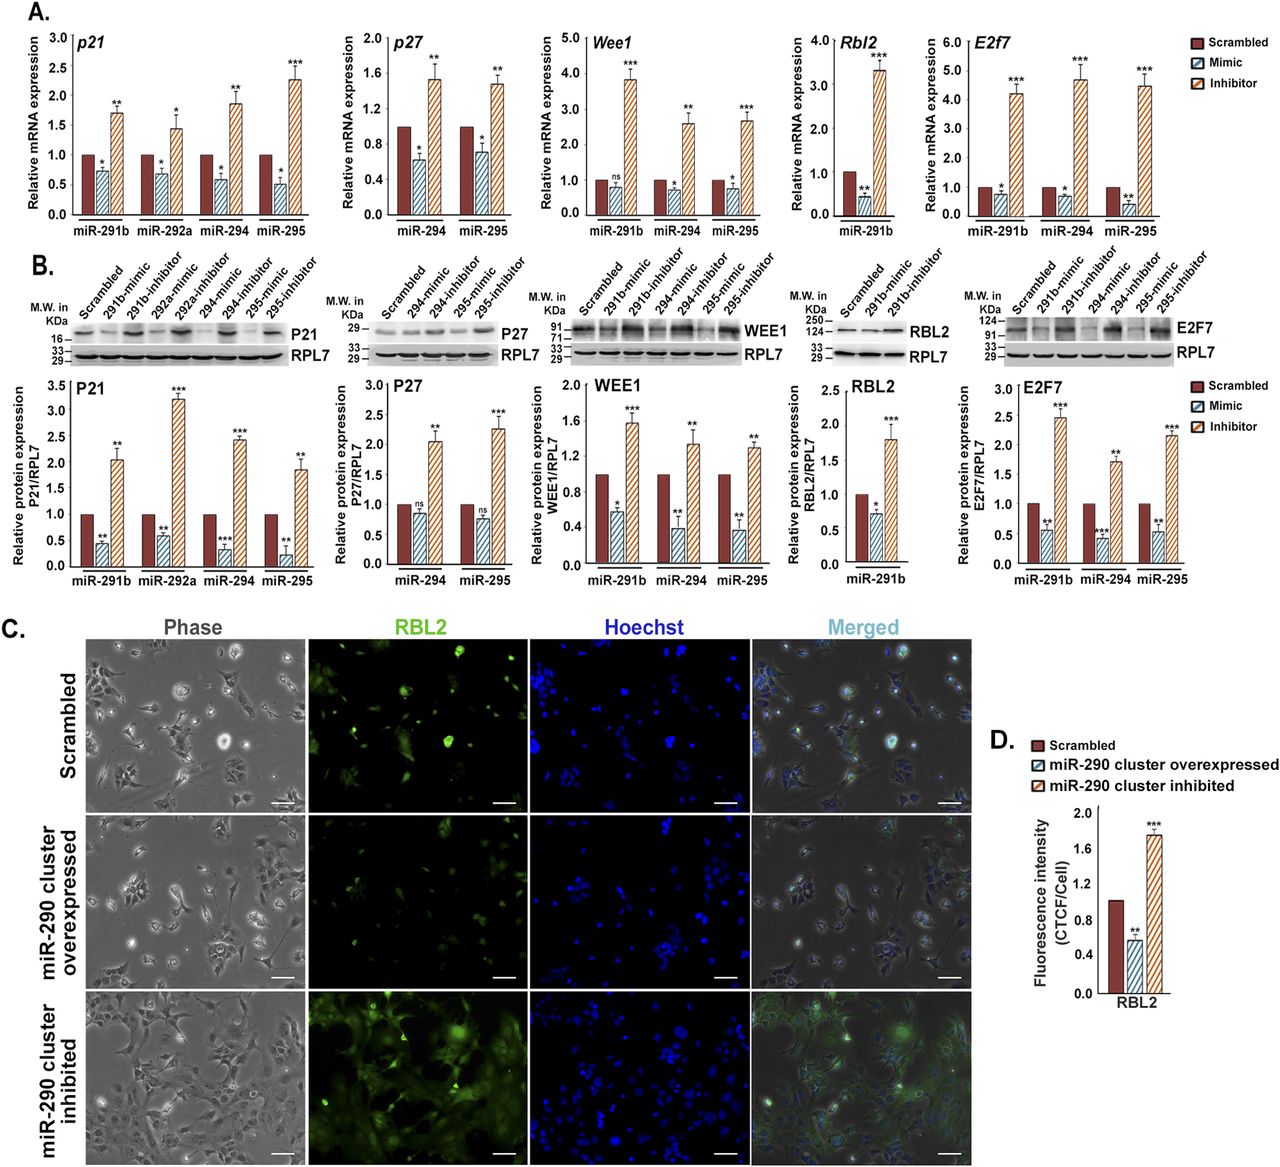
- Figure 2. Members of miR-290 cluster target cell cycle repressors to maintain stemness.
(A) Quantitative real-time PCR of cell cycle repressors in trophoblast stem (TS) cells transfected with either mimic or inhibitor alone for members of miR-290 cluster. (B) Immunoblot analysis of cell cycle repressors in TS cells transfected with either mimic or inhibitor alone for members of miR-290 cluster. RPL7 was used as loading control. Densitometric quantification of each protein sample relative to RPL7 is shown in the following. Data are presented in means and standard error of the mean of three replicates (n = 3). (C) Immunofluorescence of RBL2 (green) in TS cells transfected either with all the mimics or all the inhibitors of miR-290 cluster showing the same results. Cell nuclei were stained with Hoechst dye (blue). Scale bar: 50 μm. (D) Quantification of fluorescence intensity for RBL2 from C, panel 2. Values are shown in mean ± SEM from three different experiments (n = 3). *P < 0.05; **P < 0.005; ***P < 0.0005; ns, nonsignificant.
Source data are available for this figure.
Source Data for Figure 2[LSA-2020-00674_SdataF2.pdf]
- Figure S3. Expression of predicted cell cycle targets of miR-322 cluster in trophoblast stem (TS) cells and differentiated trophoblast cells.
(A) Diagrammatic representation of cell cycle targets (activators) of miR-322 cluster members. (B) Quantitative real-time PCR analyses of predicted targets of miR-322 cluster members in TS cells and differentiated trophoblast cells (n = 3). (C) Western blot validation for relevant targets of miR-322 cluster members in TS cells differentiated trophoblast cells (n = 3). Densitometric analyses of Western blots are shown in the right. **P < 0.005; ***P < 0.0005, ns, nonsignificant compared with TS cells.
- Figure 3. MiR-322 cluster induces mouse trophoblast stem (TS) cell differentiation by targeting cell cycle activators.
(A) Quantitative real-time PCR of cell cycle activators (Cyclin D1, Cyclin E1 and Cdc25b) in TS cells transfected with either mimic or inhibitor for miR-322-5p and miR-503-5p. (B) Western blot analysis of these activators from transfected TS cells. RPL7 was used as loading control. Densitometric quantification of every protein sample relative to RPL7 is shown in the following. Data are presented in means and standard error of the mean of three replicates (n = 3). (C) Immunofluorescence of CYCLIN D1 (green) in TS cells transfected with all the mimics or all the inhibitors of miR-322 cluster. Scale bar: 50 μm. (D) Quantification of fluorescence intensity for CYCLIN D1 from C, panel 2. *P < 0.05; **P < 0.005; ***P < 0.0005; ns, nonsignificant.
Source data are available for this figure.
Source Data for Figure 3[LSA-2020-00674_SdataF3.pdf]
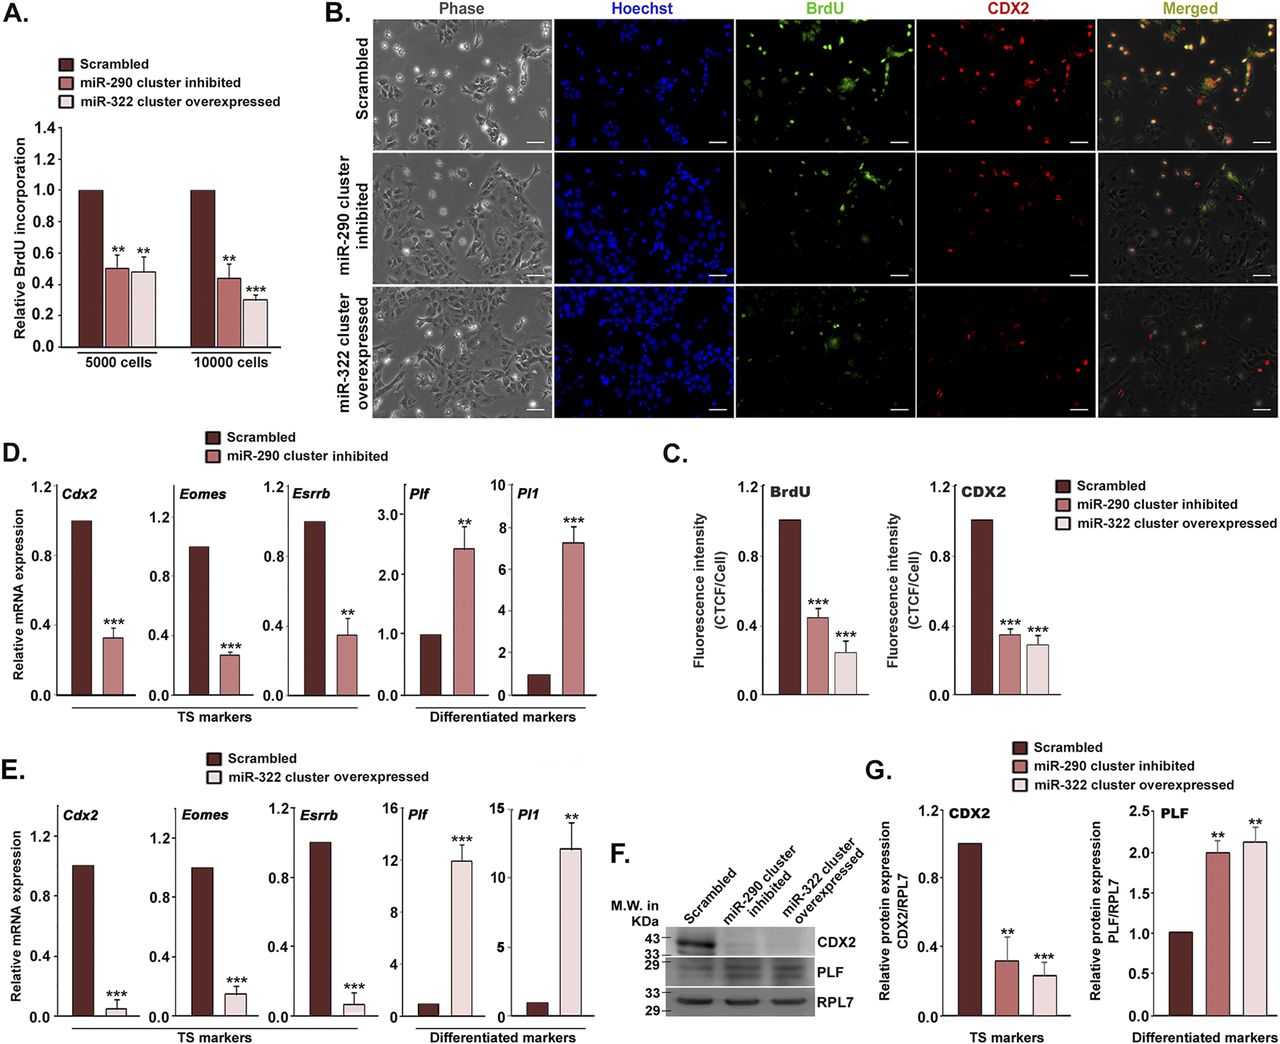
- Figure 4. Mir-290 and -322 cluster impact cell proliferation and differentiation of trophoblast stem (TS) cells.
(A) BrdU cell proliferation assay in TS cells treated with miR-290 cluster inhibitors or miR-322 cluster mimics. Values are the mean ± SEM of four independent determinations (n = 4). (B) Immunofluorescence of BrdU (green) incorporation, CDX2 (red) in TS cells inhibited with miR-290 cluster or overexpressed miR-322 cluster. Scale bar: 50 μm. (C) Quantification of fluorescence intensity for BrdU and CDX2 from B, panels 3 and 4 (n = 3). (D, E) Real-time PCR analysis of stemness markers (Cdx2, Eomes, and Esrrb) and early TGC marker (Plf and Pl1) in TS cells treated with miR-290 cluster inhibitors (D) or miR-322 cluster mimics (E). (F) Western blot analysis of CDX2 and PLF in TS cells treated with miR-290 cluster inhibitors or miR-322 cluster mimics. (G) Quantification of protein expression using NIH imageJ software. **P < 0.005; ***P < 0.0005 compared with control.
Source data are available for this figure.
Source Data for Figure 4[LSA-2020-00674_SdataF4.pdf]
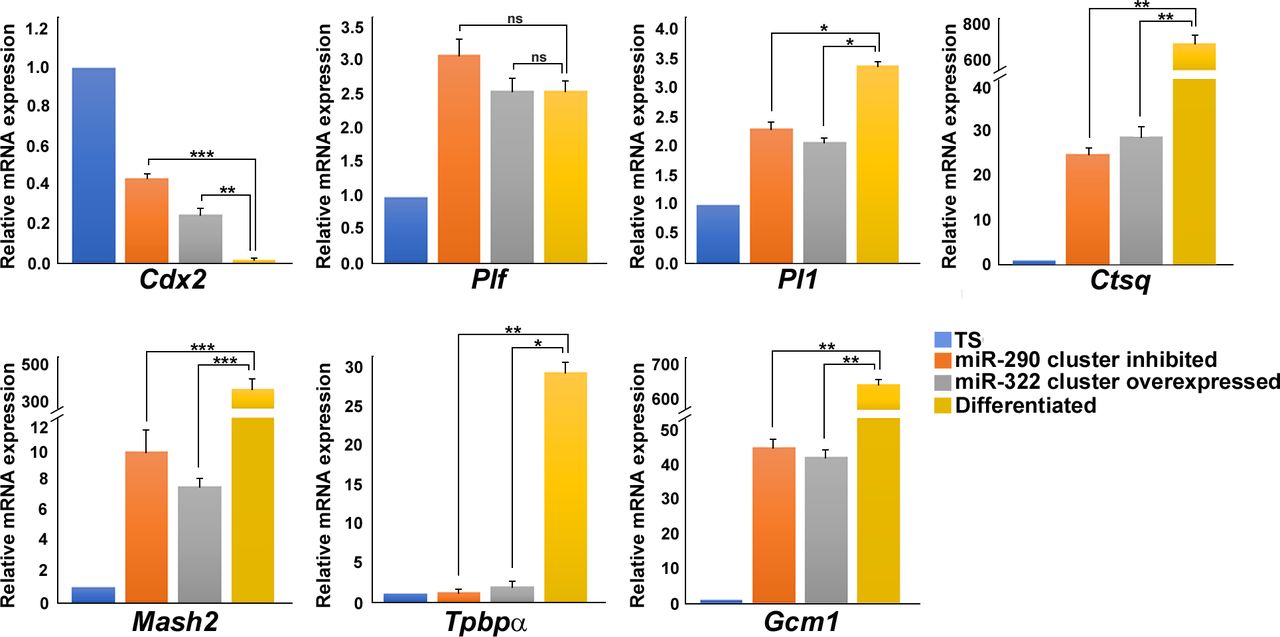
- Figure S4. Comparison of trophoblast differentiation induced by miR-290 cluster inhibition or miR-322 cluster overexpression with differentiation by mitogen removal.
Quantitative real-time PCR analysis of differentiation markers representing different trophoblast lineages. Rpl7 was used for normalization. Data are presented in mean ± SEM of three independent experiments (n = 3). *P < 0.05; **P < 0.005; ***P < 0.0005; ns, nonsignificant.
- Figure S5. Effect of siRNA-mediated Cdx2 knockdown on cell cycle repressors in trophoblast stem (TS) cells.
(A) Quantitative real-time PCR analysis for Cdx2 in TS cells and differentiated trophoblast cells. (B) Western blot analysis for CDX2 in TS cells and differentiated trophoblast cells. Densitometric analysis of the Western blot is shown in the right. (C) Real-time PCR analysis of Cdx2 in TS cells using increasing concentrations of two Cdx2 siRNAs mix in equal amounts. (D) Quantitative real-time PCR analyses for cell cycle repressors in scrambled and si-cdx2 transfected TS cells. (E) Immunoblot analyses of CDX2 and cell cycle repressors in scrambled and si-cdx2 transfected TS cells. (F, G) Densitometric analysis of Western blots for CDX2 (F) and cell cycle repressors (G) in scrambled and si-cdx2 transfected TSCs. Data are presented in mean ± SEM of three replicates (n = 3). *P < 0.05; **P < 0.005; ***P < 0.0005.
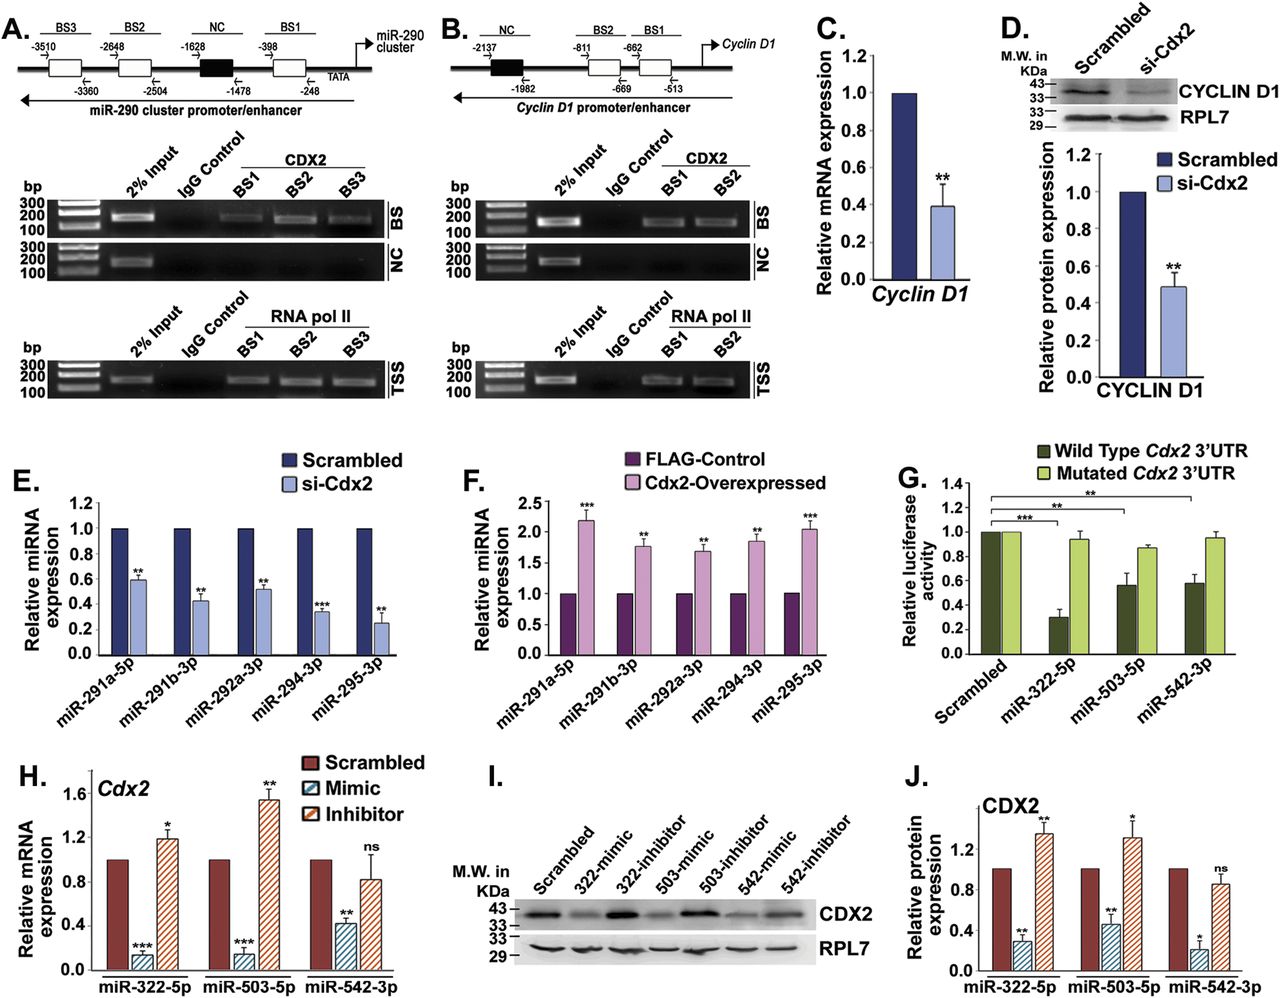
- Figure 5. CDX2 transactivates miR-290 cluster, cyclin D1 promoter in trophoblast stem (TS) cells, and miR-322 cluster members directly inhibit CDX2.
(A, B) ChIP analyses revealed direct binding of CDX2 in miR-290 cluster (A) and cyclin D1 (B) promoter regions. BS indicates binding site. (C, D) Real-time PCR analysis of Cyclin D1 (C) and Western blot analysis of CYCLIN D1 (D) in CDX2 knocked down TS cells. Shown in the following is the NIH imageJ analysis of Western blot. (E) TaqMan assays of miR-290 cluster members in Cdx2 knocked down TS cells. (F) TaqMan assays of miR-290 cluster members in CDX2 overexpressed TS cells. (G) Relative luciferase assay showing the repressive effect of miR-322/503/542 mimic on wild-type Cdx2-3′-UTR. (H, I, J) Quantitative real-time PCR analysis of Cdx2 (H) and Western blot analysis of CDX2. (I) in TS cells transfected with mimic or inhibitor of miR-322 cluster members. Quantification of protein expression using NIH imageJ analysis of the Western blot. (J) Data are presented in means and standard error of the mean of three replicates (n = 3). *P < 0.05; **P < 0.005; ***P < 0.0005; ns, nonsignificant compared with control.
Source data are available for this figure.
Source Data for Figure 5[LSA-2020-00674_SdataF5.pdf]
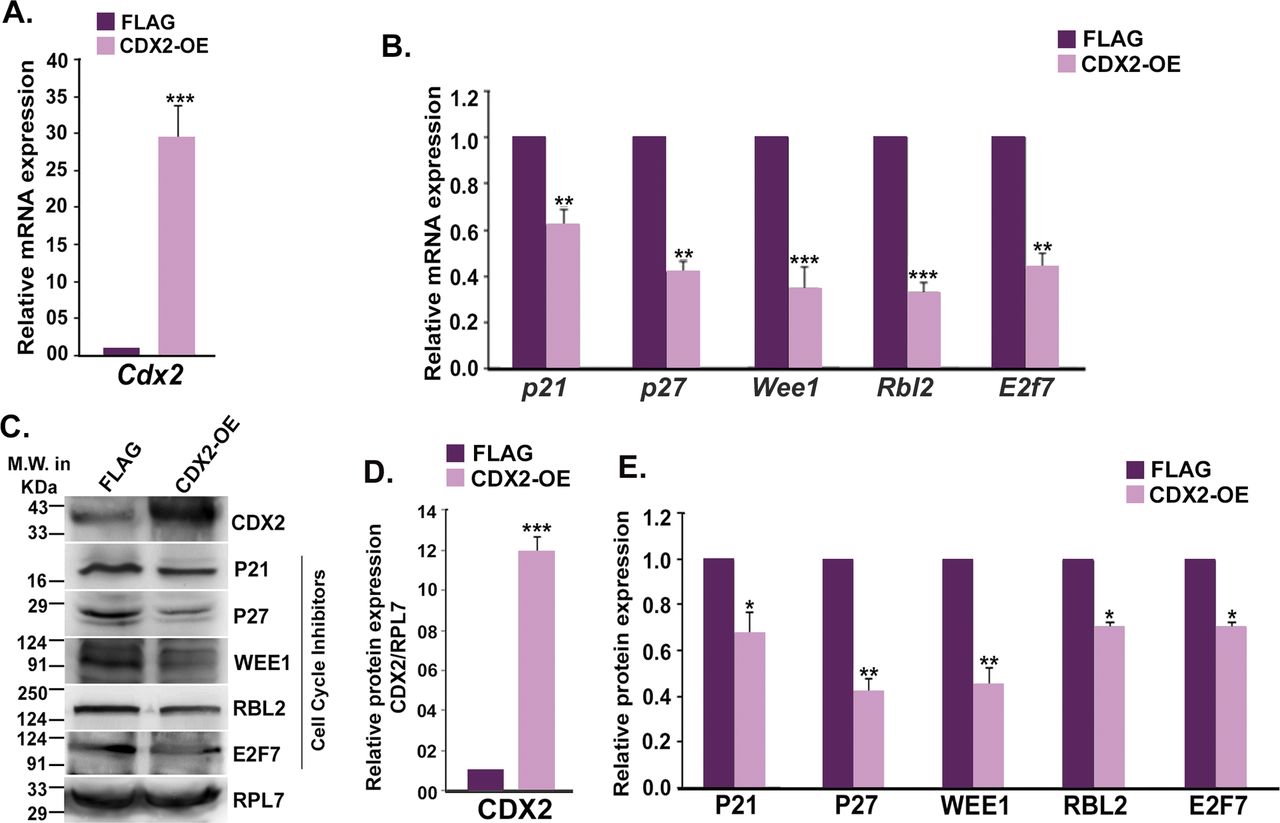
- Figure S6. Effect of CDX2 overexpression on cell cycle repressors in trophoblast stem (TS) cells.
(A) Quantitative real-time PCR analysis of Cdx2 in TS cells transfected with either empty FLAG vector or FLAG-CDX2. (B) Quantitative real-time PCR analyses of cell cycle repressors in TS cells transfected with either empty FLAG vector or FLAG-CDX2. (C) Immunoblot analyses of CDX2 and cell cycle repressors in control (FLAG) and CDX2 overexpressed (CDX-OE) TS cells. (D, E) Densitometric analysis of Western blots for CDX2 (D) and cell cycle repressors (E). Data are presented in mean ± SEM of three replicates (n = 3). *P < 0.05; **P < 0.005; ***P < 0.0005.
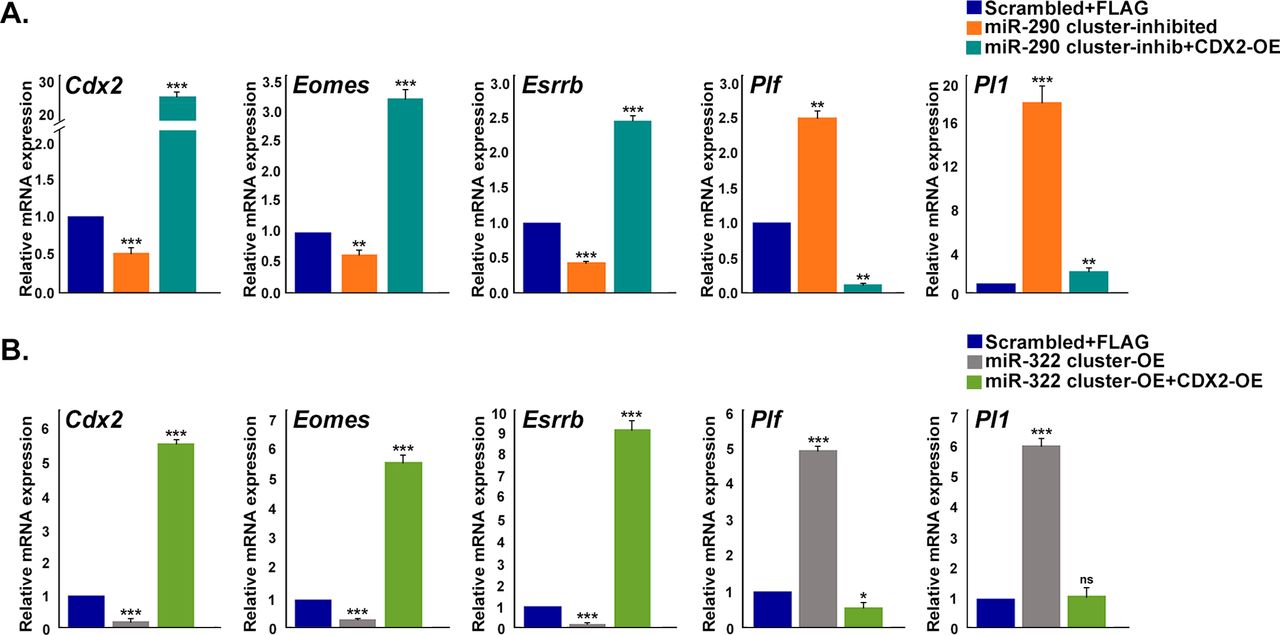
- Figure S7. Effect of CDX2 overexpression on miR-290 cluster inhibited or miR-322 cluster overexpressed trophoblast stem (TS) cells.
(A) Quantitative real-time PCR analysis of stemness markers and differentiation markers in TS cells transfected with (i) scramble miRNA and empty FLAG vector or (ii) miR-290 cluster inhibitors or (iii) miR-290 cluster inhibitors and FLAG-CDX2. (B) Quantitative real-time PCR analysis of stemness markers and differentiation markers in TS cells transfected with (i) scramble miRNA and empty FLAG vector or (ii) miR-322 cluster mimics or (iii) miR-322 cluster mimics and FLAG-CDX2. Rpl7 was used as endogenous control. Data presented are mean ± SEM of three independent experiments (n = 3).*P < 0.05; **P < 0.005; ***P < 0.0005; ns, nonsignificant.
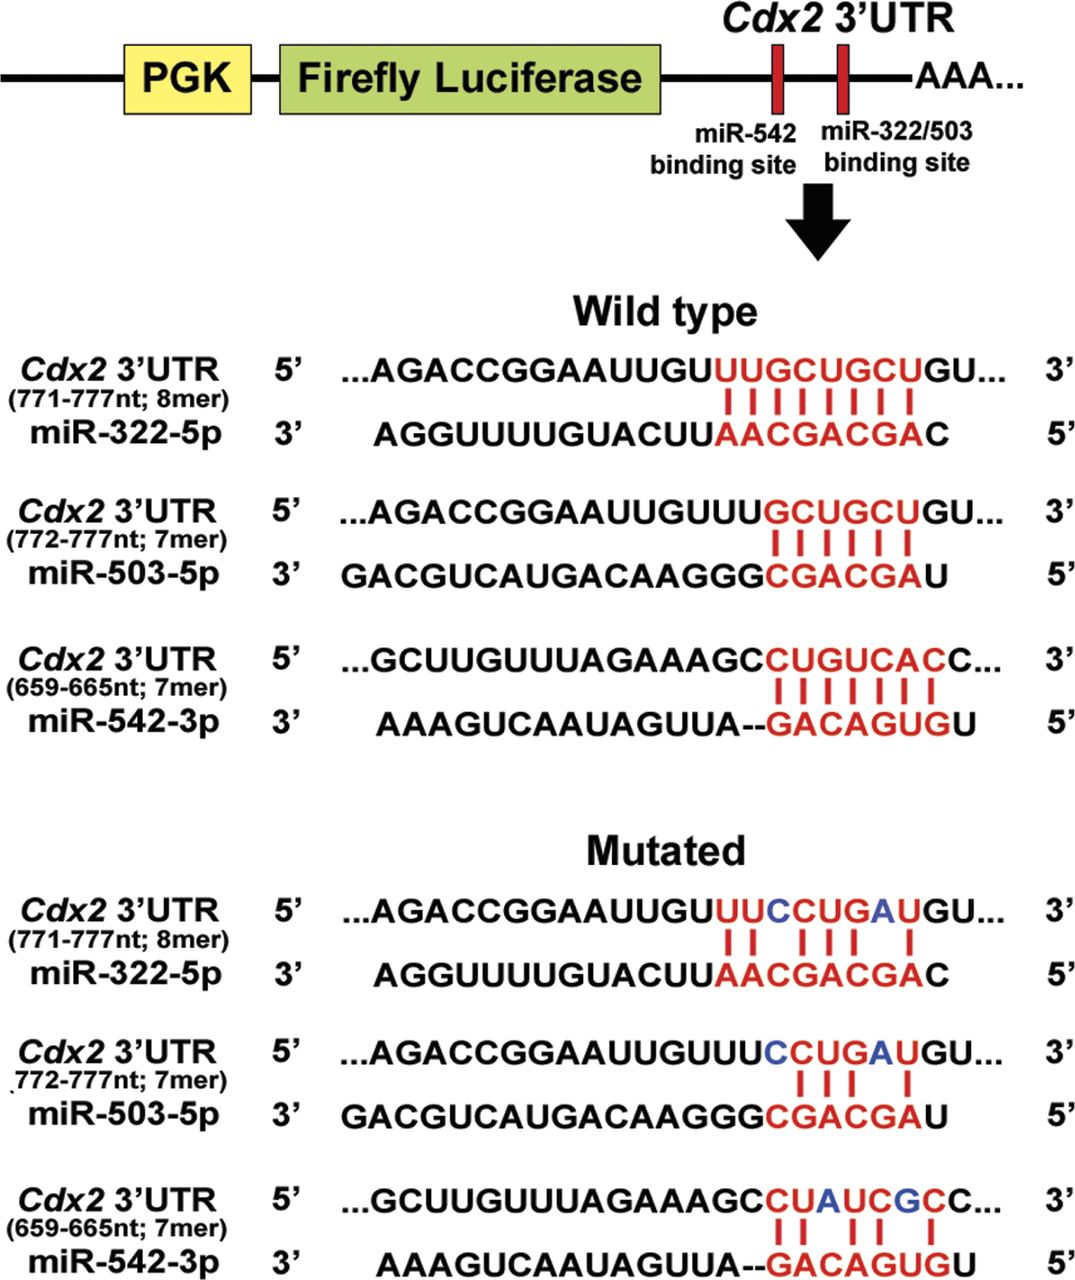
- Figure S8. Schematic representation of luciferase assay using wild-type and mutated 3′UTR of Cdx2.
Wild-type and mutated binding site for miR-322/503/542 cloned downstream of firefly luciferase gene in pmirGLO vector. Blue letters indicate mutated nucleotides.
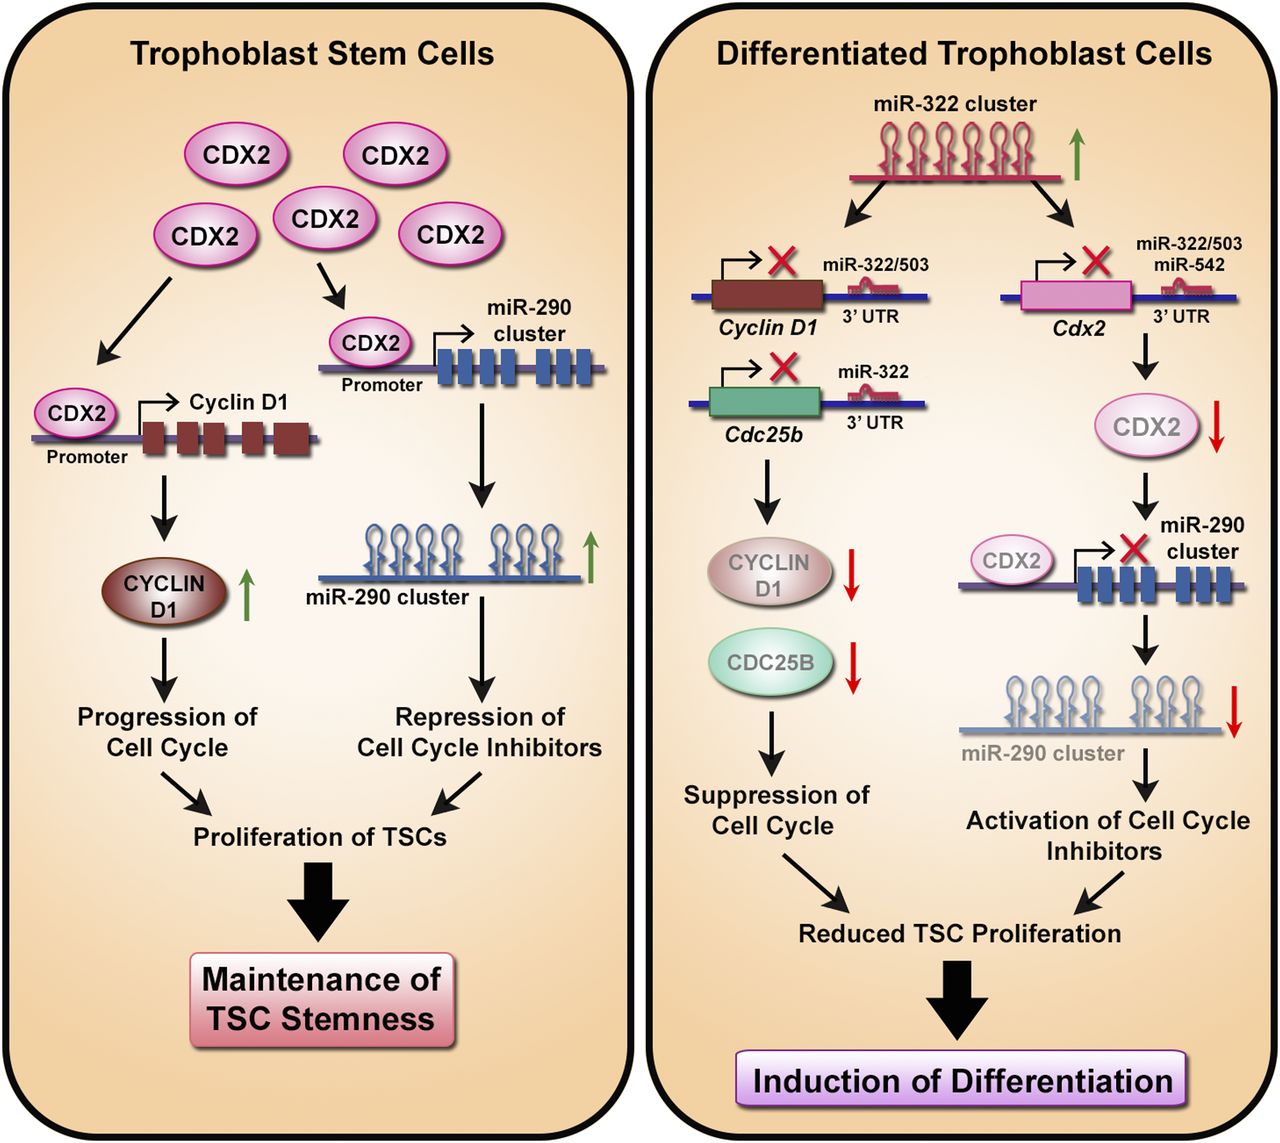
- Figure 6. Schematic representation of the regulatory network formed by CDX2, cell cycle regulators, and miRNA clusters in trophoblast stem (TS) cells and differentiated trophoblast cells.
CDX2 is abundant in TS cells. It transactivates the miR-290 cluster and cyclin D1 by binding to their promoter regions. Subsequently, the miR-290 cluster members suppress the cell cycle inhibitors (CKIs), whereas CYCLIN D1 promotes the proliferation of TS cells, and thus collectively, maintain the stemness. Upon differentiation, the miR-322 cluster is up-regulated, leading to suppression of CDX2 expression. Depletion of CDX2 leads to down-regulation of the miR-290 cluster and consequent up-regulation of CKIs. Members of the miR-322 cluster also down-regulate the CYCLIN D1 and CDC25B levels to abolish the G1/S transition and suppress the proliferation of TS cells and thus induce TS cell differentiation.


Supplementary Materials


