


Article Figures & Data
Figures
- Figure 1. In vivo characterization of ORC-Pch2.
(A) Schematic of hexameric Pch2 AAA+ assembly, with domains organization of Pch2. (B) Co-immunoprecipitation (co-IP) of wild-type Pch2 and Pch2–E399Q with Orc1–TAP (via α-TAP-IP) during the meiotic prophase (5 h into meiotic program). (C) co-IP of wild-type Pch2 and Pch2–K320R with Orc1–TAP (via α-TAP-IP) during the meiotic prophase (5 h into meiotic program). (D) Schematic of the Orc1-6/AAA+ complex and its canonical role with the Cdc6 AAA+ protein (and additional factors) in MCM/AAA+ complex loading and DNA replication. (E) co-IP of Pch2–E399Q with Orc1–TAP, Orc2–TAP, and Orc5–TAP during the meiotic prophase (5 h into meiotic program) (via α-TAP-IP). For α-HA, short and long exposures are shown. * indicate degradation products of either Orc1–TAP or Orc2–TAP. (F) co-IP of Pch2–E399Q with Orc2 (via α-Orc2 IP). Isotype IgG IP was used as negative control.
- Figure S1. In vivo analysis of Pch2–ORC interactions.
(A) Western blotting of yeast strains expressing Pch2 with Orc1–TAP, Orc2–TAP and Orc5–TAP. Time points after meiosis induction are shown. * denotes Orc1–TAP degradation fragment. (B) Co-immunoprecipitation of Pch2–E399Q with Orc1–TAP (via α-TAP-IP) during the meiotic prophase (5 h into meiotic program) in the presence or absence of Benzonase. (C) DNA PAGE analysis of (B).
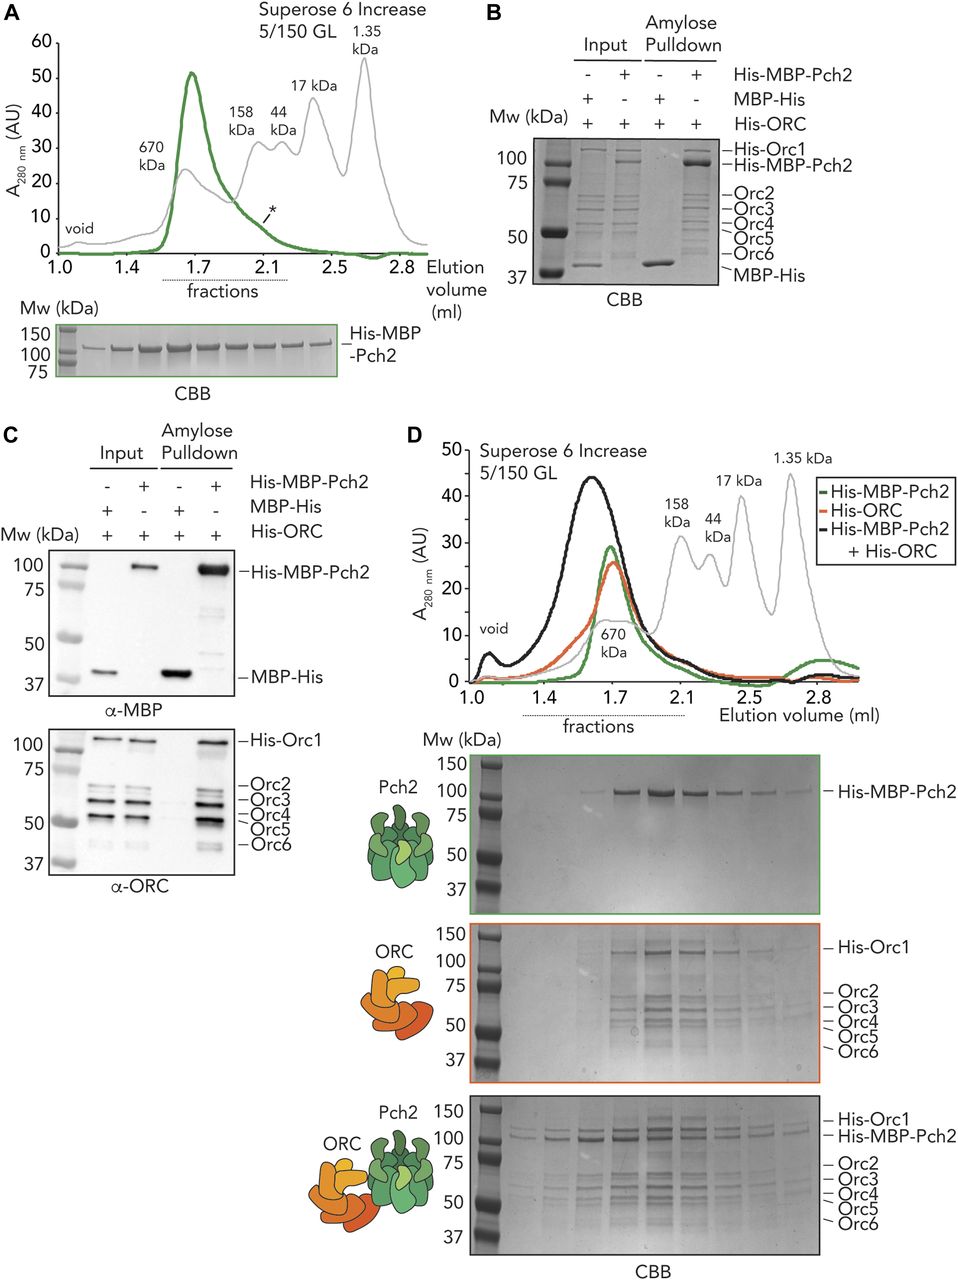
- Figure 2. In vitro reconstitution of the origin recognition complex (ORC)–Pch2 complex.
(A) Size exclusion chromatography of His–MBP–Pch2 purified from insect cells. Coomassie Brilliant Blue (CBB) staining of peak fractions (dotted line) run on SDS–PAGE gel. * indicates likely monomeric fraction of His–MBP–Pch2. AU, arbitrary units. (B, C) Amylose-based pulldown of the ORC (His–Orc1-6 and His–ORC) purified from insect cells, with His–MBP–Pch2. (B) CBB staining, (C) Western blot analysis using α-MBP and α-ORC (which recognizes all six ORC subunits). (D) Size exclusion chromatography of His–ORC (His–MBP–Pch2) assembly. CBB staining of peak fractions (dotted line) run on SDS–PAGE gel. AU, arbitrary units.
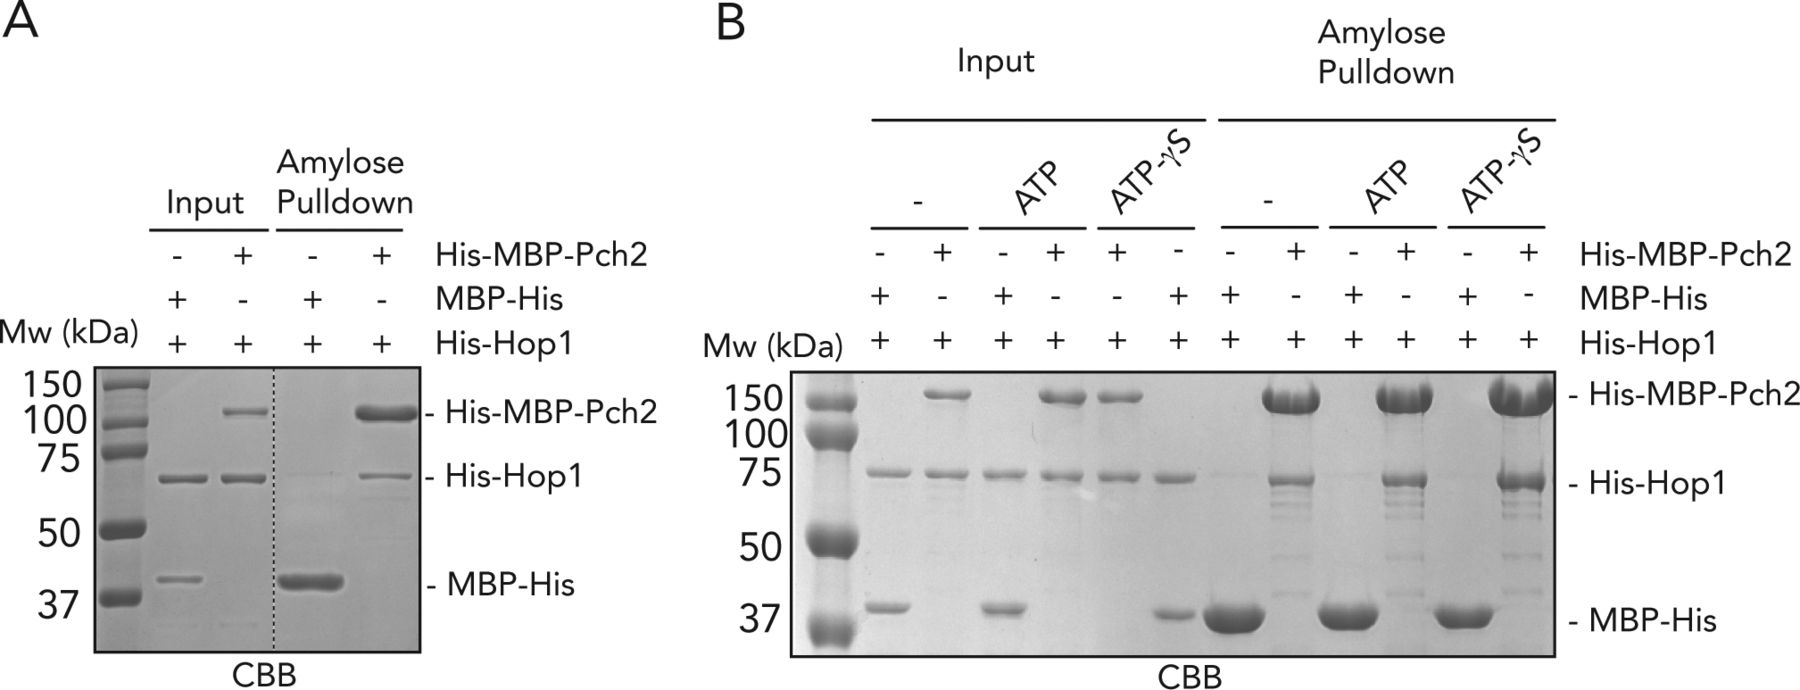
- Figure S2. In vitro interaction between Pch2 and Hop1.
(A) Amylose-based pulldown of His–Hop1, with His–MBP–Pch2 or MBP–His; Coomassie Brilliant Blue staining. (B) Amylose-based pulldown of His–Hop1, with His–MBP–Pch2 or MBP–His, in the presence or absence of ATP or ATPγS; Coomassie Brilliant Blue staining.
- Figure S3. In vitro analysis Pch2–(ORC) origin recognition complex assembly.
(A) Size exclusion chromatography of the ORC (His–Orc1, Orc2-6) purified from insect cells. Coomassie Brilliant Blue (CBB) staining of peak fractions (dotted line) run on SDS–PAGE gel. AU, arbitrary units. (B) Western blot of the purified ORC (His–Orc1, Orc2-6) using α-ORC. (C) MS-analysis of the insect cell–purified ORC. (D) CBB staining of the purified ORC (His–Orc1, insect cells) and the budding yeast ORC (CBP–Orc1). (E) Treatment of the purified ORC (His–Orc1, insect cells) with λ-phosphatase, at 4°C or room temperature. CBB staining. # indicates phosphorylated Orc6. (F) Amylose-based pulldown of the dephosphorylated and untreated ORC (His-Orc1, insect cells), with His–MBP–Pch2 or MBP–His; Coomassie Brilliant Blue (CBB) staining. # indicates phosphorylated Orc6. (G) Calmodulin-based pulldown of the ORC (Orc1-6) purified from budding yeast, with His–MBP–Pch2 and MBP–His. Coomassie Brilliant Blue (CBB) staining. (H) Calmodulin-based pulldown of the ORC (Orc1-6) purified from budding yeast, with His–MBP–Pch2 and MBP–His, in the presence or absence of MgCl2 and ADP/ATP (and ATP analogs). Coomassie Brilliant Blue (CBB) staining.
- Figure 3. The NH2-terminal domain (NTD) of Pch2 is required for ORC–Pch2 formation.
(A) Schematic of Pch2 domain organization. (B) Yeast two-hybrid analysis between Orc1 and Pch2 (full-length Pch2, and AAA+ ATPase domain [Pch2-243-564]). (C) Amylose-based pulldown of His–ORC (His–Orc1-6) purified from insect cells, with His–MBP–Pch2 or His–MBP–Pch2-243-564. Coomassie Brilliant Blue (CBB) staining. (D) Co-immunoprecipitation of 3xFlag-Pch2 and 3xFlag-Pch2 243-564 with Orc1–TAP (via α-TAP-IP) during the meiotic prophase (4 h into meiotic program). For α-Flag, short and long exposures are shown. α-Pgk1 is used as a loading control. (E) Schematic of the role of Pch2 in controlling Spo11-dependent DNA double-strand break (DSB) formation within the flanking regions of the budding yeast ribosomal DNA array located on chromosome XII. * indicates location of YLR164W locus, where DSB formation is interrogated. (F) Western blot analysis of meiotic time-course samples of yeast strains expressing wild-type 3xFlag-Pch2 and 3xFlag-Pch2 243-564 as used in (A). (3xFlag-PCH2 pch2Δ dmc1Δ and 3xFlag-pch2 243-564 pch2Δ dmc1Δ). (G) Southern blot analysis of YLR164W locus (right ribosomal DNA flank; chromosome XII) and YCR047C locus (control DSB region; chromosome III), in dmc1Δ, pch2Δ dmc1Δ, 3xFlag-PCH2 pch2Δ dmc1Δ, and 3xFlag-pch2 243-564 pch2Δ dmc1Δ background. dmc1Δ is a DSB repair deficient mutant used to detect accumulation of meiotic DSBs.
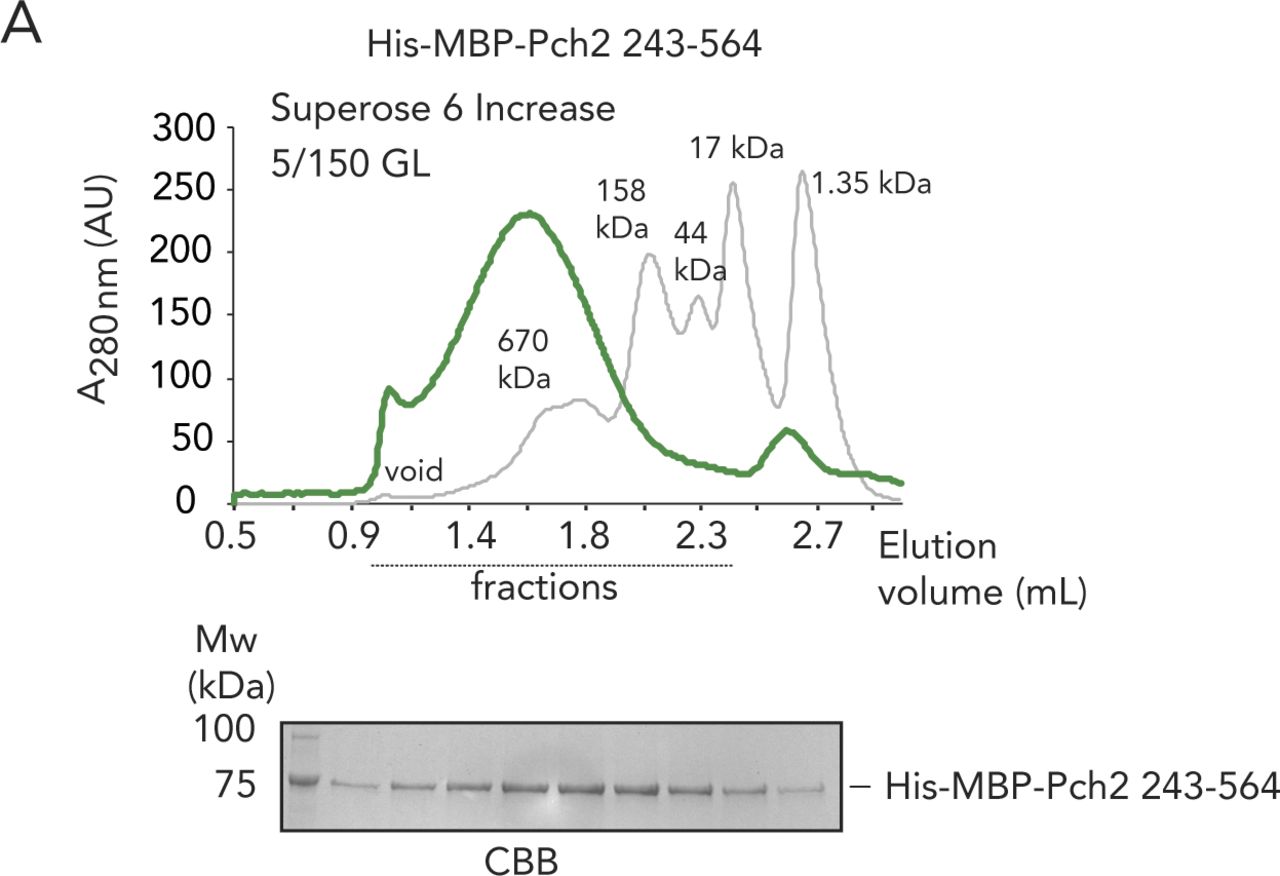
- Figure S4. In vitro analysis Pch2-243-564.
(A) Size exclusion chromatography of His–MBP–Pch2-243-564, purified from insect cells. Coomassie Brilliant Blue staining (CBB) of peak fractions (dotted line) run on SDS–PAGE gel. AU, arbitrary units.
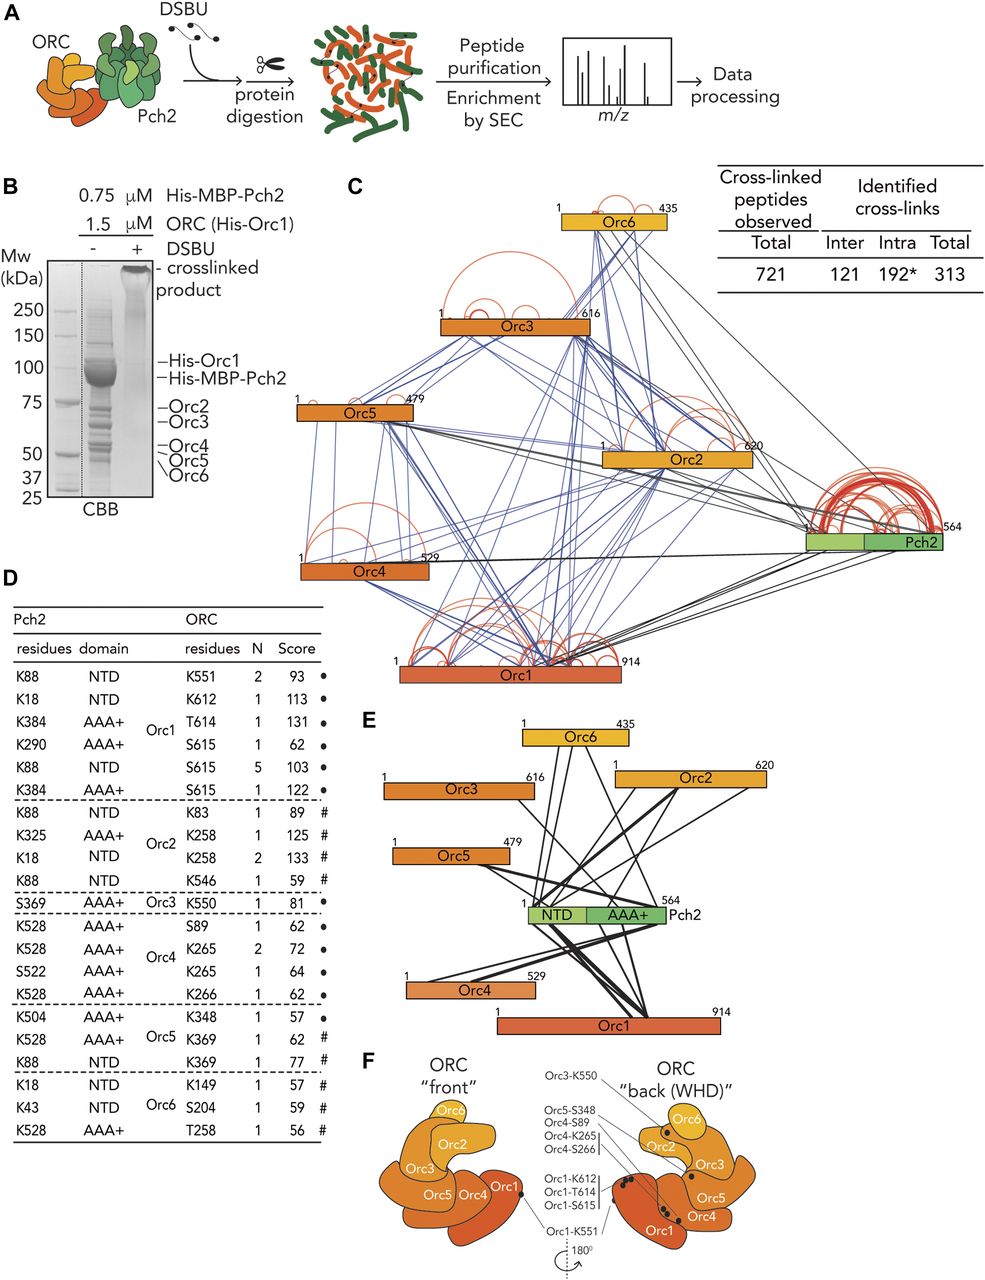
- Figure 4. Cross-linking mass spectrometric analysis of origin recognition complex (ORC)–Pch2 complex assembly.
(A) Schematic of DSBU-based cross-linking mass spectrometry (XL-MS) experimental pipeline. (B) Coomassie Brilliant Blue (CBB) staining of DSBU–cross-linked Pch2–ORC. (C) Right panel: Table indicating total cross-linked peptides and derived nonredundant (inter- and intramolecular) cross-links with a false discovery rate of 2%. * indicates that intramolecular cross-link peptides include 96 Pch2–Pch2 cross-links, which can be derived from inter- or intramolecular Pch2–Pch2 cross-links. Left panel: Schematic indicating all identified nonredundant cross-links. Blue: inter-ORC, red: intra-ORC and intra-Pch2, black: inter–ORC–Pch2. Network plots were generated using xVis. (D) Table showing inter–ORC–Pch2 cross-links. Indicated are residues in Pch2, and ORC subunits, domain of Pch2 involved (NTD: 1-242, AAA+: 243-564). N indicates how often cross-links were identified. MeroX score is indicated. ● indicates cross-linked ORC residues that are mapped into cartoon representation of the ORC structure in (F). # indicates cross-links that fall in regions of ORC subunits that are not present in the used ORC structure. (E) Schematic indicating identified nonredundant inter–Pch2–ORC cross-links. The line thickness corresponds to the number of cross-links, as shown in (D). (F) Cartoon depiction of ORC organization, based on structure PDB 5v8f; (Yuan et al, 2017). “Back” and “front” are relative to winged helix domain (WHD) orientation, as indicated. Black dots represent ORC cross-linked residues in our XL-MS analysis. Note that because of a lack of regions in the structure used to generate the ORC schematic representation, not all cross-links are represented (see also text).
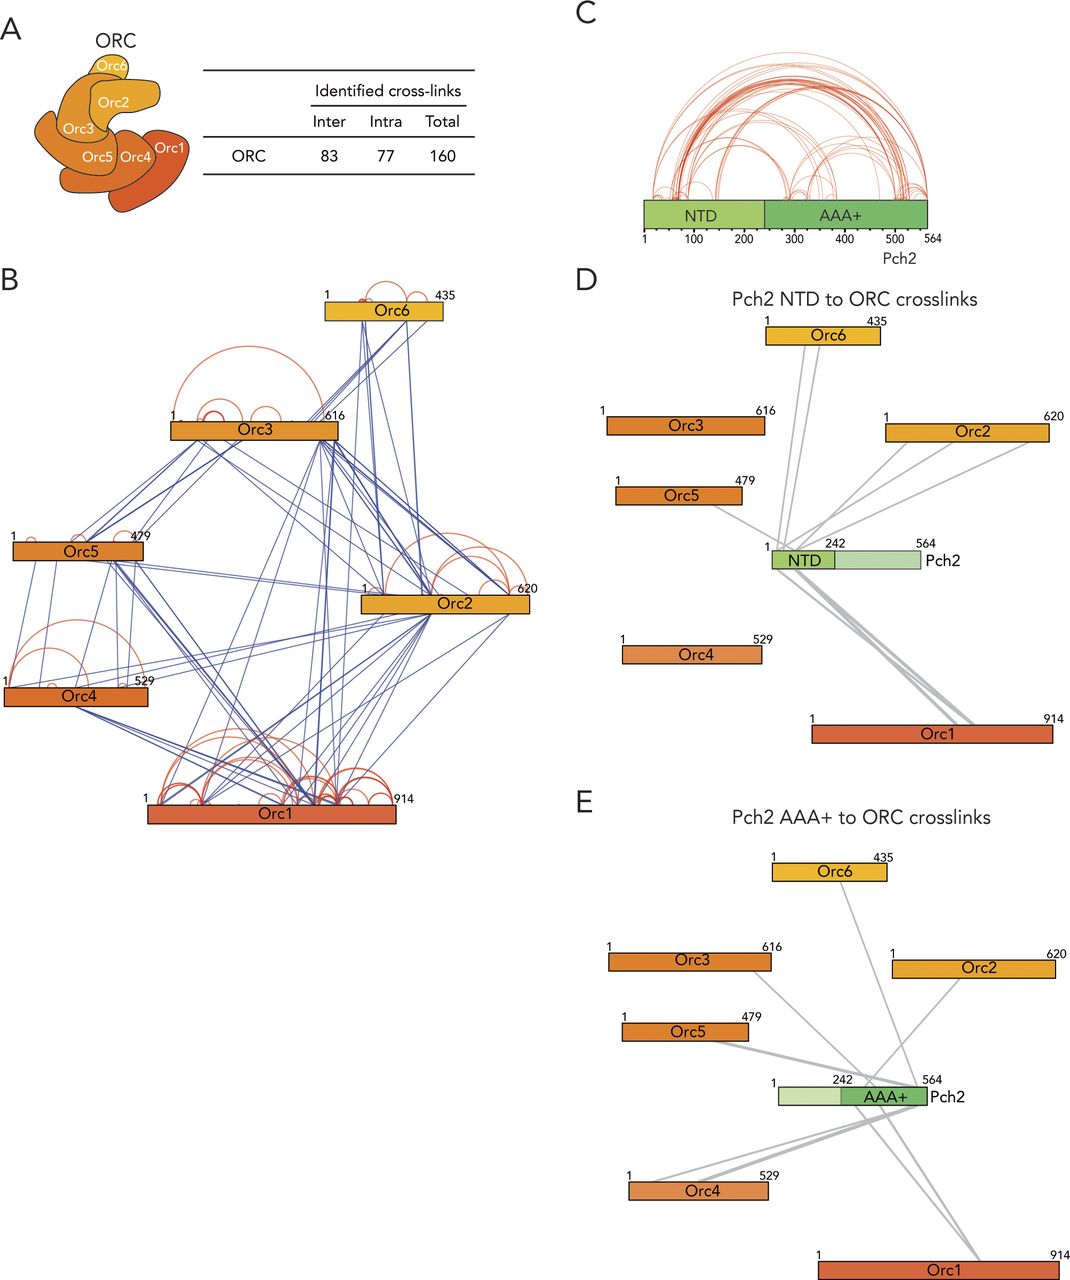
- Figure S5. XL-MS of Pch2–(ORC) origin recognition complex.
(A) Table indicating inter-ORC and intra-ORC cross-linked peptides (nonredundant (inter- and intramolecular) cross-links with a false discovery rate of 2%). (B) Schematic indicating identified inter/intra-ORC nonredundant cross-links. Blue: inter-ORC, red: intra-ORC. (C) Schematic indicating Pch2–Pch2 cross-links. Note that we classified the Pch2–Pch2 cross-links as intramolecular (see text for further details). NTD, NH2-terminal domain; AAA+, AAA+ ATPase domain. (D) Schematic indicating identified nonredundant intermolecular cross-links between the NTD of Pch2 and the ORC. (E) Schematic of nonredundant intermolecular cross-links between the AAA+ ATPase domain of Pch2 with the ORC. Network plots were generated using xVis website (https://xvis.genzentrum.lmu.de).
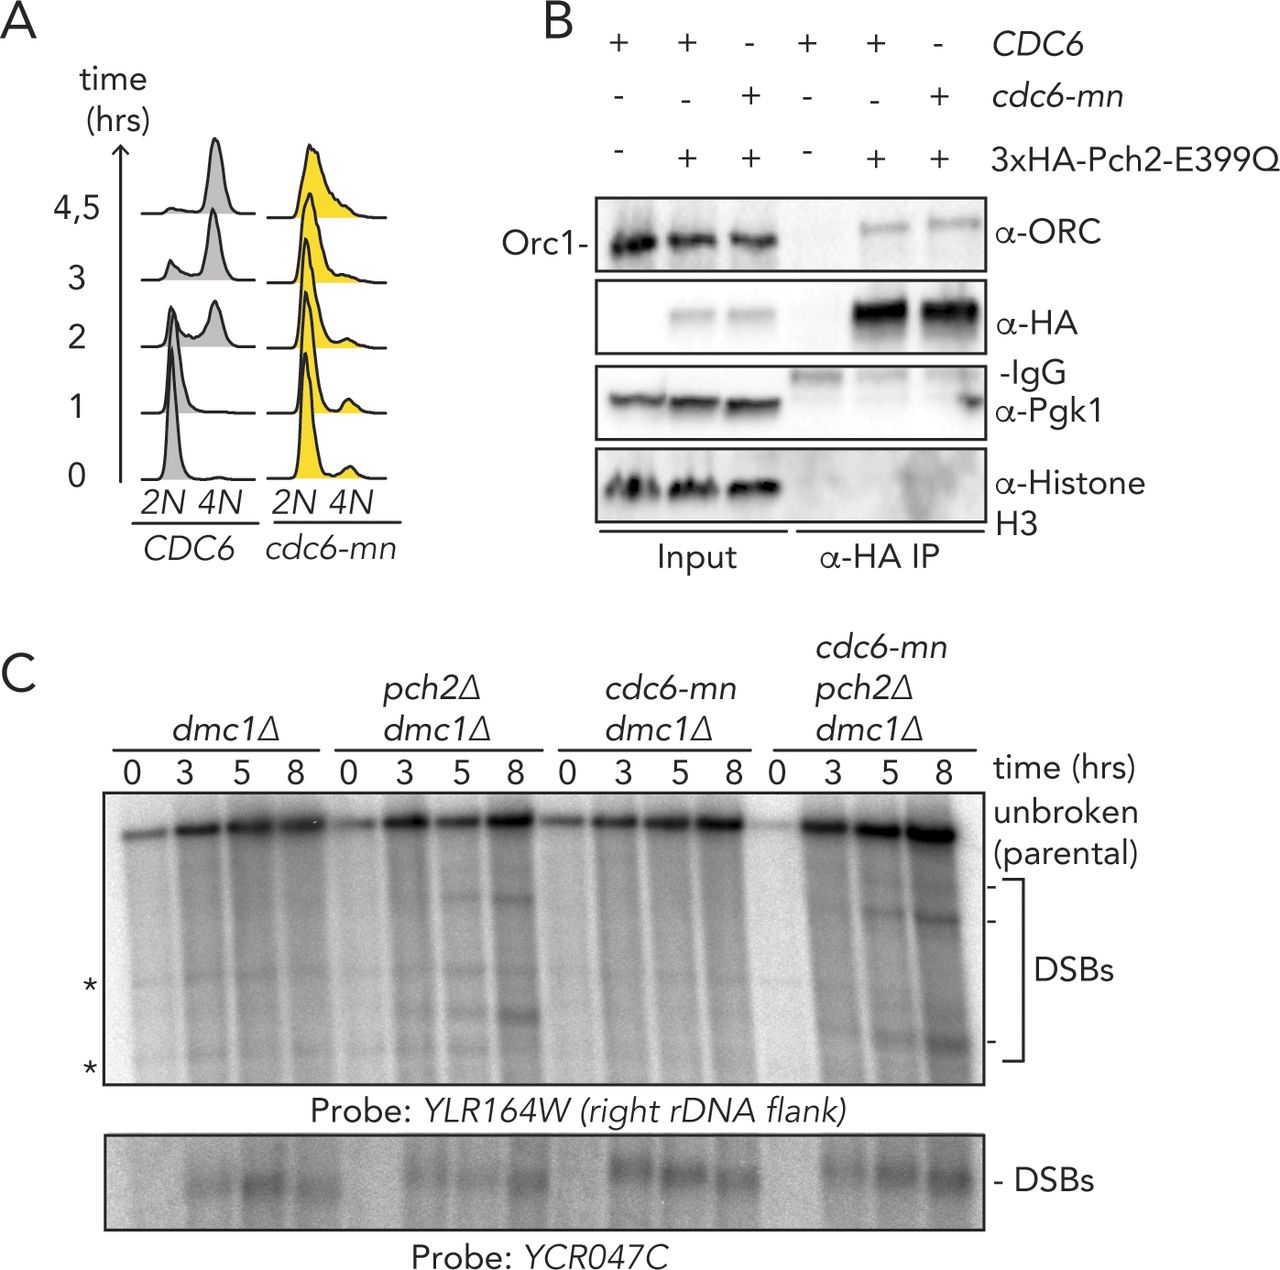
- Figure S6. In vivo analysis of the role of Cdc6 in Pch2/ORC interaction and function.
(A) Flow cytometry analysis of CDC6 and cdc6-mn (pSCC1::CDC6) in meiosis. Time points after induction into the meiotic program are indicated. (B) Co-immunoprecipitation of Pch2–E399Q with the ORC (via α-HA-IP) during the meiotic prophase (5 h into meiotic program) in CDC6 and cdc6-mn background. (C) Southern blot analysis of the YLR164W locus (right ribosomal DNA flank; chromosome XII) and YCR047C locus (control double-strand break [DSB] region; chromosome III), in dmc1Δ, pch2Δ dmc1Δ, cdc6-mn dmc1Δ, and cdc6-mn pch2Δ dmc1Δ background. dmc1Δ is a DSB repair deficient mutant used to detect accumulation of meiotic DSBs. * indicates aspecific signal.
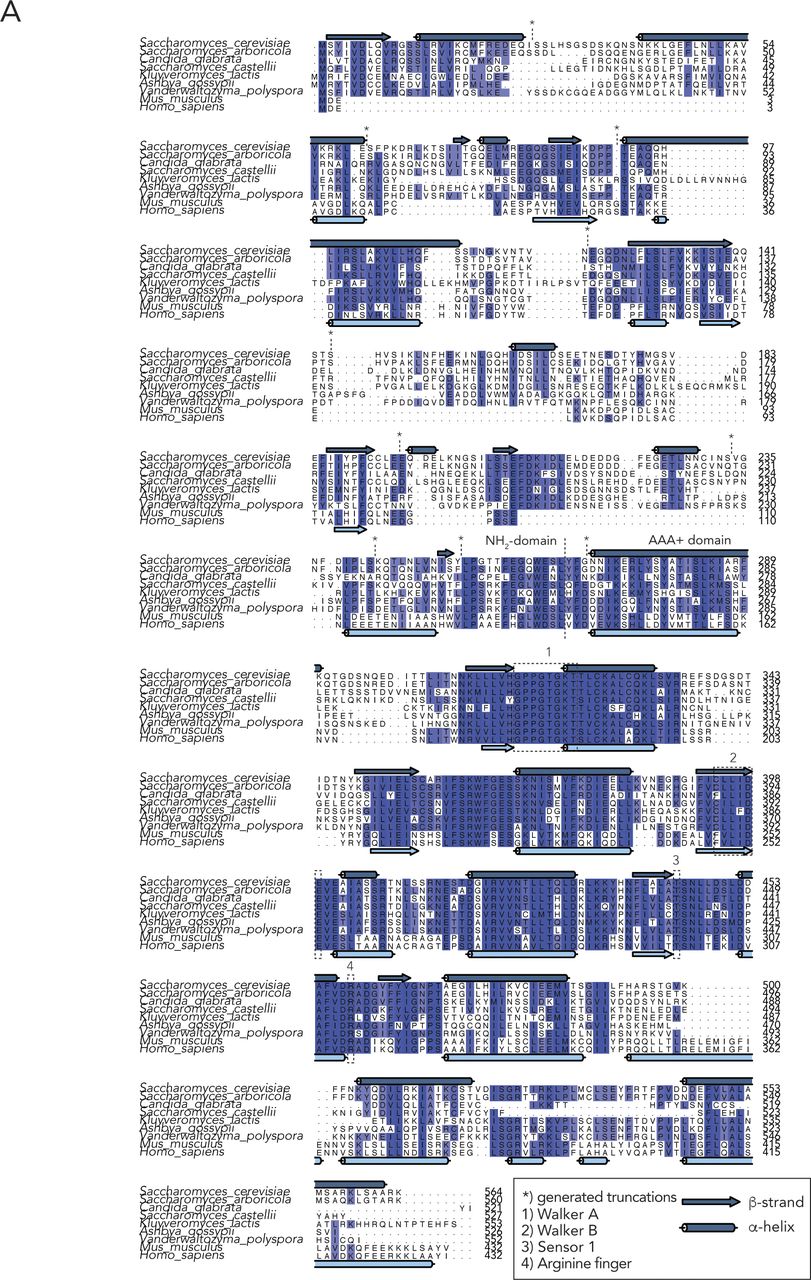
- Figure S7. Sequence analysis of Pch2.
(A) Sequence alignments of Pch2 from indicated species, including PSIPRED secondary structure predictions. Boxes indicate key AAA+ features, * indicates generated truncation boundaries. Sequence alignments were generated using MAFFT/L-INS-i. Secondary structure predictions were made using PSIPRED. Alignments were visualized using Jalview.
- Figure 5. Dissection of the role of the NTD of Pch2 in origin recognition complex (ORC) association.
(A) Yeast two-hybrid analysis between Orc1 and NH2-terminal fragments of Pch2 (2-270, 2-257, 2-242, 2-233, 2-194, 2-144, 2-121, 2-91, 2-60, 2-27). Red-dotted box indicates the minimal fragment of Pch2 that showed interaction with Orc1. (B) Size exclusion chromatography of His–MBP–Pch2-2-144 purified from insect cells; Coomassie Brilliant Blue (CBB) staining of the peak fractions (dotted line). AU, arbitrary units. (C) Amylose-based pulldown of the ORC (His–Orc1-6) purified from insect cells, with His–MBP–Pch2 or His–MBP–Pch2-2-144; Coomassie Brilliant Blue staining. (D) Amylose-based pulldown of the ORC (His–Orc1-6) purified from insect cells, with His–MBP–Pch2 or His–MBP–Pch2-2-144; Western blot analysis using α-MBP and α-ORC. (E) Schematic of interaction mode between the ORC and Pch2. Red-dotted box indicates the NH2-terminal 2-144 region of Pch2’s NTD. Cross-linked residues within the Pch2-2-144 region are indicated with *.
- Figure 6. Functional in vivo analysis of origin recognition complex (ORC)–Pch2.
(A) Schematic of the ORC assembly and rapamycin-based anchor-away method. (B) 10-fold serial dilution spotting assay for anchor-away strains (untagged, orc2-FRB and orc5-FRB). Strains are grown on YP-dextrose (YPD) or YPD + rapamycin (1 μg/ml). (C) Flow cytometry analysis of efficiency of orc2–FRB and orc5–FRB nuclear depletion. Cells were treated as indicated, with rapamycin (1 μg/ml) at t = 0. (D) Southern blot analysis of YLR164W locus (right ribosomal DNA flank; chromosome XII) and YCR047C locus (control double-strand break [DSB] region; chromosome III). dmc1Δ is a DSB repair deficient mutant that is used to detect accumulation of meiotic DSBs. Rapamycin (1 μg/ml) or DMSO was added at indicated t = 0. Samples were taken at indicated time points after meiotic induction. (E) Yeast two-hybrid analysis between Pch2 and Orc1, Orc2, Orc3, Orc4, and Orc6. (F) Schematic indicating inter–MBP–Pch2 and inter–MBP–Orc1 nonredundant cross-links. (G) Co-immunoprecipitation assay of Pch2–E399Q with Orc2–TAP in ORC1 or orc1-161 backgrounds (via α-TAP-IP) during the meiotic prophase (4 h into meiotic program). Experiments were performed at 23°C. (H) TAP-based ChIP-qPCR in ORC1 and ORC1–TAP expressing orc2–FRB anchor-away strains. Rapamycin (1 μg/ml) or DMSO was added at t = 0, and samples were taken at t = 4 h. Primers that amplify Intergenic Chr. VIII (control locus), ARS1114, and ARS1118 were used. Experimental data are the average of three biological replicates. SEM is indicated. Significance was calculated using an unpaired t test, and P-values are indicated. (I) Model depicting the origin-independent function of Pch2–Orc1/ORC in local meiotic DSB control.
- Figure S8. In vivo analysis of the Pch2–ORC interaction.
(A) Co-immunoprecipitation of Pch2–E399Q with Orc5–TAP in ORC1 or orc1-161 backgrounds (via α-TAP-IP) during the meiotic prophase (4 h into meiotic program). Experiments were performed at 23°C. α-H3 is used as a loading control. (B) Co-immunoprecipitation of Pch2 with Orc1–TAP in orc2–FRB background (via α-TAP-IP) during the meiotic prophase (4 h into meiotic program). Rapamycin (1 μg/ml) or DMSO was added at t = 0, and samples were taken 4 h after meiotic induction.
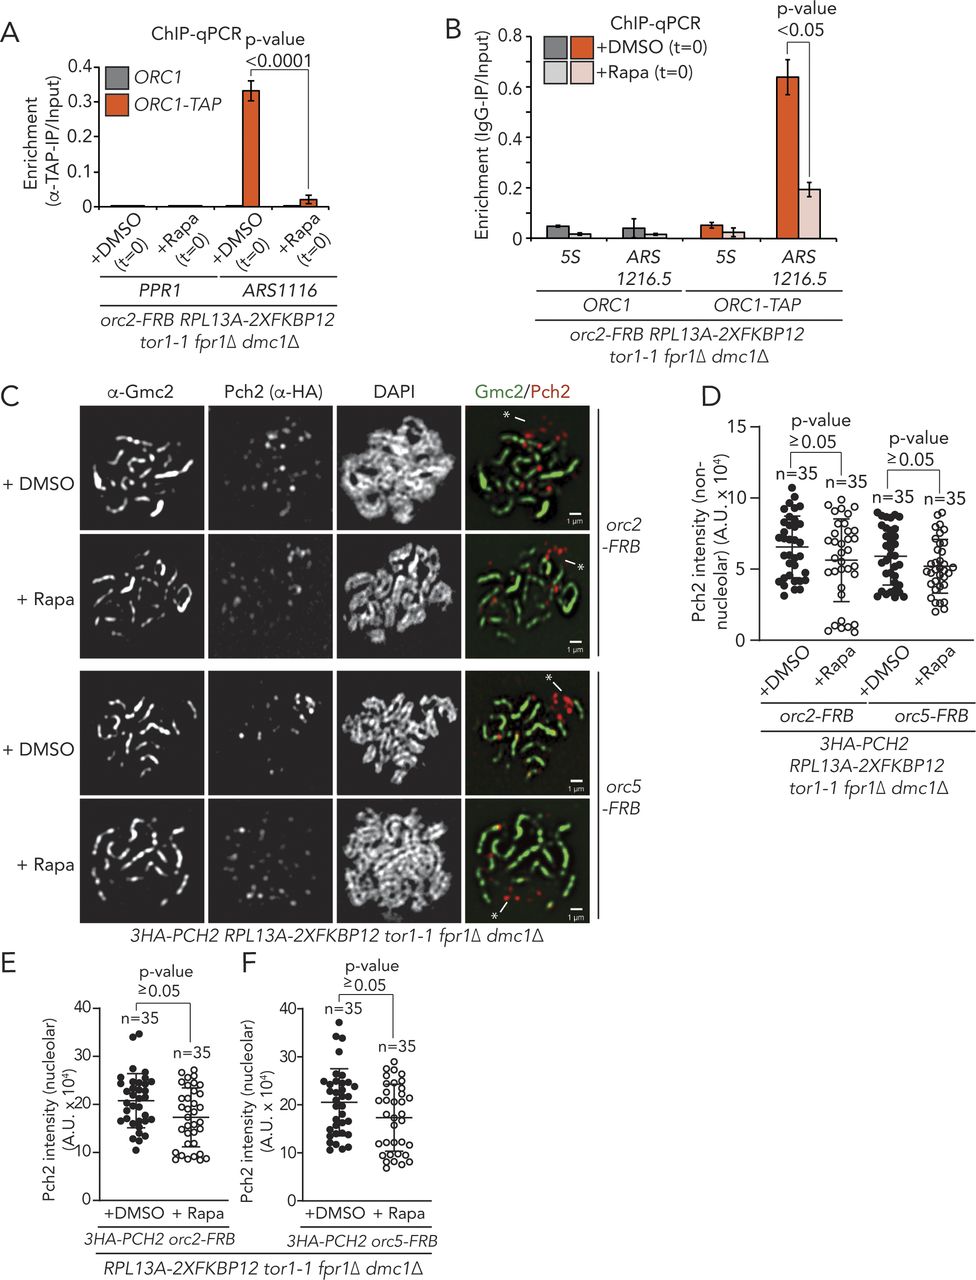
- Figure S9. ChIP and microscopy analysis of Pch2 and Orc1 localization and recruitment.
(A) TAP-based ChIP-qPCR in ORC1 and ORC1–TAP expressing orc2–FRB anchor-away strains. Rapamycin (1 μg/ml) or DMSO was added at t = 0, and samples were taken at t = 4 h. Primers used amplify PPR1 (control locus) or ARS1116. Experimental data are the average of five biological replicates. SEM is indicated. Significance was calculated using an unpaired t test, and P-value is indicated. (B) ChIP-qPCR analysis of Orc1–TAP in orc2–FRB anchor away cells treated with DMSO or rapamycin (samples collected at t = 4 h) at 5S (negative control) and at the ribosomal DNA ARS (ARS1216.5). The mean of three independent experiments is shown with error bars indicating standard error. Significance was calculated using an unpaired t test, and P-value is indicated. (C) Representative images of Gcm2 (synaptonemal complex) and 3XHA-Pch2 immunofluorescence on meiotic spreads in orc2–FRB or orc5–FRB anchor away cells, treated with DMSO or rapamycin. * denotes nucleolar regions, identified by chromosomal morphology and the absence of Gmc2 staining. (D) Quantification of chromosomal (non-nucleolar) Pch2 intensity per spread nucleus for immunofluorescence depicted in C, treated with DMSO or rapamycin, for either orc2–FRB or orc5-FRB. n = 35. Error bars are SD from the mean; P-value is indicated (i.e., nonsignificant), Mann–Whitney U test. (E, F) Quantification of nucleolar Pch2 intensity per spread nucleus for immunofluorescence depicted in (C), treated with DMSO or rapamycin, for either orc2–FRB or orc5-FRB (E and F, respectively). n = 35. Error bars are SD from the mean; P-value is indicated (i.e., nonsignificant), Mann–Whitney U test.


Supplementary Materials
Table S1 Peptides detected in Pch2–ORC XL-MS.
Table S3 ChIP-qPCR analysis.
Supplemental Data 1.
Yeast strains.[LSA-2019-00630_Supplemental_Data_1.docx]


